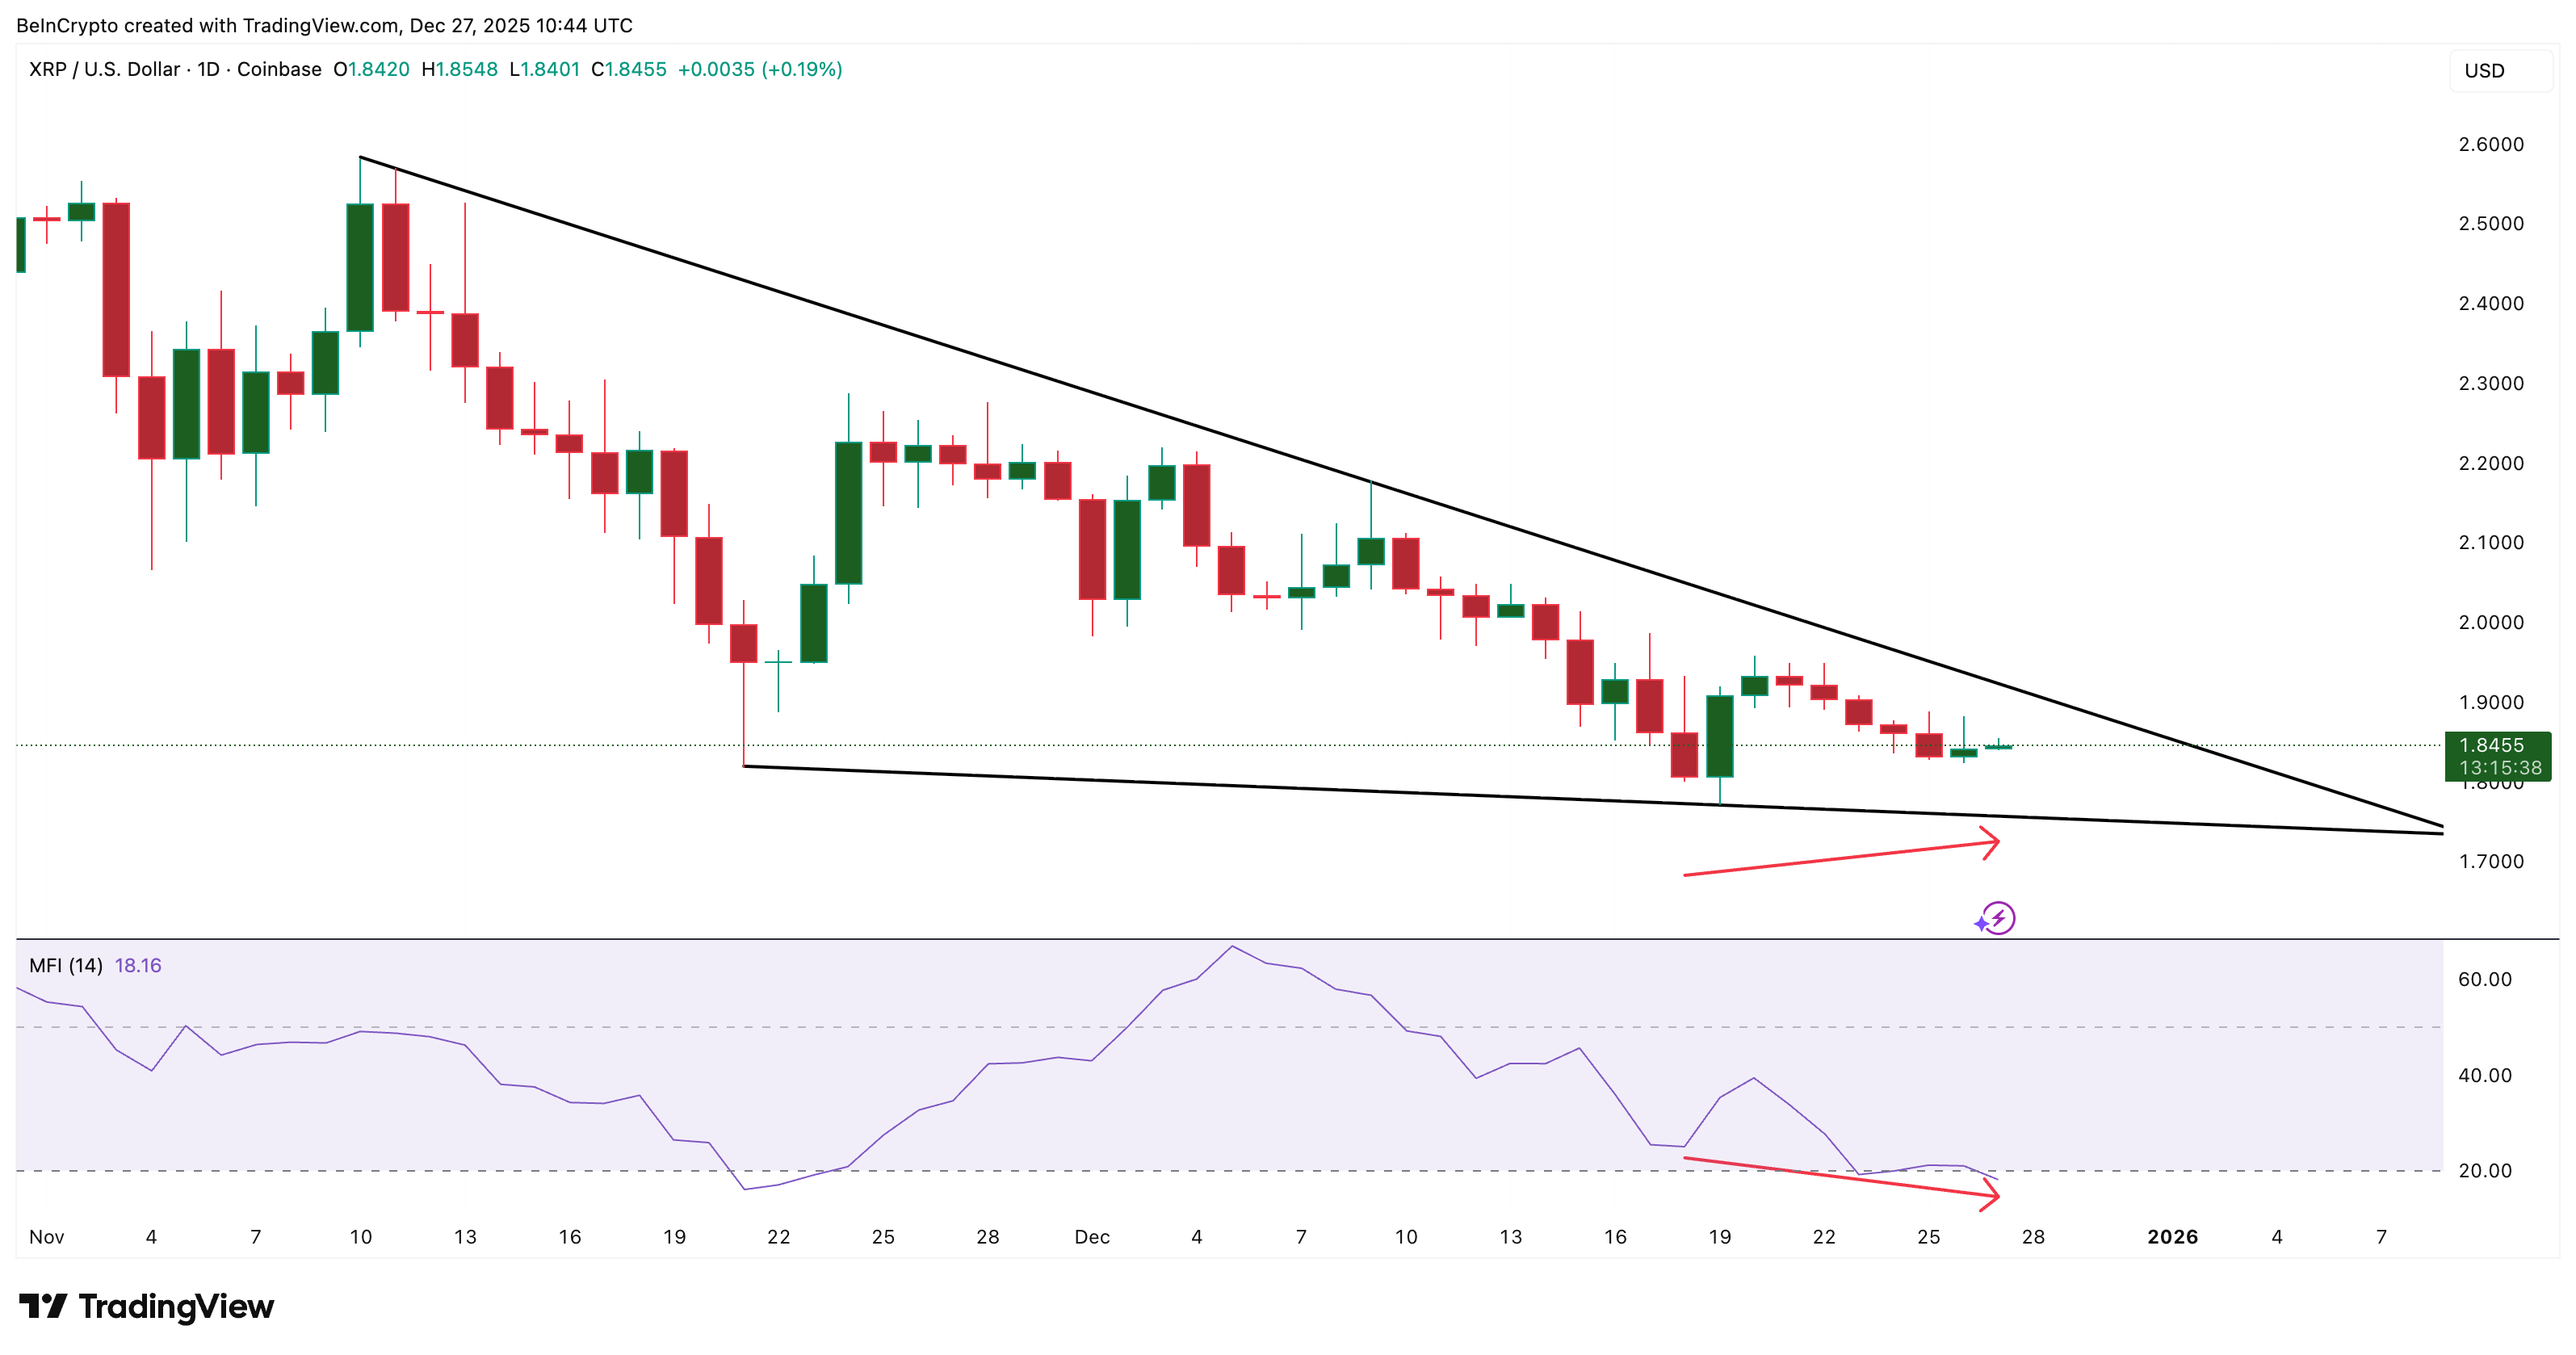
XRP turun sekitar 1,6% dalam 24 jam terakhir. Pada grafik mingguan, XRP masih menjadi salah satu pergerak large-cap yang lemah, sekarang sekitar 16% lebih rendah dibanding level bulan lalu. Sebagian besar pergerakan harga terjadi di dekat dasar pola descending triangle, sebuah pola yang sering menandakan kelanjutan arah harga.
Ini belum mengonfirmasi terjadinya breakdown, tapi ada tiga sinyal pasar yang mulai muncul dan seharusnya membuat para trader lebih waspada menjelang akhir 2025.
Investor Ritel dan Holder Jangka Panjang Bergerak ke Arah yang Sama
XRP masih terjebak di dalam pola descending triangle, bergerak sideways di dekat garis tren bawah. Harga sempat naik dari 18 Desember sampai 27 Desember, namun Money Flow Index (MFI) justru bergerak turun pada periode yang sama.
MFI melacak uang yang masuk atau keluar dari sebuah aset. Ketika MFI semakin rendah saat harga naik, itu menandakan investor ritel menjual di setiap kenaikan harga, bukan mengakumulasi.
Tekanan seperti ini membuat harga XRP tetap berada di batas bawah pola ini, bukannya mencoba ke garis atas.
Ingin insight token lain seperti ini? Daftar ke Newsletter Crypto Harian Editor Harsh Notariya di sini.
Kekhawatiran bertambah saat kita melihat ke holder jangka panjang.
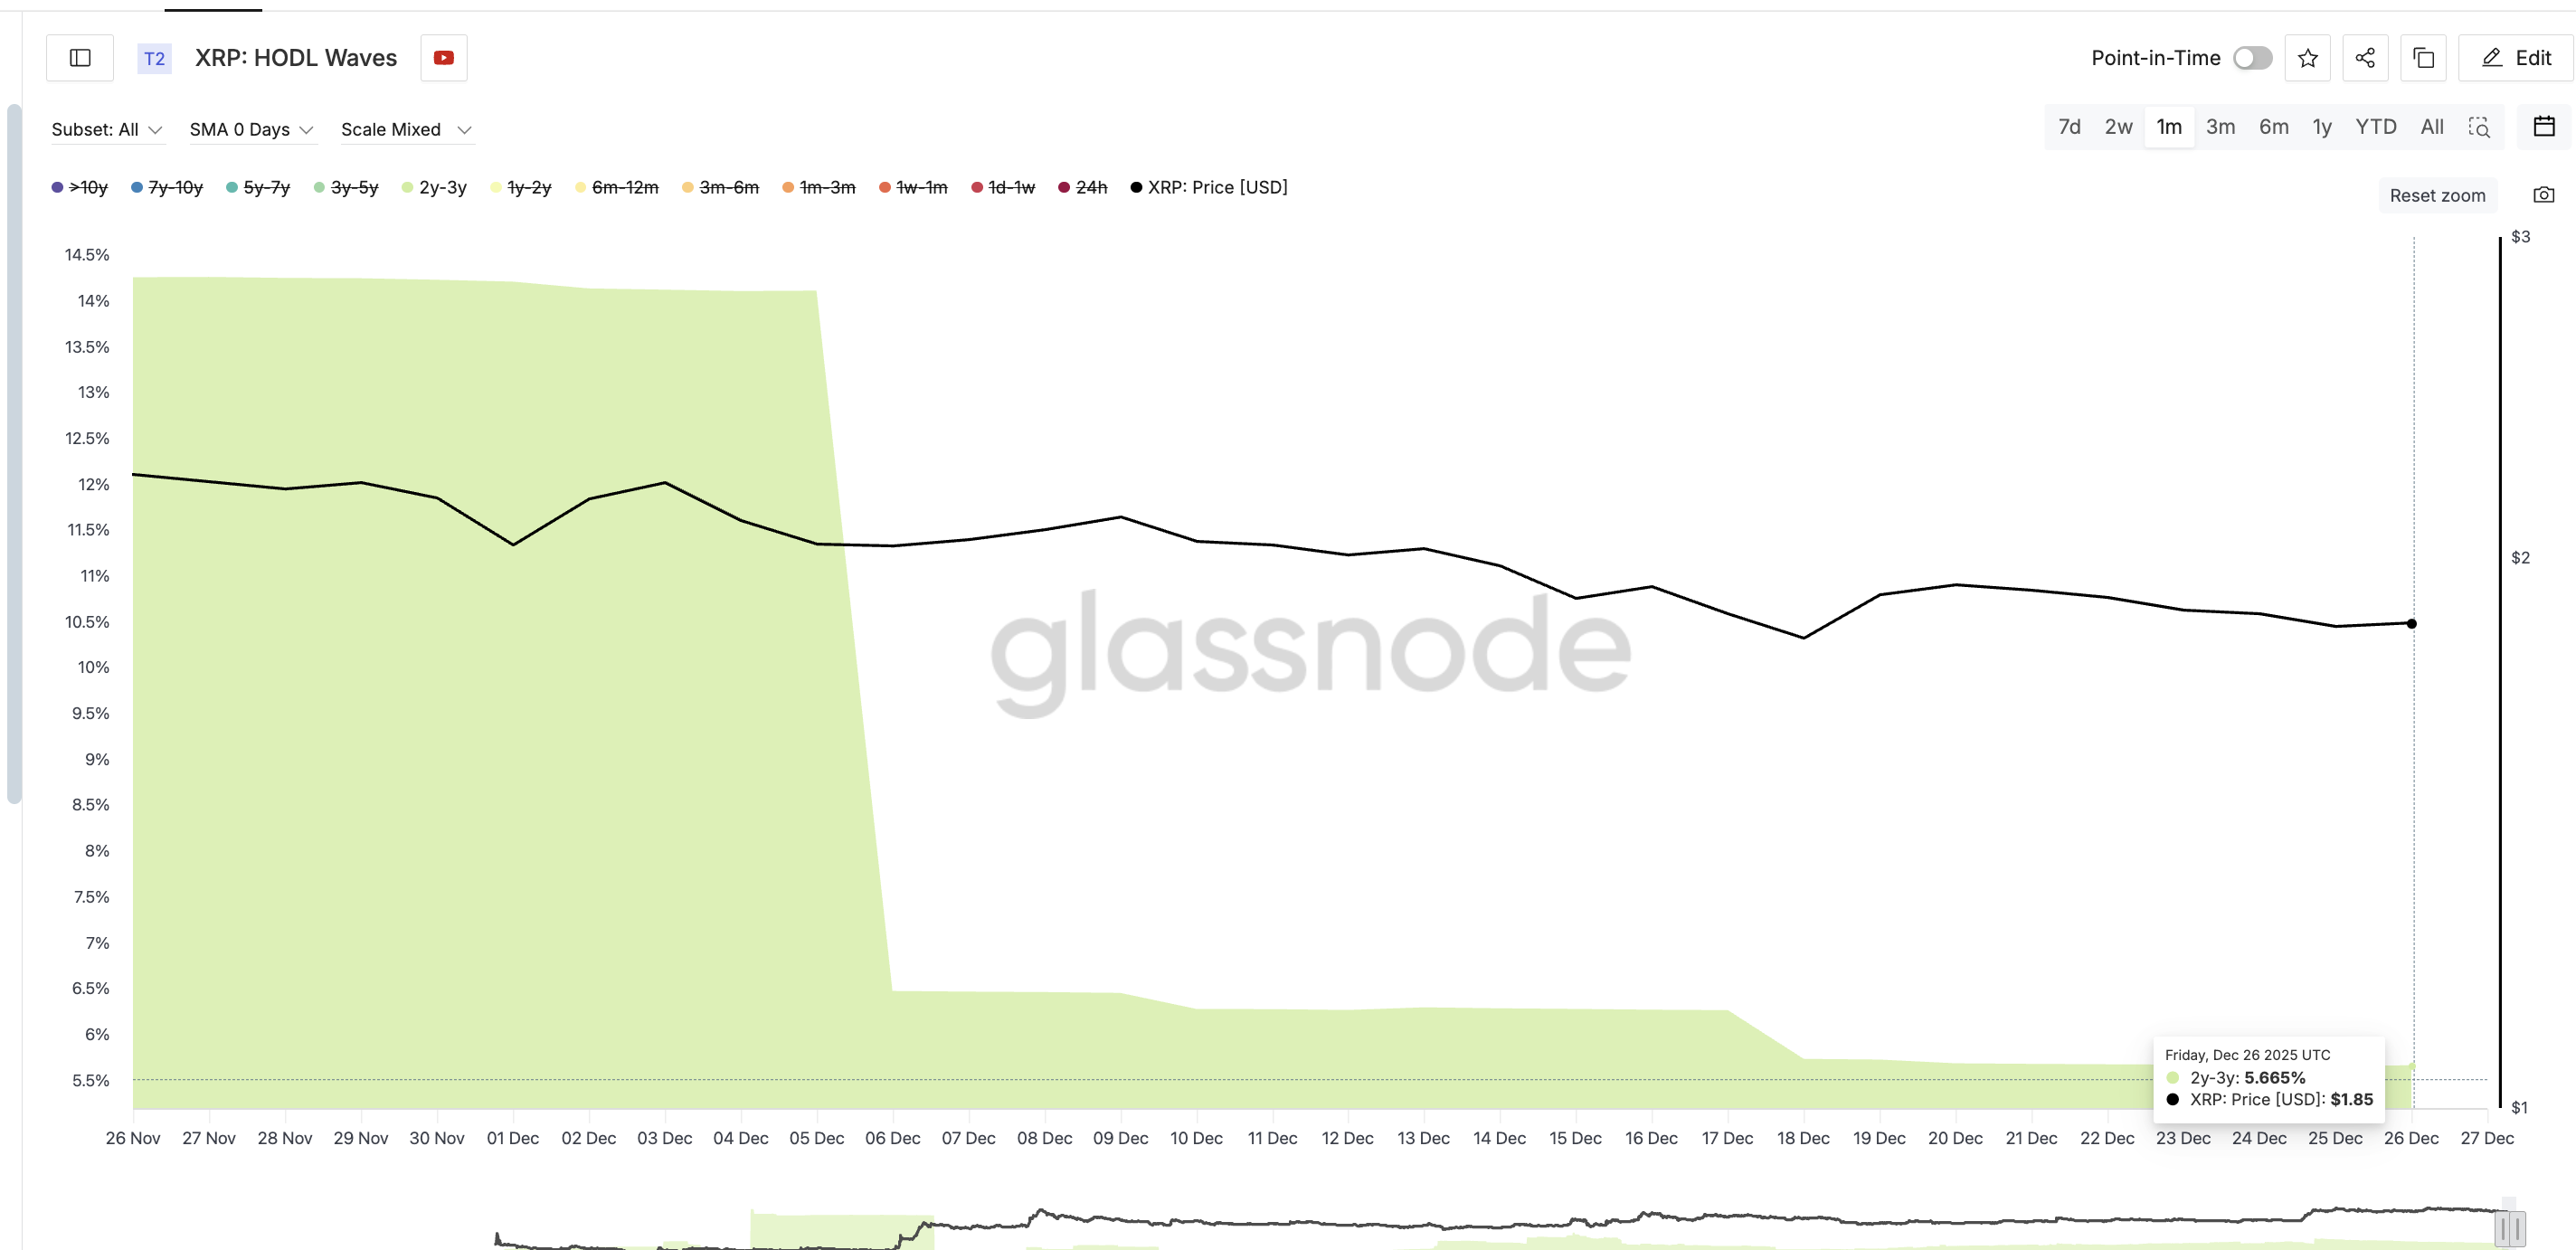
Berdasarkan data HODL Waves, yang memperlihatkan berapa banyak supply yang dipegang berdasarkan usia wallet, wallet yang menyimpan XRP selama 2–3 tahun turun dari 14,26% supply pada 26 November jadi sekitar 5,66% pada 26 Desember.
Mereka ini adalah holder yang punya keyakinan kuat jangka panjang, dan aksi jual mereka menghilangkan salah satu penopang pasar. Kelemahan ritel itu wajar, kelemahan jangka panjang di saat yang sama justru tidak wajar.
Sekarang, perilaku holder jangka pendek dan panjang sama-sama condong dalam satu arah: keluar dari XRP.
Arus Modal Menunjukkan Permintaan Mulai Menurun
Jika keyakinan ritel dan jangka panjang mulai melemah, langkah berikutnya adalah memantau arus modal, tanda utama ketiga.
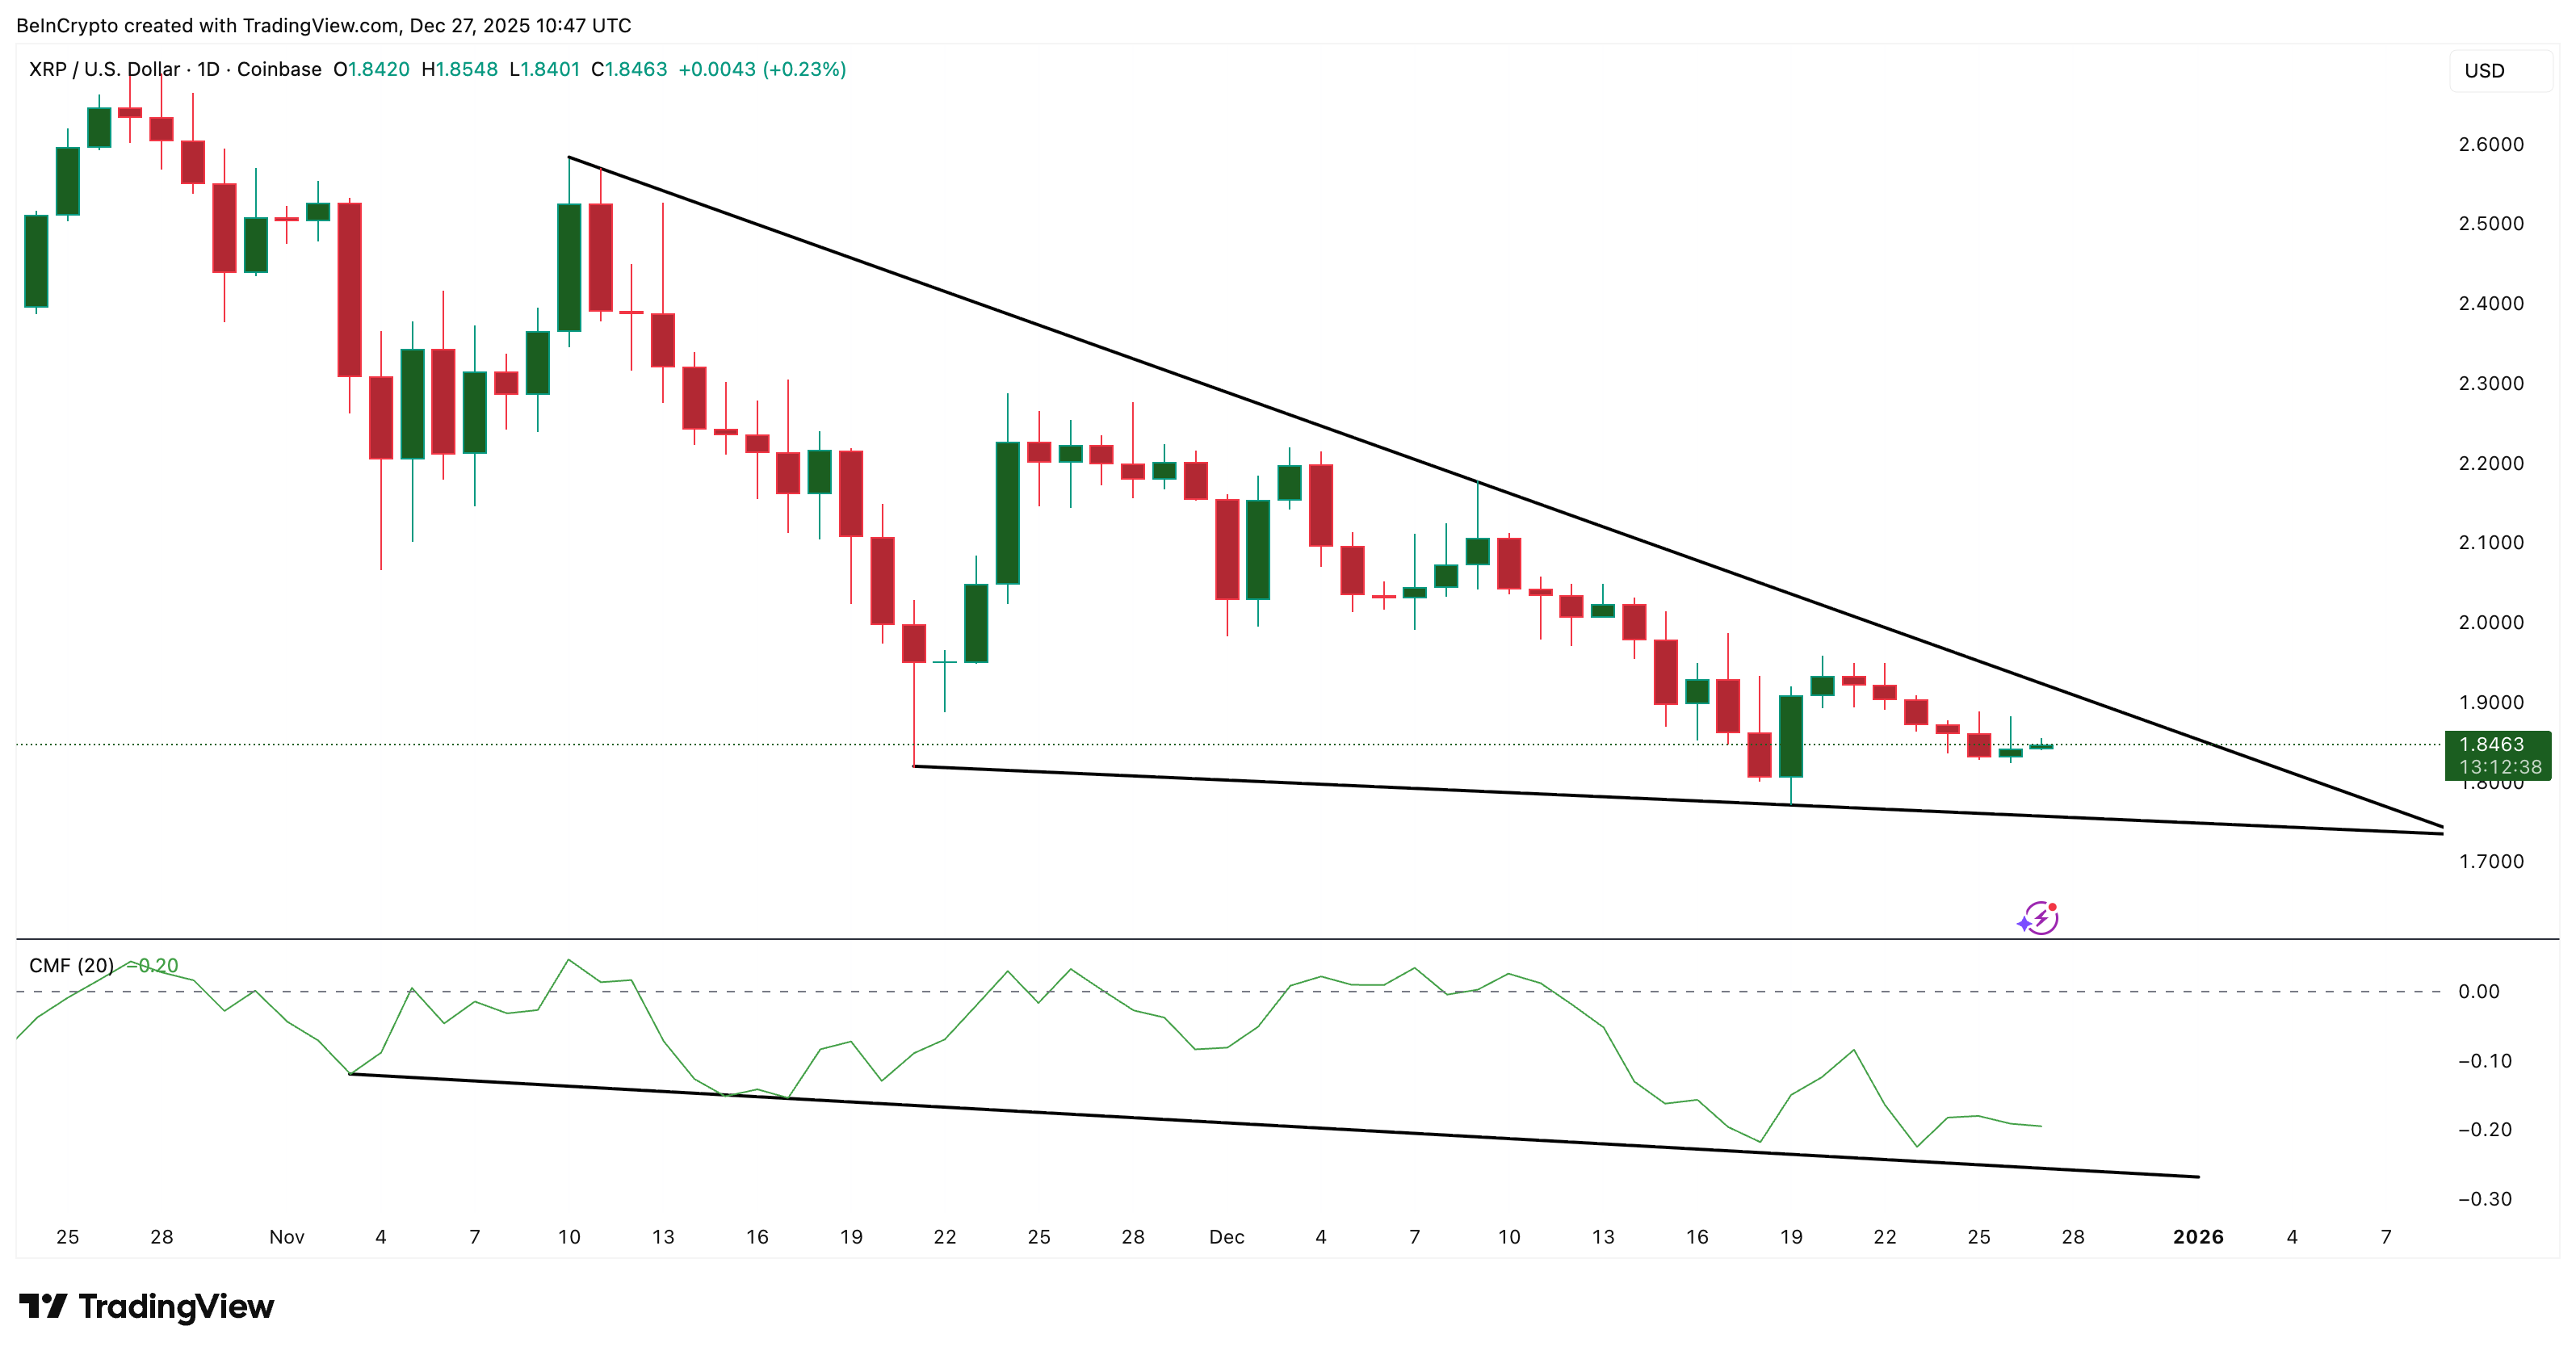
Chaikin Money Flow (CMF) juga belum menunjukkan adanya perbaikan. CMF mengukur tekanan beli dan jual berdasarkan volume dan pergerakan harga. Indikator arus modal besar tetap negatif untuk XRP dan bergerak turun mengikuti garis support menurun.
Secara sederhana, walau harga bergerak datar, modal besar yang masuk ke aset ini mulai menipis, sementara pasar semakin condong ke arah supply yang mengalahkan demand. Dengan belum adanya kenaikan di CMF, pasar pun kehilangan salah satu bantalan pengaman lain.
Inilah alasan harga XRP tetap mendatar, bukan bangkit kembali.
Level Harga XRP Tentukan Apakah Breakout Benar-benar Terjadi
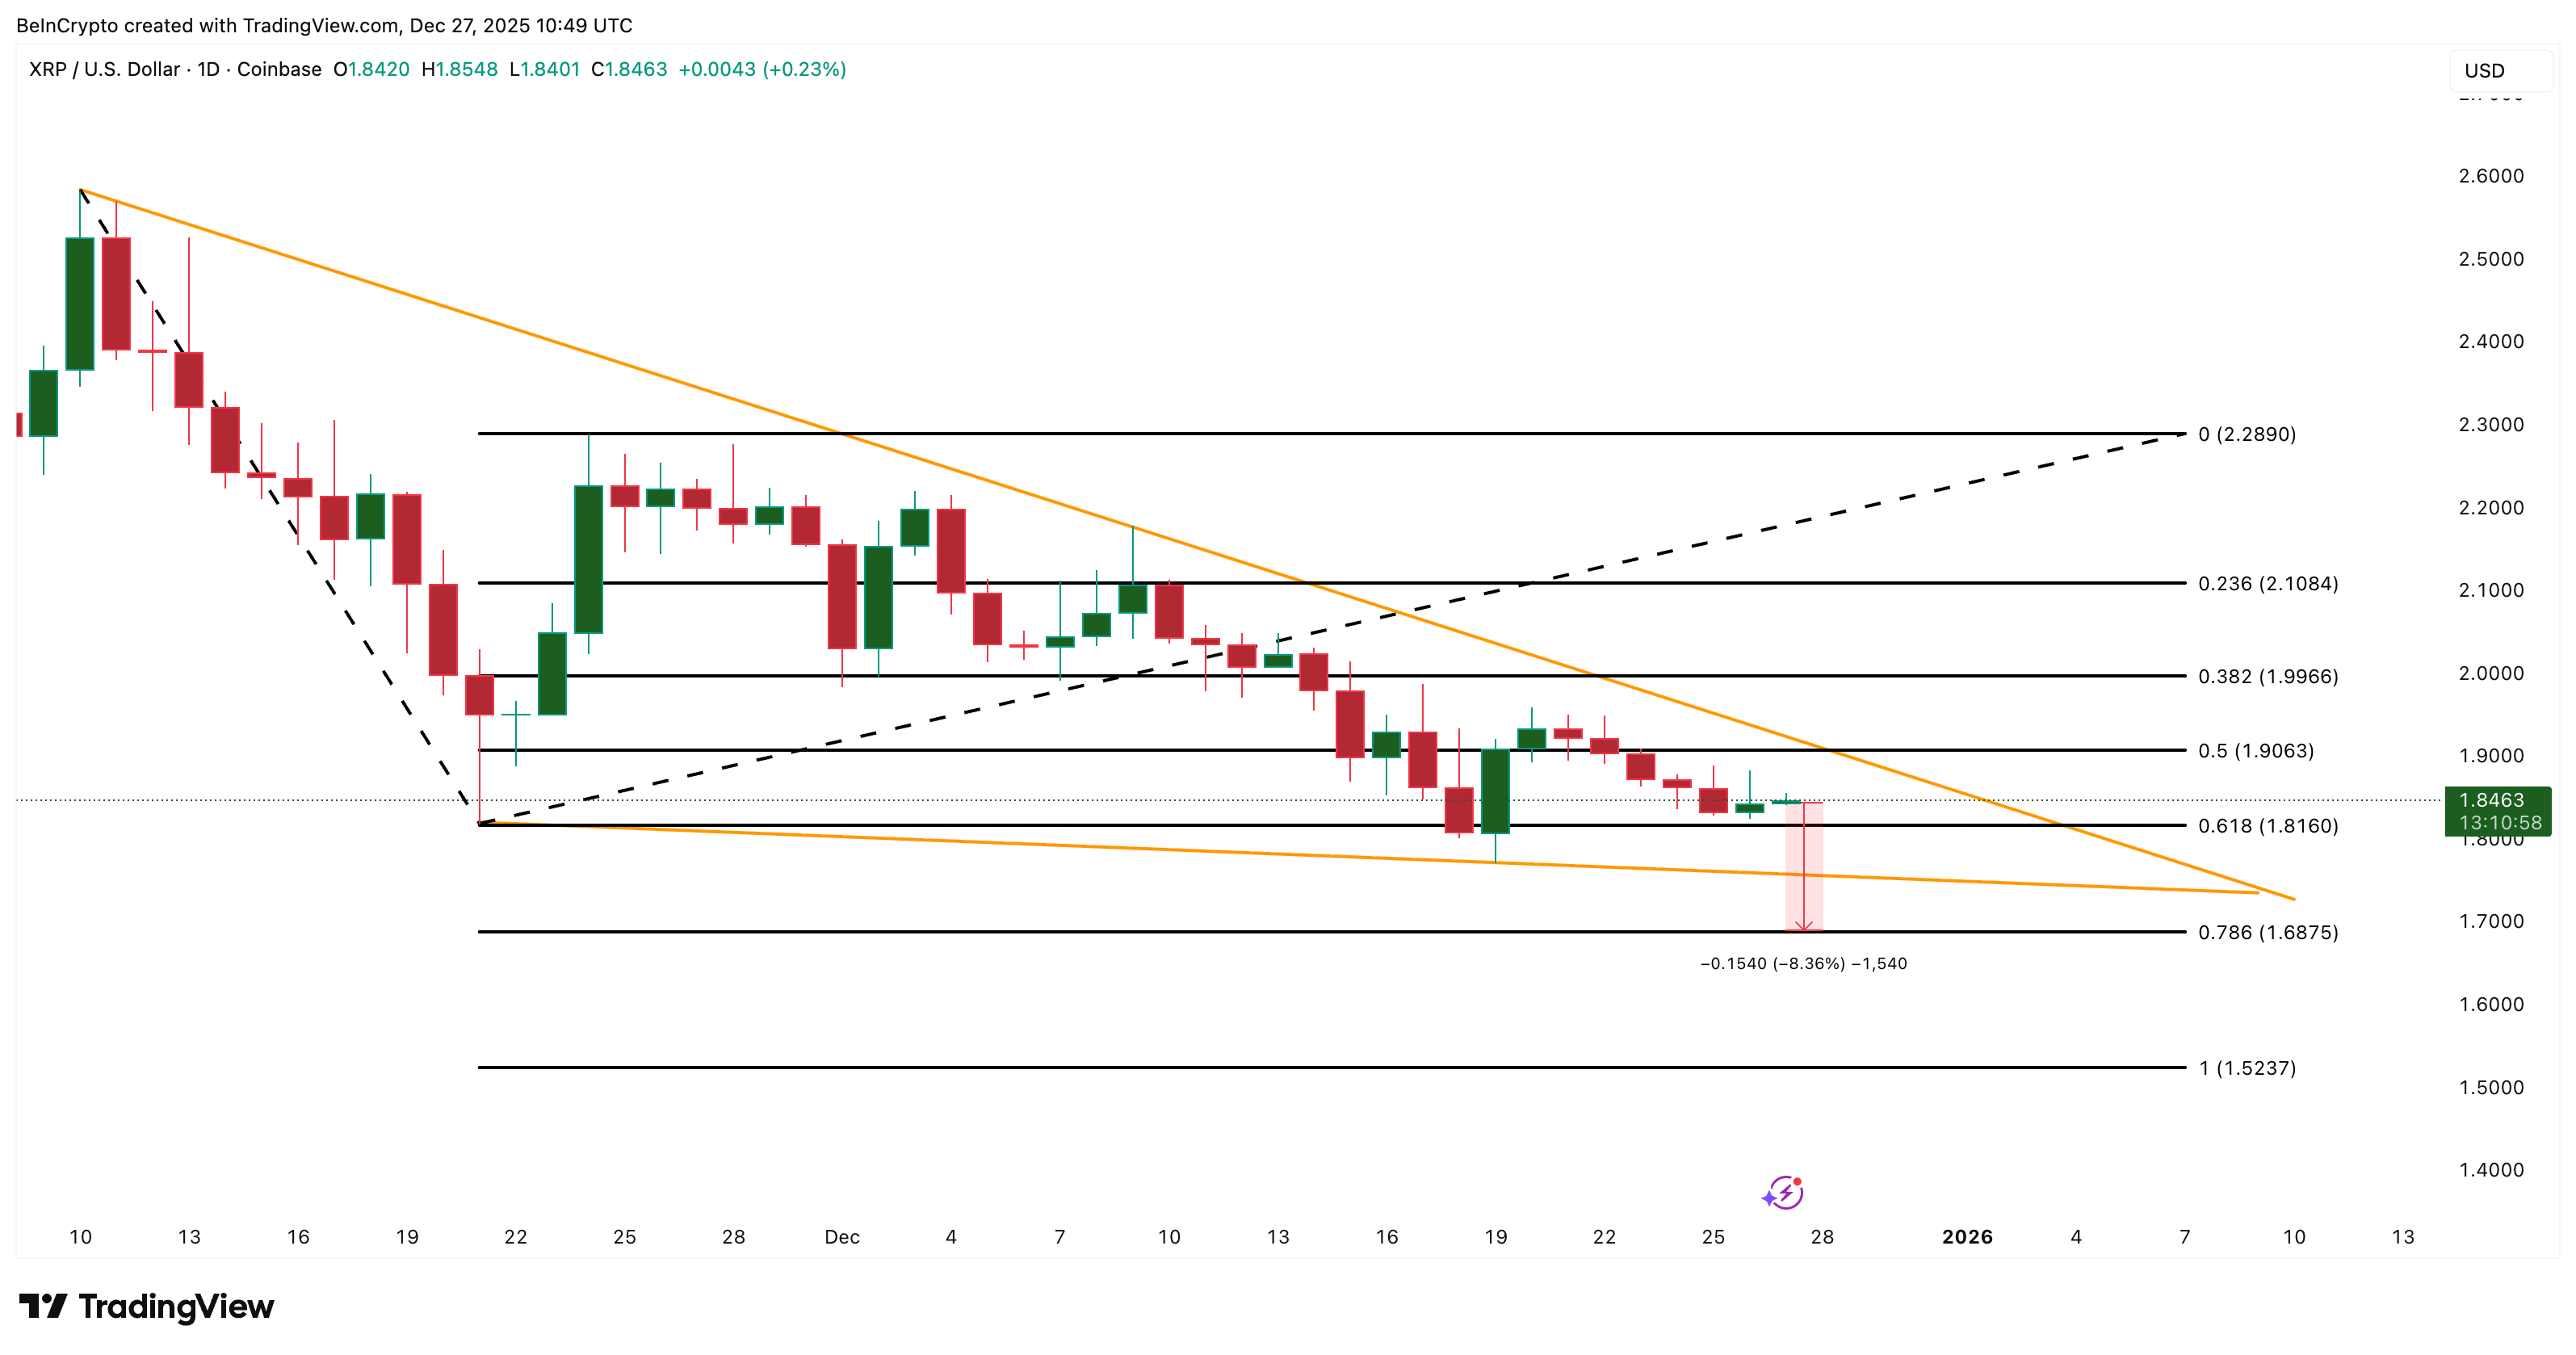
Untuk saat ini, XRP berada di antara US$1,90 dan US$1,81. XRP kehilangan level US$1,90 pada 22 Desember dan belum berhasil naik lagi ke atas level itu. Untuk melihat tanda kekuatan, XRP harus dapat merebut US$1,90 dan selanjutnya menargetkan US$1,99.
Hal ini juga akan menandai pergerakan harga ke atas batas atas triangle dan memberi peluang bagi bull untuk bergerak.
Namun, saat ini skenario bearish terlihat lebih jelas dibandingkan bullish.
Jika US$1,81 jebol, XRP bisa saja turun keluar dari pola descending triangle, yang berarti breakdown telah terkonfirmasi. Jika itu terjadi bisa membuka peluang ke US$1,68, titik di mana polanya benar-benar gagal, dan bahkan bisa ke US$1,52 jika tekanan jual semakin kencang.
Hal ini belum pasti, tapi pasar belum menunjukkan sinyal berlawanan. Selama penjualan ritel, distribusi jangka panjang, dan arus masuk modal yang melemah masih sejalan, harga XRP harus berjuang untuk tetap bertahan di kisaran ini.
XRP is down about 1.6% over the past 24 hours. On the weekly chart, it remains one of the weaker large-cap movers, sitting roughly 16% lower than last month’s levels. Most of the price action is happening near the bottom of a descending triangle pattern, a structure that often leads to continuation moves.
This does not confirm a breakdown yet, but three market signals are lining up in a way that should make traders cautious heading into the final days of 2025.
Retail And Long-Term Holders Are Moving The Same Way
XRP is still stuck inside a descending triangle, trading flat near the lower trendline. Price trended higher between December 18 and December 27, but the Money Flow Index (MFI) moved the opposite way during that same period.
MFI tracks money entering or exiting the asset. A lower low in MFI while price rises suggests retail is selling into every bounce instead of accumulating.
That pressure keeps the XRP price pinned at the lower boundary of the pattern instead of testing the upper line.
Want more token insights like this? Sign up for Editor Harsh Notariya’s Daily Crypto Newsletter here.
The concern grows when we zoom out to long-term holders.
According to HODL Waves, which visualizes how much supply is held by each age group, wallets holding XRP for 2–3 years dropped from 14.26% of supply on November 26 to about 5.66% on December 26.
These are long-term conviction holders, and their selling removes a layer of market support. Retail weakness is normal. Long-term weakness at the same time is not.
This creates a setup where both short-term and long-term behavior are leaning in the same direction: out of XRP.
Capital Flow Shows Fading Demand
If retail and long-term conviction are weakening, the next check is capital flow, the third key sign.
The Chaikin Money Flow (CMF) is not providing relief either. CMF tracks buying and selling pressure based on volume and price movement. The large money flow indicator remains negative for XRP and is sliding along a descending support trendline.
In simpler terms, even if the price is flat, big capital entering the asset is thinning out, and the market is leaning toward supply overpowering demand. With no pickup yet in CMF, the market loses another potential safety net.
This is why the XRP price has remained flat rather than rebounding.
XRP Price Levels Decide If The Breakdown Actually Happens
For now, XRP is trapped between $1.90 and $1.81. It lost the $1.90 level on December 22 and hasn’t reclaimed it since. Reclaiming $1.90 and then pushing for $1.99 would be the first sign of strength.
That would also mark a move above the triangle’s upper boundary and give bulls something to work with.
However, the bearish case is clearer than the bullish one at present.
If $1.81 breaks, XRP may fall out of the descending triangle pattern, which would constitute a confirmed breakdown. That loss could open room toward $1.68, where the structure fully fails, and even $1.52 if selling accelerates.
This isn’t a given yet, but the market has not shown a counter-signal yet. As long as retail selling, long-term distribution, and weakening capital inflow remain aligned, the XRP price must fight to hold the range.
Charles Hoskinson sedang mempromosikan usaha terbarunya, Midnight Protocol, sebagai sesuatu yang lebih dari sekadar sidechain untuk Cardano.
Pendiri Cardano tersebut memposisikan platform berfokus privasi ini sebagai lapisan infrastruktur bersama yang bisa memperluas privasi terprogram ke jaringan blockchain pesaing, termasuk Bitcoin dan XRP Ledger.
Hoskinson Bergerak Lebih Jauh dari Cardano dengan Inisiatif Privasi Lintas Chain
Pada 27 Desember, melalui sebuah postingan di X, Hoskinson menjelaskan bahwa arsitektur zero-knowledge proof dari Midnight bisa meningkatkan kemampuan ekosistem pesaing, bukan menggantikannya.
Ia menyampaikan bahwa integrasi Midnight dengan XRP Ledger akan memungkinkan jaringan tersebut menantang sistem perbankan tradisional dengan menghadirkan decentralized finance privat dan patuh regulasi. Ia juga menambahkan bahwa Midnight membawa fitur privasi terprogram yang belum ada di Bitcoin saat ini.
Hoskinson pun menggambarkan Midnight sebagai katalis untuk Cardano sendiri. Ia menyebutkan bahwa protokol ini dapat membantu meningkatkan jumlah pengguna aktif bulanan dan total value locked Cardano, karena memperluas kegunaan ekosistem ini di luar chain aslinya.
“Midnight makes what it touches better. Adding Midnight to XRP DeFi is going to blow the legacy banks out of the water. Adding Midnight to Bitcoin gives the world Satoshi imagined possible. Adding Midnight to Cardano supercharges our DeFi ecosystem and will 10x the MAUs, Transactions, and TVL as we are first to market with private DeFi at scale,” klaimnya.
Selain interoperabilitas, Hoskinson juga menyoroti besarnya peluang tokenisasi aset dunia nyata. Ia menjelaskan pasar Real-World Assets yang diperkirakan bernilai US$10 triliun akan sangat diuntungkan dengan desain privasi yang dihadirkan Midnight.
Dalam konteks itu, ia mengkritik perusahaan keuangan tradisional yang masih saja bermitra dengan Canton Network, sebuah blockchain permissioned, dengan menyatakan bahwa solusi separuh-separuh tidak cukup untuk kebutuhan adopsi institusional.
“There are no half measures or half technologies. You need an end-to-end strategy, great partners, and great communities,” terang Hoskinson .
Strategi ini menjadi perubahan arah bagi Hoskinson, yang sebelumnya selalu fokus membangun di ekosistem Cardano saja.
Dengan mempromosikan Midnight sebagai lapisan privasi yang bisa meningkatkan blockchain layer-1 lainnya, Hoskinson berusaha menjangkau likuiditas dan basis pengguna di luar jaringan Cardano yang sudah ada.
Perubahan strategi ini juga bertepatan dengan meningkatnya minat spekulatif pada native token Midnight, yaitu NIGHT.
Data dari CoinGecko menunjukkan bahwa aset ini baru-baru ini melampaui Bitcoin dan Ethereum dalam volume pencarian di daftar tren platform tersebut.
namun, token ini diperdagangkan dengan volatilitas tinggi sejak diluncurkan awal bulan ini. Berdasarkan data BeInCrypto, harga token ini turun lebih dari 80% menjadi US$0,08 pada saat artikel ini diterbitkan.
Charles Hoskinson is pitching his latest venture, Midnight Protocol, as more than a sidechain for Cardano.
Instead, the Cardano founder is positioning the privacy-focused platform as a shared infrastructure layer that could extend programmable privacy to rival blockchain networks, including Bitcoin and the XRP Ledger.
Hoskinson Moves Beyond Cardano With a Cross-Chain Privacy Play
In a December 27 post on X, Hoskinson argued that Midnight’s zero-knowledge proof architecture could enhance the capabilities of competing ecosystems rather than displace them.
He said that integrating Midnight with the XRP Ledger would allow the network to challenge legacy banking systems by enabling private, compliant decentralized finance. He extended the argument to Bitcoin, saying Midnight offers programmable privacy features that Bitcoin currently lacks.
Hoskinson also framed Midnight as a catalyst for Cardano itself. He suggested that the protocol could help lift Cardano’s monthly active users and total value locked by broadening the ecosystem’s utility beyond its native chain.
“Midnight makes what it touches better. Adding Midnight to XRP DeFi is going to blow the legacy banks out of the water. Adding Midnight to Bitcoin gives the world Satoshi imagined possible. Adding Midnight to Cardano supercharges our DeFi ecosystem and will 10x the MAUs, Transactions, and TVL as we are first to market with private DeFi at scale,” he claimed.
Beyond interoperability, Hoskinson pointed to the scale of the opportunity in real-world asset tokenization. He said the estimated $10 trillion market for Real-World Assets would benefit significantly from Midnight’s privacy-preserving design.
In that context, he criticized traditional finance firms for continuing to partner with the Canton Network, a permissioned blockchain, arguing that partial solutions fall short of what institutional adoption requires.
“There are no half measures or half technologies. You need an end-to-end strategy, great partners, and great communities,” Hoskinson said.
This strategy marks a shift for Hoskinson, who has historically focused on building within the Cardano ecosystem.
By promoting Midnight as a privacy layer that enhances other Layer-1 blockchains, Hoskinson is seeking to access liquidity and user bases beyond Cardano’s existing network.
That pivot has coincided with growing speculative interest in Midnight’s native token, NIGHT.
Data from CoinGecko showed that the asset recently surpassed Bitcoin and Ethereum in search volume on the platform’s trending list.
However, the token has traded with high volatility since its launch earlier this month. According to BeInCrypto data, the token’s price has dropped by more than 80% to $0.08 as of press time.
Akhir tahun biasanya membuat banyak posisi dipangkas di pasar aset kripto. Wallet besar dan smart money sering mengurangi eksposur agar bisa mengamankan profit, menyimpan uang tunai, lalu menunggu sampai kondisi likuiditas rendah selesai. Itu hal yang biasa untuk bulan Desember. Walaupun begitu, beberapa aset justru malah memperlihatkan hal sebaliknya. Para crypto whale kembali menambah kepemilikan mereka di beberapa frame waktu sekaligus.
Satu aset mengalami akumulasi konsisten selama 30 hari, yang lain mendapatkan dukungan whale dalam 7 hari terakhir, dan aset ketiga baru saja mendapat arus masuk segar dalam 24 jam terakhir.
Chainlink (LINK)
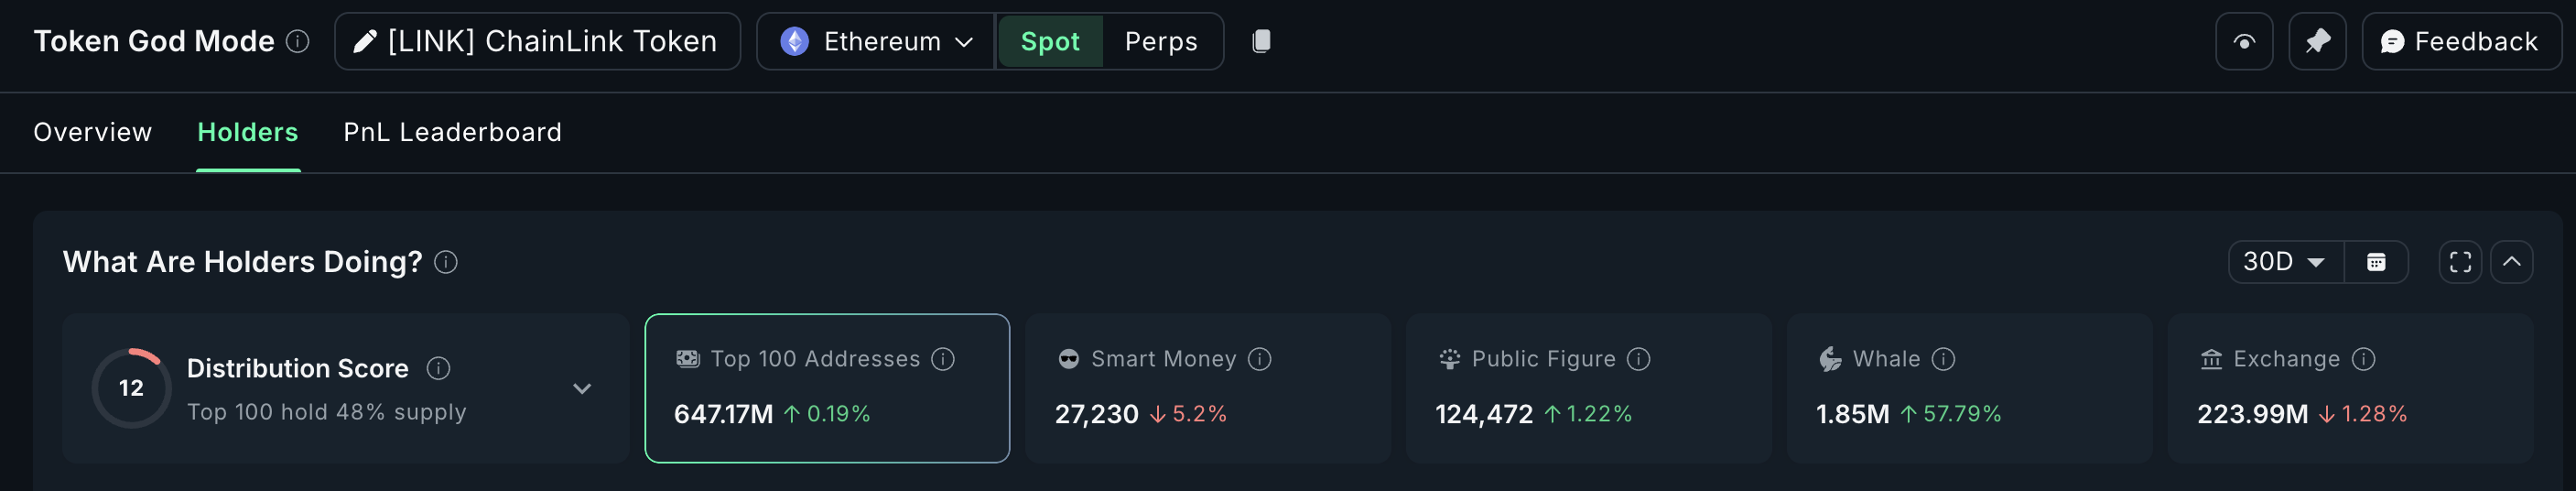
Token pertama dalam daftar yang dibeli oleh crypto whale adalah Chainlink. Wallet whale telah meningkatkan kepemilikan mereka sebesar 57,79% selama 30 hari terakhir. Artinya, whale menambah sekitar 680.000 LINK dalam periode tersebut.
Dengan harga LINK saat ini, jumlah tersebut hampir setara dengan akumulasi senilai US$8,5 juta.
Mau info token seperti ini? Daftar untuk Newsletter Kripto Harian Editor Harsh Notariya di sini.
Akumulasi ini terjadi saat harga Chainlink mengalami koreksi sekitar 7,5% pada periode yang sama. Wallet smart money justru mengurangi eksposur sebesar 5,2%, sehingga menunjukkan kalau para whale mulai mengambil posisi lebih awal, bukan mengincar pergerakan harga secara langsung.
This whale has further withdrawn 366,364 $LINK, worth $4.5M, from #Binance.
Now, the whale holds 695,783 $LINK, worth $8.52M, from #Binance in the past 2 days.
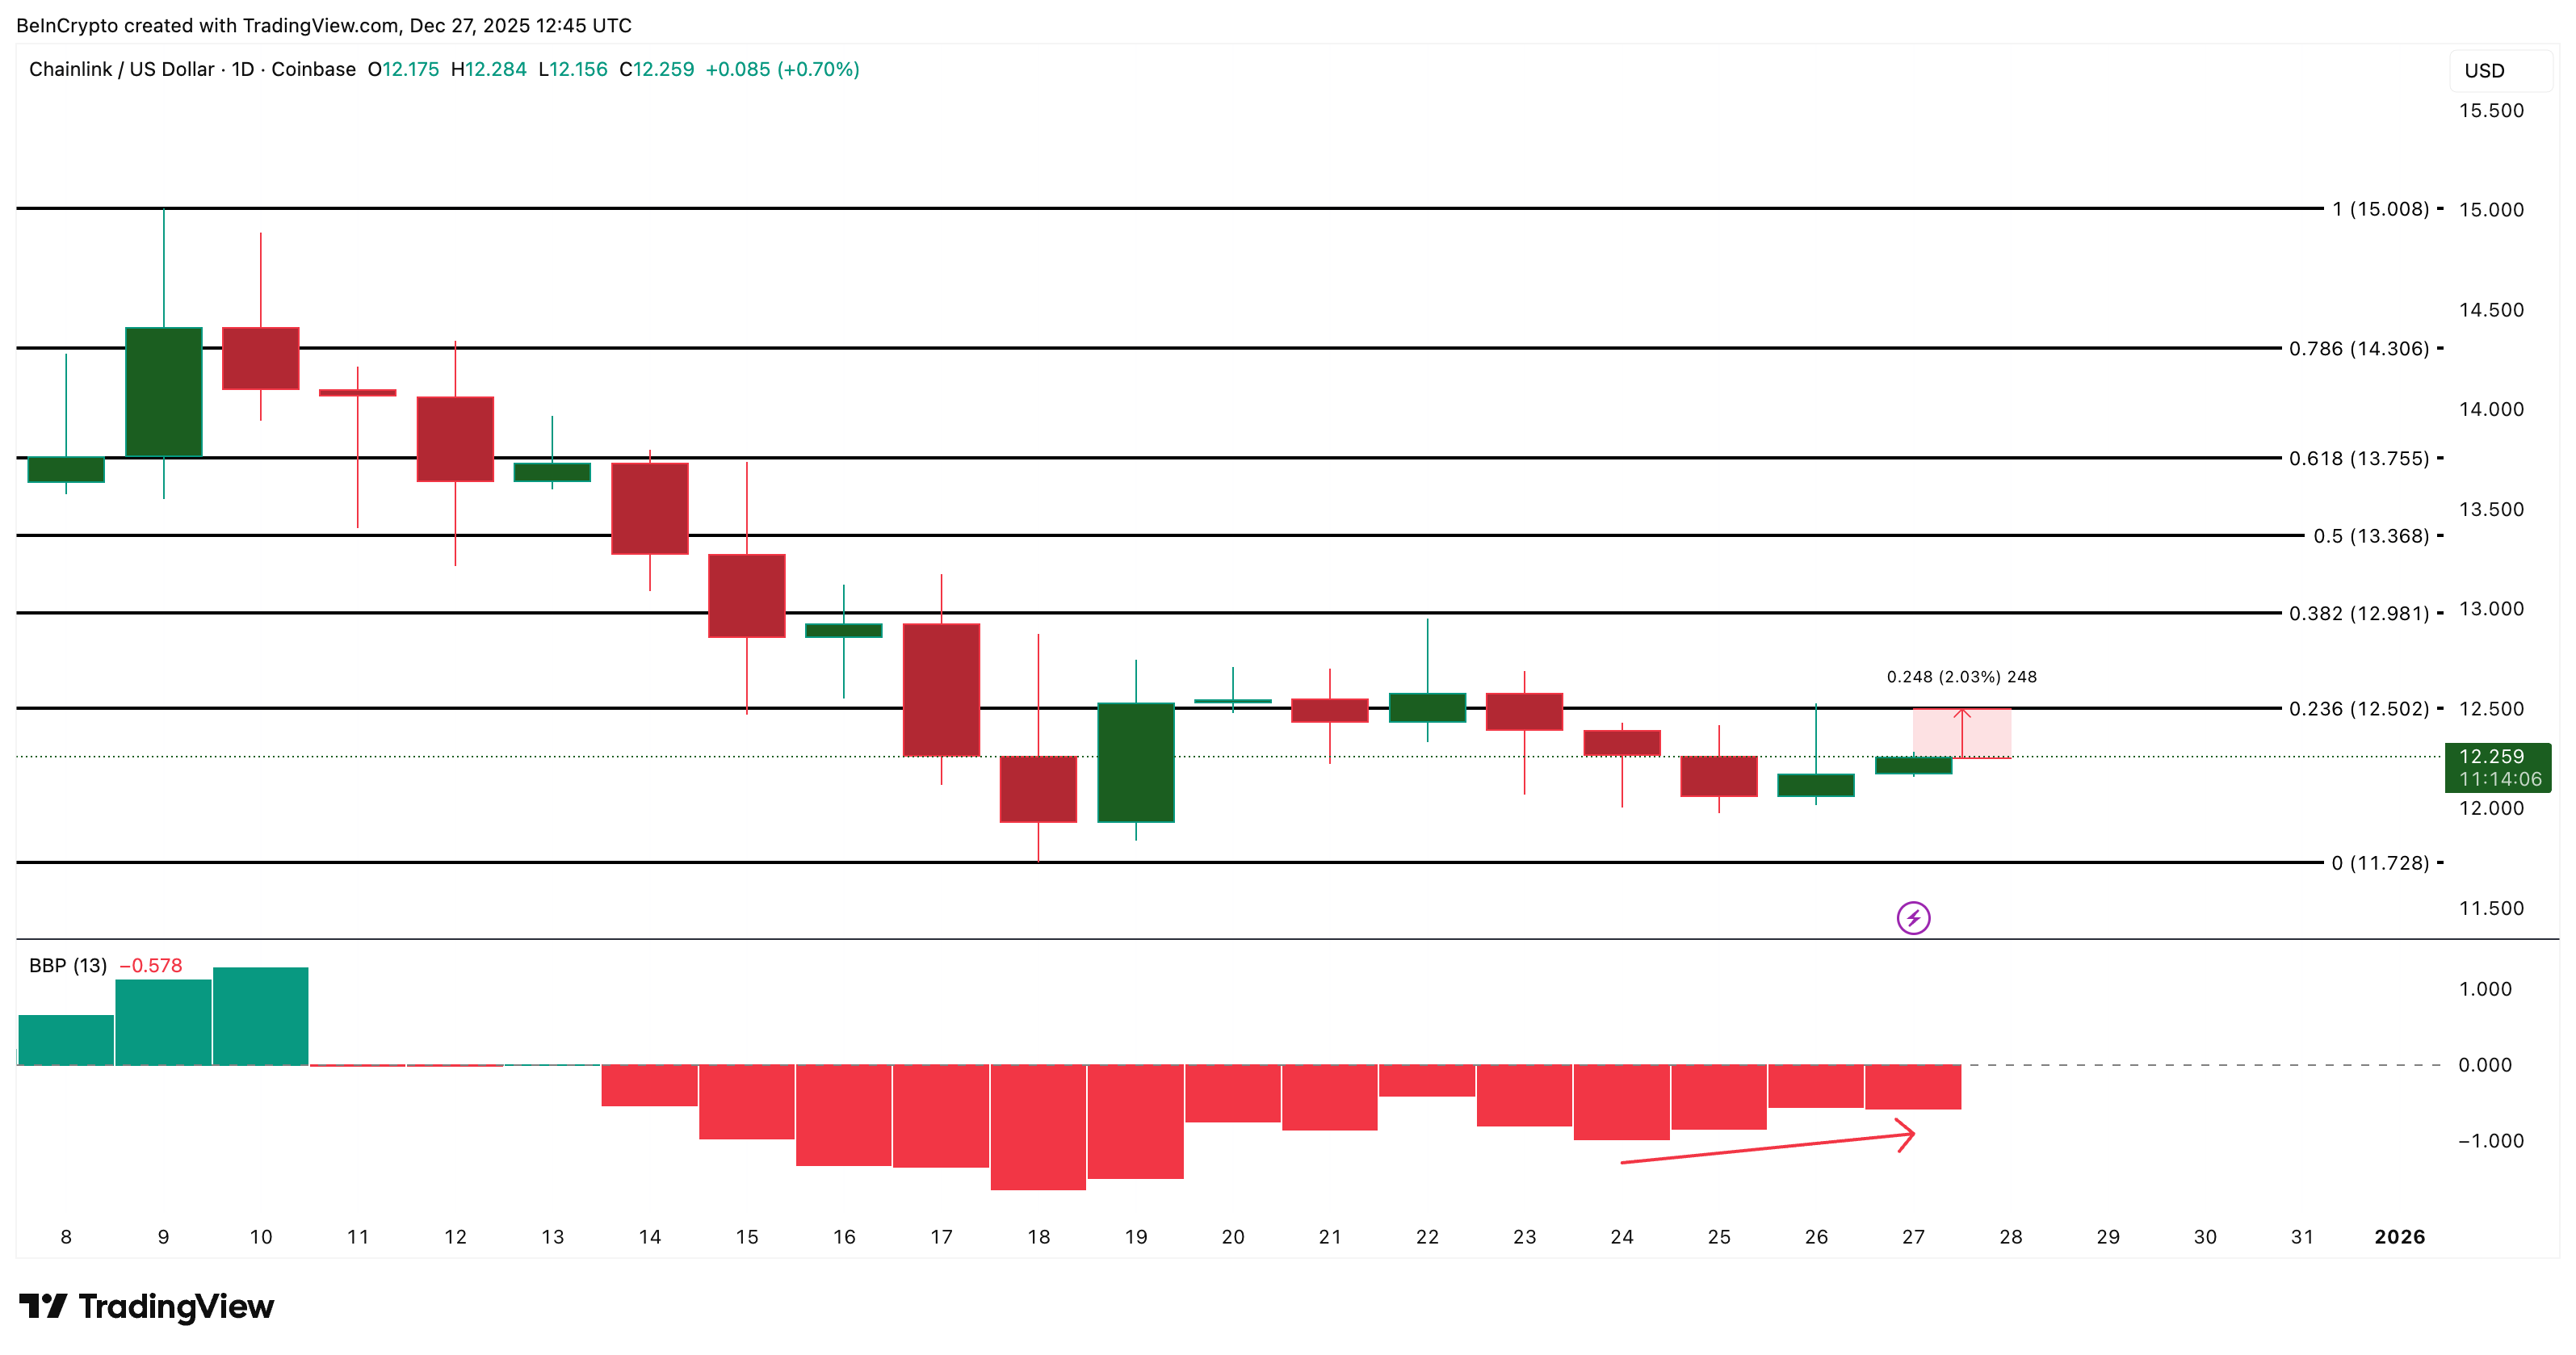
Pada grafik, indikator Bull Bear Power (BBP) menampilkan bar merah yang mulai mengecil sejak tanggal 24 Desember. BBP mengukur jarak antara harga dan moving average untuk mengetahui apakah bull atau bear yang menguasai momentum. Saat bar merah mengecil, tekanan bearish pun mulai mereda.
Pada saat yang sama, LINK sedang mencoba merebut kembali resistance jangka pendek di sekitar US$12,50. Jika penutupan harian berhasil di atas level itu, token ini bisa kembali masuk dalam pembahasan breakout jangka pendek. Di atas US$12,50, level penting selanjutnya berada di sekitar US$12,98 dan US$13,75. Jika bisa menembus US$15,00, LINK bisa kembali ke zona bullish yang jelas.
Smart money keluar saat whale masih terus menambah kepemilikan, sehingga mengindikasikan persiapan yang lebih lambat. Struktur saat ini memperlihatkan bahwa whale sedang akumulasi ketika harga melemah untuk pergerakan potensial pada awal 2026, bukan breakout dalam waktu dekat. Sampai harga menembus US$12,50, LINK kemungkinan masih bergerak sideways. Jika harga turun ke bawah US$11,72, hipotesis bullish para whale bisa batal untuk sementara waktu.
Lido DAO (LDO)
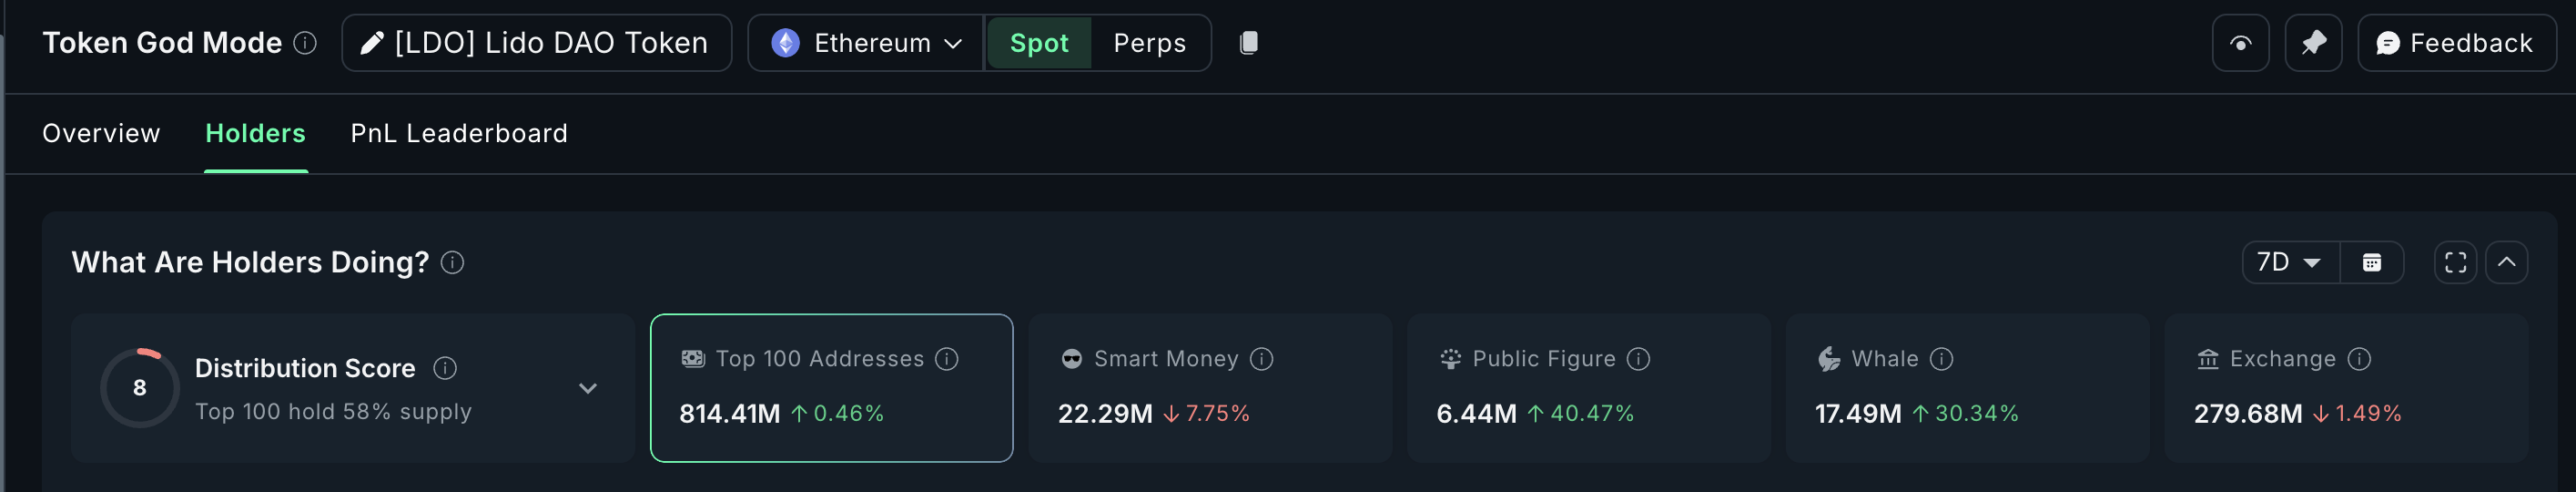
Crypto whale juga beralih ke Lido selama 7 hari terakhir. Saldo mereka naik 30,34%, sehingga total kepemilikan klaster ini menjadi 17,49 juta LDO. Dengan harga LDO saat ini, whale menambah sekitar 4,07 juta LDO, setara dengan US$2,28 juta dalam seminggu.
Ini terjadi ketika harga token naik 4,2% pada periode yang sama, sehingga memperlihatkan bahwa whale membeli saat harga menguat.
Tidak semua pembeli besar itu anonim. Salah satu peningkatan paling menonjol datang dari Arthur Hayes, yang mengakumulasi 1,85 juta LDO senilai sekitar US$1,03 juta. Hal ini juga menjelaskan kenapa klaster “Public Figure” naik bersamaan dengan aktivitas whale.
Smart money, di sisi lain, menunjukkan sikap berlawanan. Saldo mereka turun 7,75%. Saldo exchange juga turun 1,49%, memberikan indikasi bahwa trader ritel mungkin lebih memilih menarik token dari exchange dibandingkan menjualnya. Perbedaan ini berarti hipotesis whale bisa membutuhkan waktu untuk terealisasi, sehingga kemungkinan besar baru bergerak di awal 2026, bukan dalam waktu dekat.
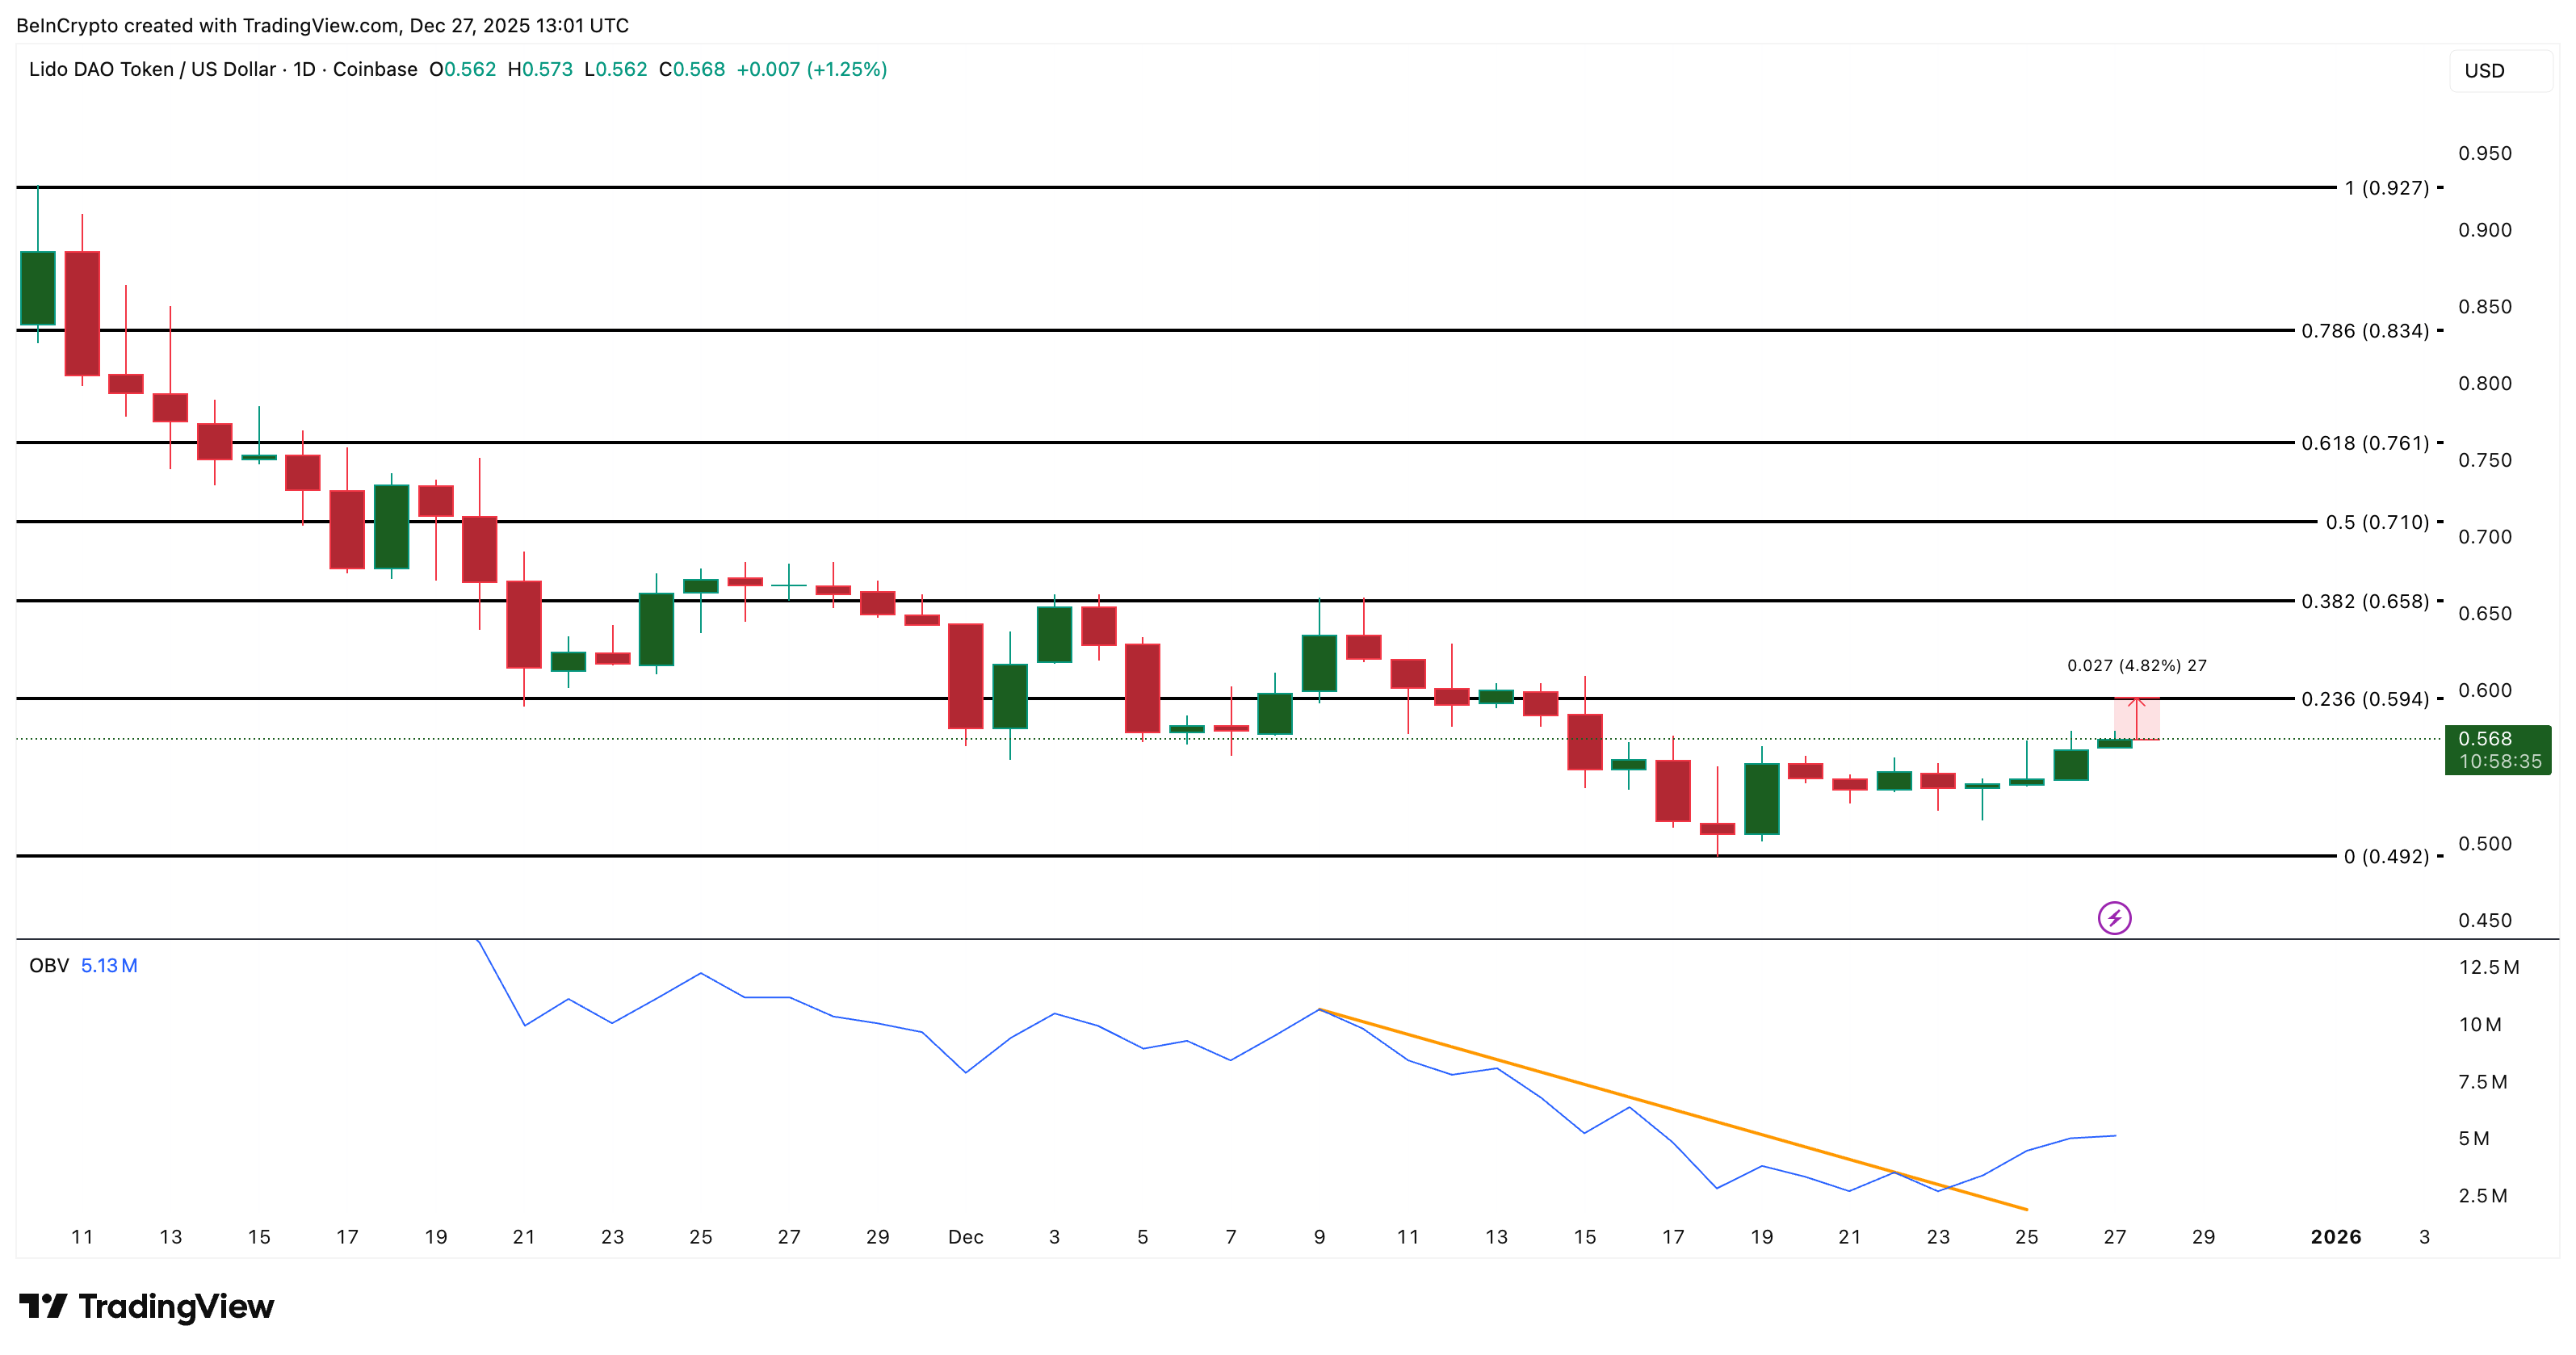
Pada grafik, Lido bergerak dalam range yang jelas antara US$0,59 dan US$0,49. Indikator On-Balance Volume (OBV), yang mengukur apakah volume mengalir masuk atau keluar, menembus tren turunnya pada 23 Desember.
Perubahan ini bersamaan dengan arus masuk whale yang mulai naik, jadi sinyal ini patut dipantau terus.
Penutupan harian di atas US$0,59 dibutuhkan untuk mengonfirmasi kekuatan baru. Level ini jebol pada 14 Desember dan belum pernah direbut kembali sejak itu. Jika pembeli bisa menembusnya dengan mantap, zona berikutnya yang perlu diperhatikan adalah US$0,76 (0,618 Fibonacci), lalu US$0,92, di mana momentum bisa berubah dari koreksi ke bullish.
Sampai saat itu, trading dalam rentang harga masih menjadi skenario utama. Jika harga turun di bawah US$0,49 maka pola harga LDO saat ini akan batal, apalagi jika smart money terus mengurangi eksposurnya di tengah volatilitas akhir tahun.
Aster (ASTER)
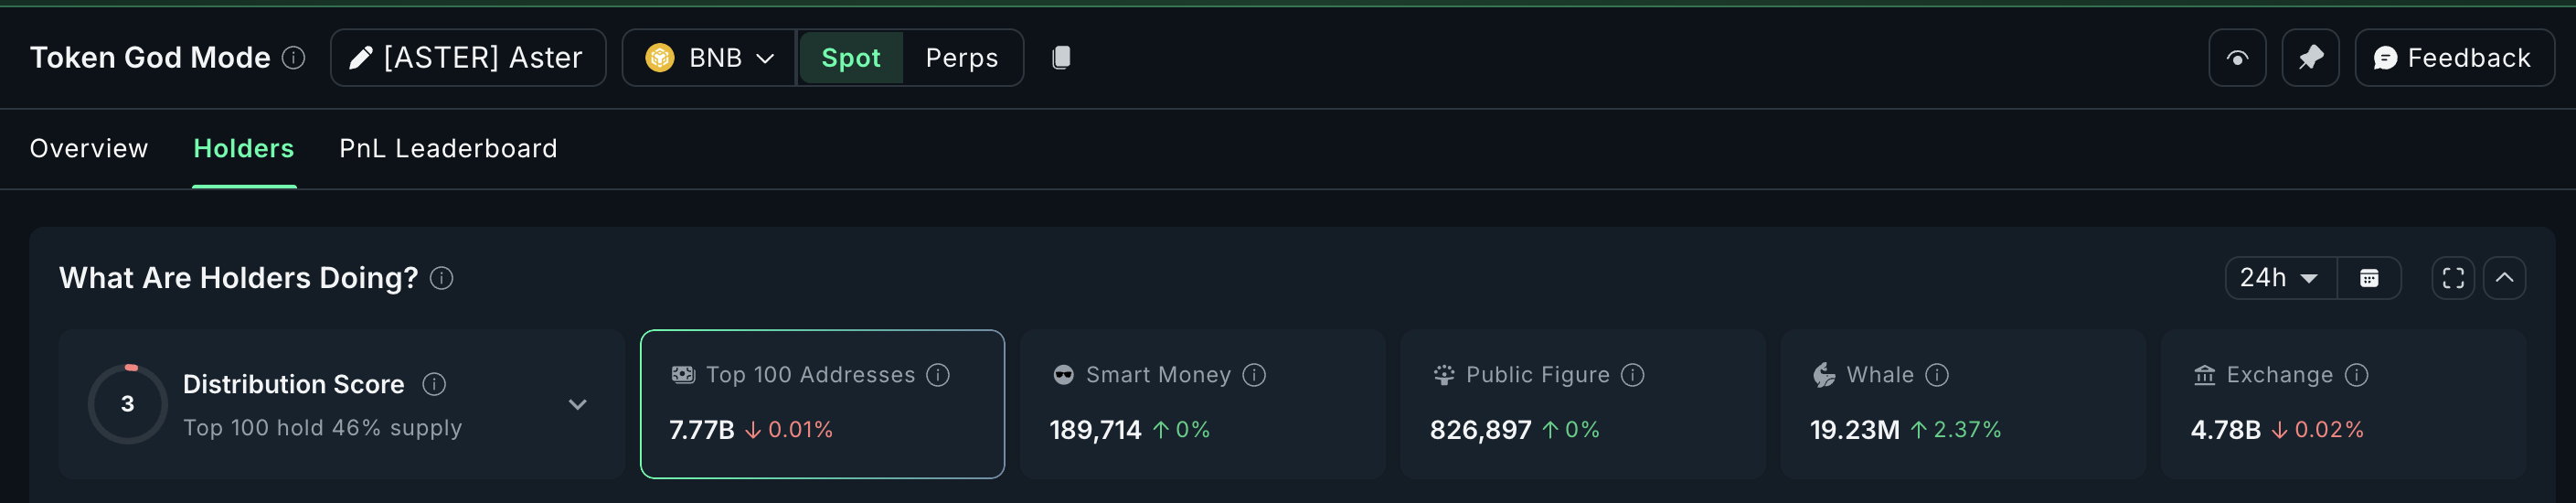
Token ketiga dalam daftar ini adalah Aster. Token ini justru menarik minat whale dalam 24 jam terakhir, bukan karena tren akumulasi yang panjang. Dalam sehari terakhir, whale menambah 2,37% ke jumlah kepemilikan ASTER yang mereka miliki.
Setelah kenaikan ini, total kepemilikan whale sekarang ada di sekitar 19,23 juta ASTER. Dengan harga sekitar US$0,71 maka whale telah menambah kurang lebih 455.000 ASTER, atau senilai lebih dari US$320.000.
Penambahan ini memang tidak terlalu besar. Hal ini menarik perhatian karena ASTER sempat turun lebih dari 30% dalam sebulan ini, dan aksi akumulasi ini mungkin menjadi sinyal bahwa sentimen mulai berubah dari tekanan jual besar menuju posisi yang lebih hati-hati.
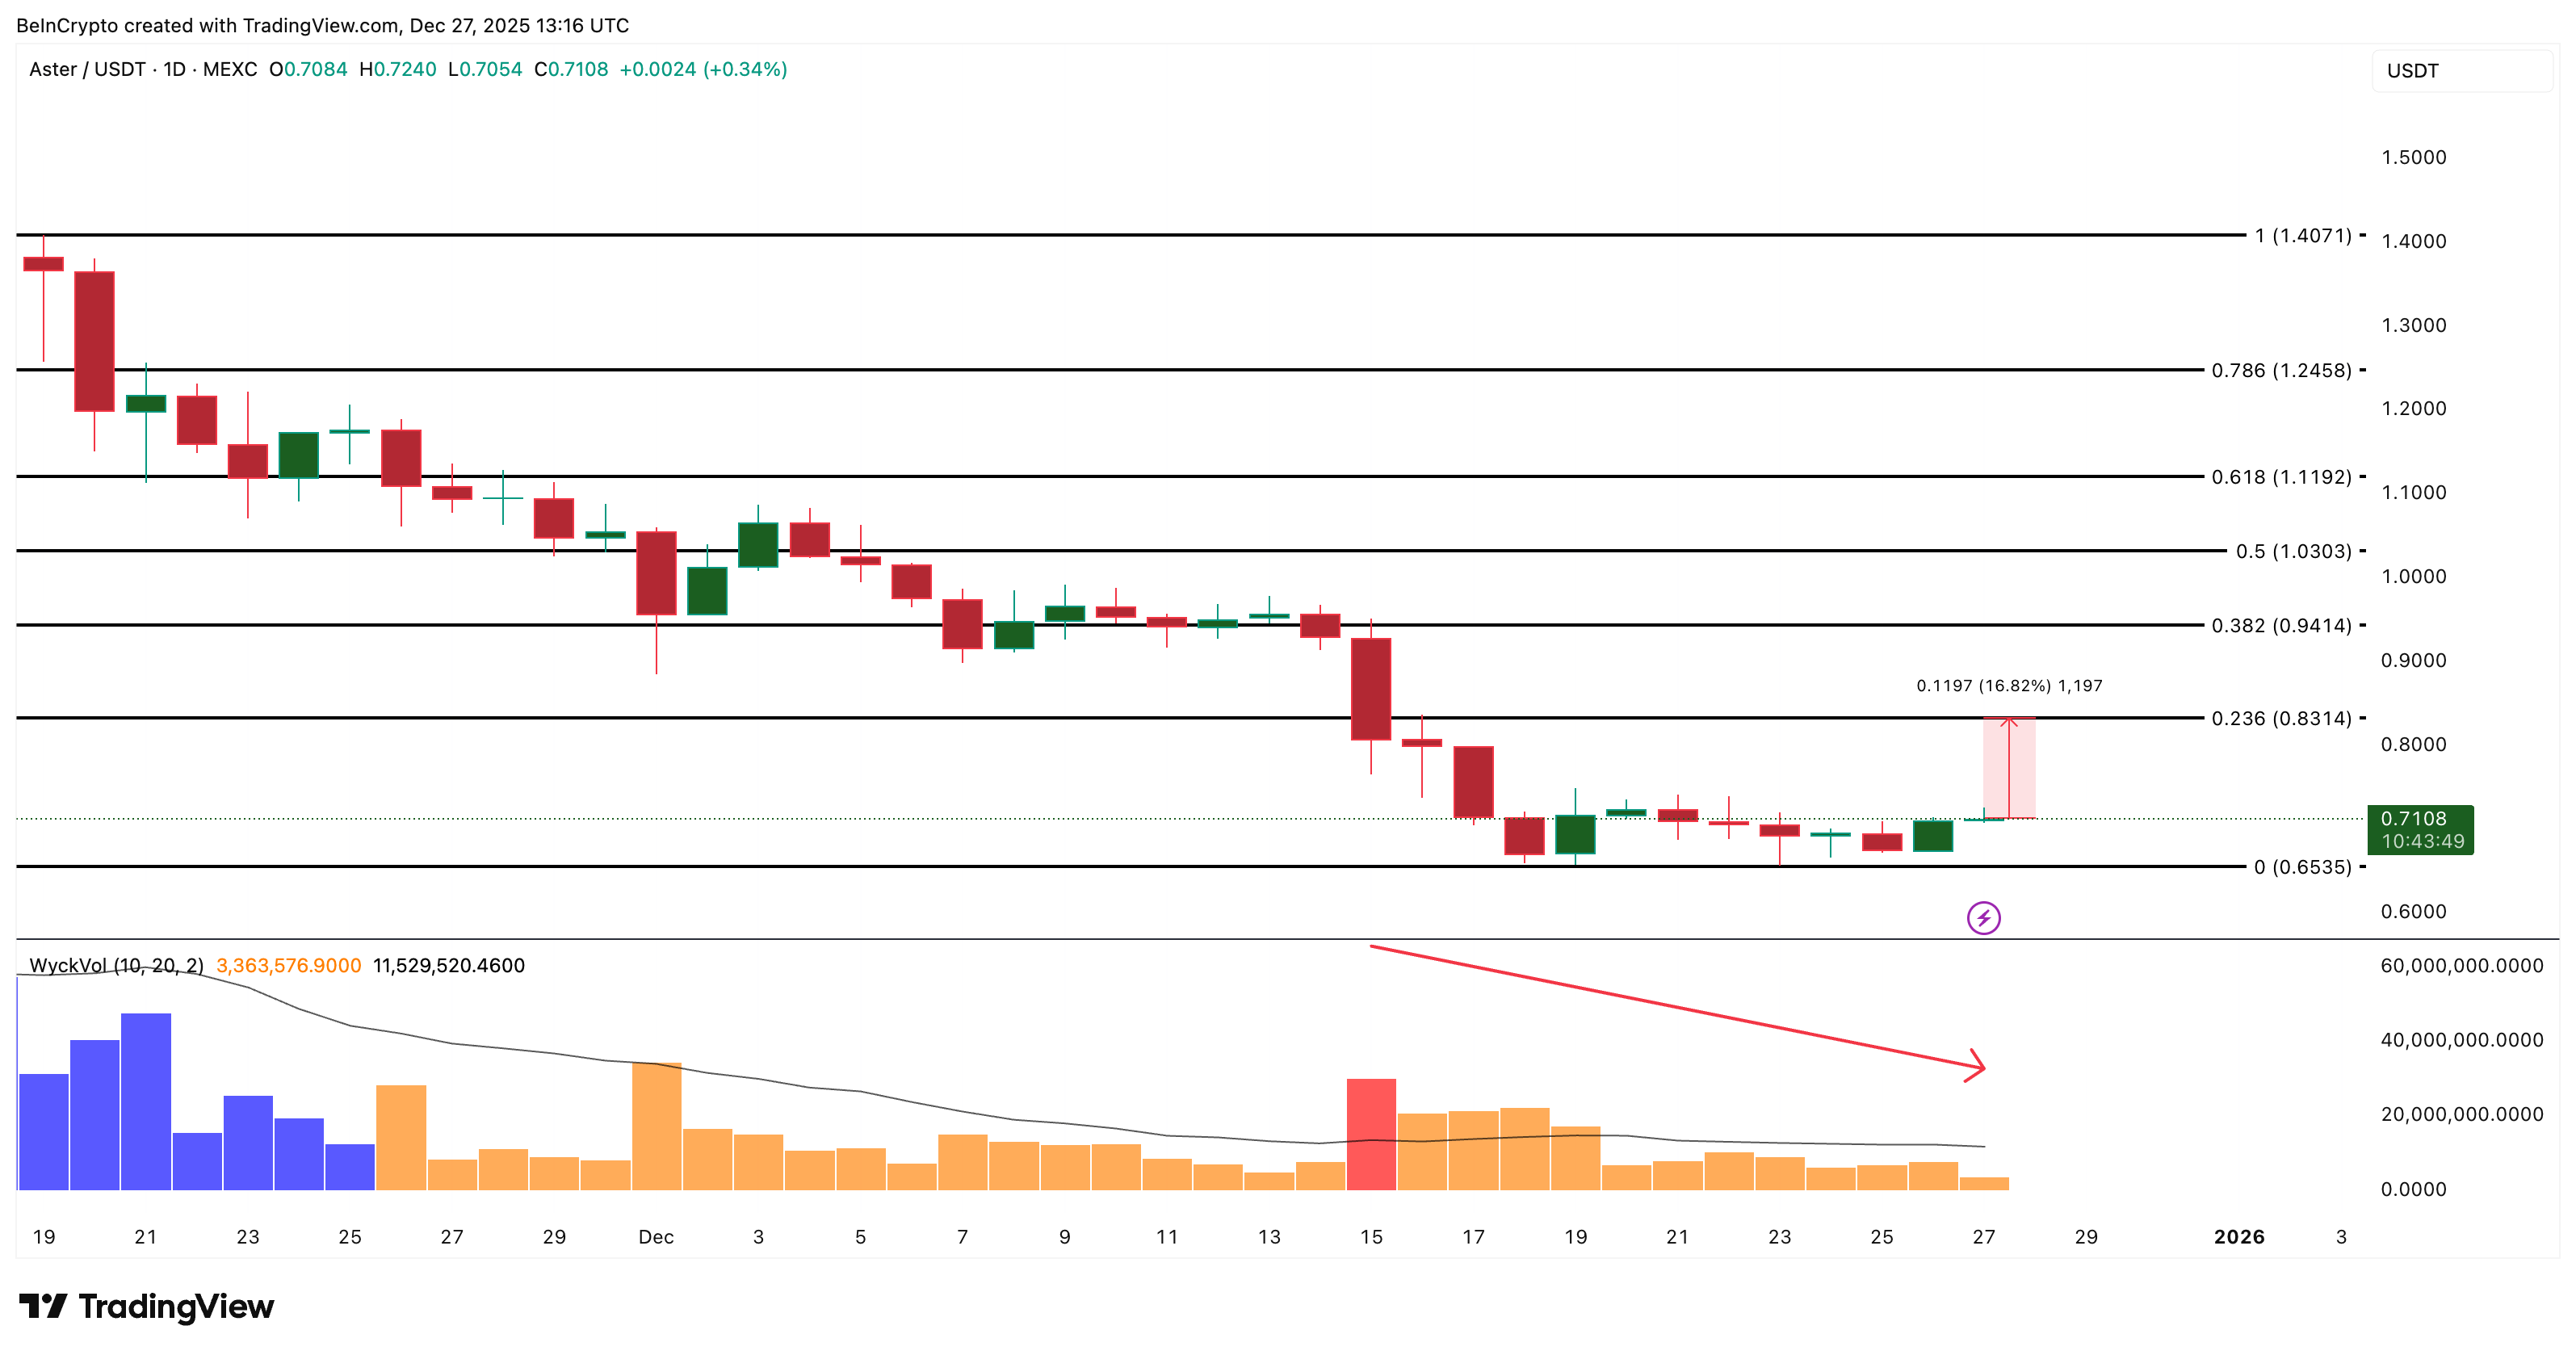
Pergerakan harga mendukung pandangan ini. ASTER turun tajam dari sekitar US$1,40 pada 19 November dan mendapat support di kisaran US$0,65, yang terus bertahan sepanjang Desember. Tekanan jual juga nampaknya mulai melemah. Pada indikator Wyckoff Volume, batang merah dan kuning (kontrol penjual) makin memudar sejak 15 Desember. Pergeseran ke batang merah/kuning yang lebih tipis ini menandakan dominasi penjual mulai turun.
Jika dugaan whale benar, upaya pemulihan dimulai dengan dorongan ke US$0,83 yang membutuhkan kenaikan sekitar 16% dari harga sekarang. Jika bisa melewati US$0,83, peluang ke US$1,03 terbuka lebar, lalu ke US$1,24 jika kondisi pasar makin membaik.
Jika harga turun di bawah US$0,65, maka skenario ini batal. Penurunan yang jelas di bawah level tersebut bisa membuat ASTER terancam turun ke level terendah baru, apalagi jika volatilitas akhir tahun meningkat.
Year-end usually brings position cuts across crypto. Big wallets and smart money often reduce exposure to secure profits, sit on cash, and wait for lower-liquidity conditions to finish. That’s normal for December. Even with that backdrop, a few assets are seeing the opposite. Crypto whales are adding again across multiple time frames.
One shows steady 30-day accumulation, another gets 7-day whale support, and a third just saw fresh 24-hour inflows.
Chainlink (LINK)
The first token on the list that crypto whales are buying is Chainlink. Whale wallets have raised their holdings by 57.79% over the last 30 days. This means whales added about 680,000 LINK in that period.
At the current LINK price, that is close to $8.5 million in accumulation.
Want more token insights like this? Sign up for Editor Harsh Notariya’s Daily Crypto Newsletter here.
This buildup occurs while Chainlink has corrected by about 7.5% over the same period. Smart money wallets have reduced exposure by 5.2%, suggesting whales are positioning early rather than expecting an immediate move.
This whale has further withdrawn 366,364 $LINK, worth $4.5M, from #Binance.
Now, the whale holds 695,783 $LINK, worth $8.52M, from #Binance in the past 2 days.
On the chart, the Bull Bear Power (BBP) indicator shows that red bars have been shrinking since December 24. BBP measures the distance between price and a moving average to highlight whether bulls or bears control momentum. When the red bars shrink, bearish pressure is fading.
At the same time, LINK is trying to reclaim a key short-term barrier near $12.50. A daily close above that level would put the token back inside the short-term breakout conversation. Above $12.50, the more critical levels sit near $12.98 and $13.75, and a move past $15.00 would return LINK to a clear bullish zone.
Smart money exiting while whales continue to add hints at a slower setup. The structure suggests whales are accumulating into weakness for a potential move in early 2026, not an immediate breakout. Until $12.50 is reclaimed, LINK may stay range-bound. Also, a dip under $11.72 can invalidate the whales’ bullish theory for now.
Lido DAO (LDO)
Crypto whales have also turned to Lido over the past 7 days. Their balances are up 30.34%, bringing the cohort’s stash to 17.49 million LDO. At the current price , whales added roughly 4.07 million LDO, worth about $2.28 million in a week.
This comes while the token has gained 4.2% during the same period, which suggests whales are buying into strength.
Not all big buyers are anonymous. One of the most notable additions came from Arthur Hayes, who accumulated 1.85 million LDO worth around $1.03 million. It also explains why the “Public Figure” cohort has climbed alongside whale activity.
Smart money, however, shows a different stance. Their balances are down 7.75%. Exchange balances are also down 1.49%, hinting that retail may be removing tokens from exchanges rather than selling. This disconnect means the whale thesis might take time to play out and could stretch into early 2026 instead of an immediate move.
On the chart, Lido trades inside a clear range between $0.59 and $0.49. The On-Balance Volume (OBV) indicator, which measures whether volume flows in or out, broke its downtrend on December 23.
That happened at the same time whale inflows picked up, so the signal is worth watching.
A daily close above $0.59 is needed to confirm strength. That level broke on December 14 and hasn’t been reclaimed since. If buyers clear it with conviction, the next zones to watch are $0.76 (0.618 Fibonacci) and then $0.92, where momentum could flip from corrective to bullish.
Until then, range-bound trading remains the base case. A loss of $0.49 would invalidate the current LDO price setup, especially if smart money keeps reducing exposure during year-end volatility.
Aster (ASTER)
The third token on the list is Aster. This one has seen whale interest on the 24-hour window rather than a longer accumulation trend. Over the past day, whales added 2.37% to their existing stash.
Following this rise, whale holdings now stand at approximately 19.23 million ASTER. At a price of about $0.71, that means whales added roughly 455,000 ASTER, worth a little over $320,000.
The addition is not massive. It stands out because ASTER has dropped more than 30% in a month, and this pickup might hint that sentiment is slowly shifting from heavy selling to cautious positioning.
Price action supports this reading. ASTER fell sharply from about $1.40 on November 19 and found support near $0.65, which has held as a floor through December. Selling pressure also looks weaker now. On the Wyckoff Volume indicator, red and yellow bars (seller control) have been fading since December 15. The recent shift toward lighter red/yellow bars suggests sellers are losing dominance.
If whales are right, the recovery attempt begins with a push to $0.83, which requires approximately a 16% move from current prices. Breaking above $0.83 opens room toward $1.03, and then $1.24 if market conditions improve.
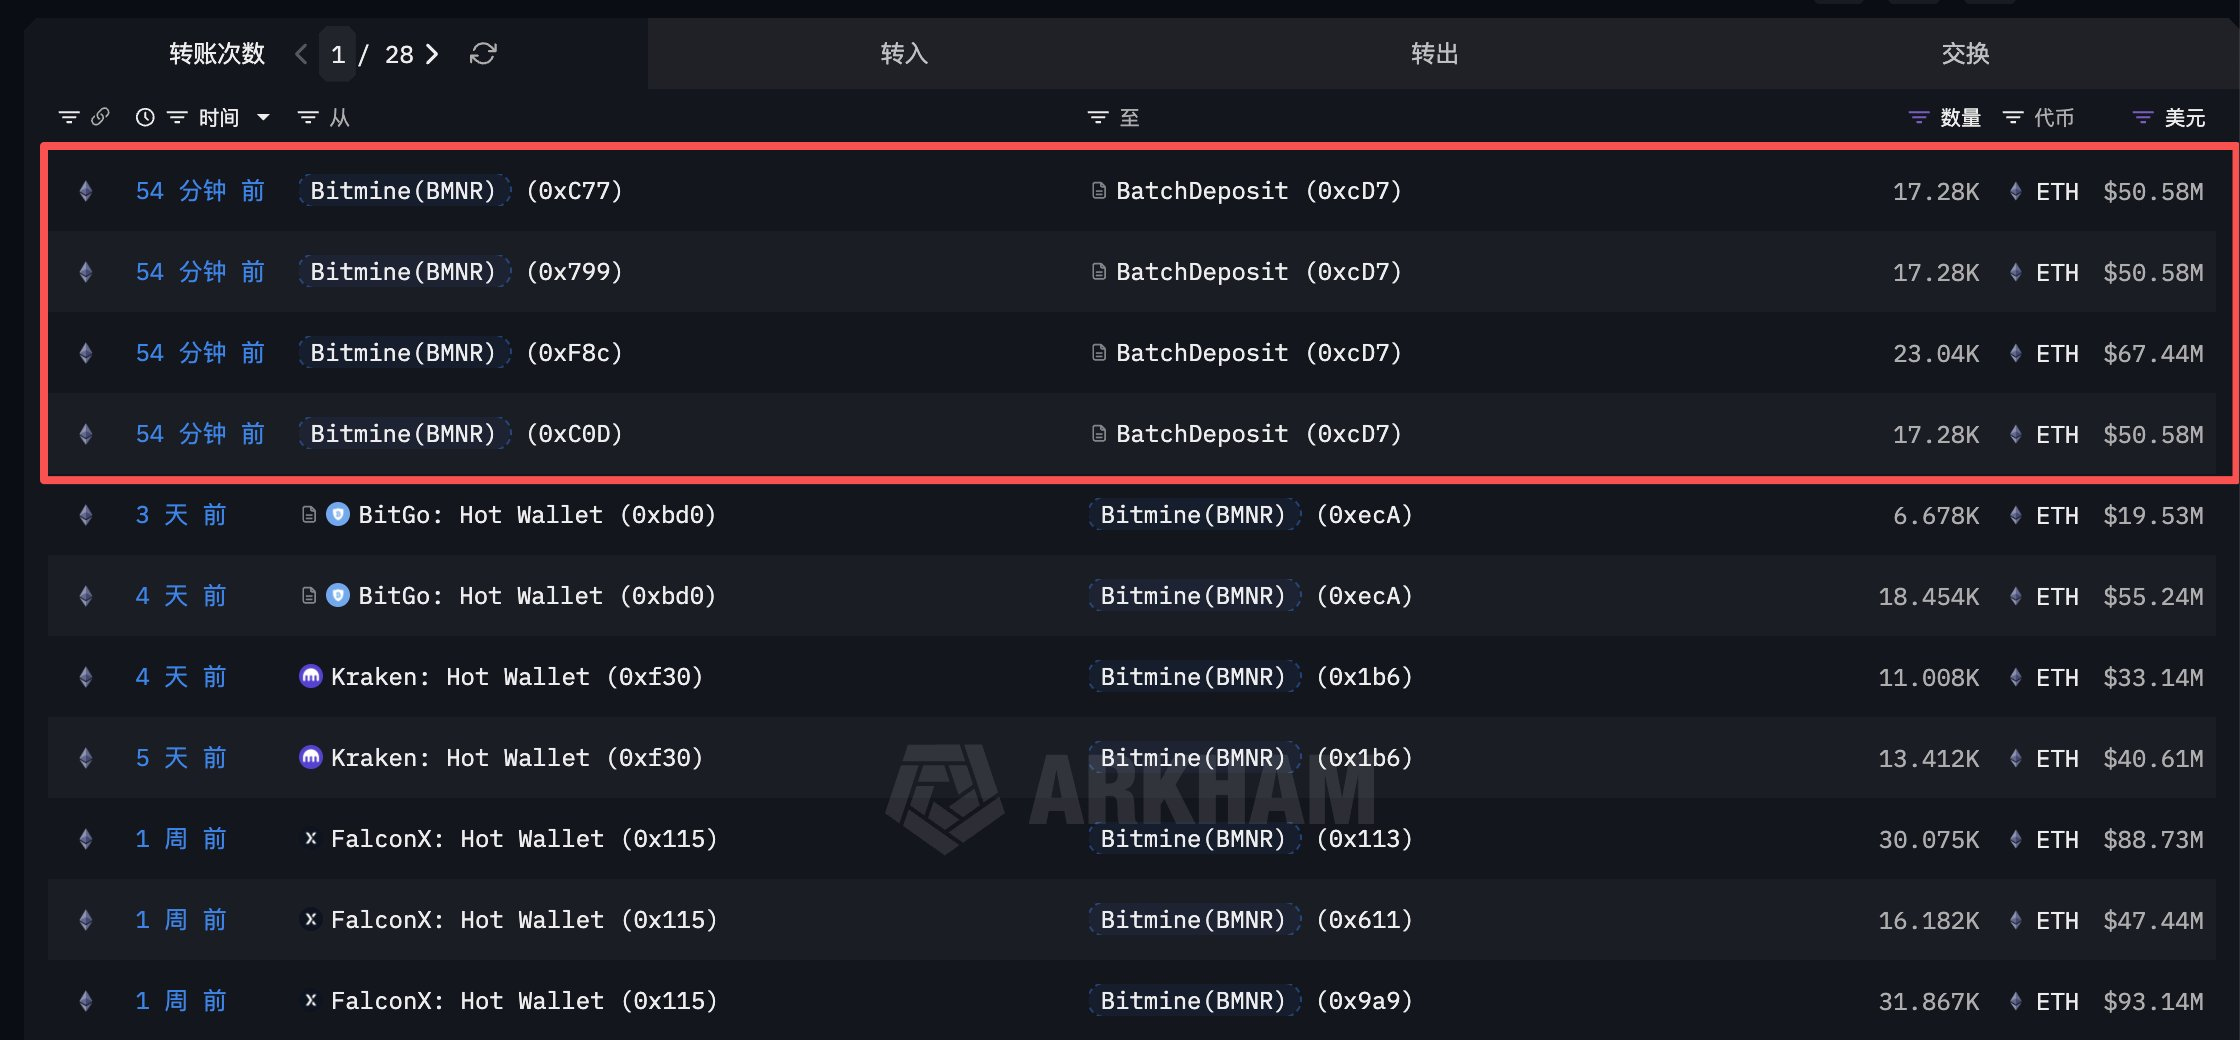
BitMine, pemegang Ethereum korporasi terbesar, mulai melakukan staking sebagian dari treasury ETH senilai US$12 miliar miliknya.
Pada 27 Desember, analis on-chain Ember CN melaporkan bahwa perusahaan tersebut telah menyetor sekitar 74.880 ETH, dengan perkiraan nilai sekitar US$219 juta, ke dalam kontrak staking Ethereum.
Kenapa BitMine melakukan staking pada kepemilikannya?
Jika perusahaan melakukan staking seluruh treasury pada estimasi annual percentage yield (APY) saat ini sebesar 3,12%, mereka akan menghasilkan sekitar 126.800 ETH setiap tahun. Dengan harga saat ini, hasilnya setara dengan pendapatan US$371 juta per tahun.
Struktur seperti ini nantinya akan membuat BitMine menjadi Public Crypto Vehicle penghasil yield yang terhubung langsung dengan consensus layer Ethereum. Itu berarti, valuasinya tidak lagi bergantung terutama pada pergerakan harga ETH secara langsung.
Tujuan dan Risiko Staking ETH
namun, strategi ini juga membawa risiko finansial serta operasional baru bagi perusahaan.
Tidak seperti Bitcoin yang disimpan di cold storage dan bisa langsung dilikuidasi saat kondisi pasar tertekan, Ether yang di-staking terikat oleh mekanisme penarikan yang diatur di level protokol.
Jika terjadi krisis likuiditas, penundaan itu bisa membuat BitMine terkena fluktuasi harga, yang mungkin bisa dihindari jika treasury tidak di-staking.
Kondisi ini menyoroti perbedaan mendasar antara sekadar memegang Ethereum sebagai aset pasif dan mempergunakannya sebagai modal produktif di jaringan.
Demi mendukung rencana tersebut, perusahaan sedang mengembangkan platform staking sendiri, yaitu Made in America Validator Network (MAVAN), yang dijadwalkan akan diluncurkan pada awal 2026.
“We continue to make progress on our staking solution known as The Made in America Validator Network (MAVAN). This will be the ‘best-in-class’ solution offering secure staking infrastructure and will be deployed in early calendar 2026,” ujar ketua BitMine, Thomas Lee dalam pernyataannya.
Di sisi lain, para pengkritik berpendapat bahwa mengonsolidasikan kepemilikan Ether sebesar ini di bawah satu framework validator berbasis AS menimbulkan risiko sentralisasi. Mereka menilai struktur tersebut bisa melemahkan jaringan yang seharusnya netral dan terdistribusi secara global.
BitMine, the largest corporate holder of Ethereum, has begun staking part of its $12 billion ETH treasury.
On December 27, on-chain analyst Ember CN reported that the firm deposited approximately 74,880 ETH, valued at about $219 million, into Ethereum staking contracts.
If the company were to stake its entire treasury at the current estimated annual percentage yield (APY) of 3.12%, it would generate approximately 126,800 ETH annually. At current prices, this equates to $371 million in yearly revenue.
Such a structure would effectively recast BitMine as a yield-bearing vehicle tied to Ethereum’s consensus layer. This means its valuation would no longer hinge primarily on the asset’s directional price movements.
ETH Staking Goals and Risks
However, the strategy introduces new financial and operational risks for the company.
Unlike Bitcoin held in cold storage, which can be liquidated immediately in stressed market conditions, staked Ether is constrained by protocol-level withdrawal mechanics.
Validators exiting the network must pass through an exit queue, which can delay access to capital during periods of heightened volatility.
In a liquidity crunch, that delay could leave BitMine exposed to price swings that a non-staking treasury might otherwise avoid.
This tradeoff underscores a structural difference between holding Ethereum as a passive asset and deploying it as productive capital within the network.
To support that vision, the firm is developing a proprietary staking platform, the Made in America Validator Network (MAVAN), scheduled for deployment in early 2026.
“We continue to make progress on our staking solution known as The Made in America Validator Network (MAVAN). This will be the ‘best-in-class’ solution offering secure staking infrastructure and will be deployed in early calendar 2026,” BitMine chair Thomas Lee said.
Meanwhile, critics argue that consolidating such a large share of Ether under a single US-domiciled validator framework introduces centralization risks. They say the structure could undermine a network designed to be neutral and globally distributed.
Harga Ethereum turun kurang dari 1% dalam 24 jam terakhir. Sekilas, grafik terlihat tenang, dan penurunan harga kecil ini berkaitan dengan lemahnya permintaan dari ritel. Tapi, sebenarnya ada hal lain yang terjadi di balik layar.
Data on-chain terbaru menunjukkan whale kembali menambah kepemilikan, sementara satu indikator penting memperlihatkan perubahan tren langka yang cenderung menguntungkan salah satu dari dua kelompok yang disebutkan di artikel ini.
Ritel melambat dan whale mulai masuk
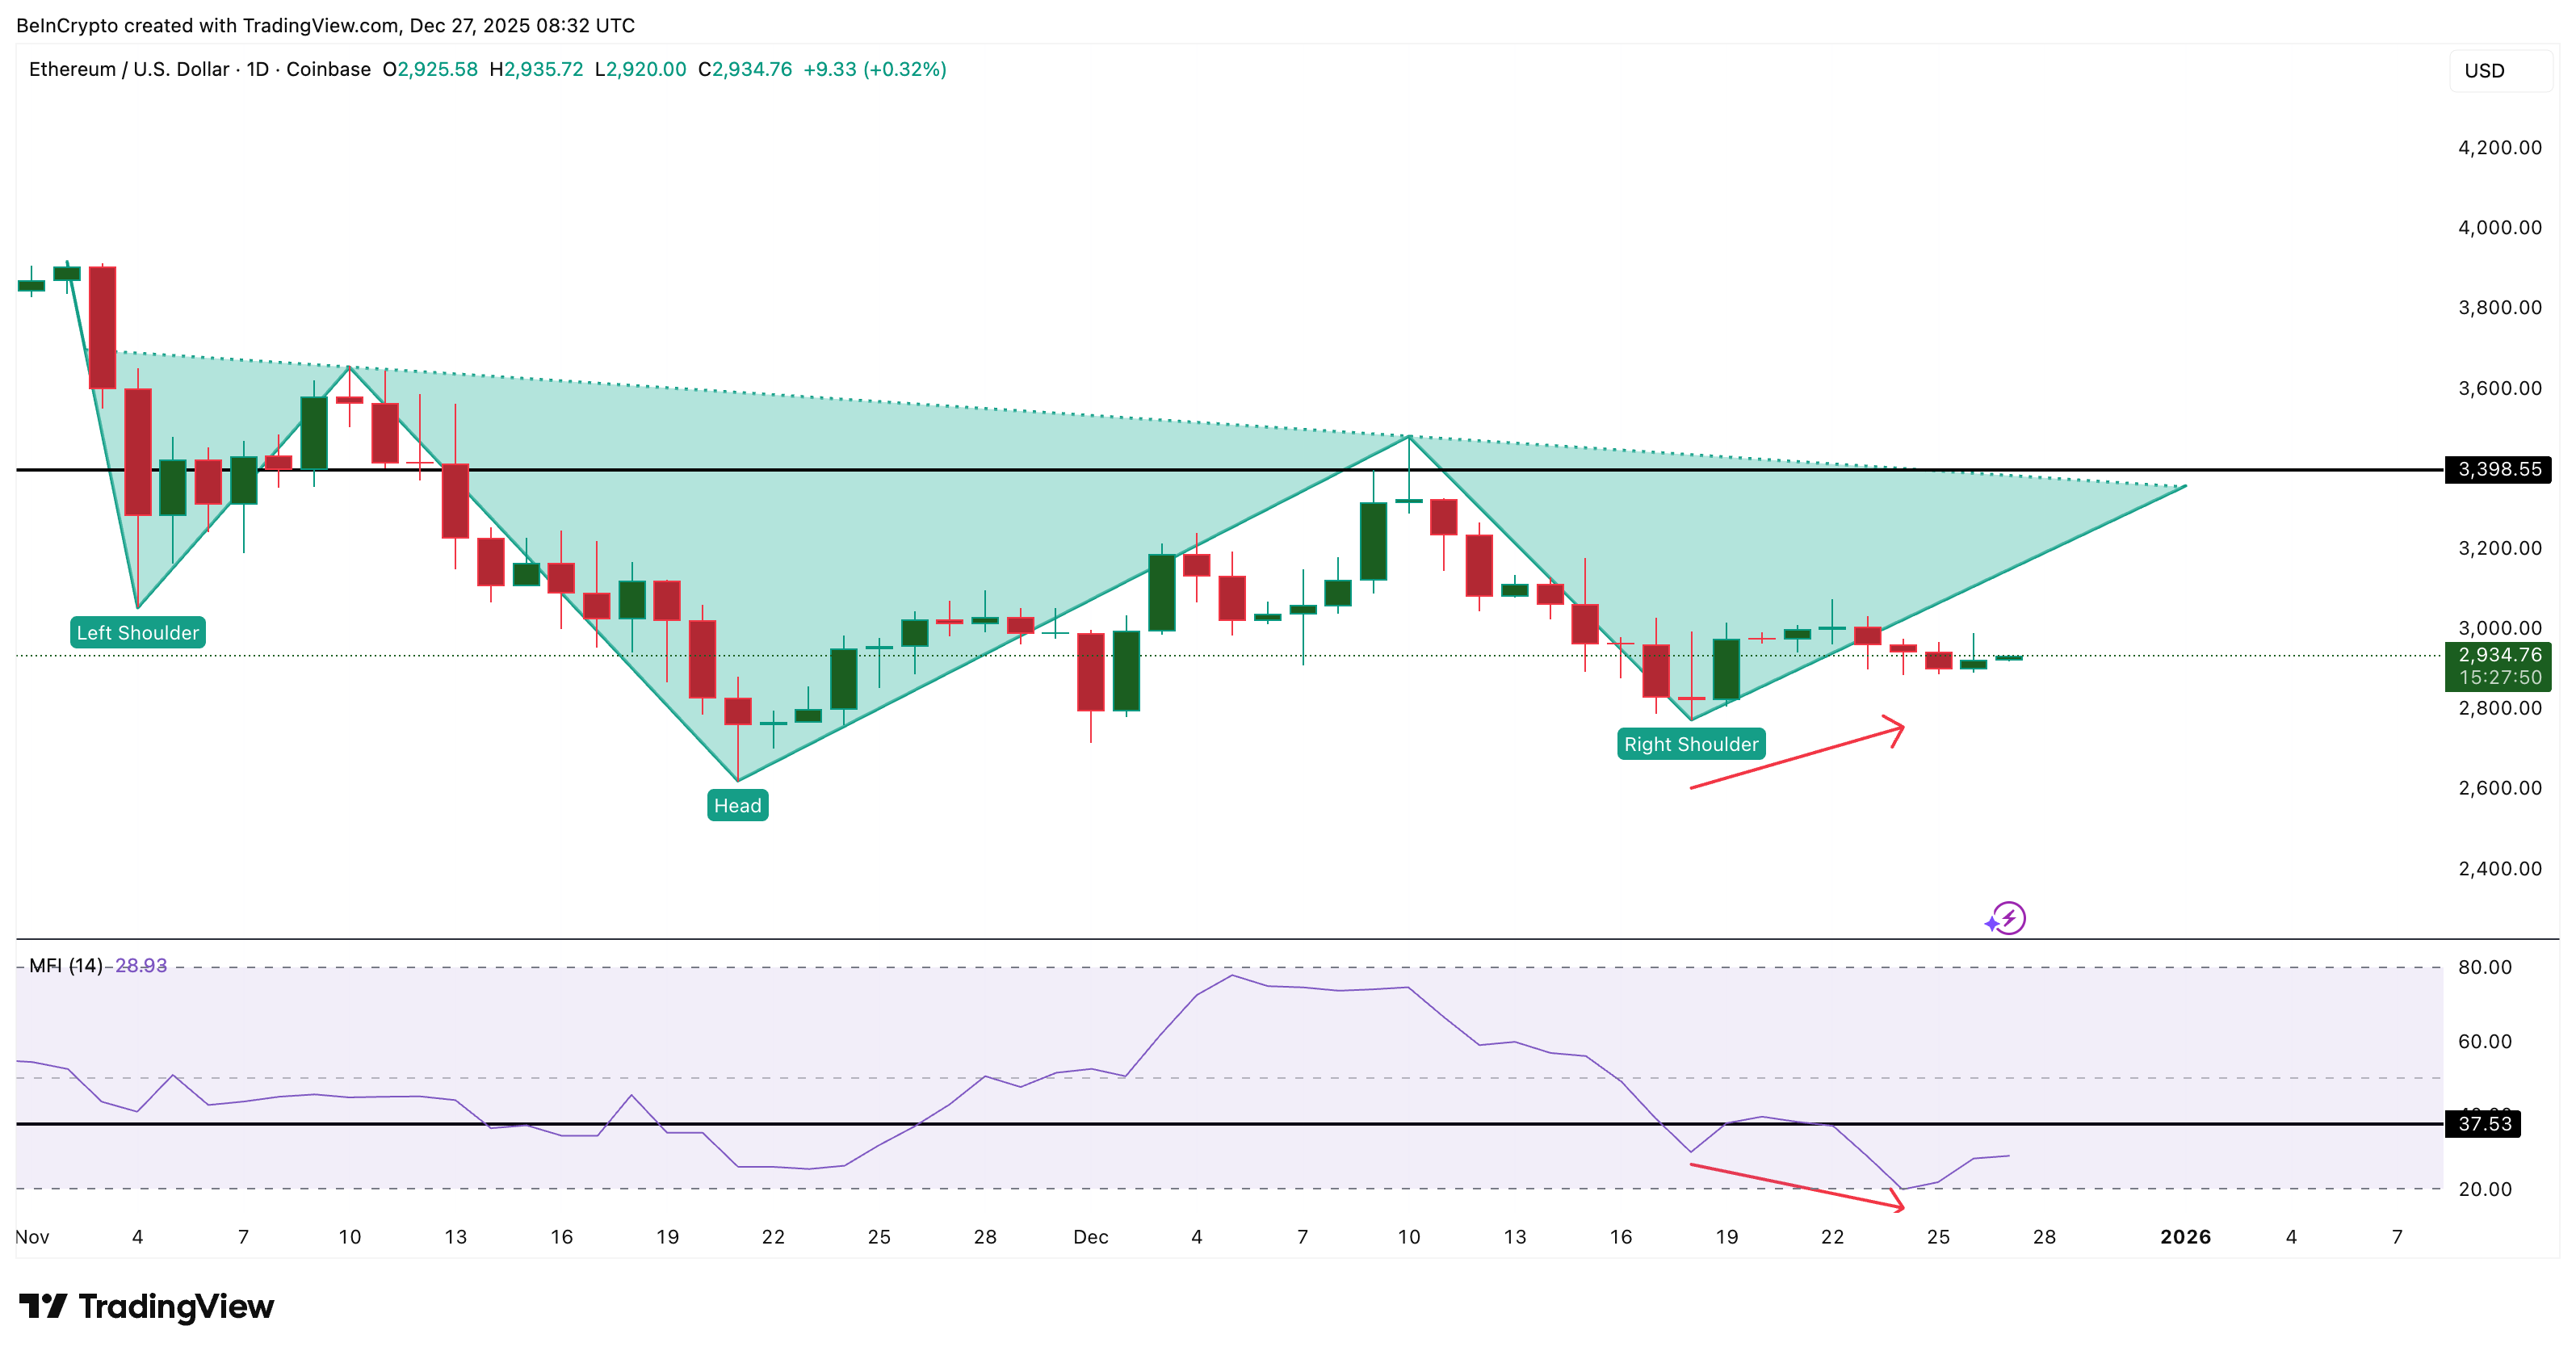
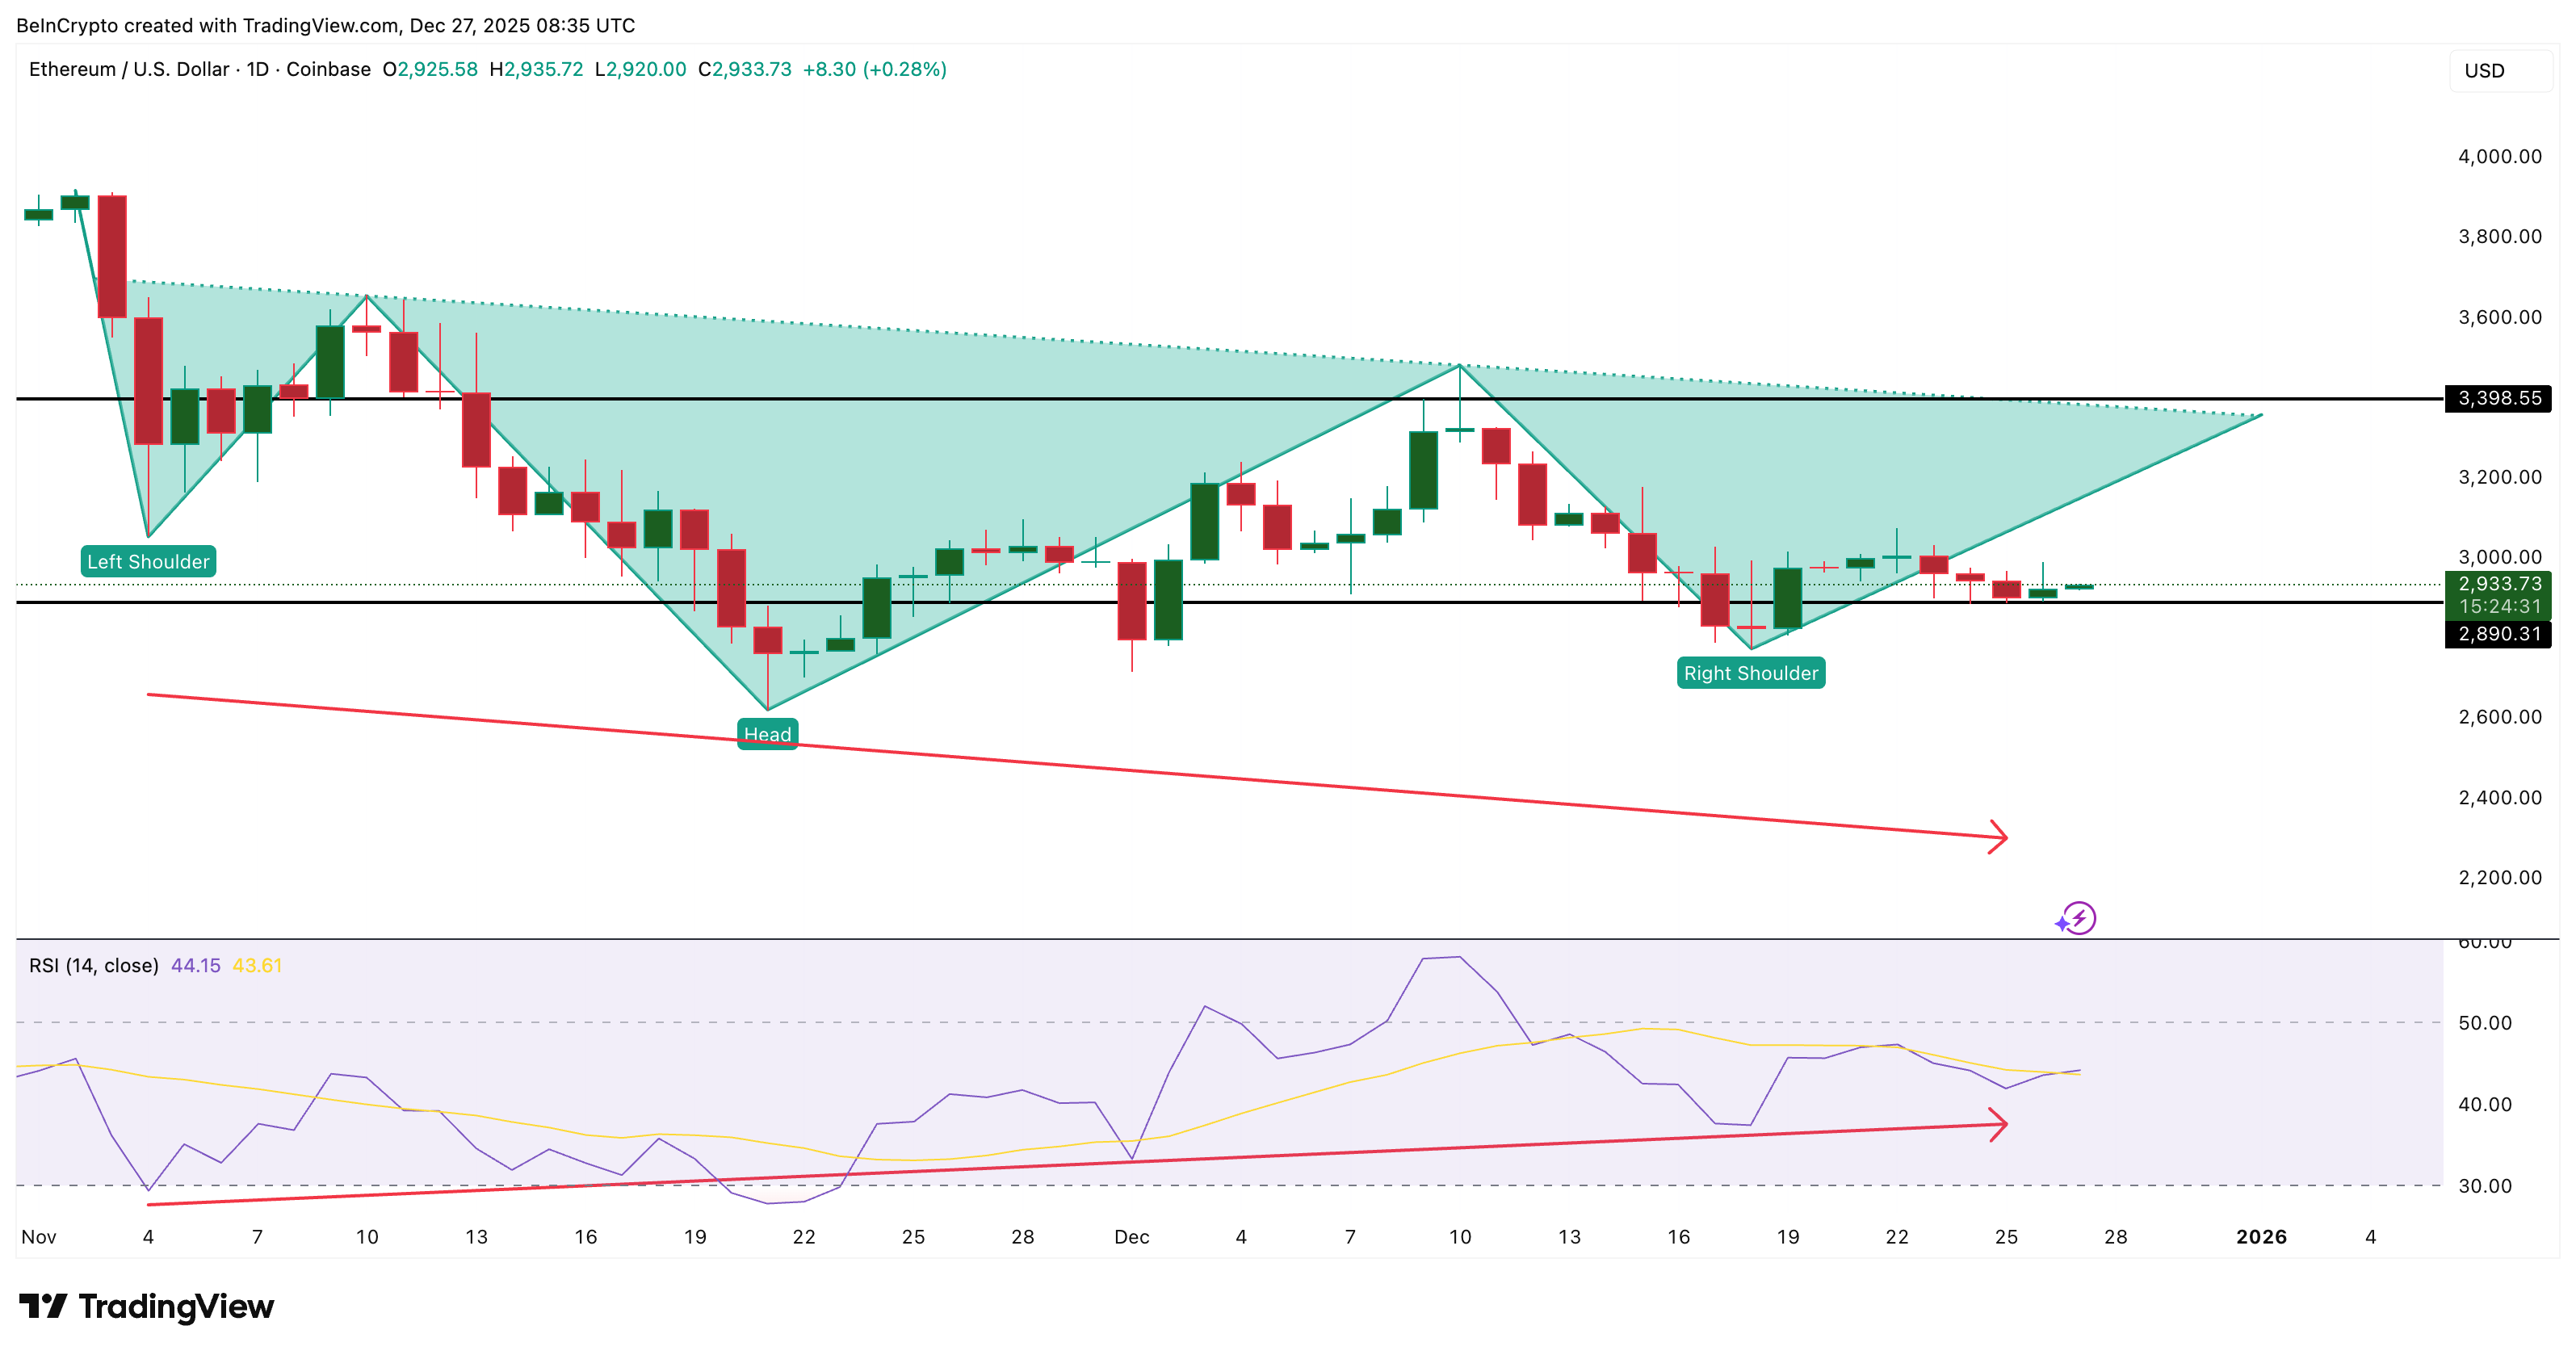
Ethereum sedang mendekati penyelesaian pola inverse head-and-shoulders. Ini adalah struktur bullish yang menandakan pembalikan tren jika harga menembus di atas US$3.390. Masalahnya muncul sebelum level breakout itu. Momentum ritel melemah pekan ini.
Antara 18 Desember dan 24 Desember, harga bergerak naik. Biasanya, ini pertanda positif. Money Flow Index (MFI), yang melacak arus masuk dan keluar uang pada suatu aset, tidak sejalan. Indikator ini malah mencetak lower low. Ini menandakan kemungkinan trader ritel tidak mendukung higher low dengan aksi beli yang nyata.
Ingin insight token seperti ini? Daftarkan diri untuk Newsletter Harian Crypto dari Editor Harsh Notariya di sini.
Sekarang, MFI perlu bergerak di atas 37 untuk membentuk higher high dan memperlihatkan permintaan yang lebih kuat.
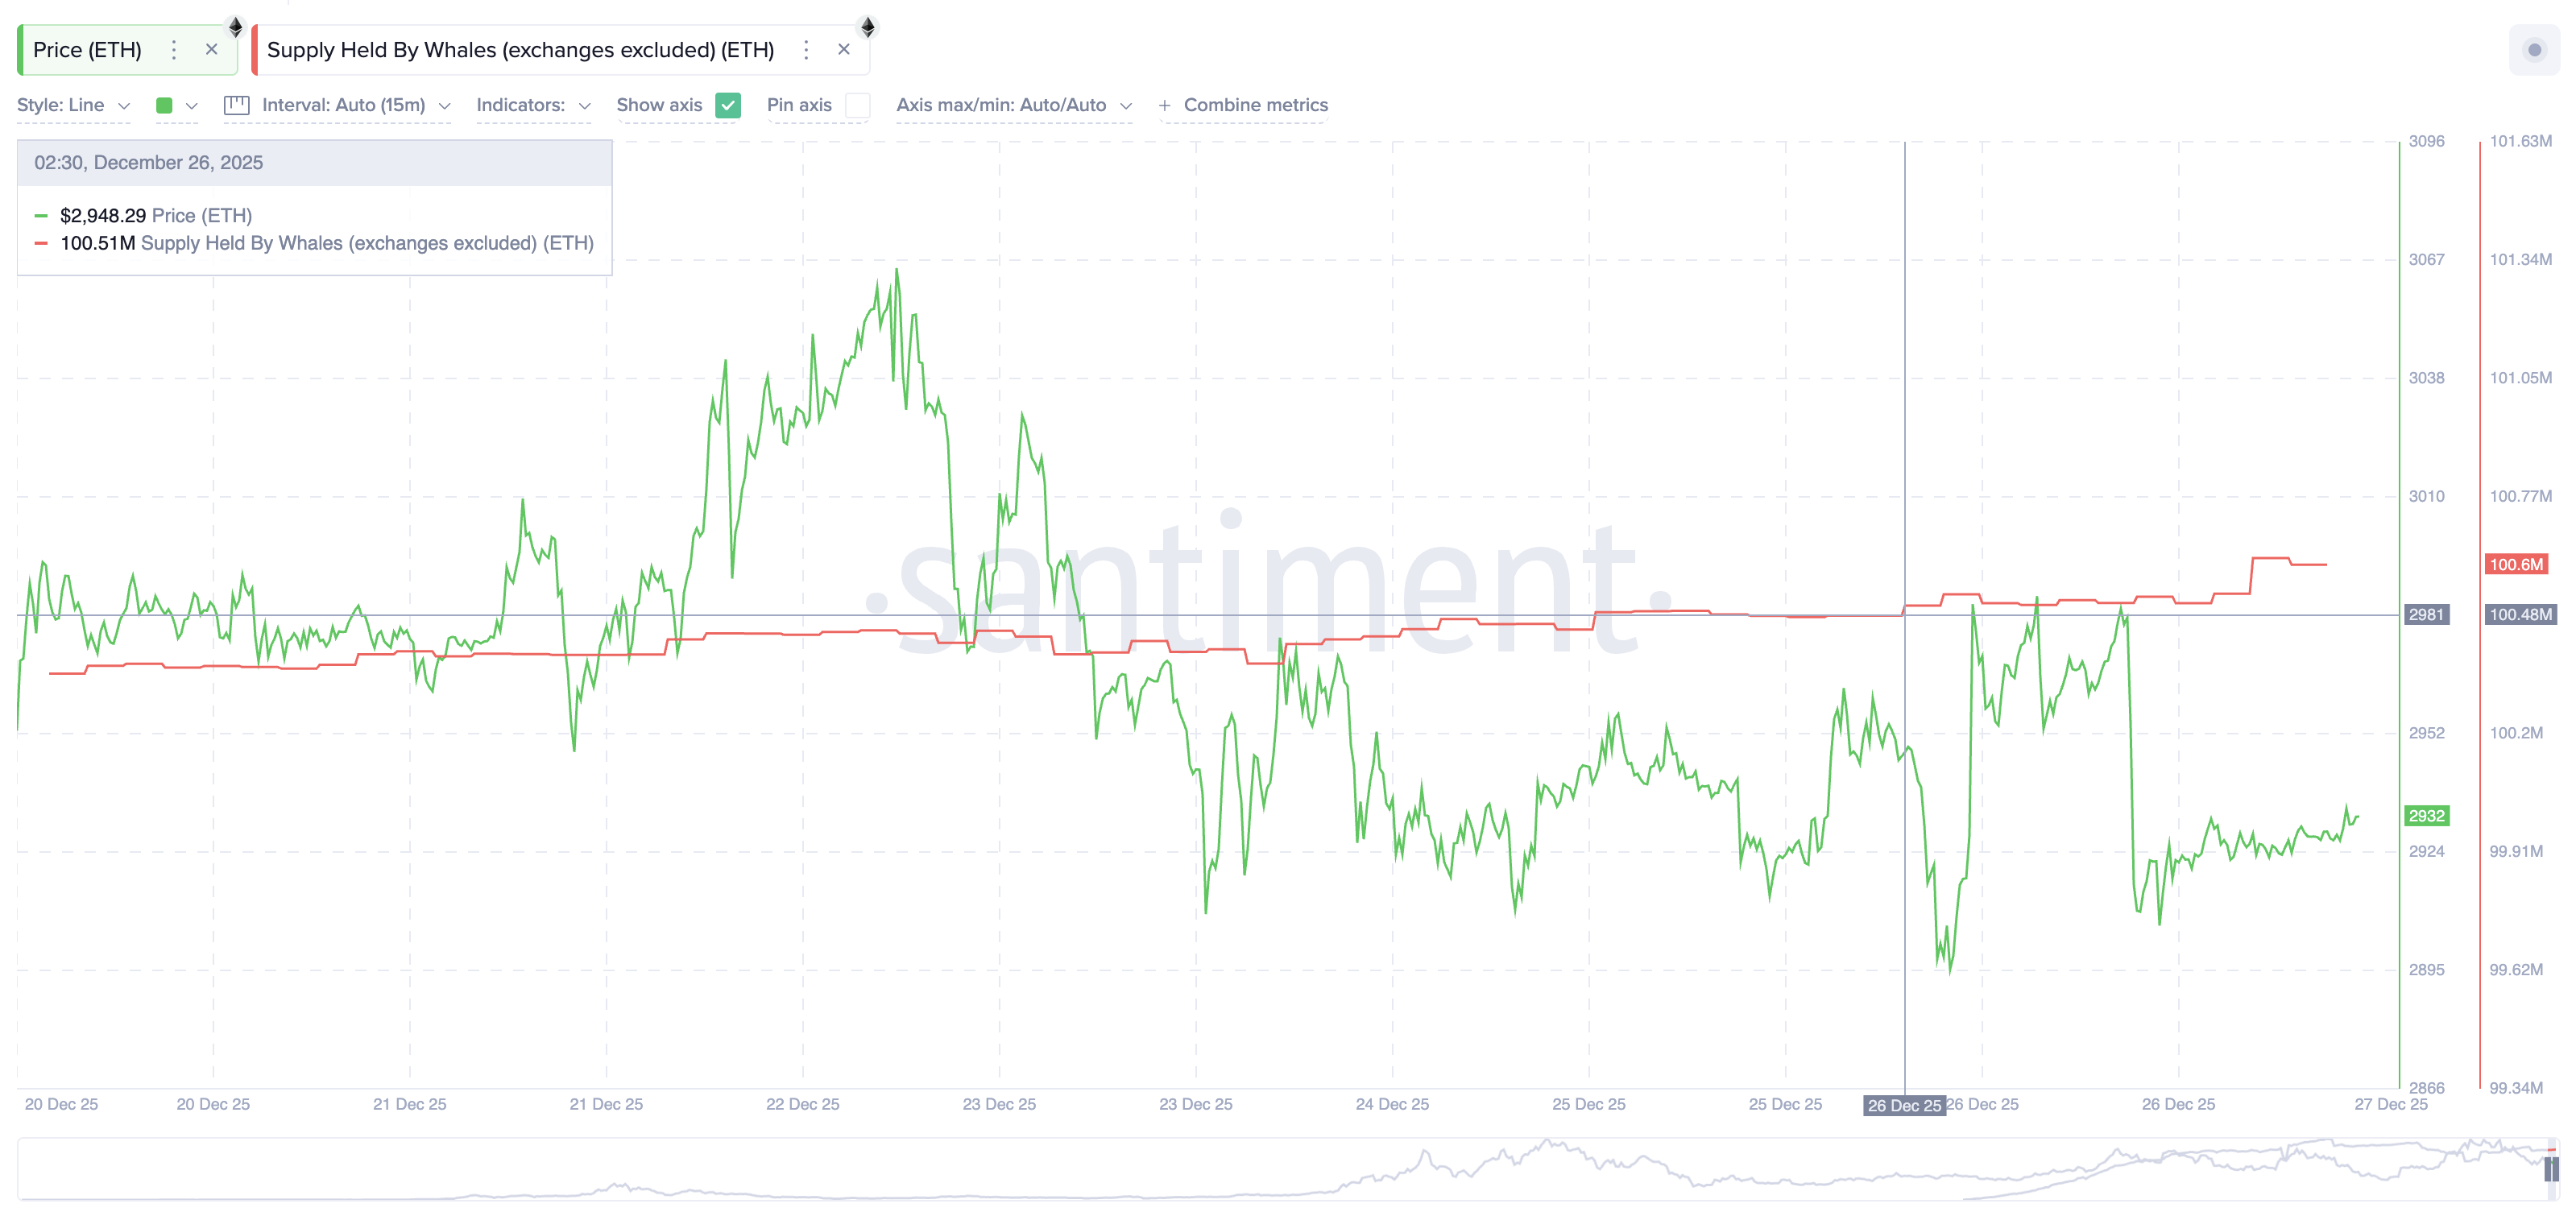
Ketika ritel mulai melambat, whale justru bertindak sebaliknya. Sejak 26 Desember, wallet yang menyimpan jumlah besar ETH bertambah dari 100,48 juta ETH menjadi 100,6 juta ETH.
Dengan harga saat ini, jumlah ini setara sekitar US$350 juta yang masuk dalam 24 jam terakhir. Whale tidak membeli untuk keuntungan jangka pendek. Mereka biasanya membeli karena melihat ada peluang di pasar.
Pembagian ini menggambarkan situasi saat ini. Ritel masih ragu, sedangkan whale mulai masuk. Arah harga ETH selanjutnya tergantung pada kelompok mana yang bertahan konsisten.
Satu indikator mengarah ke crypto whale
Relative Strength Index (RSI), indikator pengukur momentum, mendukung posisi whale.
Antara 4 November hingga 25 Desember:
Harga mencetak lower low
RSI mencetak higher low
Ini adalah bullish divergence. Sinyal ini menandakan tekanan jual mulai melemah, meski harga belum mengonfirmasi secara teknikal.
Divergence seperti ini mendukung pola pembalikan seperti inverse head-and-shoulders. Ini bukan jaminan akan terjadi breakout. Tapi, peluang breakout akan lebih besar jika harga mencapai zona pemicu. Itu sebabnya whale Ethereum mulai menambah kepemilikan saat ini.
Zona Harga Ethereum yang Menentukan Pergerakan Berikutnya
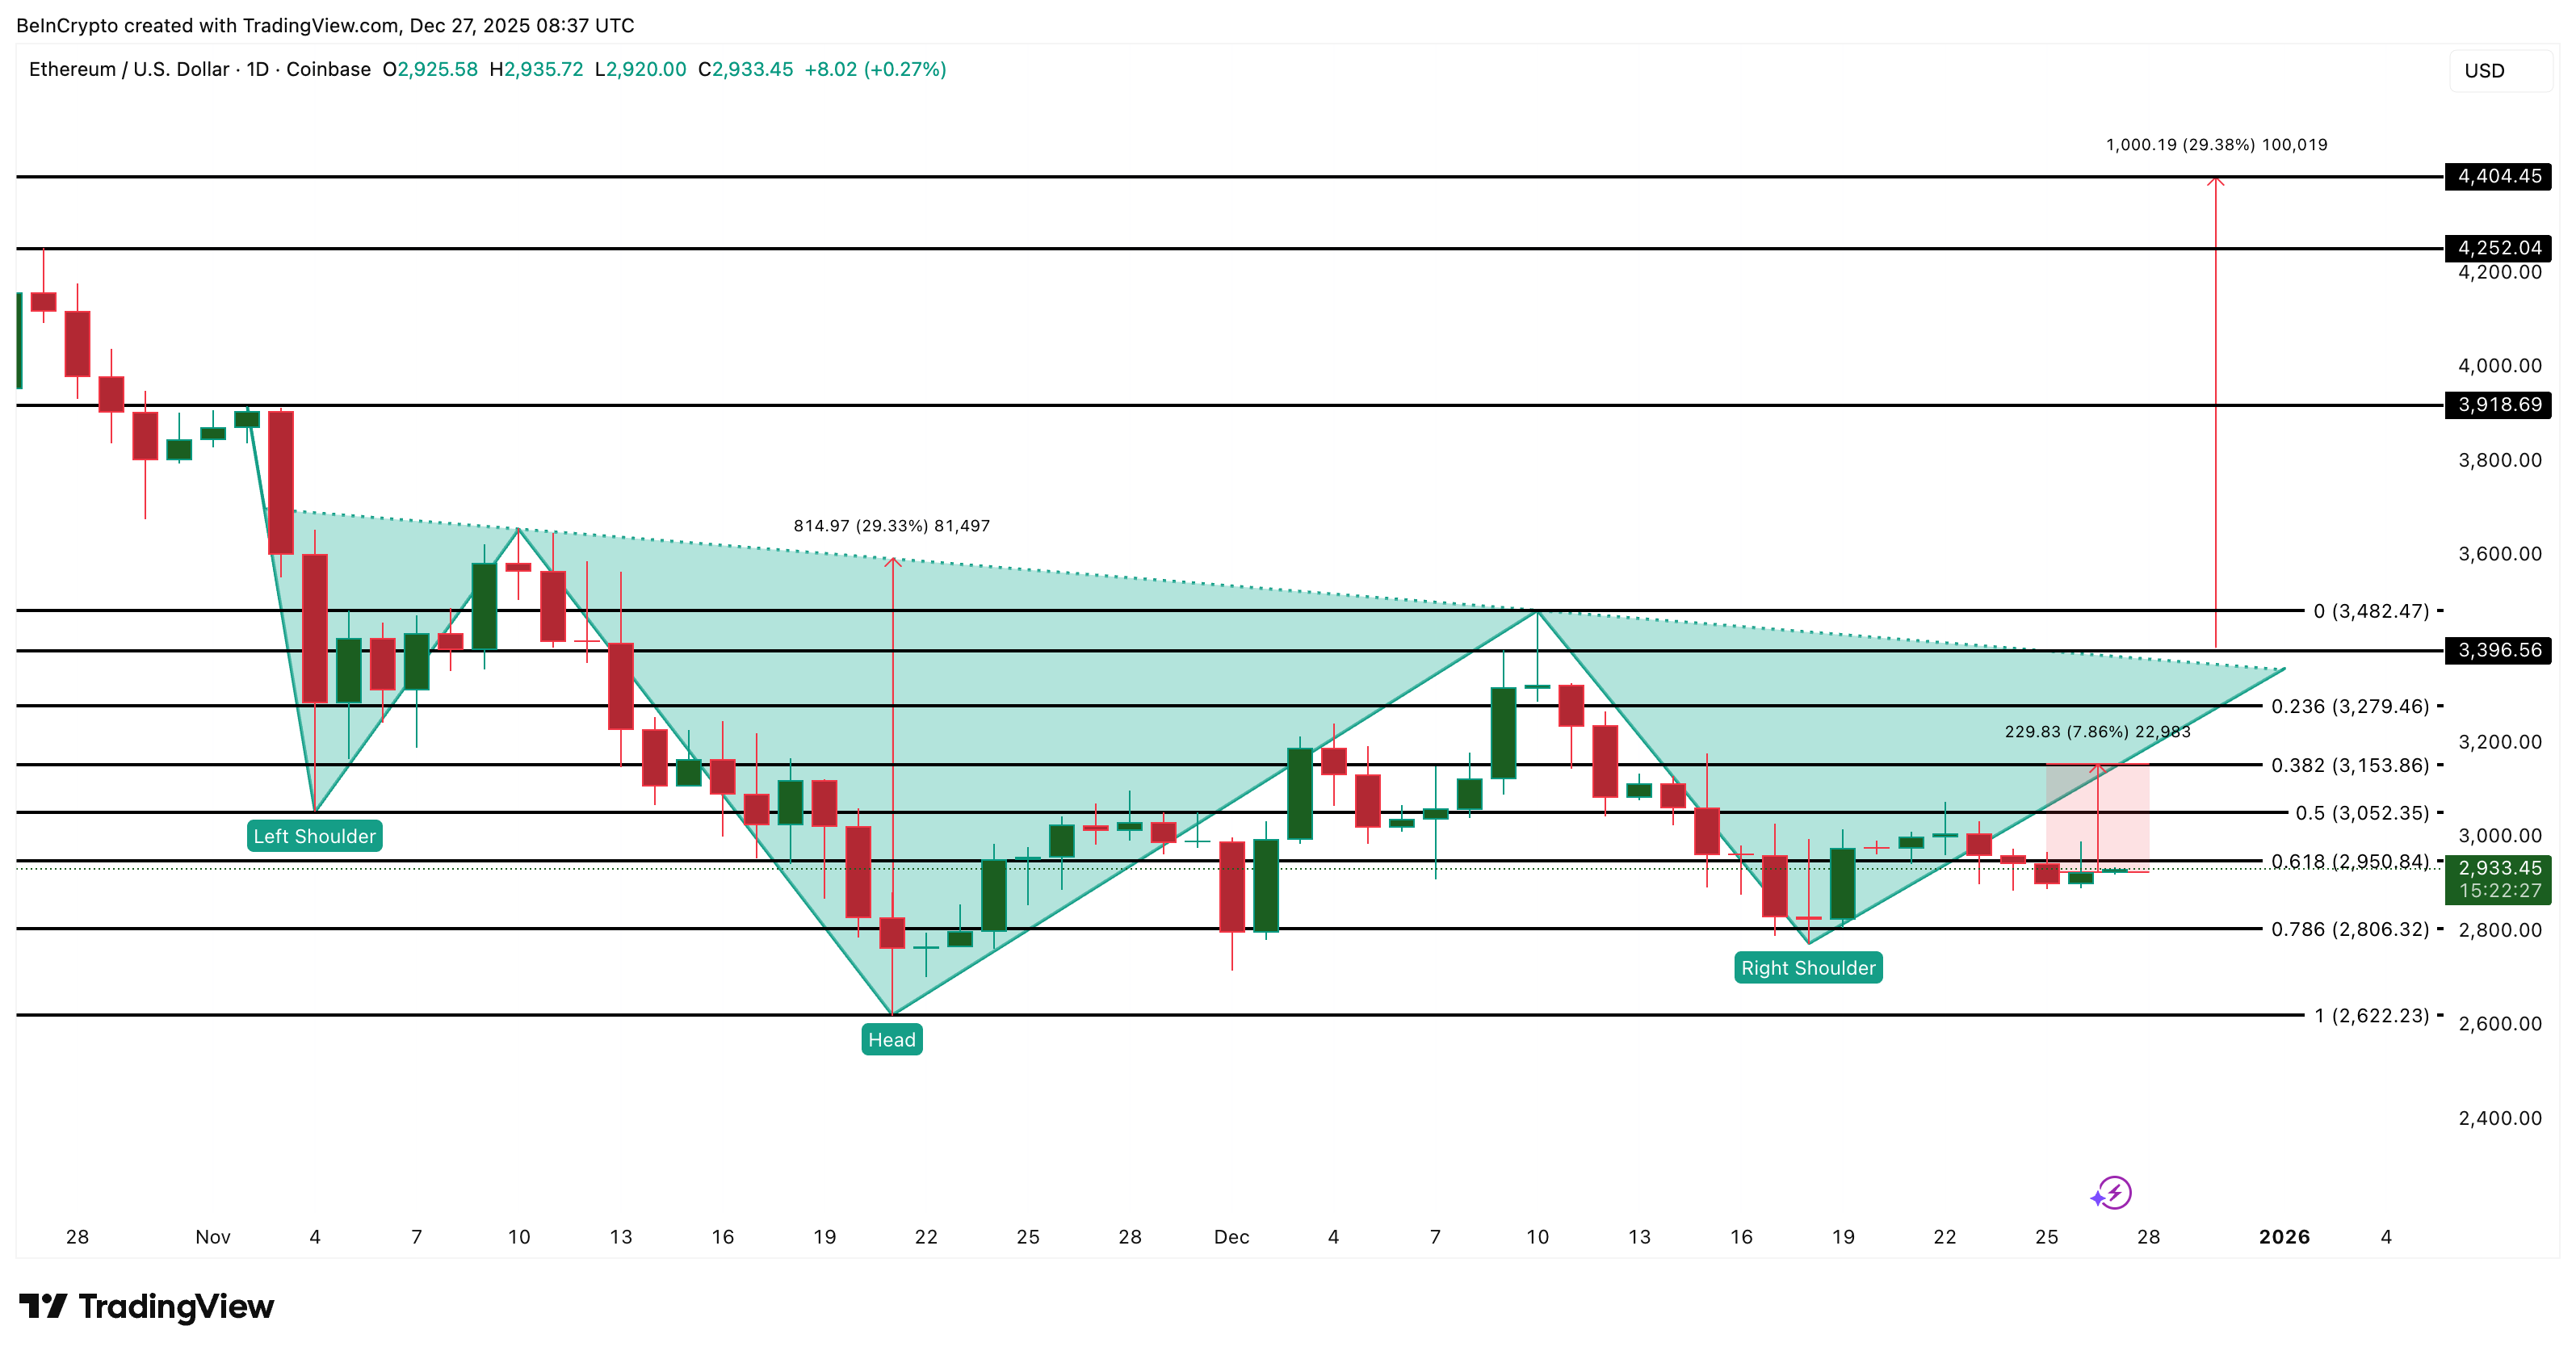
Harga Ethereum harus tembus kembali level US$3.050 terlebih dahulu. Level ini jadi penghalang psikologis dan resistance jangka pendek.
Jika harga berhasil menembus dengan kuat, ujian berikutnya adalah zona breakout neckline di US$3.390.
Breakout di atas US$3.390 bisa memicu target inverse head-and-shoulders mendekati US$4.400. Angka ini didapat dengan menambahkan tinggi pola head ke titik breakout.
Di sisi bawah, jika kehilangan level US$2.800 akan melemahkan momentum bullish. Bila tekanan jual meningkat dan whale berhenti menambah, harga Ethereum bisa turun ke US$2.620. Penurunan di bawah level ini akan membatalkan struktur pembalikan bullish.
The Ethereum price is down by under 1% in the last 24 hours. At first glance, the chart looks quiet. Also, the minor price drop links to weak retail demand. But something else is happening under the surface.
New on-chain data shows whales adding again, while one key indicator flashes a rare trend shift, favoring one of the two groups mentioned in this piece.
Retail Slows Down While Whales Move In
Ethereum is approaching completion of an inverse head-and-shoulders pattern. This is a bullish structure that signals a trend reversal if the price breaks above $3,390. The problem appears before that breakout level. Retail momentum weakened this week.
Between December 18 and December 24, the price trended higher. Normally, that is a positive sign. The Money Flow Index (MFI), which tracks money entering and exiting an asset, did not follow. It made a lower low. That shows that possibly retail traders did not support the higher low with real buying.
Want more token insights like this? Sign up for Editor Harsh Notariya’s Daily Crypto Newsletter here.
MFI now needs to move above 37 to form a higher high and show stronger demand.
While retail slowed down, the whales reacted the opposite way. Since December 26, wallets holding large amounts moved from 100.48 million ETH to 100.6 million ETH.
At the current price, this amounts to approximately $350 million injected over the past 24 hours. Whales do not buy for short-term flips. They usually buy because they think a setup exists.
This type of divergence supports reversal patterns such as the inverse head-and-shoulders. It does not guarantee the breakout. It gives the breakout attempt a higher chance of working if the price reaches the trigger zone. And that is exactly why Ethereum whales are adding now.
Ethereum Price Zones Decide The Next Leg
The Ethereum price must reclaim $3,050 first. This is a psychological barrier and short-term resistance.
If price clears it with strength, the next test is the neckline breakout zone at $3,390.
A breakout above $3,390 could activate an inverse head and shoulders target near $4,400. That comes from adding the height of the head to the breakout point.
On the downside, losing $2,800 weakens bullish momentum. If selling increases and whales stop adding, the Ethereum price can slide to $2,620. A drop below that level invalidates the bullish reversal structure.
CEO Coinbase, Brian Armstrong, memprediksi bahwa bank-bank di AS akan membalikkan sikapnya terhadap regulasi stablecoin dan akhirnya akan melobi Kongres agar mengizinkan pembayaran bunga pada aset digital tersebut.
Prediksi Armstrong, yang ia unggah 27 Desember di X, berlawanan dengan upaya sektor perbankan saat ini yang ingin menghilangkan fitur pemberi imbal hasil dari GENIUS Act.
Armstrong prediksi bank akan ubah kebijakan larangan bunga stablecoin
Armstrong menilai, para pemberi pinjaman sekarang sedang melindungi dana simpanan berbiaya rendah, tapi nantinya mereka akan terpaksa mengadopsi teknologi ini agar tetap bisa bersaing dalam menarik modal.
“My prediction is the banks will actually flip and be lobbying FOR the ability to pay interest and yield on stablecoins in a few years,” Armstrong wrote.
Prediksi ini mengubah cara pandang terhadap pertarungan regulasi di balik GENIUS Act. Armstrong membingkainya sebagai pertarungan antara perlindungan keuntungan lama dengan perkembangan pasar yang tidak bisa dihindari.
Mereka berargumen, sekarang platform non-bank bisa menawarkan imbal hasil Treasury yang hampir bebas risiko sekitar 4% sampai 5% untuk aset kas yang likuid. Dalam situasi seperti itu, bank komersial kesulitan bersaing jika tidak menaikkan tingkat bunga simpanan dan itu akan menekan margin bunga bersih mereka.
Tapi, Armstrong menyebutkan bahwa upaya mengubah undang-undang yang sudah berlaku adalah “garis merah” bagi industri aset kripto.
Exactly – I’m actually impressed the banks can lobby for this with a straight face and not get kicked out of senator’s offices. It takes some serious mental gymnastics.
We won’t let anyone reopen GENIUS. Red line issue for us. And will keep advocating for our customers and the… https://t.co/6EfF2oBn5A
Ia juga mengkritik sikap lobi perbankan dengan menyebutnya sebagai “mental gymnastics.” Armstrong menyoroti kontradiksi dengan alasan kekhawatiran keamanan sementara tetap mempertahankan model bisnis yang membayar bunga di bawah rata-rata pasar kepada para nasabahnya.
CEO Coinbase turut menyebut besaran dana lobi yang dikeluarkan oleh grup dagang perbankan saat ini sebagai “100% wasted effort.”
Perlu dicatat bahwa koalisi dari 125 perusahaan aset kripto, termasuk Coinbase, belum lama ini mengirimkan surat ke Komite Perbankan Senat yang menolak adanya revisi. Mereka berpendapat bahwa membuka ulang undang-undang tersebut justru akan mengurangi kepastian regulasi.
Pendapat Armstrong ini menunjukkan bahwa nantinya bank akan kehilangan kemampuan untuk menahan dana simpanan dengan bunga nyaris nol. Sebagai gantinya, bank akan menerbitkan token dolar mereka sendiri agar langsung bisa mengambil keuntungan dari selisih imbal hasil tersebut.
Sampai perubahan itu betul-betul terjadi, Coinbase dan sejumlah perusahaan lain berniat mempertahankan aturan yang berlaku sekarang, sehingga mereka tetap bisa menjadi “interface” dengan imbal hasil tinggi untuk para pemegang dolar.
Coinbase CEO Brian Armstrong predicts US banks will reverse their stance on stablecoin regulation and eventually lobby Congress to permit interest payments on these digital assets.
Armstrong’s forecast, posted December 27 on X, contradicts the banking sector’s current efforts to strip yield-generating features from the GENIUS Act.
Armstrong Predicts Banks Will Reverse Course on Stablecoin Interest Bans
He argued that lenders are currently protecting low-cost deposits but will be forced to adopt the technology to compete for capital.
“My prediction is the banks will actually flip and be lobbying FOR the ability to pay interest and yield on stablecoins in a few years,” Armstrong wrote.
The prediction reframes the current legislative battle over the GENIUS Act as more than a regulatory dispute. It presents the fight as a collision between legacy profit protection and inevitable market evolution.
The GENIUS Act, signed in July 2025, prohibits stablecoin issuers such as Circle and Tether from paying interest directly to holders.
However, it permits intermediaries—such as exchanges—to pass yield from the underlying Treasury reserves to users.
They argue that non-bank platforms can now offer near risk-free Treasury yields of roughly 4% to 5% on liquid cash equivalents. In that environment, commercial banks struggle to compete without raising deposit rates and compressing their net interest margins.
However, Armstrong characterized attempts to amend enacted law as a “red line” for the crypto industry.
Exactly – I’m actually impressed the banks can lobby for this with a straight face and not get kicked out of senator’s offices. It takes some serious mental gymnastics.
We won’t let anyone reopen GENIUS. Red line issue for us. And will keep advocating for our customers and the… https://t.co/6EfF2oBn5A
He criticized the banking lobby’s approach as “mental gymnastics.” He pointed to the contradiction of citing safety concerns while defending a business model built on paying depositors below-market rates.
The Coinbase CEO also described the current lobbying spend by banking trade groups as “100% wasted effort.”
Notably, a coalition of 125 crypto companies, including Coinbase, recently submitted a letter to the Senate Banking Committee opposing any revisions. The group argued that reopening the bill would undermine regulatory certainty.
Armstrong’s position implies that banks will eventually lose the ability to hold deposits at near-zero rates. Instead, they would issue their own tokenized dollars to capture the yield spread directly.
Until that pivot occurs, Coinbase and its peers intend to defend the existing framework that allows them to serve as the high-yield interface for dollar holders.
Harga Bitcoin turun hampir 2% dalam 24 jam terakhir dan turun hampir 3% dari puncak kemarin. Sekilas, tidak ada hal yang menarik dari harga saat ini.
Namun, ada perubahan di balik grafik, terutama secara on-chain, yang terjadi pertama kali dalam hampir tiga bulan terakhir, dan satu hal lain berubah minggu ini. Kedua perubahan ini memang belum mengonfirmasi reli jelang 2026, tapi bisa jadi ini merupakan fondasi awalnya.
Perubahan Momentum Mulai Terlihat, tapi Butuh Bukti
Dua sinyal muncul bersamaan. Keduanya terpisah, tetapi waktu kemunculannya sangat penting.
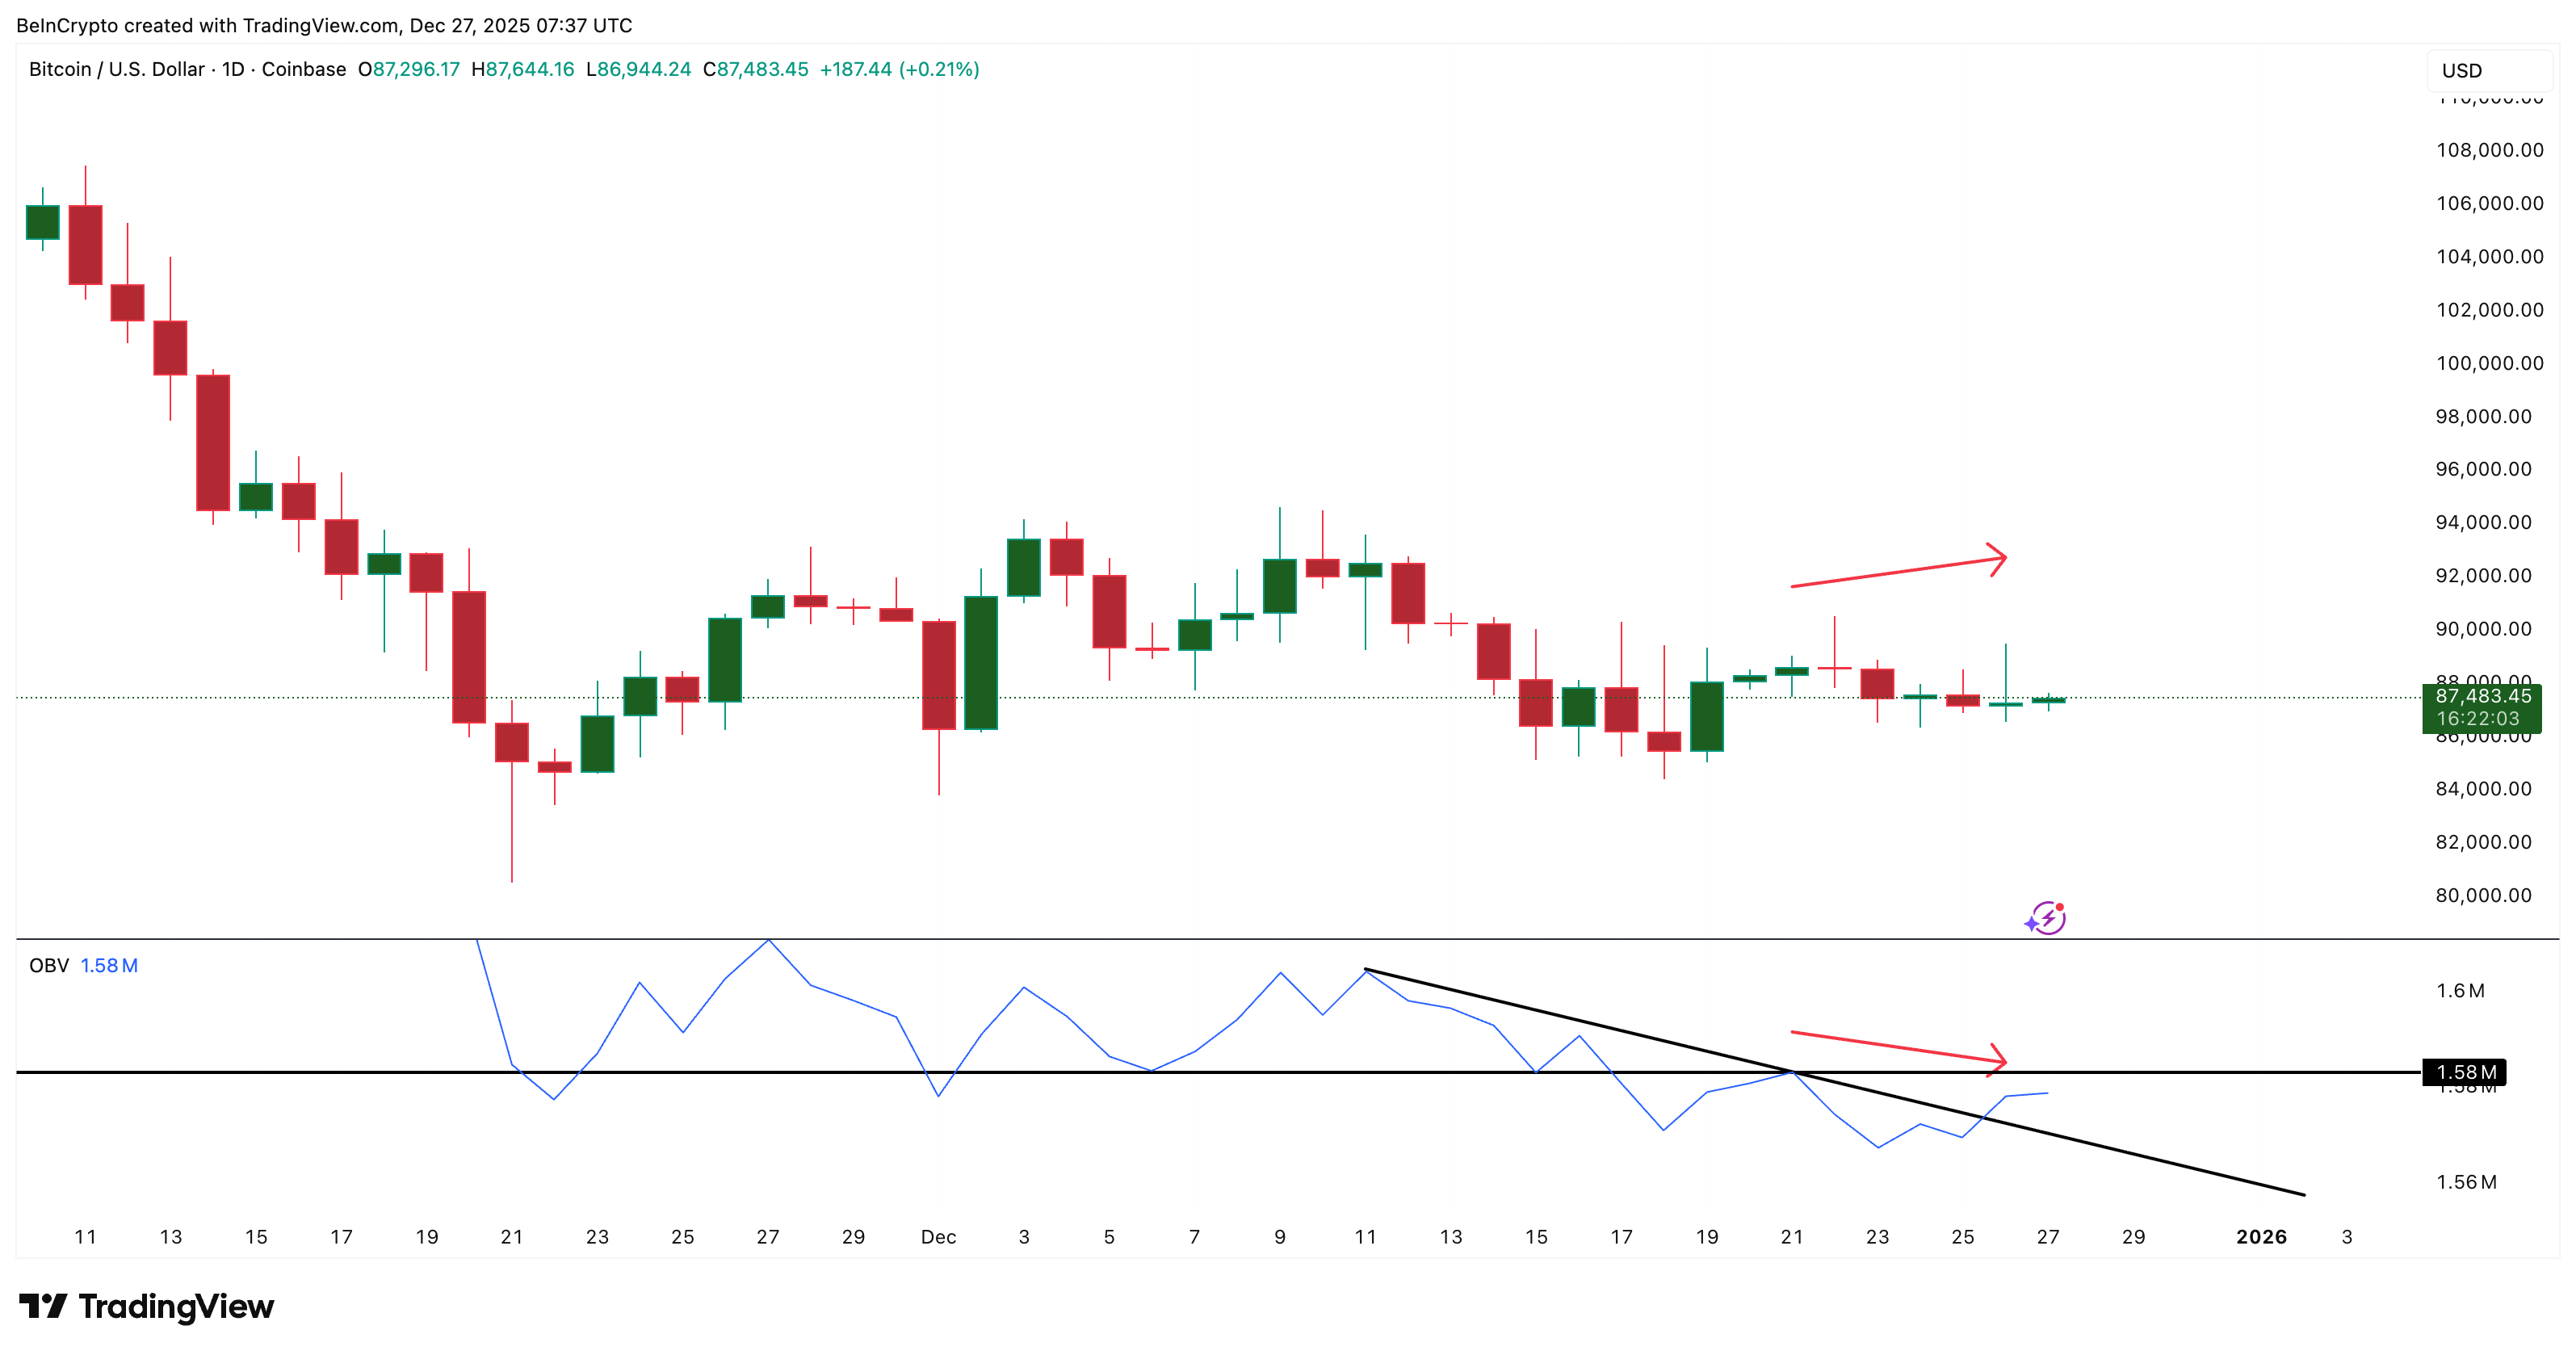
Sinyal pertama adalah On-Balance Volume (OBV). OBV mengukur tekanan beli dan jual lewat volume. Antara 21 Desember sampai 26 Desember, harga Bitcoin memang bergerak naik. Namun, OBV tidak ikut naik; justru membentuk high yang lebih rendah. Inilah OBV divergence bearish. Kondisi ini menjelaskan kenapa harga gagal breakout (terlihat dari sumbu panjang pada 26 Desember), sebab kenaikan harga kecil tidak disertai volume yang kuat.
Ingin insight token seperti ini? Daftar ke Newsletter Harian Crypto Editor Harsh Notariya di sini.
Minggu ini, OBV berhasil menembus garis tren yang menghubungkan high yang lebih rendah itu. Breakout ini menandakan tekanan beli yang lebih kuat sedang terbentuk. Namun sinyal ini belum terkonfirmasi sebelum OBV mencatat high baru di atas 1,58 juta. Bila itu terjadi, harga Bitcoin akhirnya bisa bereaksi. Itu belum terjadi sampai saat ini.
Sinyal kedua datang dari metrik net position change holder. Metrik ini melacak wallet yang menahan aset lebih dari 155 hari. Mereka adalah pelaku pasar yang geraknya paling lambat.
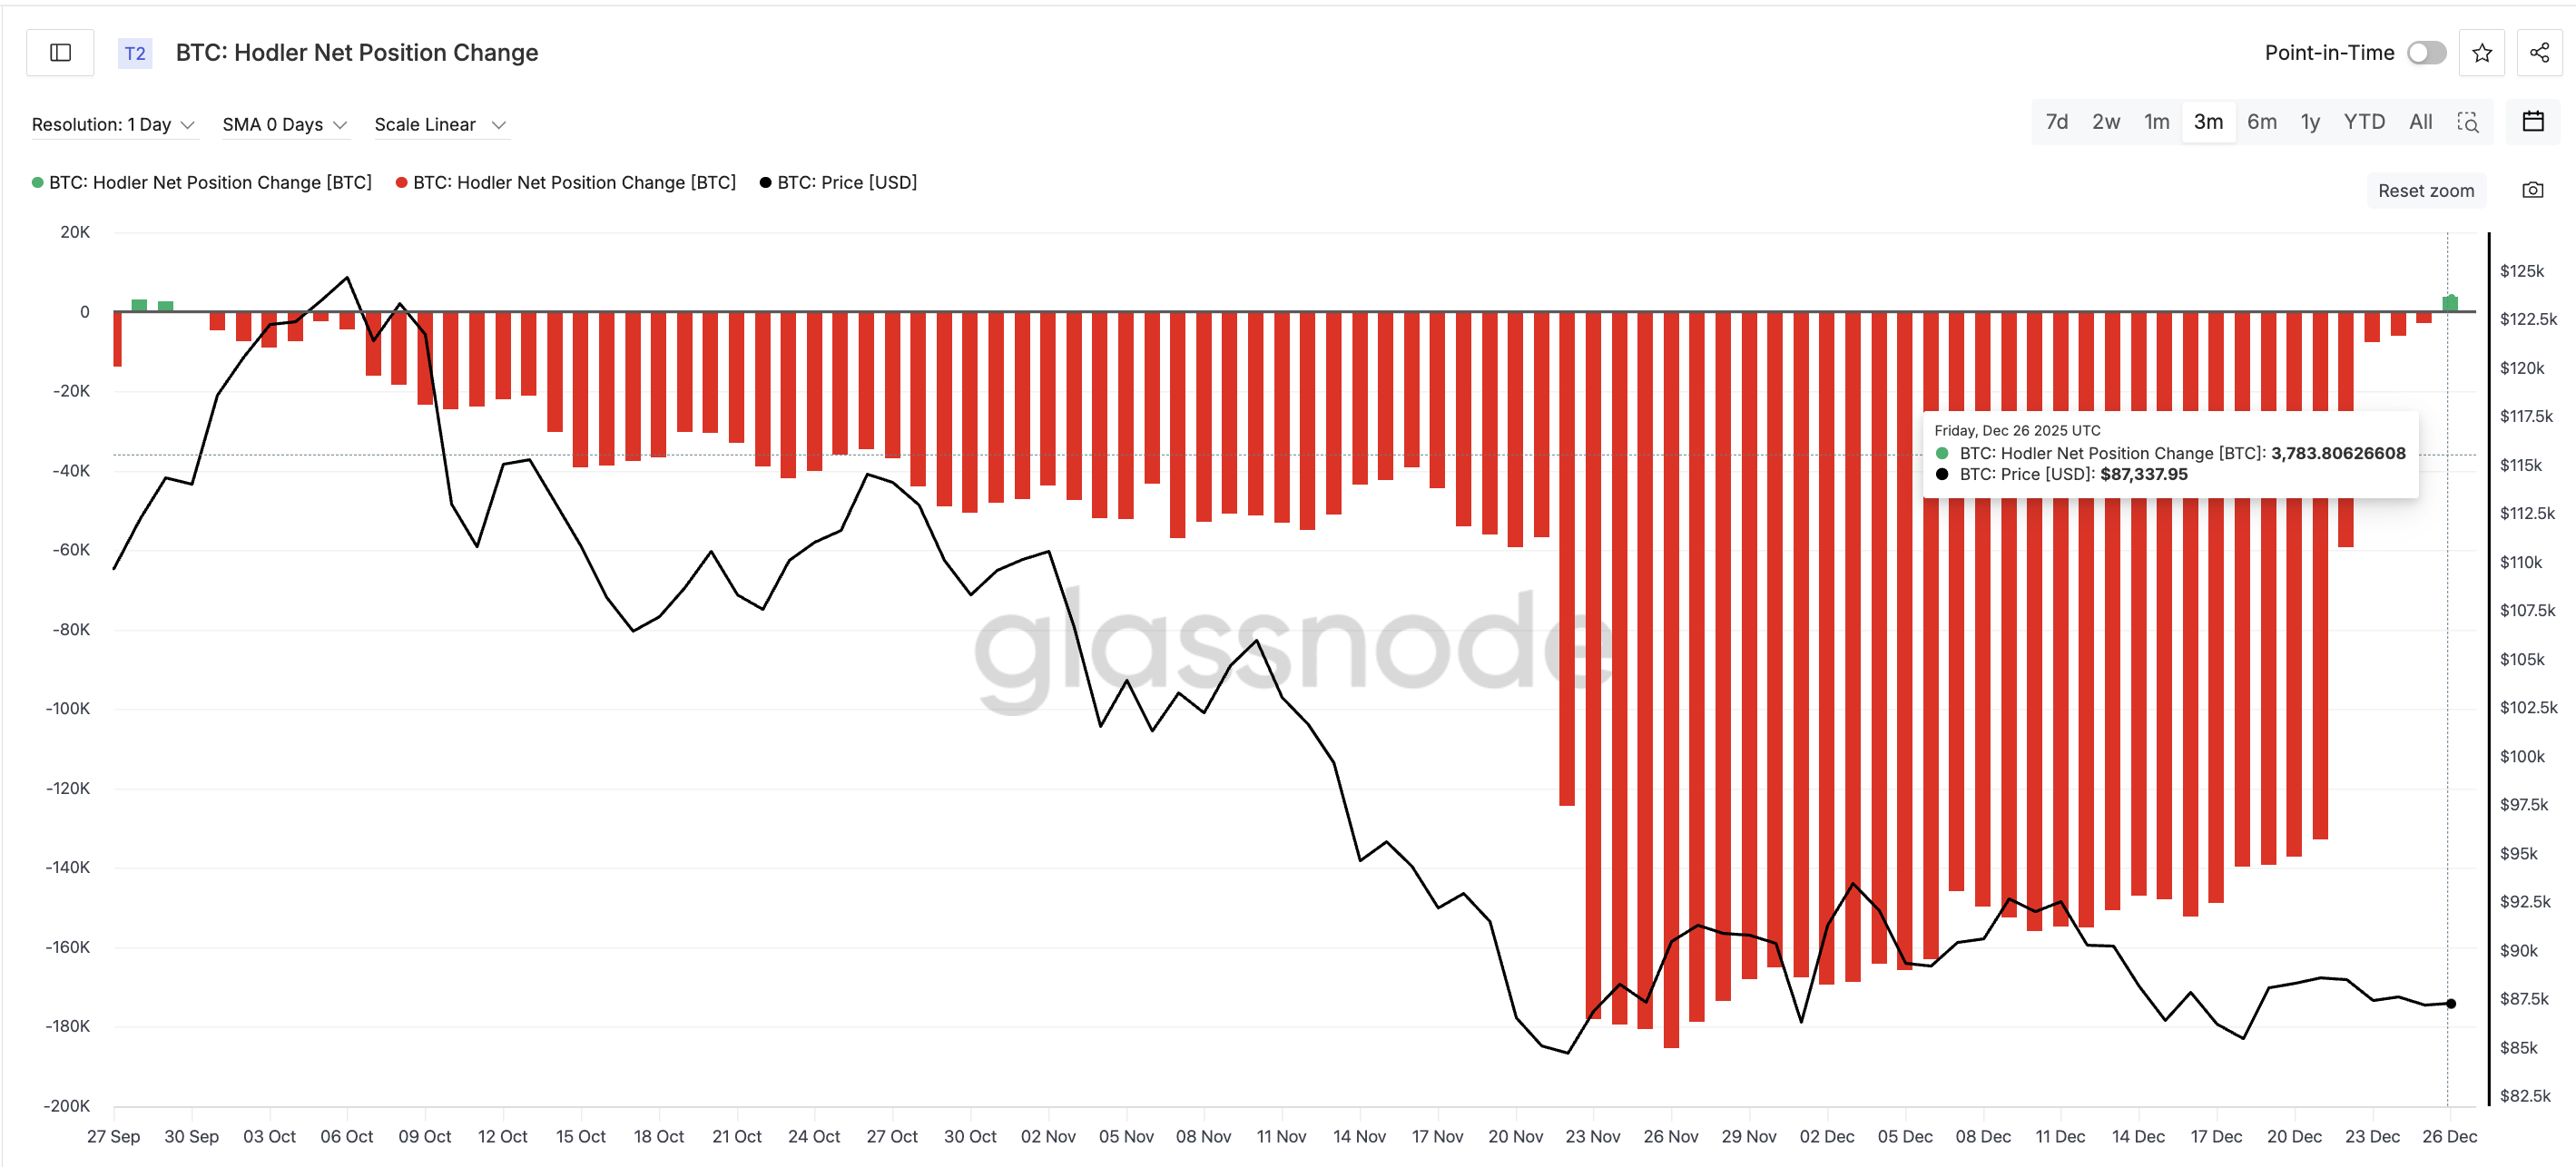
Pada 26 Desember, metrik ini berubah positif untuk pertama kalinya sejak akhir September. Holder jangka panjang menambah 3.783,8 BTC. Mereka tidak beli untuk pergerakan jangka pendek. Mereka beli dengan keyakinan. Dan ini pertama kalinya dalam hampir tiga bulan terakhir muncul keyakinan seperti itu.
Holder BTC Kembali Menambah Kepemilikan: Glassnode
Reli yang sehat butuh dua sisi. OBV harus tetap bergerak naik. Holder juga harus terus menambah kepemilikan. Jika salah satunya tidak berjalan, belum cukup untuk memicu reli.
Peta Harga Bitcoin yang Menentukan Akhir Tahun atau Awal 2026
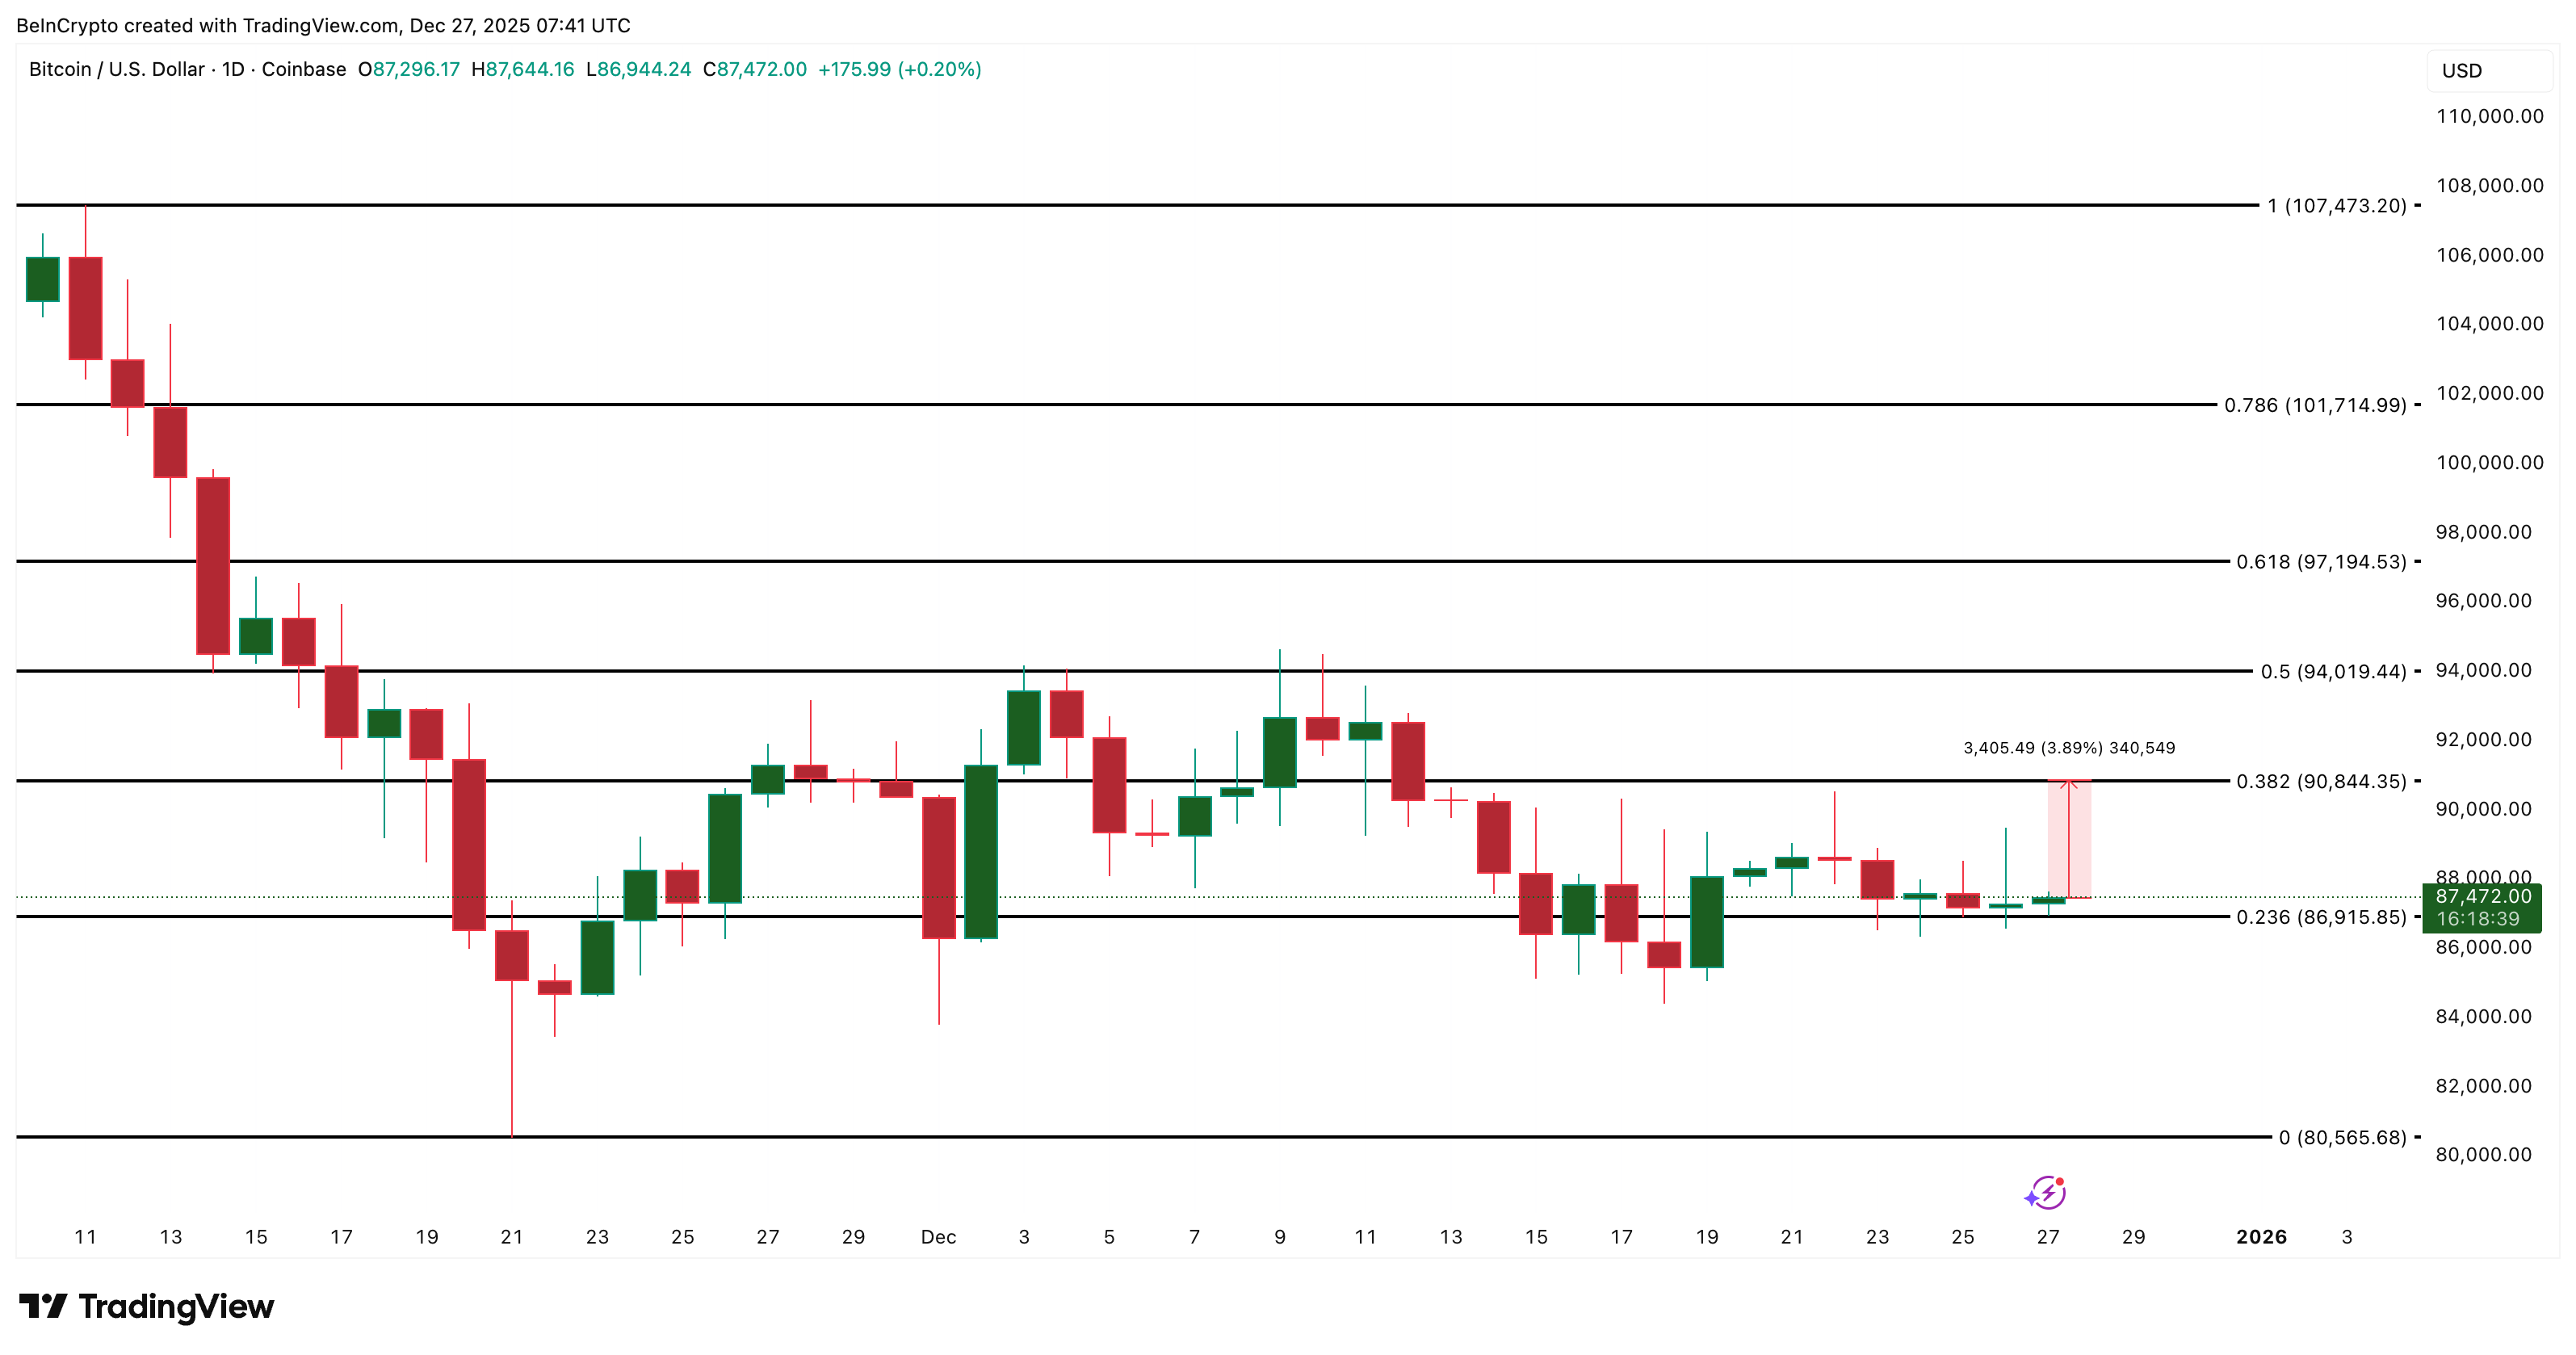
Sudah hampir dua minggu Bitcoin gagal kembali menembus US$90.840. Level tersebut menolak harga pada 12 Desember dan sejak itu selalu berhasil menahan setiap upaya breakthrough. Sampai harga berhasil menembus area ini, setiap pantulan hanya terasa sementara saja.
Di atas US$90.840, titik checkpoint utama untuk reli berikutnya berada di sekitar US$97.190. Harga BTC turun di bawah level itu pada 14 November.
Jika reli berlanjut, zona berikutnya adalah US$101.710 dan US$107.470.
Di sisi bawah, support Bitcoin berada di level US$86.915. Support ini bertahan sejak 19 Desember. Jika level ini hilang, ada potensi turun hingga US$80.560. Likuiditas rendah pada penghujung tahun ikut menambah risiko penurunan. Namun, jika melihat bagaimana investor jangka panjang memposisikan diri, harga Bitcoin berpeluang mencoba reli menuju US$90.840 dan bahkan lebih tinggi jika support di US$86.910 masih kuat.
The Bitcoin price has decreased by almost 2% over the last 24 hours and is down nearly 3% from yesterday’s peak. At first glance, nothing about the price appears exciting.
However, something beneath the chart, especially on-chain, has changed for the first time in almost three months, and something else changed this week. These two shifts do not confirm a rally as 2026 approaches, but they might be the first building blocks of one.
A Momentum Shift Begins, but Needs Proof
Two signals have appeared simultaneously. They are separate, but the timing matters.
The first is the On-Balance Volume (OBV). OBV measures buying and selling pressure through volume. Between December 21 and December 26, Bitcoin’s price trended higher. OBV did not follow. It made lower highs. That is a bearish OBV divergence. It explains why the price failed to break through (long wick on December 26), as volume didn’t accompany the minor price rise.
Want more token insights like this? Sign up for Editor Harsh Notariya’s Daily Crypto Newsletter here.
This week, OBV broke above the trend line that connected those lower highs. That breakout suggests stronger buying pressure is forming. The signal is not confirmed until OBV makes a higher high above 1.58 million. If that happens, the Bitcoin price could finally react. That has not happened yet.
The second signal comes from the Hodler net position change metric. This tracks wallets that hold for longer than 155 days. They are the slowest movers in the market.
On December 26, this metric flipped positive for the first time since late September. Long-term holders added 3,783.8 BTC. They do not buy for short-term moves. They buy for conviction. And this is the first time in almost three months that conviction has shown up.
Bitcoin has failed to reclaim $90,840 for almost two weeks. That level rejected the price on December 12 and has blocked every attempt since. Until price clears that level, every bounce feels temporary.
Above $90,840, the first real relief rally checkpoint sits near $97,190. The BTC price fell below that level on November 14.
If the rally extends, $101,710 and $107,470 are the next zones.
On the downside, support sits at $86,915. It has held since December 19. Losing it opens room to $80,560. Low year-end liquidity increases that risk. For now, based on how long-term investors are positioning, the Bitcoin price can attempt a relief rally toward $90,840 and even beyond if the support at $86,910 holds.
Ripple Labs makin memperkuat kehadirannya di Jepang, dengan memanfaatkan hubungan lama bersama institusi keuangan tradisional di negara tersebut. Strategi ini bertujuan untuk meningkatkan adopsi dan minat pada XRP Ledger (XRPL).
Minggu ini, Asia Web3 Alliance Japan dan Web3 Salon meluncurkan Japan Financial Infrastructure Innovation Program. Inisiatif ini dirancang untuk mendukung startup Jepang yang mengembangkan solusi keuangan digital generasi berikutnya yang sesuai regulasi di atas XRP Ledger.
Strategi Ripple di Jepang Uji Apakah Institusi Bisa Angkat XRP
Program ini mulai menerima aplikasi pada 19 Desember dan menawarkan hibah senilai US$10.000 untuk setiap startup. Fokusnya hanya pada tiga bidang bernilai tinggi, yaitu stablecoin, tokenisasi aset dunia nyata, dan infrastruktur kredit.
“Jepang memberikan peluang luar biasa untuk inovasi blockchain, didukung oleh kerangka regulasi yang visioner dan talenta yang melimpah. Program ini menunjukkan komitmen Ripple untuk membangun ekosistem yang dinamis di mana startup dapat memanfaatkan kecepatan, biaya rendah, dan keandalan XRP Ledger guna menciptakan manfaat nyata dan mentransformasi infrastruktur keuangan,” ujar Christina Chan, Senior Director of Developer Growth di RippleX, dalam keterangan resminya.
Analis melihat program ini sebagai jalur biaya rendah untuk menemukan kandidat penerima dana dari pool modal Ripple yang jauh lebih besar, termasuk dana XRP senilai 1 miliar yang diperuntukkan bagi pengembang di Jepang dan Korea.
Program ini telah mendapatkan dukungan dari daftar pemain institusi besar, termasuk Mizuho Bank, SMBC Nikko Securities, dan Securitize Japan.
@AWAJ_official and @Web3Salon, with support from #JETRO and @RippleXrpie, are proud to announce the Japan Financial Infrastructure Innovation Program (JFIIP) 🇯🇵 during the Japan Fintech Week
— Asia Web3 Alliance Japan (AWAJ) (@AWAJ_official) December 24, 2025
Meski inisiatif ini didukung oleh korporasi ternama, peluncurannya terjadi di saat yang cukup genting bagi jaringan. Sementara Ripple menggaungkan adopsi institusional, penggunaan nyata XRPL justru memperlihatkan tren kontraksi.
Berdasarkan data dari DefiLlama, Total Value Locked (TVL) di XRPL anjlok dalam beberapa bulan terakhir. TVL turun dari US$120 juta pada puncaknya di bulan Juli menjadi sekitar US$62 juta pada saat berita ini ditulis.
Koreksi hampir 50% ini mengindikasikan bahwa modal sedang keluar dari protokol DeFi di jaringan meskipun kemitraan dengan korporasi semakin meluas.
Di sisi lain, penurunan pasar kripto yang lebih luas sepertinya juga berkontribusi pada penurunan tersebut, karena harga Bitcoin turun 30% dari puncaknya di bulan Oktober yang lebih dari US$126.000.
Selain itu, dorongan ke tokenisasi aset juga menghadapi persaingan sengit. Menurut Rwa.xyz, saat ini XRPL menempati peringkat sembilan secara global untuk aset yang ditokenisasi, dengan nilai sekitar US$213 juta.
Meskipun jumlah tersebut cukup besar, XRPL masih jauh tertinggal dari jaringan seperti Ethereum dan pesaing baru lain yang sudah menguasai sebagian besar pasar RWA.
Dengan mempertimbangkan hal ini, program JFIIP bukan sekadar akselerator startup. Dengan menyatu dalam infrastruktur perbankan Jepang, Ripple berharap bisa membangun ekosistem kuat yang tahan terhadap volatilitas spekulatif pasar kripto secara keseluruhan.
Ripple Labs is doubling down on its presence in Japan, drawing on longstanding relationships with the country’s traditional financial institutions. The strategy is aimed at increasing adoption and interest in the XRP Ledger (XRPL).
This week, Asia Web3 Alliance Japan and Web3 Salon launched the Japan Financial Infrastructure Innovation Program. The initiative is designed to support Japanese startups developing next-generation, compliant digital financial solutions on the XRP Ledger.
Ripple’s Japan Strategy Tests Whether Institutions Can Lift XRP
The program opened applications on December 19 and is offering a $10,000 grant per startup. It is narrowly focused on three high-value verticals, including stablecoins, real-world asset tokenization, and credit infrastructure.
“Japan offers an overwhelming opportunity for blockchain innovation, supported by a forward-thinking regulatory framework and deep talent pool. This program represents Ripple’s commitment to fostering a vibrant ecosystem where startups can leverage the speed, low cost, and reliability of the XRP Ledger to create real-world benefits and transform financial infrastructure,” Christina Chan, Senior Director of Developer Growth at RippleX, said.
Analysts view it as a low-cost funnel for identifying candidates for Ripple’s significantly larger capital pool, including the 1 billion XRP fund dedicated to developers in Japan and Korea.
The program has secured backing from a formidable roster of establishment players, including Mizuho Bank, SMBC Nikko Securities, and Securitize Japan.
@AWAJ_official and @Web3Salon, with support from #JETRO and @RippleXrpie, are proud to announce the Japan Financial Infrastructure Innovation Program (JFIIP) 🇯🇵 during the Japan Fintech Week
— Asia Web3 Alliance Japan (AWAJ) (@AWAJ_official) December 24, 2025
Despite the initiative’s high-profile corporate backing, it comes at a precarious moment for the network. While Ripple touts institutional adoption, the underlying usage of the XRPL tells a conflicting story of contraction.
According to data from DefiLlama, the Total Value Locked (TVL) on the XRPL has plummeted in recent months. The TVL has fallen from a July high of $120 million to roughly $62 million as of press time.
This nearly 50% drawdown suggests that capital is exiting the network’s DeFi protocols even as corporate partnerships expand.
Meanwhile, the broader crypto market downturn likely contributed to the drawdown, as Bitcoin has fallen 30% from its October high of more than $126,000.
Furthermore, the push into asset tokenization faces stiff competition. According to Rwa.xyz, XRPL currently ranks ninth globally in tokenized assets, with approximately $213 million in assets.
While substantial, this lags significantly behind networks like Ethereum and newer competitors that have captured the lion’s share of the RWA market.
Considering this, the JFIIP program is more than a startup accelerator. By entrenching itself in Japan’s banking infrastructure, Ripple hopes to create a sticky ecosystem that is immune to the speculative volatility of the broader crypto market.
Strategy (formerly MicroStrategy) is the largest corporate holder of Bitcoin, owning 671,268 BTC, which represents over 3.2% of all Bitcoin in circulation. That makes the company a high-risk keystone in the Bitcoin ecosystem.
If it falls apart, the impact could be larger than the 2022 FTX collapse. Here’s why that threat is real, what could trigger it, and how bad the fallout could be.
MicroStrategy Is a Leveraged Bitcoin Bet
MicroStrategy’s entire identity is now tied to Bitcoin. The company spent over $50 billion buying BTC, mostly using debt and stock sales. Its software business brings in just $460 million a year, which is a fraction of its exposure.
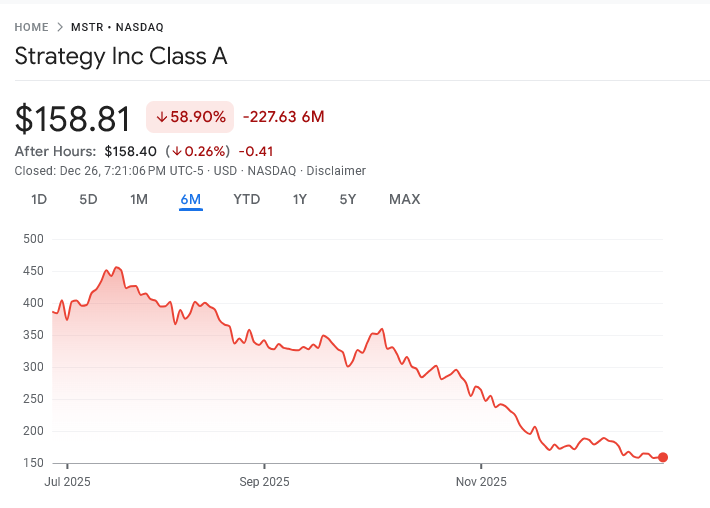
As of December 2025, its stock trades well below the value of its Bitcoin holdings. The market value is approximately $45 billion, but its BTC is worth around $59–60 billion.
MicroStrategy’s Share Prices Over the Second Half of 2025. Source: Google Finance
Investors are discounting its assets because of concerns about dilution, debt, and sustainability.
Its average BTC cost basis is around $74,972, and most of its recent buys were near Bitcoin’s peak in Q4 2025.
More than 95% of its valuation hinges on the price of Bitcoin.
If BTC drops sharply, the company could be trapped — holding billions in debt and preferred equity with no way out.
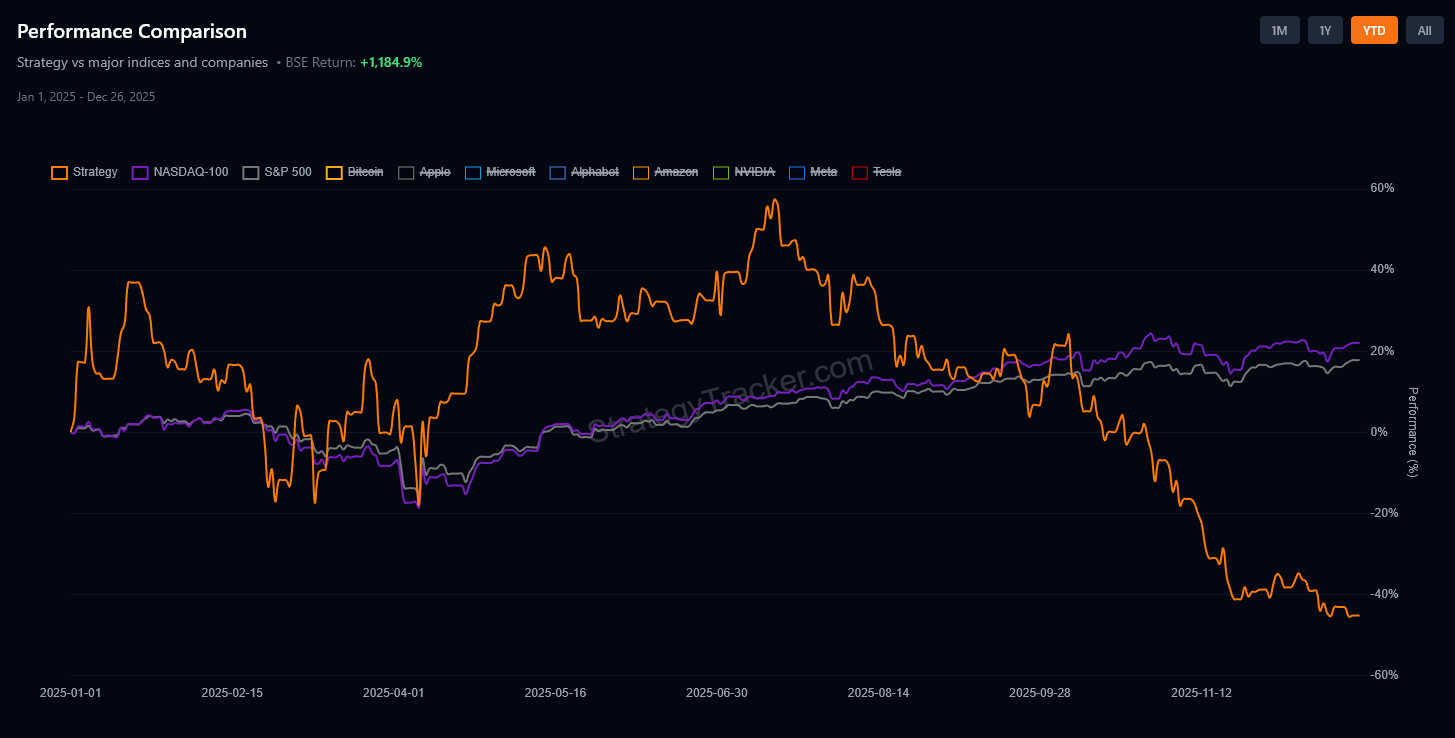
MSTR Stock Performance Comparison with NASDAQ-100 and S&P 500 in 2025. Source: Saylor Tracker
What Makes This a Black Swan Risk?
MicroStrategy used aggressive tactics to fund Bitcoin buys. It sold common stock and issued new types of preferred shares.
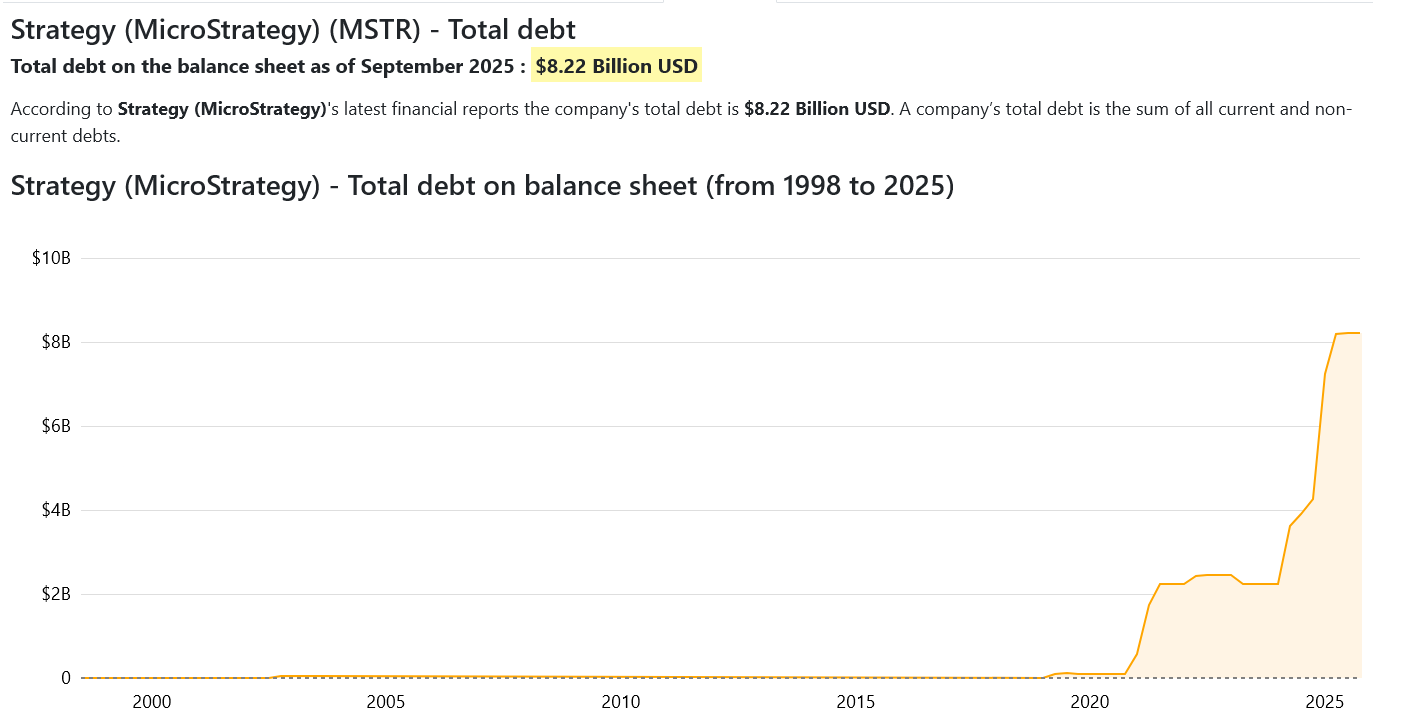
It now owes over $8.2 billion in convertible debt and has more than $7.5 billion in preferred stock. These financial tools require large cash outflows: $779 million annually in interest and dividends.
At the current levels, if Bitcoin crashes below $13,000, MicroStrategy could become insolvent. That’s not likely in the near term, but BTC’s history shows that 70–80% drawdowns are common.
A large crash, especially if paired with a liquidity crunch or ETF-driven volatility, could push the company into distress.
Unlike FTX, MicroStrategy is not an exchange. But the effect of its failure could be deeper. It owns more Bitcoin than any entity except a few ETFs and governments.
Forced liquidation or panic over MicroStrategy’s collapse could drive BTC’s price down sharply — creating a feedback loop across crypto markets.
As of late 2025, it holds $2.2 billion in reserves. This is enough to cover two years of payouts. But that buffer could vanish if BTC falls and capital markets close.
How Likely Is a Collapse for Michael Saylor’s Strategy?
Probability isn’t binary. But the risk is rising.
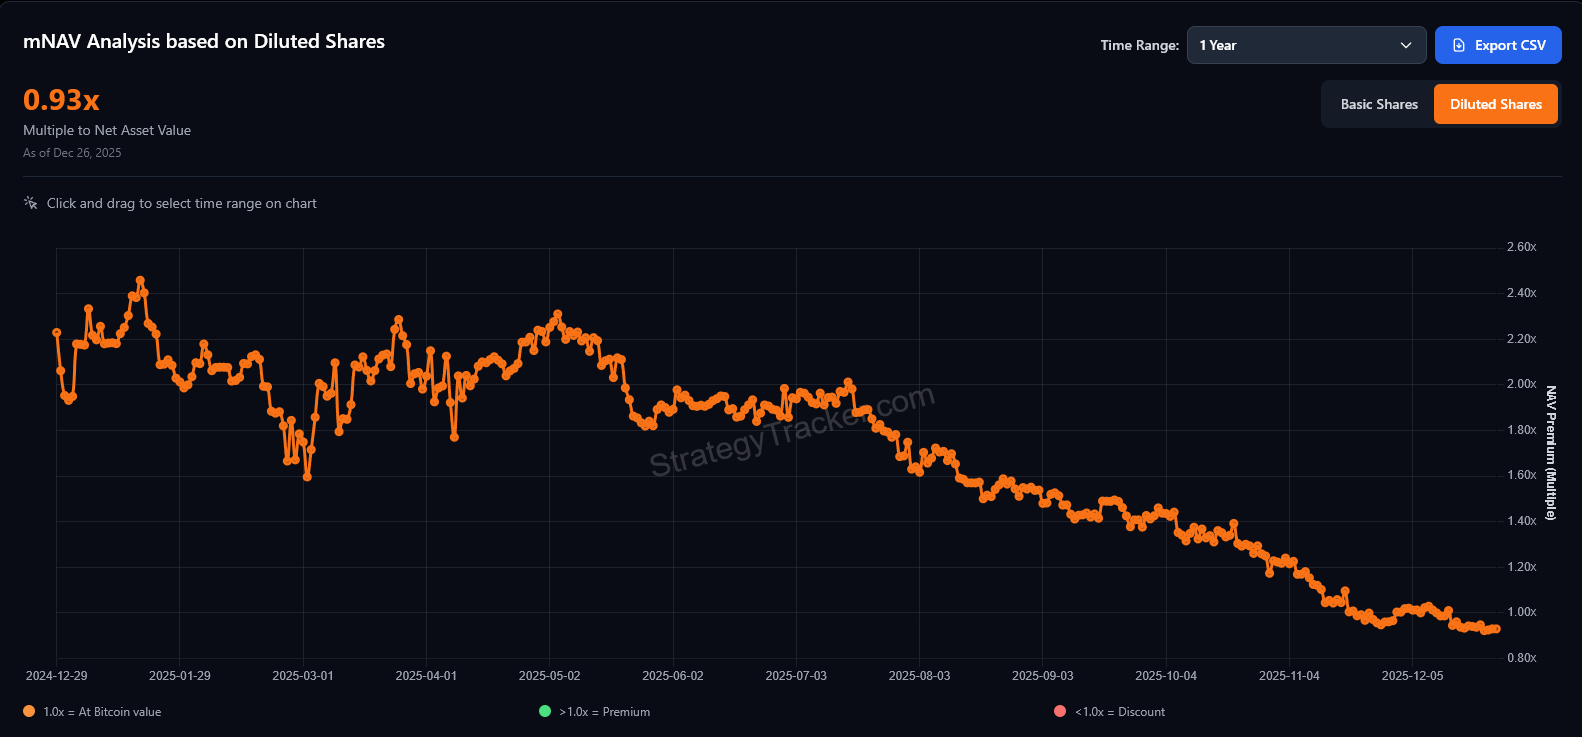
MicroStrategy’s current position is fragile. Its stock has fallen 50% this year. Its mNAV is below 0.8×. Institutional investors are shifting to Bitcoin ETFs, which are cheaper and less complex.
Index funds may drop MSTR due to its structure, triggering billions in passive outflows.
MicroStrategy mNAV. Source: Saylor Tracker
If Bitcoin falls below $50,000 and stays there, the company’s market cap could fall below its debt load. At that point, its ability to raise capital could dry up — forcing painful decisions, including asset sales or restructuring.
The odds of a total collapse in 2026 are low, but not remote. A rough estimate might place the probability between 10–20%, based on current balance sheet risk, market behavior, and Bitcoin volatility.
But if it does happen, the damage could exceed FTX’s collapse. FTX was a centralized exchange. MicroStrategy is a key holder of Bitcoin’s supply.
If its holdings flood the market, Bitcoin’s price and confidence could be hit hard. This would potentially trigger a broader selloff across crypto.
Strategy (sebelumnya MicroStrategy) adalah perusahaan pemilik Bitcoin terbesar, memegang 671.268 BTC, setara dengan lebih dari 3,2% dari semua Bitcoin yang beredar. Hal ini membuat perusahaan menjadi titik kunci berisiko tinggi dalam ekosistem Bitcoin.
Jika perusahaan ini runtuh, dampaknya bisa melebihi kejatuhan FTX pada tahun 2022. Inilah alasan ancaman tersebut benar-benar nyata, faktor pemicunya, serta seberapa parah akibat lanjutannya.
MicroStrategy adalah taruhan Bitcoin dengan leverage
Seluruh identitas MicroStrategy kini berkaitan erat dengan Bitcoin. Perusahaan ini telah menghabiskan lebih dari US$50 miliar untuk membeli BTC, sebagian besar menggunakan utang dan penjualan saham. Bisnis perangkat lunaknya hanya menghasilkan penghasilan sekitar US$460 juta per tahun, jumlah yang jauh lebih kecil dibandingkan eksposur totalnya.
Pada Desember 2025, harga sahamnya diperdagangkan jauh di bawah nilai kepemilikan Bitcoinnya. Nilai pasar perusahaan sekitar US$45 miliar, sedangkan BTC miliknya bernilai hampir US$59–60 miliar.
Harga Saham MicroStrategy pada Paruh Kedua Tahun 2025 | Sumber: Google Finance
Para investor mengurangi nilai asetnya karena kekhawatiran terkait dilusi, utang, dan keberlanjutan perusahaan.
Rata-rata harga beli BTC perusahaan ini sekitar US$74.972, dan sebagian besar pembelian terbarunya terjadi saat harga Bitcoin mendekati puncak pada kuartal 4 tahun 2025.
Lebih dari 95% valuasi perusahaan ini sangat bergantung pada harga Bitcoin.
Jika harga BTC anjlok drastis, perusahaan ini bisa terjebak — memegang utang dan ekuitas preferen bernilai miliaran Dolar tanpa jalan keluar.
Perbandingan Performa Saham MSTR dengan NASDAQ-100 dan S&P 500 di Tahun 2025 | Sumber: Saylor Tracker
Apa yang Membuat Ini Menjadi Risiko Black Swan?
MicroStrategy memakai strategi agresif untuk mendanai pembelian Bitcoin. Mereka menjual saham biasa dan menerbitkan jenis saham preferen yang baru.
Sekarang, perusahaan memiliki utang konversi lebih dari US$8,2 miliar serta lebih dari US$7,5 miliar saham preferen. Instrumen keuangan ini menuntut aliran dana keluar besar: US$779 juta per tahun untuk bunga dan dividen.
Pada kondisi saat ini, jika harga Bitcoin jatuh di bawah US$13.000, MicroStrategy bisa saja mengalami kebangkrutan. Hal ini memang tidak mungkin terjadi dalam waktu dekat, tapi sejarah BTC menunjukkan penurunan harga 70–80% sudah sering terjadi.
Kejatuhan harga besar, apalagi jika terjadi krisis likuiditas atau volatilitas akibat ETF, bisa saja mendorong perusahaan ini mengalami masalah serius.
Tidak seperti FTX, MicroStrategy memang bukan exchange. Tetapi dampak kegagalannya bisa lebih dalam. Perusahaan ini memegang lebih banyak Bitcoin daripada pihak mana pun kecuali beberapa ETF dan pemerintahan.
Likuidasi paksa atau kepanikan akibat kejatuhan MicroStrategy bisa menyebabkan harga BTC anjlok — lalu menciptakan efek domino di pasar aset kripto.
Hingga akhir 2025, perusahaan memegang cadangan senilai US$2,2 miliar. Dana ini cukup untuk dua tahun pembayaran. Tapi cadangan itu bisa habis jika harga BTC anjlok dan pasar modal tertutup.
Seberapa Mungkin Strategi Michael Saylor Mengalami Collapse?
Risiko ini tidak hitam putih. Namun, risikonya makin meningkat.
Posisi MicroStrategy saat ini memang sangat rapuh. Harga sahamnya sudah turun 50% tahun ini. Nilai mNAV-nya di bawah 0,8×. Para investor institusional juga mulai beralih ke ETF Bitcoin karena lebih murah dan lebih sederhana.
Reksa dana indeks bisa saja melepas saham MSTR karena struktur perusahaannya, sehingga terjadi arus keluar dana pasif bernilai miliaran Dolar.
mNAV MicroStrategy | Sumber: Saylor Tracker
Jika Bitcoin turun di bawah US$50.000 dan tetap di sana, kapitalisasi pasar perusahaan bisa turun di bawah beban utangnya. Saat itu, kemampuan perusahaan untuk mengumpulkan modal bisa habis — sehingga harus mengambil keputusan sulit, termasuk penjualan aset atau restrukturisasi.
Kemungkinan terjadinya kehancuran total di tahun 2026 memang kecil, tapi bukan tidak mungkin. Perkiraan kasar menempatkan peluangnya di antara 10–20%, berdasarkan risiko neraca, perilaku pasar, dan volatilitas Bitcoin saat ini.
Tapi jika hal itu terjadi, kerugiannya bisa lebih besar dari kehancuran FTX. FTX adalah exchange terpusat. MicroStrategy adalah salah satu holder utama Bitcoin.
Jika kepemilikan mereka membanjiri pasar, harga Bitcoin dan kepercayaan bisa terpukul keras dan berpotensi memicu aksi jual yang lebih luas di seluruh aset kripto.
Few topics divide the crypto industry more than politics. Donald Trump is often referred to as “America’s first crypto president,” while the Biden administration earned a reputation for being hostile toward the sector.
But when rhetoric is stripped away and replaced with market data, the picture becomes more nuanced. The key question is not which administration spoke more favorably about crypto, but under whose leadership Bitcoin ultimately performed better.
Bitcoin Performance: The Numbers Tell a Clear Story
In the 2024 United States presidential election, Trump positioned himself as a pro-crypto candidate, vowing to make the US the “crypto capital of the world.” He promised to halt anti-crypto actions, rein in SEC crackdowns, and, in his own words:
“End Joe Biden’s war on crypto and we will ensure that the future of crypto and the future of Bitcoin will be made in America.”
This fueled optimism in the market and ignited hopes for a bull run. Fast forward to near the end of 2025, and Bitcoin is down nearly 5%.
By comparison, during Biden’s first year as president, the world’s largest cryptocurrency gained roughly 65%. Performance weakened in 2022, but momentum returned in the following years.
Bitcoin rebounded strongly, rising approximately 155% in 2023 and a further 120.7% in 2024.
Year
Bitcoin return (%)
2021
65%
2022
– 64.2%
2023
155%
2024
120.7%
2025 (As of December 26)
-5%
When examining Trump’s first term as president, an analyst noted that it was “the greatest crypto bull run” in history, during which the total cryptocurrency market capitalization increased by roughly 115 times from the beginning of his term to its end.
“Biden’s term returned 4.5x from beginning to end, and even at the worst moment, it never went below the annual open for his term. Trump’s 2nd term so far is below annual open, but 3 more years to go,” the pseudonymous analyst wrote.
Bitcoin Under Trump
So what actually happened this year? The pullback is not something that can be understood by looking at headline 2025 returns alone.
In January, momentum was broadly on Bitcoin’s side. Ahead of Trump’s inauguration, BTC rallied above $109,000, marking a new all-time high at the time. There were also developments on the regulatory side, with the SEC creating a task force to offer a transparent regulatory framework for digital assets.
Nonetheless, Trump’s next moves erased all these gains. After he announced tariffs on the EU and later expanded on them at Liberation Day, cryptocurrency markets declined alongside equities.
Notably, the announcement of a pause led to a modest recovery. This highlighted the market’s sensitivity to broader macroeconomic developments and pointed to increased volatility.
Meanwhile, adoption continued to rise as state-level Bitcoin reserve initiatives and institutional involvement increased. Bitcoin’s price continued to trend higher, posting positive returns for four consecutive months from April through July.
A key trend during this period was the emergence of digital asset treasuries (DATs). Public companies increasingly began adopting Bitcoin as a reserve asset, following the playbook popularized by Micro (Strategy).
Bitcoin benefited from this shift, as many experts argued institutional involvement could help reduce volatility and signal the asset’s maturation within traditional finance.
As confidence grew, so did the risk appetite and the use of leverage. High-risk, highly leveraged traders drew widespread attention. On the macroeconomic front, the Fed slashed interest rates in September. This was again bullish for risk assets.
Bitcoin went on to reach a new all-time high in October, peaking at $125,761 on October 6. Many projected further upside, with targets ranging from $185,000 to $200,000 by year-end.
This optimism was supported by favorable macroeconomic catalysts and Bitcoin’s historically strong performance during the fourth quarter.
BeInCrypto reported that on October 11, Trump’s announcement of 100% tariffs on China pulled the market lower. Over $19 billion in leveraged positions were wiped out, resulting in significant losses for many traders.
🚨 BIGGEST WIPEOUT SINCE LUNA, COVID & FTX.
Heading into Trump’s 100% China tariff announcement, markets got the pullback they were waiting for.
Nearly $20 BILLION in crypto liquidations in just 24 hours, a record wipeout. 😱
“It also appears to be a structural and mechanical downturn. It all began with institutional outflows in mid-to-late October. In the first week of November, crypto funds saw -$1.2 billion of outflows. The problem becomes excessive levels of leverage AMID these outflows…Excessive levels of leverage have resulted in a seemingly hypersensitive market,” The Kobeissi Letter posted in November.
Bitcoin dropped 17.67% in November and has since lost an additional 1.7% of its value this month, according to Coinglass data.
From Bitcoin ETFs to Altcoins: Regulatory Changes and Market Response
The Trump and Biden administrations differed on several key issues, one of which was crypto ETFs. Under the Biden administration, the SEC initially took a far more cautious approach to the crypto sector. This stance extended to crypto ETFs.
However, the regulatory position shifted following a ruling by the US Court of Appeals for the DC Circuit, which ordered the SEC to reconsider Grayscale Investments’ application to convert its flagship GBTC fund into a spot Bitcoin ETF.
Notably, after Gary Gensler’s departure from the SEC, asset managers were quick to file multiple applications for altcoin ETFs. Firms including Bitwise, 21 Capital, and Canary Capital, among others, submitted filings to launch a range of crypto-based investment products.
In September, the SEC approved generic listing standards, eliminating the need for case-by-case approvals. Following this shift, ETFs linked to assets such as SOL, HBAR, XRP, LTC, LINK, and DOGE entered the market.
In November, Canary Capital’s XRP ETF saw $58.6 million in trading volume on its first day, ranking as the strongest debut among more than 900 ETFs launched in 2025. Bitwise’s Solana ETF also attracted significant interest, generating $56 million in first-day volume, while other products recorded comparatively lower activity.
From a regulatory standpoint, the ETFs have increased market access, and the ruling reduced barriers for issuers. However, early performance data suggest that the introduction of additional crypto ETFs has not yet translated into a proportional increase in aggregate market inflows.
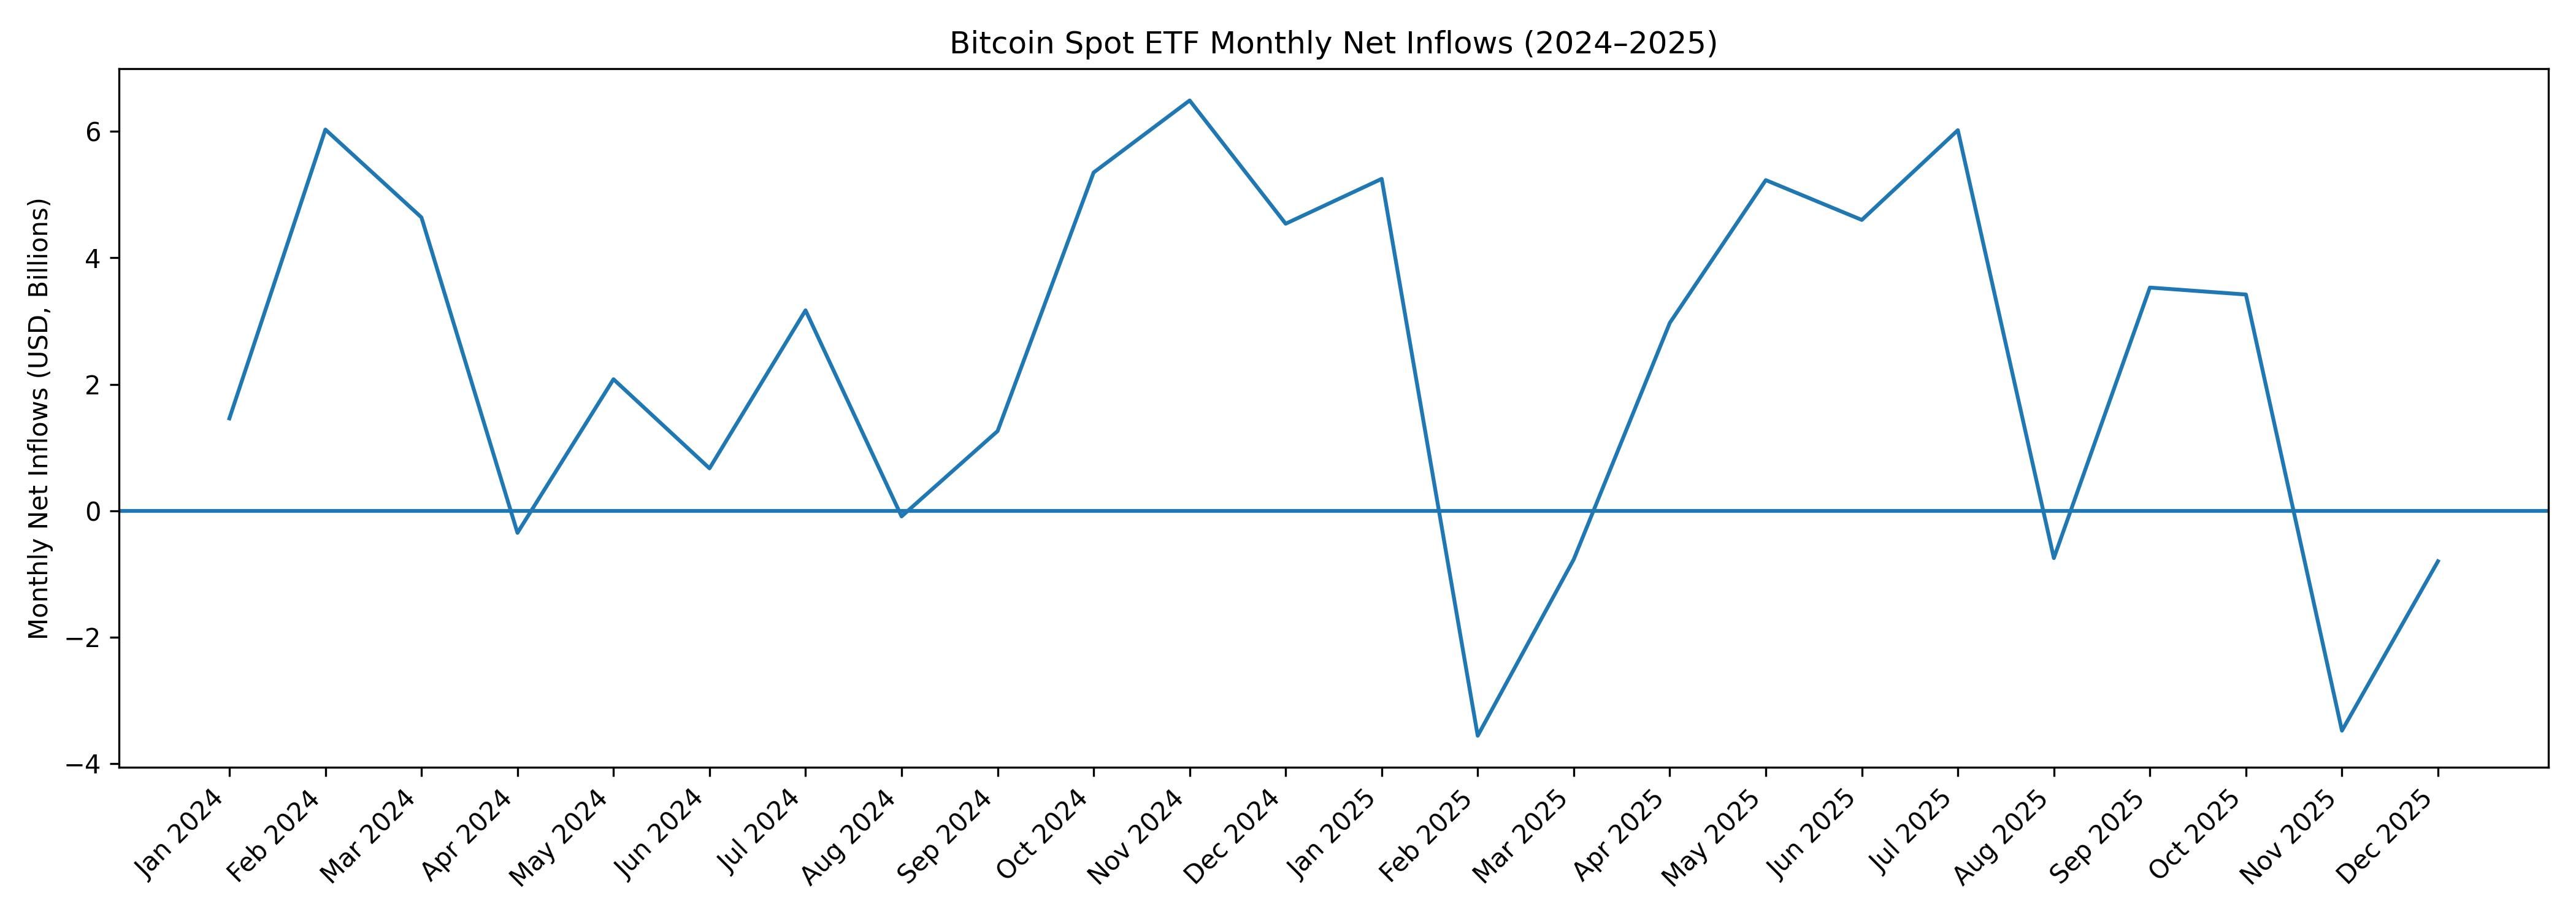
In 2024, spot Bitcoin ETFs attracted approximately $35.2 billion in net inflows. In 2025, inflows into Bitcoin ETFs slowed to $22.16 billion according to SoSoValue data. This divergence suggests that the growth in ETF offerings may have coincided with a redistribution of capital across products rather than an expansion of total crypto exposure.
Bitcoin ETF Flows. Source: Data Curated by BeInCrypto
Inside the Trump Family’s Crypto Empire
Although Donald Trump’s influence on the market is clear, he has also become directly involved in the crypto space. In January, the president introduced a meme coin, soon followed by a closely resembling token launched by Melania Trump.
In March, US President Donald Trump’s sons, Eric Trump and Donald Trump Jr., partnered with Hut 8 to launch American Bitcoin Corp.
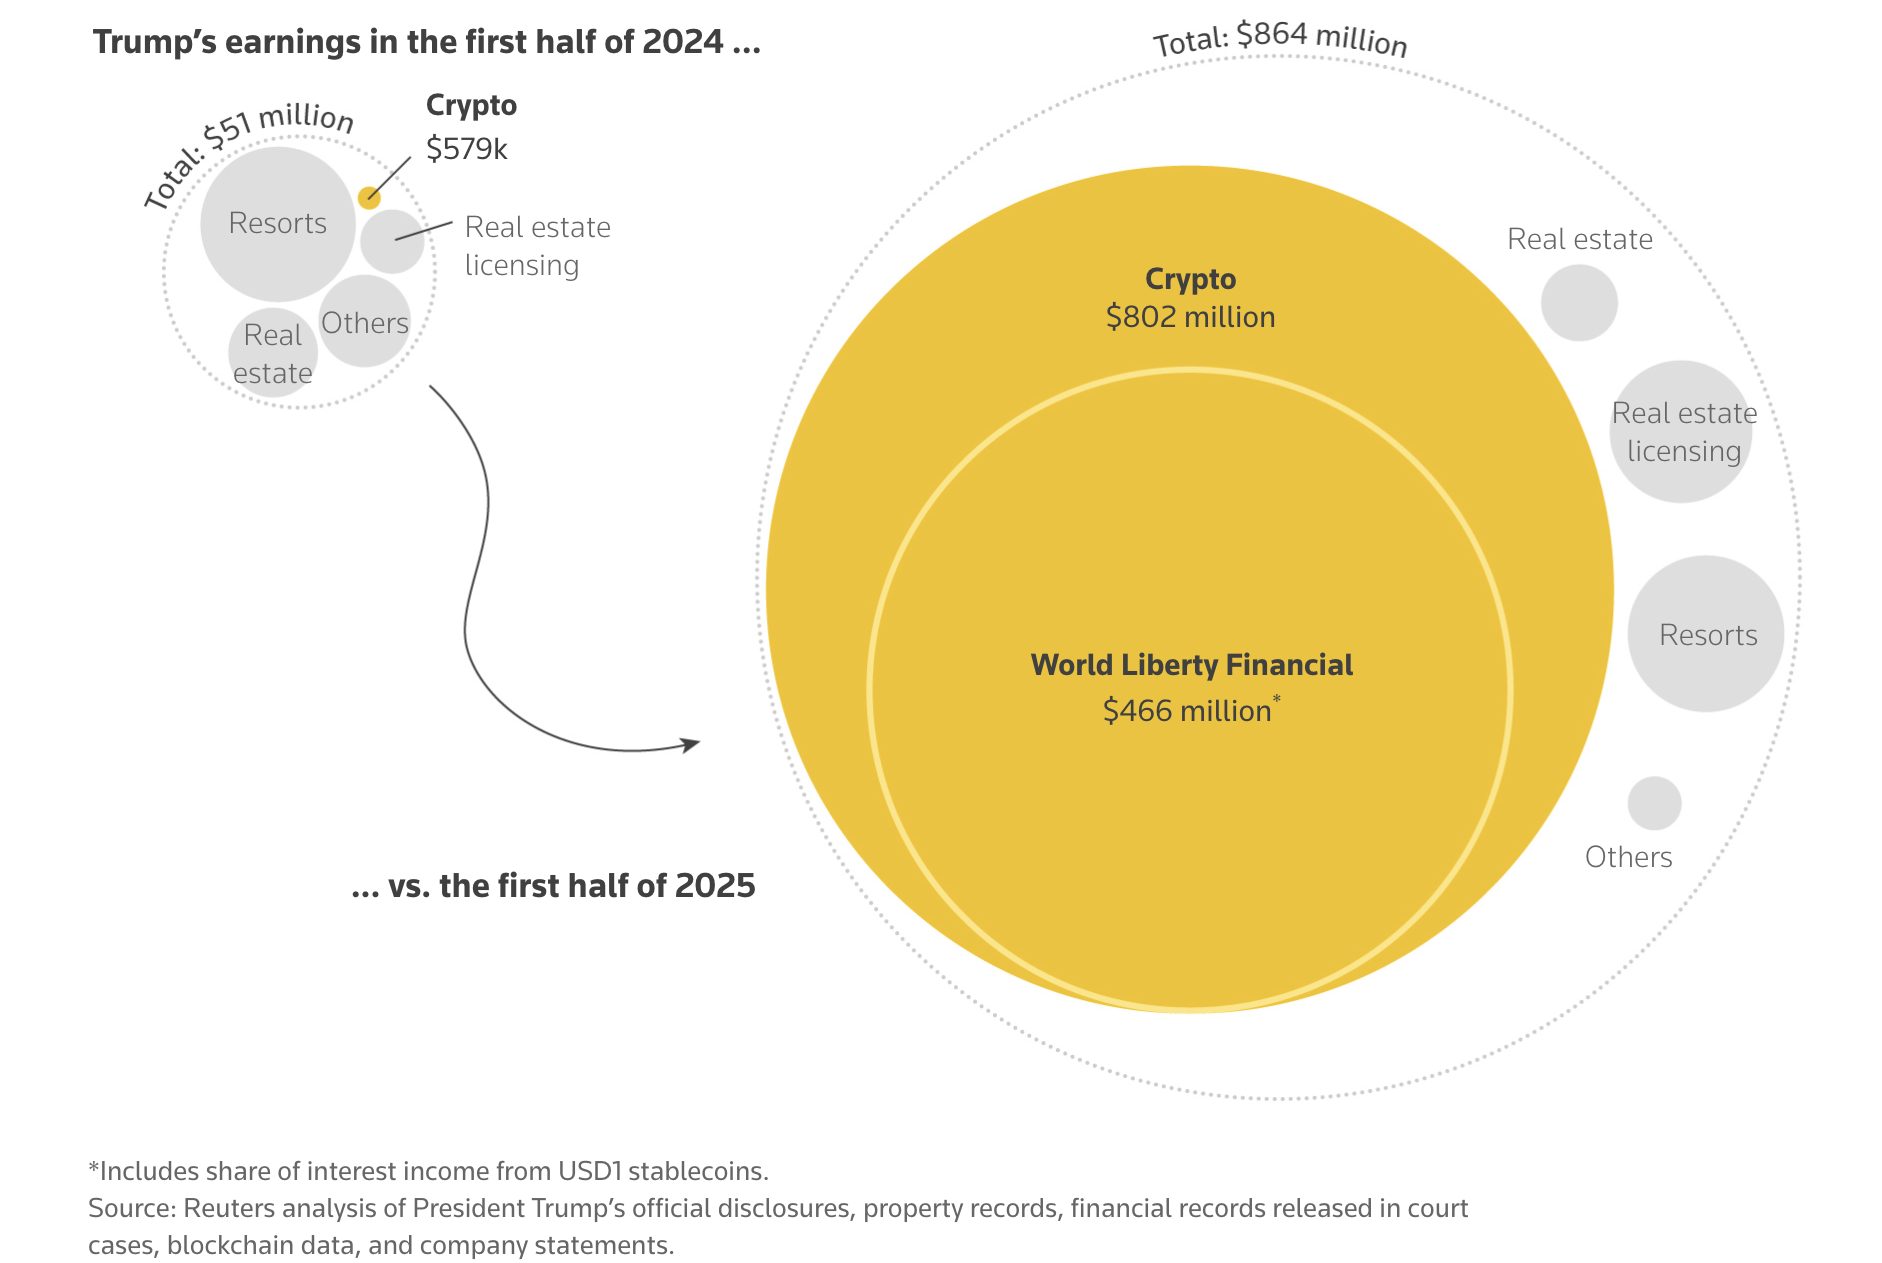
These ventures have generated significant wealth for the US president and his family. According to a Reuters analysis, they earned more than $800 million from crypto asset sales in the first half of 2025 alone,
One could argue that these moves helped legitimize the sector and accelerate adoption. Still, Trump’s direct and indirect involvement in crypto-related ventures raises concerns around optics, governance, and market integrity. While meme coins are not new to the crypto space, their association with a sitting US president is unprecedented.
Taken together, the data suggest that the answer to who helped crypto the most depends on how “help” is defined. Under Trump, crypto has benefited from a friendlier regulatory tone, reduced enforcement pressure, and faster approval of new investment products.
These changes lowered barriers for issuers and expanded market access.
However, market performance tells a different story. Bitcoin’s strongest gains occurred earlier, during Joe Biden’s presidency.
Meanwhile, Trump’s first year back in office has been marked by heightened volatility.
Tidak banyak topik yang lebih memecah belah industri aset kripto selain politik. Donald Trump sering disebut sebagai “presiden kripto pertama Amerika,” sedangkan pemerintahan Biden dianggap bersikap tidak ramah terhadap sektor ini.
Tapi, jika kita mengesampingkan retorika dan fokus pada data pasar, situasinya menjadi lebih kompleks. Pertanyaan utamanya bukan tentang pemerintahan mana yang lebih sering bicara positif soal kripto, melainkan di bawah kepemimpinan siapa Bitcoin akhirnya menunjukkan performa yang lebih baik.
Performa Bitcoin: Angka-angka Menunjukkan Cerita yang Jelas
Pada pemilihan presiden Amerika Serikat tahun 2024, Trump memosisikan diri sebagai kandidat yang pro-kripto, berjanji akan menjadikan AS sebagai “ibu kota kripto dunia.” Ia berjanji menghentikan aksi anti-kripto, mengekang tindakan tegas SEC, dan dalam kata-katanya sendiri:
“End Joe Biden’s war on crypto and we will ensure that the future of crypto and the future of Bitcoin will be made in America.”
Situasi ini memunculkan rasa optimistis di pasar dan membuat banyak pelaku berharap akan terjadi reli besar. Namun, mendekati akhir 2025, Bitcoin justru turun hampir 5%.
Jika dibandingkan, sepanjang tahun pertama Biden sebagai presiden, aset kripto terbesar di dunia ini justru naik sekitar 65%. Memang, performanya melemah di tahun 2022, tapi momentumnya pulih lagi di tahun-tahun setelahnya.
Bitcoin bangkit dengan sangat kuat, naik sekitar 155% pada tahun 2023 dan melonjak lagi 120,7% di 2024.
Tahun
Return Bitcoin (%)
2021
65%
2022
64,2%
2023
155%
2024
120,7%
2025 (per 26 Desember)
-5%
Saat menelaah masa jabatan pertama Trump sebagai presiden, seorang analis memaparkan bahwa periode tersebut merupakan “reli kripto terbesar” dalam sejarah, di mana total kapitalisasi pasar aset kripto naik sekitar 115 kali lipat dari awal hingga akhir masa jabatannya.
“Biden’s term returned 4.5x from beginning to end, and even at the worst moment, it never went below the annual open for his term. Trump’s 2nd term so far is below annual open, but 3 more years to go,” tulis analis pseudonim tersebut.
Bitcoin di bawah Trump
Lantas, apa yang sebenarnya terjadi tahun ini? Koreksi tersebut tidak bisa kita pahami hanya dengan melihat return Bitcoin pada tahun 2025 saja.
Pada Januari, momentum memang berada di kubu Bitcoin. Menjelang pelantikan Trump, BTC menembus US$109.000, mencetak rekor tertinggi sepanjang masa pada saat itu. Perkembangan juga terjadi di sisi regulasi, dengan SEC membentuk task force untuk menawarkan kerangka regulasi yang lebih transparan bagi aset digital.
Namun, langkah Trump berikutnya menghapus seluruh kenaikan tersebut. Setelah ia mengumumkan tarif untuk Uni Eropa dan kemudian memperluasnya lagi saat Liberation Day, pasar aset kripto tertekan dan turun bersama pasar saham.
Menariknya, pengumuman jeda tarif memicu sedikit pemulihan. Hal ini pun menegaskan bahwa pasar sangat sensitif terhadap perkembangan ekonomi makro dan menunjukkan volatilitas yang makin tinggi.
Di saat yang sama, adopsi terus meningkat seiring makin banyaknya inisiatif Strategic Bitcoin Reserve tingkat negara bagian dan makin banyak institusi yang terjun ke ranah kripto. Harga Bitcoin terus bergerak naik, membukukan return positif selama empat bulan berturut-turut dari April hingga Juli.
Salah satu tren utama selama periode ini adalah kemunculan digital asset treasury (DAT). Semakin banyak perusahaan publik menggunakan Bitcoin sebagai aset cadangan, mengikuti langkah yang dipopulerkan oleh MicroStrategy.
Bitcoin diuntungkan dari pergeseran tren ini, karena banyak pakar menyebutkan bahwa keterlibatan institusi dapat mengurangi volatilitas sekaligus menandakan kedewasaan aset ini di sektor keuangan tradisional.
Semakin tinggi kepercayaan di pasar, makin besar pula minat terhadap risiko dan penggunaan leverage. Trader berisiko tinggi dan memakai leverage besar menarik banyak perhatian. Dari sisi ekonomi makro, The Fed memangkas suku bunga pada September. Situasi ini kembali membawa sentimen positif untuk aset berisiko.
Bitcoin pun melesat ke rekor tertinggi baru di bulan Oktober, menyentuh US$125.761 pada 6 Oktober. Banyak analis pun memproyeksikan kenaikan lanjutan, dengan target antara US$185.000 hingga US$200.000 di akhir tahun.
Optimisme ini didukung oleh katalis ekonomi makro yang positif dan performa historis kuat Bitcoin di kuartal keempat.
BeInCrypto melaporkan bahwa pada 11 Oktober, pengumuman Trump soal tarif 100% untuk produk dari Cina membuat pasar bergerak turun. Lebih dari US$19 miliar posisi leverage terlikuidasi, sehingga banyak trader mengalami kerugian besar.
🚨 BIGGEST WIPEOUT SINCE LUNA, COVID & FTX.
Heading into Trump’s 100% China tariff announcement, markets got the pullback they were waiting for.
Nearly $20 BILLION in crypto liquidations in just 24 hours, a record wipeout. 😱
“It also appears to be a structural and mechanical downturn. It all began with institutional outflows in mid-to-late October. In the first week of November, crypto funds saw -$1.2 billion of outflows. The problem becomes excessive levels of leverage AMID these outflows…Excessive levels of leverage have resulted in a seemingly hypersensitive market,” tulis The Kobeissi Letter pada bulan November.
Bitcoin turun 17,67% sepanjang November dan sejak itu sudah kehilangan 1,7% nilai tambah di bulan ini menurut data Coinglass.
Dari ETF Bitcoin ke Altcoin: Perubahan Regulasi dan Respons Pasar
Pemerintahan Trump dan Biden berbeda pandangan dalam sejumlah isu penting, salah satunya terkait ETF kripto. Di bawah pemerintahan Biden, SEC awalnya memilih pendekatan yang jauh lebih hati-hati terhadap industri aset kripto. Sikap ini juga berlaku untuk ETF kripto.
Tapi, posisi regulasi mulai berubah setelah Pengadilan Banding Amerika Serikat untuk Sirkuit DC memerintahkan SEC untuk mempertimbangkan kembali aplikasi Grayscale Investments guna mengubah dana andalan GBTC-nya menjadi exchange-traded fund (ETF) Bitcoin spot.
Setelah itu, SEC akhirnya menyetujui exchange-traded fund (ETF) Bitcoin spot pada Januari 2024 dan selanjutnya merestui exchange-traded fund (ETF) Ethereum spot pada Juli.
Menariknya, setelah Gary Gensler meninggalkan SEC, para manajer aset langsung mengajukan berbagai permohonan untuk ETF altcoin. Beberapa perusahaan seperti Bitwise, 21 Capital, dan Canary Capital, serta yang lainnya, mendaftarkan produk investasi berbasis aset kripto.
Pada bulan September, SEC menyetujui standar listing generik, sehingga tidak perlu lagi ada persetujuan kasus per kasus. Setelah perubahan ini, ETF yang mengacu pada aset seperti SOL, HBAR, XRP, LTC, LINK, dan DOGE mulai diperdagangkan.
Pada bulan November, ETF XRP keluaran Canary Capital mencatat volume perdagangan senilai US$58,6 juta pada hari pertama, menjadi debut terkuat dari lebih dari 900 ETF yang diluncurkan pada 2025. ETF Solana milik Bitwise juga mendapat minat besar dengan volume hari pertama mencapai US$56 juta, sedangkan produk lain tampil dengan aktivitas yang lebih rendah.
Dari sisi regulasi, ETF ini memperluas akses pasar dan putusan pengadilan mengurangi batasan bagi penerbit. Meski begitu, data performa awal mengindikasikan bahwa hadirnya ETF kripto tambahan belum serta merta meningkatkan agregat arus modal masuk ke pasar sesuai ekspektasi.
Pada 2024, exchange-traded fund (ETF) Bitcoin spot menarik arus bersih sekitar US$35,2 miliar. Tahun 2025, arus masuk ke ETF Bitcoin melambat menjadi US$22,16 miliar menurut data SoSoValue. Perbedaan ini mengisyaratkan pertumbuhan penawaran ETF berjalan sejajar dengan redistribusi modal antar produk, bukan peningkatan total eksposur ke aset kripto.
Arus Exchange-Traded Fund (ETF) Bitcoin | Sumber: Data Dikurasi oleh BeInCrypto
Di balik kerajaan aset kripto keluarga Trump
Walaupun pengaruh Donald Trump di pasar sangat kentara, dia turut terjun langsung ke industri aset kripto. Pada Januari, presiden tersebut memperkenalkan meme coin, lalu tak lama kemudian Melania Trump juga meluncurkan token yang sangat mirip.
Pada bulan Maret, dua putra Presiden AS Donald Trump, Eric Trump dan Donald Trump Jr., bermitra dengan Hut 8 untuk meluncurkan American Bitcoin Corp.
Langkah-langkah ini telah menghasilkan kekayaan besar bagi presiden AS dan keluarganya. Menurut analisis Reuters, mereka sudah meraup lebih dari US$800 juta dari penjualan aset kripto hanya di paruh pertama 2025 saja,
Bisa saja orang berpendapat bahwa langkah-langkah ini membantu melegitimasi sektor aset kripto dan mempercepat adopsi. Akan tetapi, keterlibatan langsung dan tidak langsung Trump dalam bisnis terkait kripto menimbulkan kekhawatiran terhadap citra, tata kelola, dan integritas pasar. Walau meme coin bukan hal baru di ranah aset kripto, keterkaitannya dengan seorang presiden AS yang masih menjabat jelas belum pernah terjadi sebelumnya.
Jika dilihat secara keseluruhan, data menunjukkan bahwa jawaban atas siapa yang paling banyak membantu kripto sangat tergantung pada bagaimana “bantuan” itu sendiri didefinisikan. Di era Trump, industri kripto merasakan sikap regulasi yang lebih ramah, tekanan penegakan hukum yang berkurang, serta proses persetujuan produk investasi baru yang semakin cepat.
Perubahan-perubahan ini membuat hambatan bagi para penerbit produk jadi lebih rendah dan akses pasar semakin luas.
Tapi, performa pasar menunjukkan hal berbeda. Bitcoin justru membukukan kenaikan terkuat di masa awal kepresidenan Joe Biden.
Sementara itu, tahun pertama Trump kembali menjabat ditandai oleh volatilitas yang semakin tinggi.