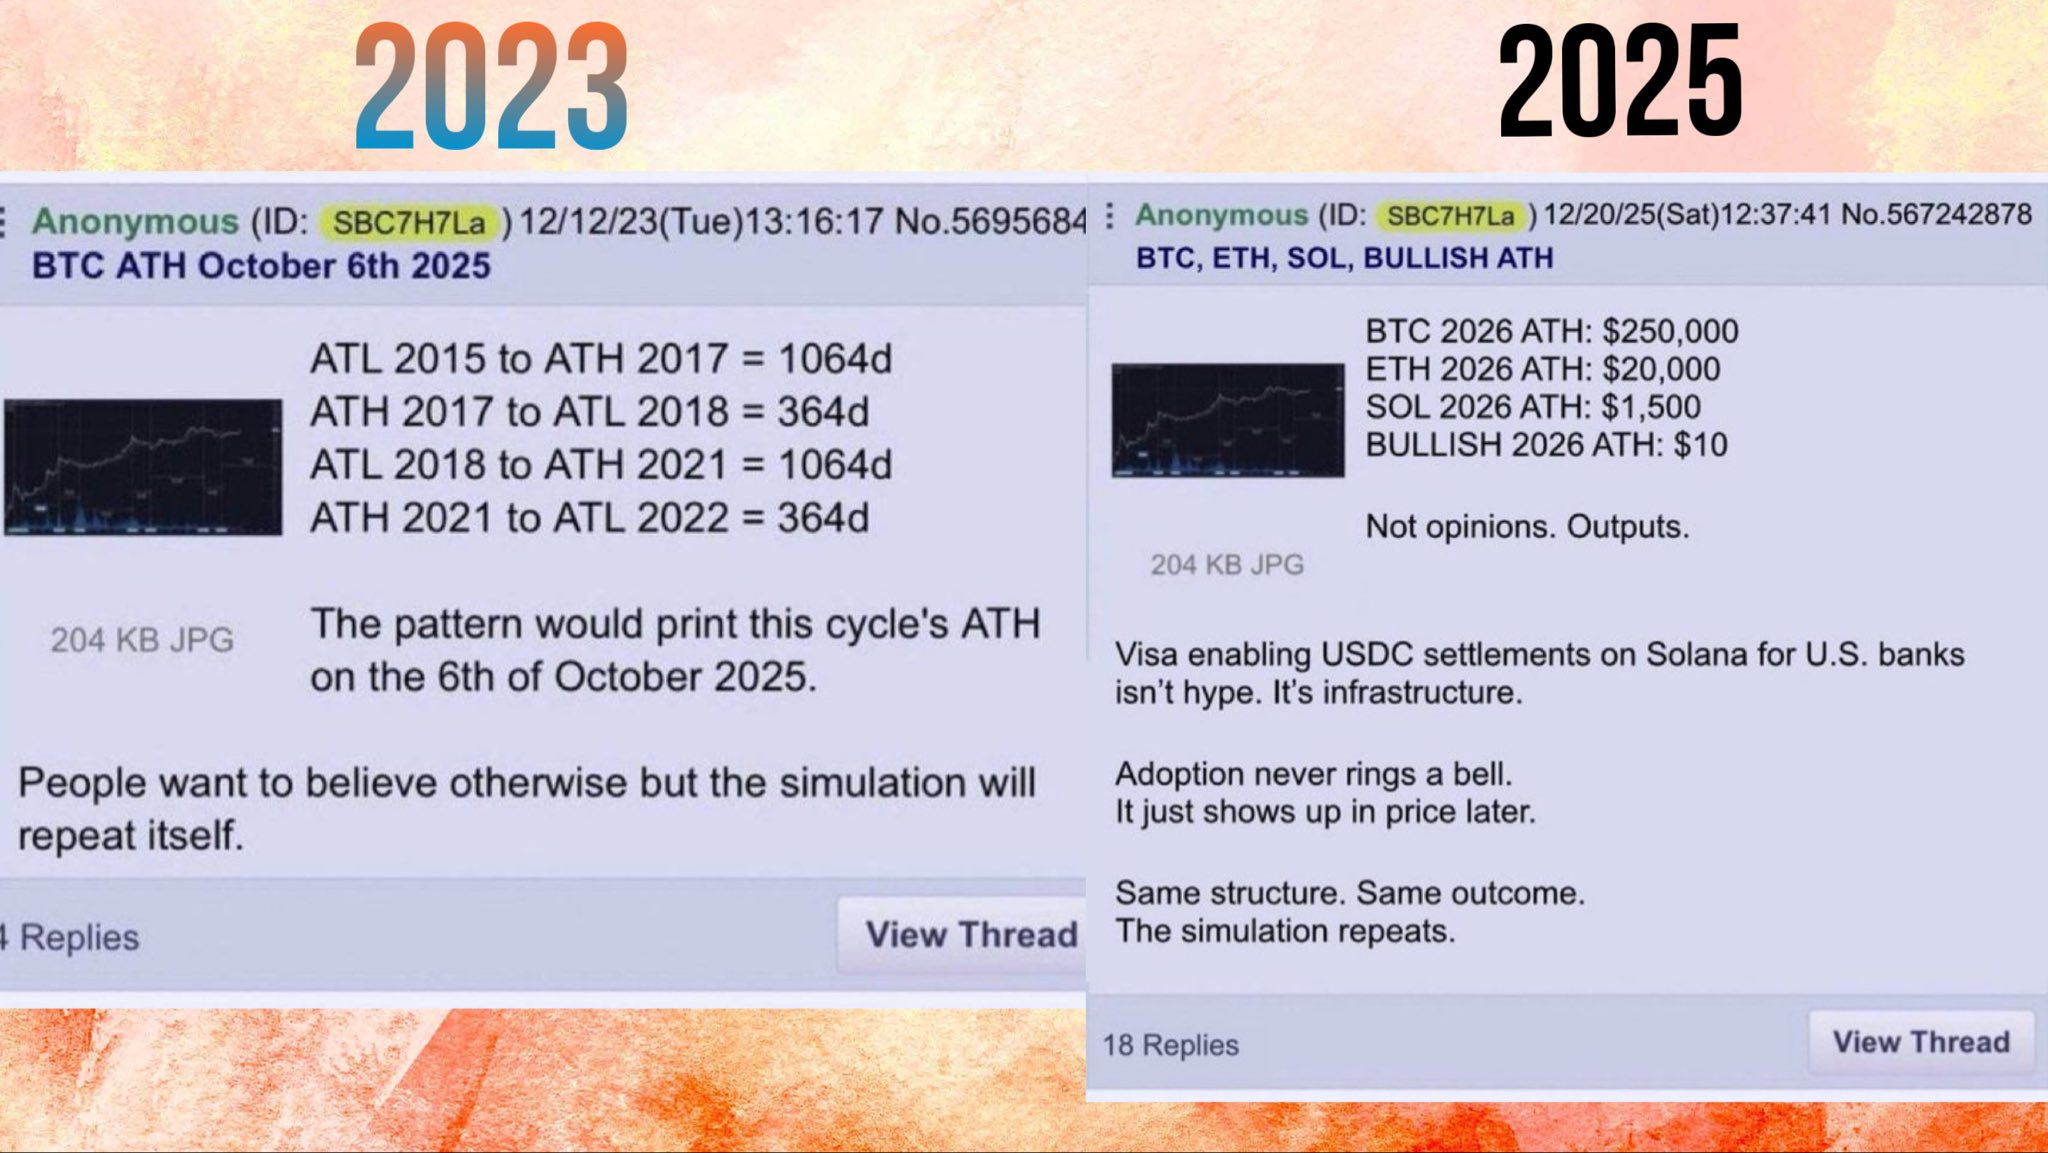
An anonymous poster on 4chan, who correctly flagged Bitcoin’s cycle top on October 6, 2025, nearly two years in advance, has returned with a far more aggressive call. The trader predicts Bitcoin to reach $250,000 in 2026.
The prediction has resurfaced across crypto circles precisely as many on-chain and technical indicators turn bearish.
A Proven Call, Not a Price Target
Back in December 2023, the anonymous poster outlined a time-based cycle model rather than a price forecast. The thesis relied on historical symmetry. Roughly 1,064 days from bear-market lows to cycle highs, followed by nearly 364 days of decline.
That structure projected the next all-time high to land on October 6, 2025, almost exactly when Bitcoin topped near its peak before crashing 4 days later.
Anon 4chan Users Bitcoin Prediction
That accuracy has given the new forecast weight, even among skeptics.
In the latest post, the anon argues that the broader structure has not broken.
Instead, the current drawdown represents a reset phase before another expansion leg, with 2026 penciled in as the next price climax.
Meanwhile, apparent demand growth, measured by net new buyer activity, has slowed sharply from early-2025 highs. Similar demand slowdowns preceded major corrections in past cycles, including 2021 and 2017.
From a traditional analytical lens, these signals point to caution.
We have been writing about Bitcoin entering into a bear market since early November.
And yes, we are in a bear market mostly amid demand exhaustion.
The anonymous forecast challenges the idea that local bearish signals define the full cycle. Previous bull markets also saw multi-month corrections and demand resets before making their final parabolic moves.
Structural tailwinds remain intact. Bitcoin supply growth continues to compress post-halving. Institutional infrastructure, from ETFs to payment rails, remains embedded, even as speculative interest cools.
Historically, the strongest upside phases have followed periods of skepticism, not optimism.
The anon’s $250,000 target for 2026 is not framed as sentiment or opinion, but as a continuation of prior cycle mechanics.
Whether the call proves right or wrong, the episode highlights a familiar pattern in Bitcoin markets. Short-term indicators often turn bearish well before long-term cycles conclude.
For now, Bitcoin price sits in an uncomfortable middle ground.
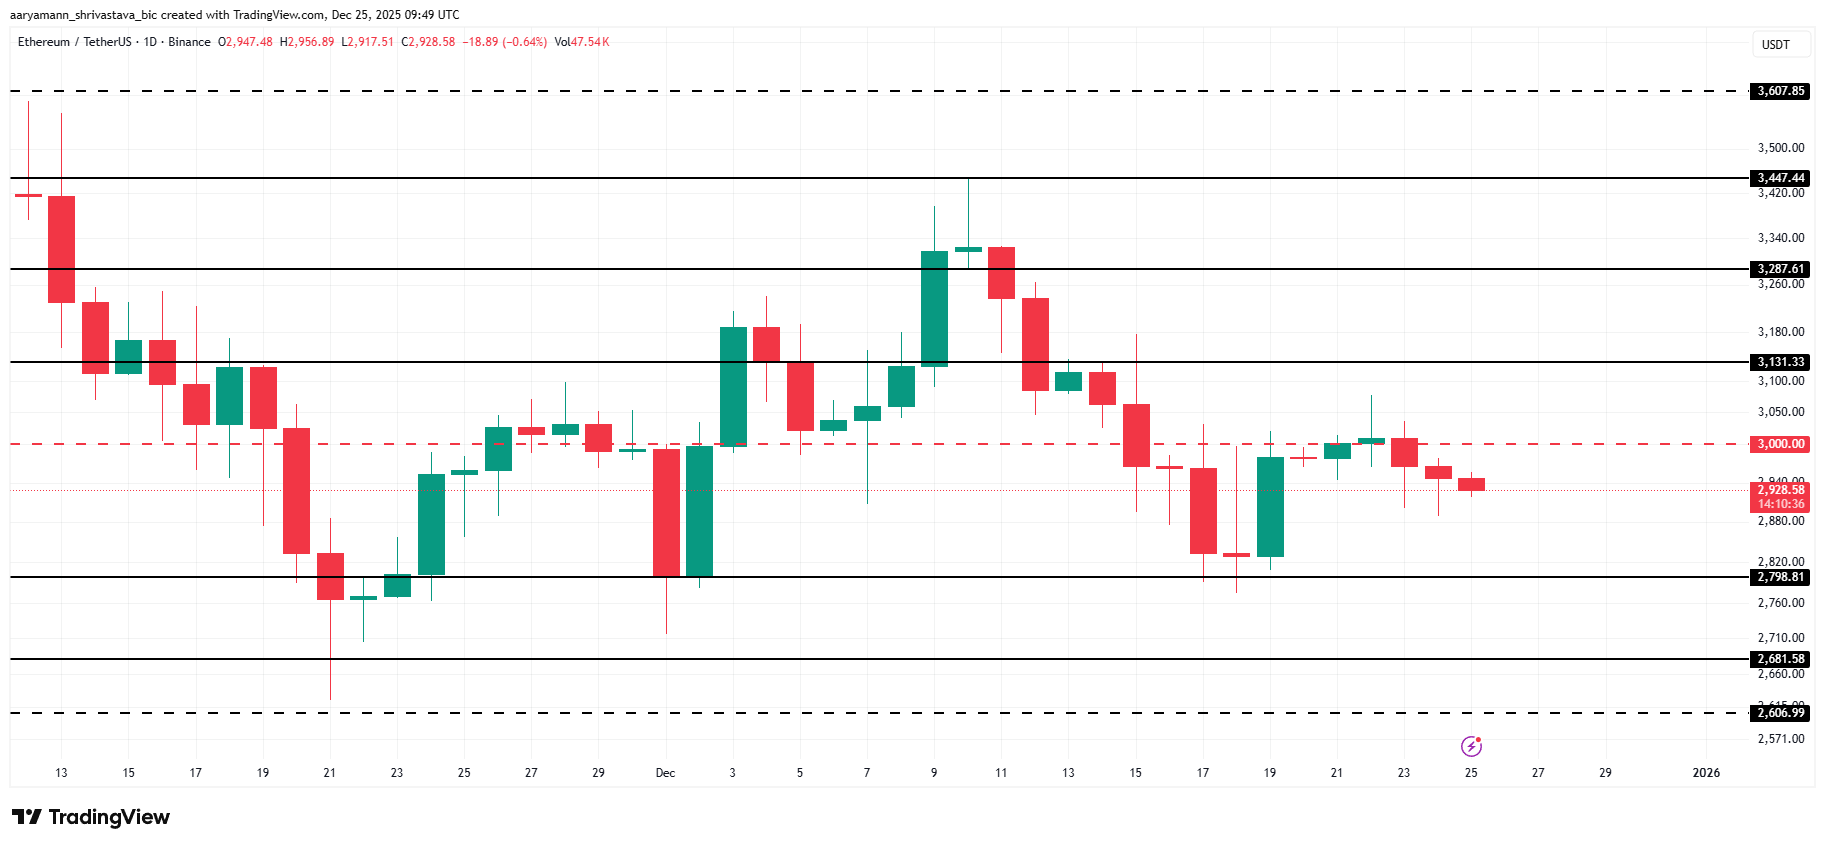
Ethereum price has struggled to regain momentum, hovering near the $3,000 level over recent sessions. This prolonged consolidation has weighed on sentiment and weakened short-term confidence among ETH holders.
Still, shifting on-chain signals and historical price behavior suggest conditions may be forming for a potential rebound.
Ethereum ETFs Continue To Lose Money
Ethereum ETFs have faced sustained pressure over the past two weeks. During this period, only one trading day recorded net inflows, largely driven by Grayscale activity. Outside that session, investors consistently pulled capital from ETH ETFs, signaling caution across traditional finance channels.
This pullback appears cyclical rather than structural. If Ethereum retests the $2,798 support level, buyers could reenter. A successful bounce and reclamation of that zone may reset market expectations and restore the upward price trajectory.
Want more token insights like this? Sign up for Editor Harsh Notariya’s Daily Crypto Newsletter here.
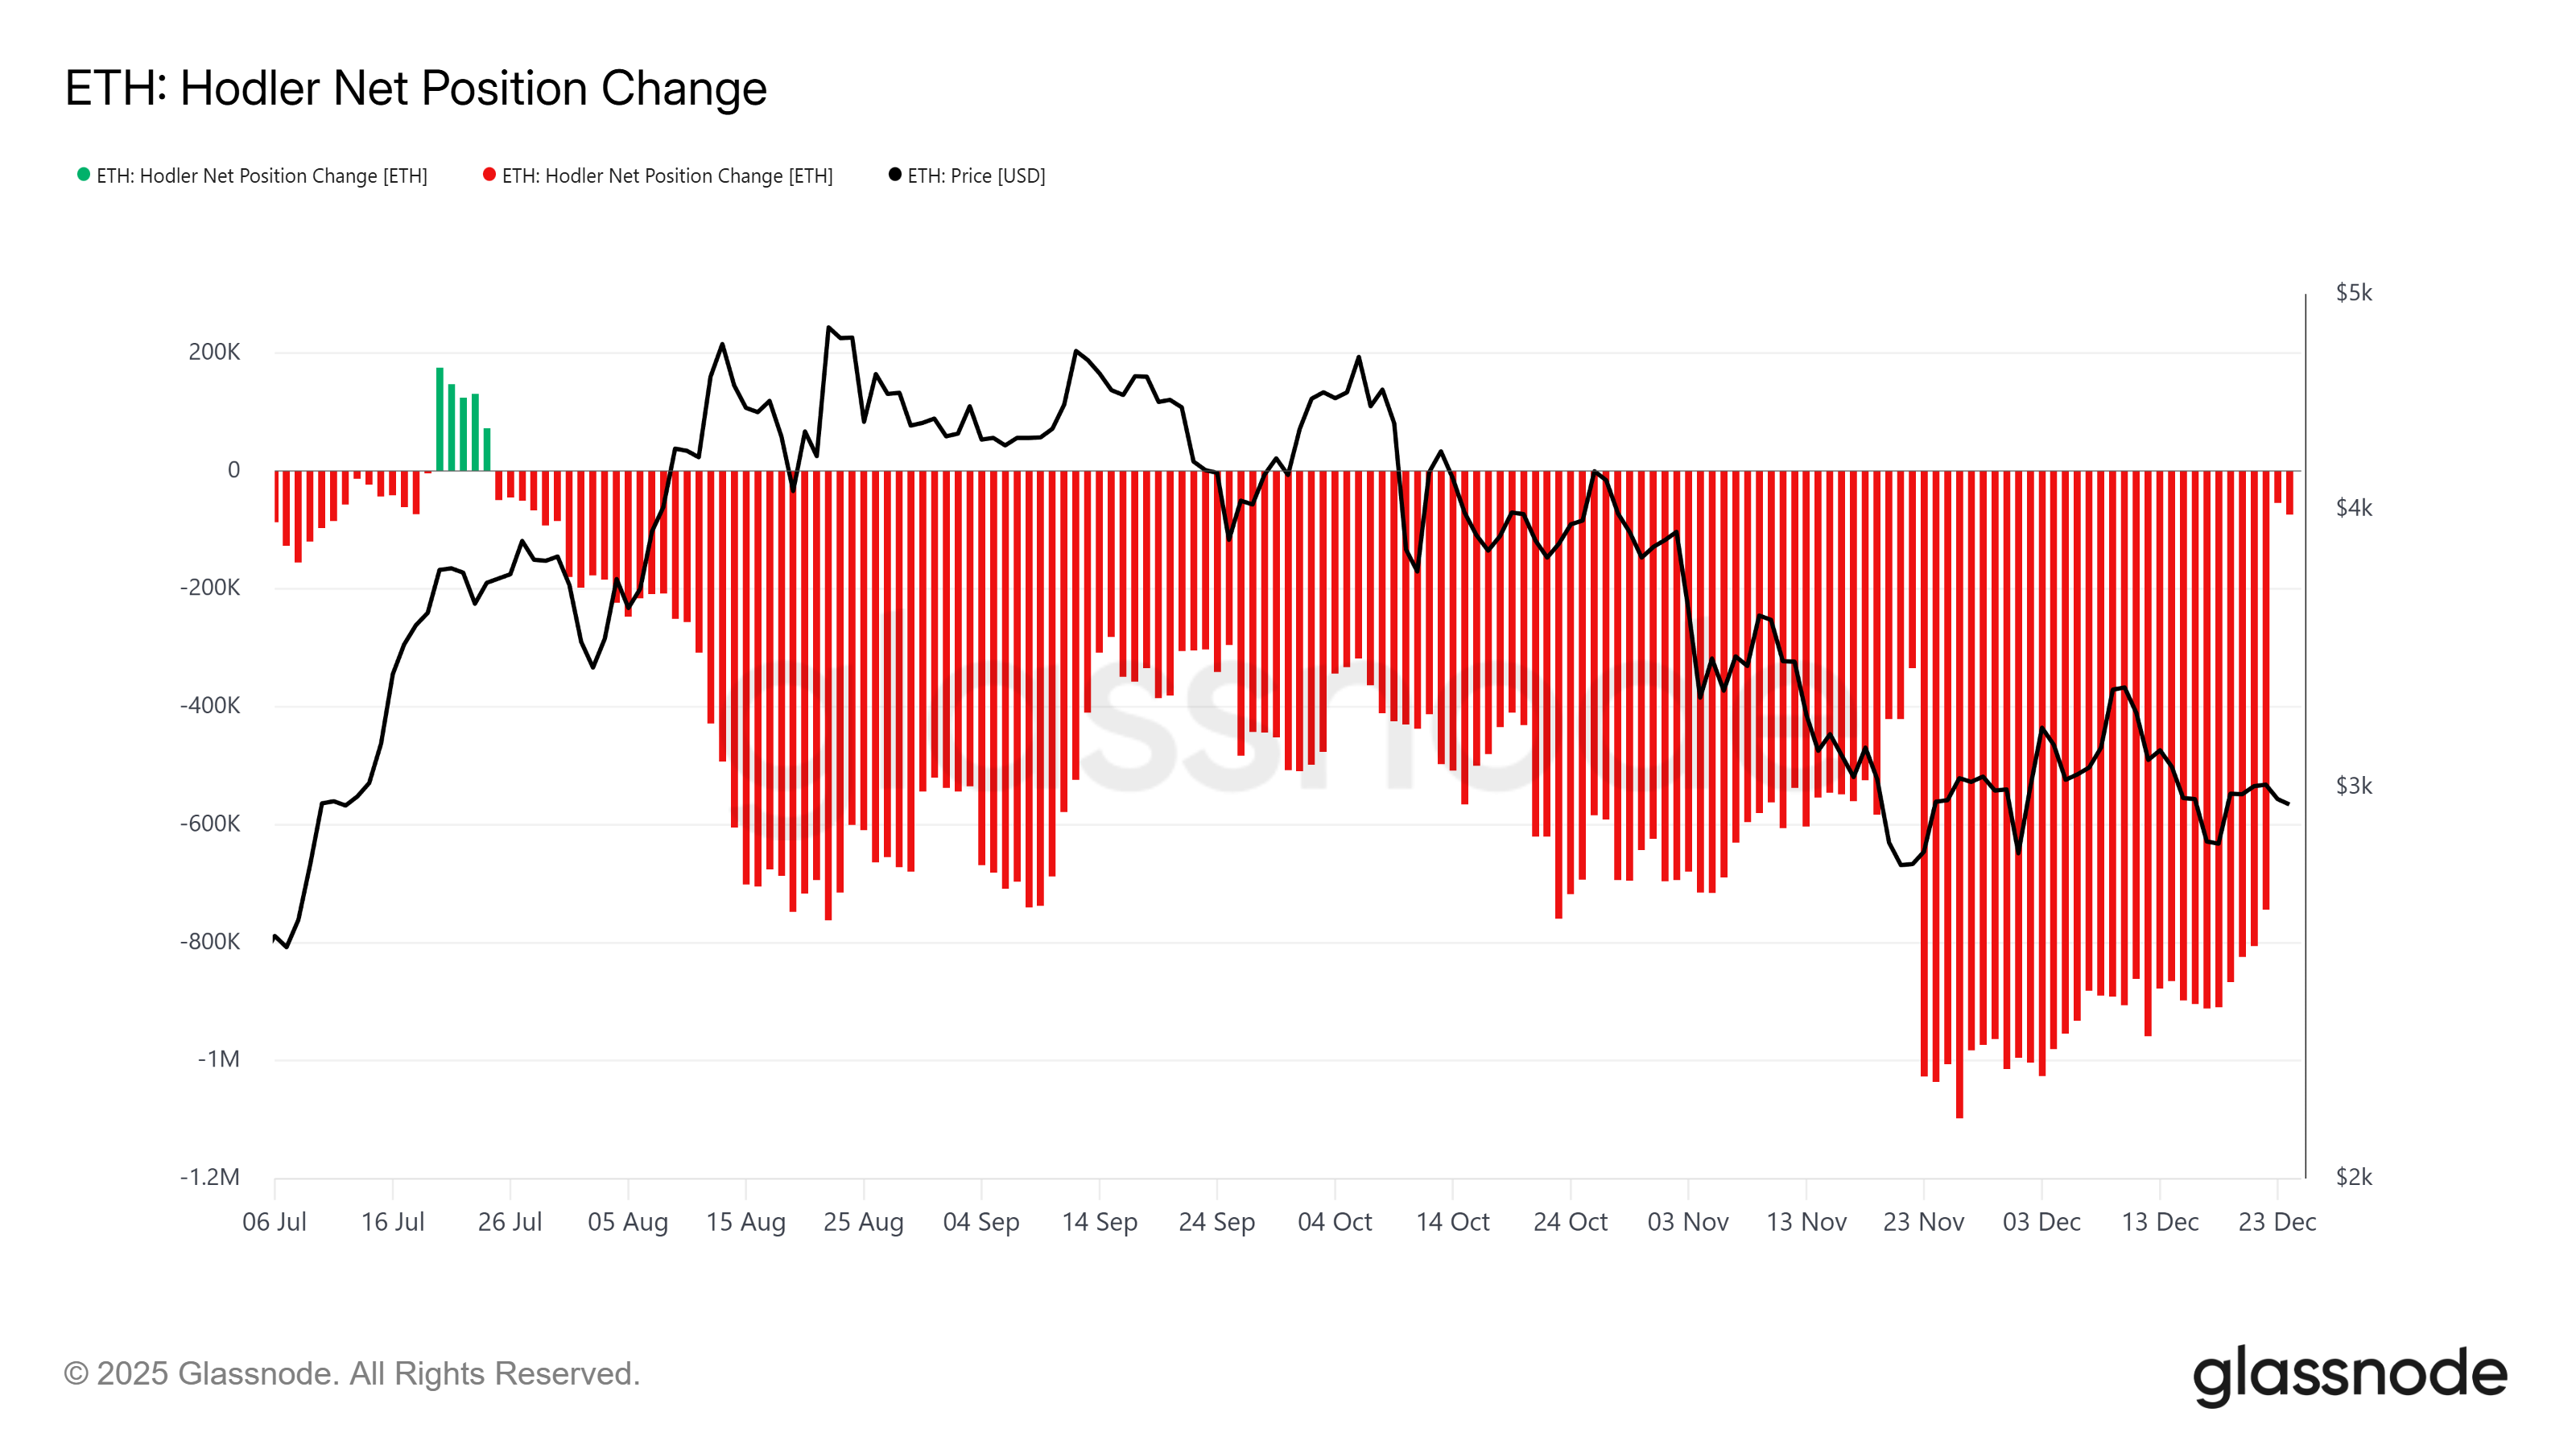
On-chain data points to improving macro momentum beneath the surface. Ethereum’s HODler Net Position Change, which tracks long-term holder behavior, has surged sharply. The indicator now sits near its largest outflow levels seen in the past five months.
This shift suggests older holders are reducing selling pressure and regaining confidence in Ethereum’s recovery potential. If the metric crosses above the zero line, it would confirm net inflows from long-term holders. Such behavior historically supports price stabilization and trend reversals.
ETH Price Could Bounce Back
Ethereum traded near $2,978 at the time of writing, remaining capped below the psychological $3,000 barrier. This consolidation has raised concerns about whether ETH could close 2025 under that level. Persistent hesitation has kept volatility elevated and sentiment fragile.
However, ETF dynamics and long-term holder behavior point to a possible shift. A controlled pullback toward $2,798 could provide the base for a rebound. If Ethereum reclaims $3,000 as support, price action may extend toward $3,131 and beyond.
Downside risks remain if bullish momentum fails to develop. A breakdown below $2,798 would weaken the technical structure. In that case, Ethereum price could slide toward $2,681, invalidating the bullish outlook and reinforcing near-term bearish pressure.
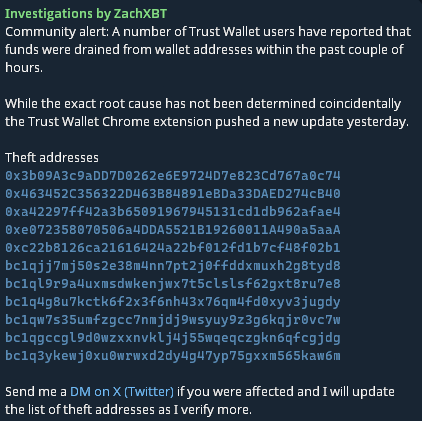
Blockchain investigator ZachXBT reported on December 25 that multiple Trust Wallet users experienced unauthorized fund outflows within the past few hours.
Affected users say assets were drained from their wallet addresses without approval.
Major Security Warning For Trust Wallet Users?
According to ZachXBT, the exact root cause remains unconfirmed. However, the timing has raised concerns. Today’s incidents followed a recent update to Trust Wallet’s Chrome extension that was released a day earlier.
ZachXBT has begun collecting wallet addresses linked to the suspected thefts and asked affected users to come forward as the investigation continues.
ZachXBT Issues Community Alert for Trust Wallet Users on His Telegram Group
While Trust Wallet has not yet issued a detailed technical explanation, the situation has renewed scrutiny around browser-based crypto wallets.
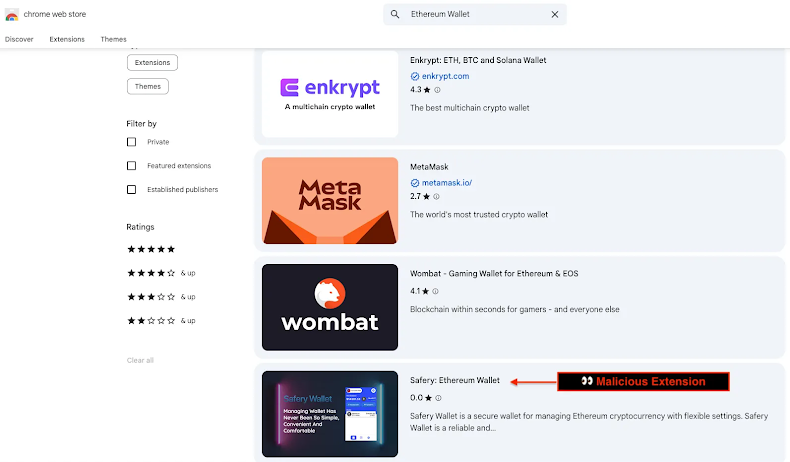
Chrome extensions operate with elevated permissions. Security researchers have repeatedly warned that a single malicious update or compromised dependency can expose users to significant risk.
Recent months have already seen several high-profile extension-related wallet threats.
Security firms previously flagged fake wallet extensions designed to capture seed phrases, allowing attackers to fully recreate wallets and drain funds later.
Recently Reported Fake Chrome Extensions that Drain Crypto Wallets. Source: The Hacker News
In other cases, malicious trading “helper” extensions quietly modified transaction instructions, siphoning small amounts of crypto each time a user approved a swap.
More broadly, cybersecurity researchers have documented campaigns involving seemingly legitimate browser extensions that were later updated to inject scripts, reroute traffic, or harvest sensitive data.
While not always crypto-specific, such capabilities can be repurposed to target wallet sessions, sign-in flows, or transaction approvals.
Against that backdrop, the Trust Wallet reports have triggered immediate concern across the crypto community.
Users are being urged to review recent transactions, revoke unnecessary permissions, and avoid signing new transactions until more clarity emerges.
Those who suspect compromise are advised to move remaining funds to new wallets created from fresh seed phrases.
As of publication, Trust Wallet has not confirmed whether the Chrome extension update is directly responsible.
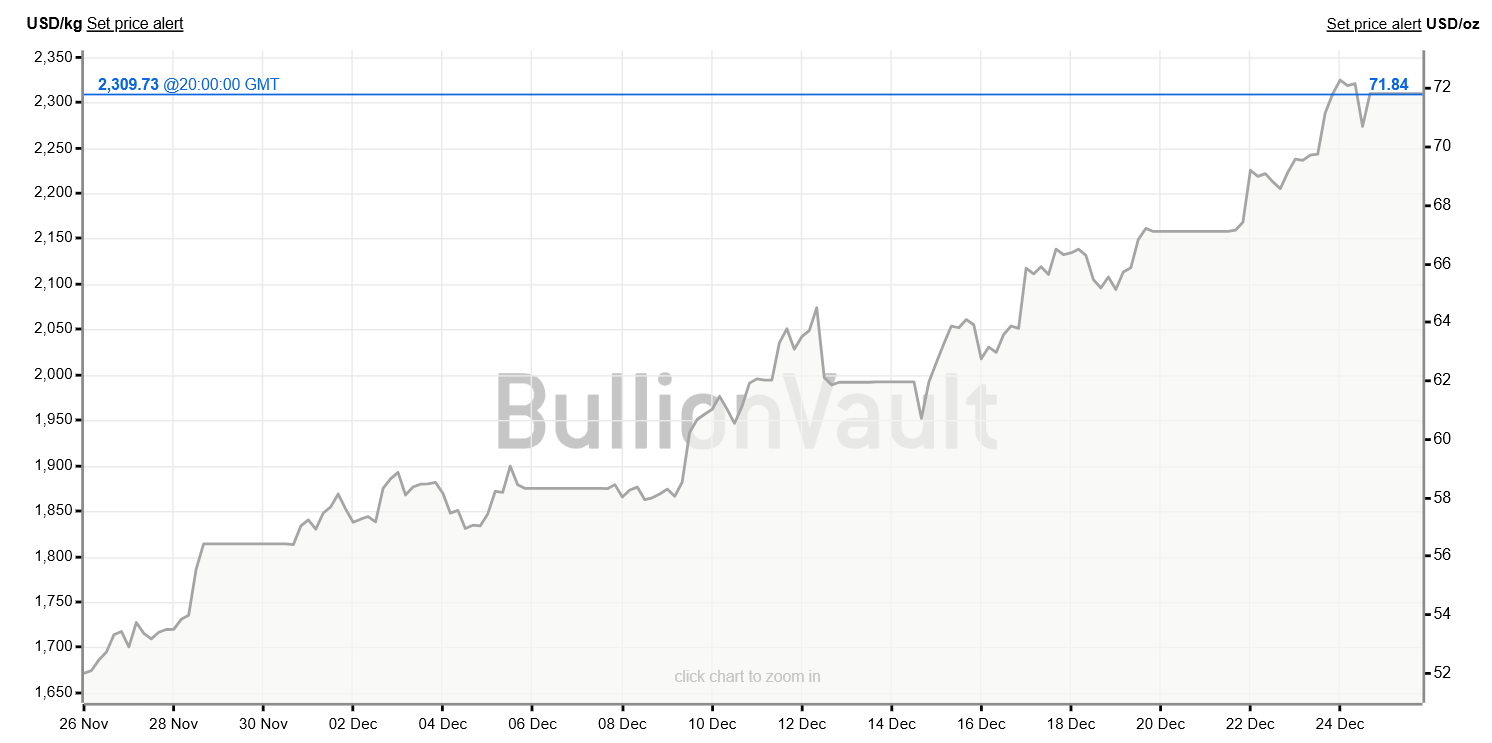
Silver markets sent a clear signal on Christmas Day. While Bitcoin traded quietly in thin holiday liquidity, silver prices in China surged to record local levels, driven by tight physical supply and strong industrial demand.
The divergence highlights a growing macro theme. During periods of scarcity and geopolitical stress, capital is flowing toward hard assets rather than digital alternatives.
China’s Physical Silver Tightness Drives the Move
The latest silver move originated in China, where local prices reached record levels on December 25. Evidently, China is facing a shortage of physical silver.
BREAKING: Shanghai silver prices soar to a record $80/oz, now officially up over +150% YTD.
Chinese spot and futures markets have traded at persistent premiums to London and COMEX benchmarks.
In some cases, contracts briefly moved into backwardation, a sign of immediate supply stress. China accounts for more than half of global industrial silver demand, making local shortages a global issue.
The pressure comes from several sources. Solar manufacturing remains the largest driver, while electric vehicle production continues to rise.
Each EV uses significantly more silver than a traditional car, particularly in power electronics and charging infrastructure.
At the same time, grid expansion and electronics manufacturing have kept demand elevated.
Silver Price Chart in December 2025. Source: BullionVault
Bitcoin’s Christmas Stagnation Tells a Different Story
Bitcoin, by contrast, showed little reaction on Christmas Day. Prices moved sideways amid low volume, reflecting reduced institutional participation rather than a shift in fundamentals.
In late 2025, Bitcoin has traded more like a high-beta liquidity asset than a crisis hedge. When physical scarcity and supply-chain stress dominate the narrative, investors have favored metals over digital assets.
Bitcoin Price Chart Throughout Christmas Week 2025. Source: CoinGecko
Geopolitical risks reinforce that trend. Rising defense spending linked to conflicts in Ukraine and the Middle East has increased demand for silver in military electronics and munitions.
Unlike investment silver, much of this metal is permanently consumed.
The divergence between silver and Bitcoin reflects a broader macro point. Digital scarcity alone has not been enough to attract capital during supply-driven shocks.
Physical scarcity, especially when tied to energy, defense, and industrial policy, continues to matter.
As markets head into 2026, that distinction may shape asset performance more than narratives around risk appetite alone.
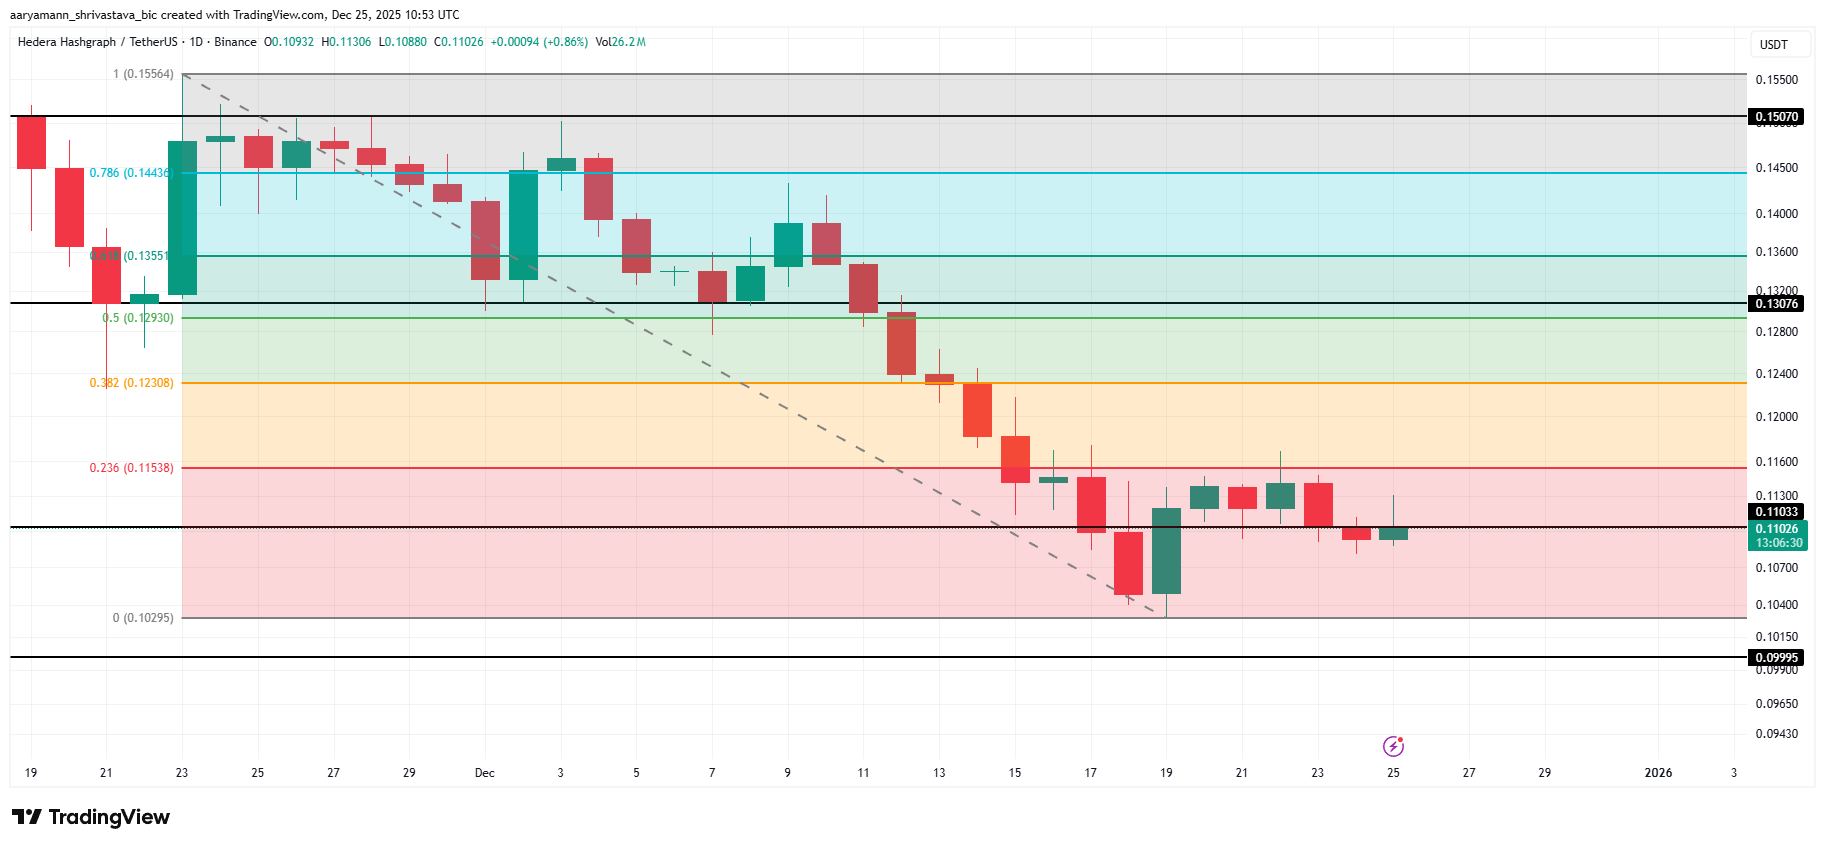
Hedera has faced persistent bearish pressure over the past two months, tracking weakness across the broader crypto market. HBAR price declined steadily as risk appetite faded and capital rotated into defensive positions.
Despite recent losses, market structure suggests January could mark a meaningful shift in momentum for the altcoin.
HBAR’s History Speaks For Itself
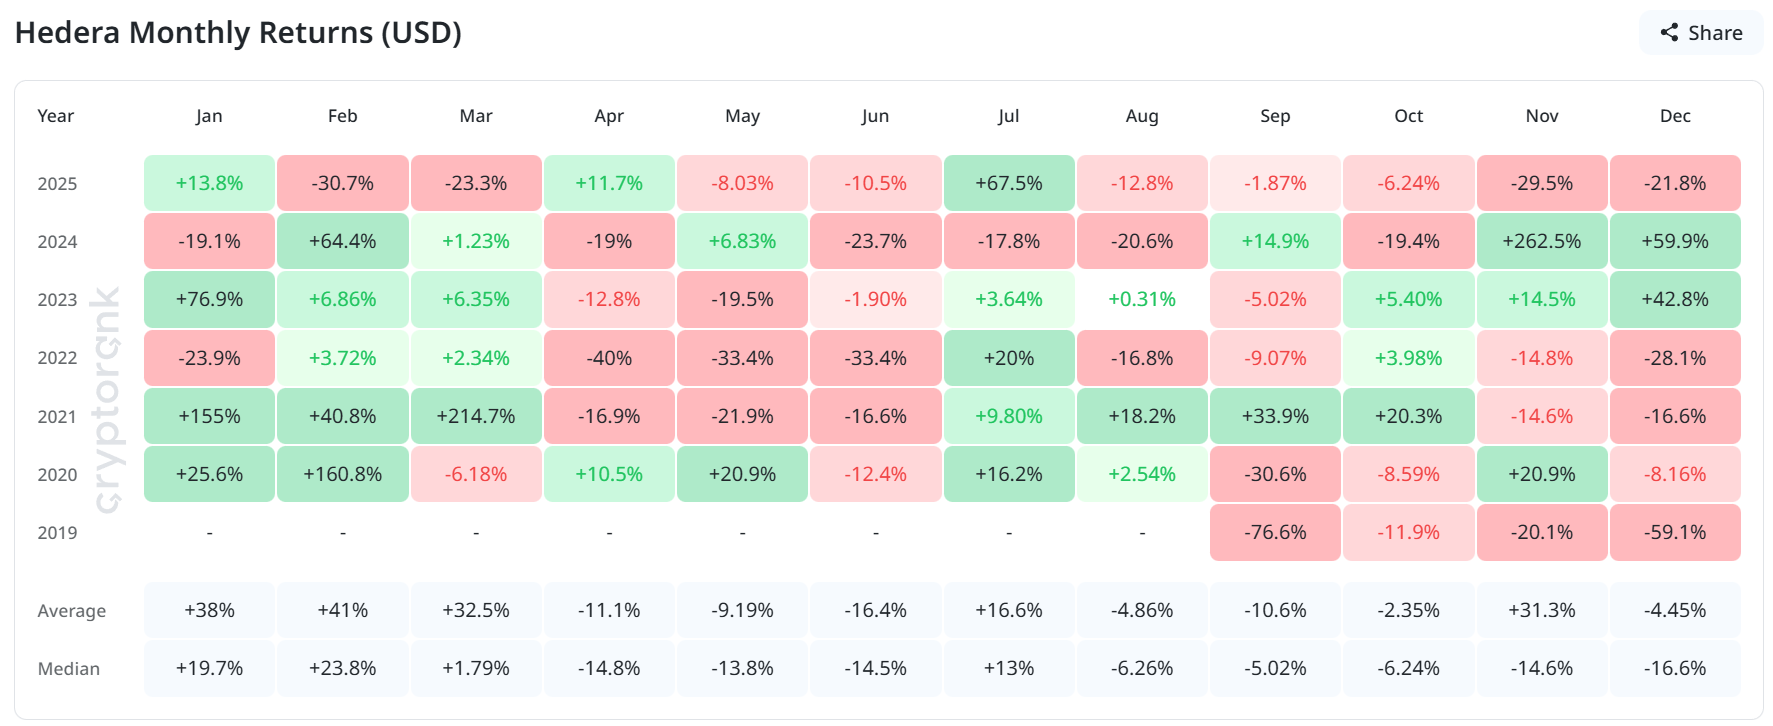
January has historically been one of the strongest months for HBAR price performance. Over seven years of price history, the token posted an average January return of 38%. The median return stands at 19.7%, highlighting consistent seasonal strength rather than isolated rallies.
Seasonality data remains relevant for long-term market participants. If historical patterns repeat, HBAR could see renewed demand early in 2026. Such behavior would align with post-year-end repositioning, when traders reassess undervalued assets following extended drawdowns.
Want more token insights like this? Sign up for Editor Harsh Notariya’s Daily Crypto Newsletter here.
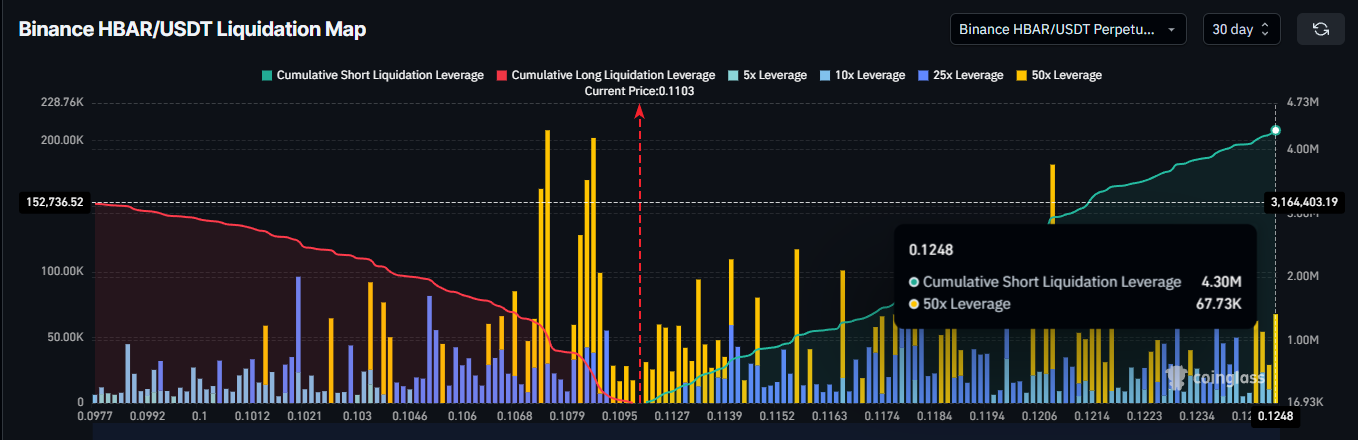
Derivatives data support a cautiously bearish outlook among active traders. Futures positioning shows short exposure at approximately $4.30 million, while short exposure currently sits lower, near $3.16 million. This indicates an imbalance favoring downside expectations.
This positioning reflects a lack of confidence that downside risk may be limited near current levels. HBAR traders typically expand short exposure when they anticipate further decline. While leverage increases volatility, the current structure suggests a more pessimistic approach rather than optimistic hedging.
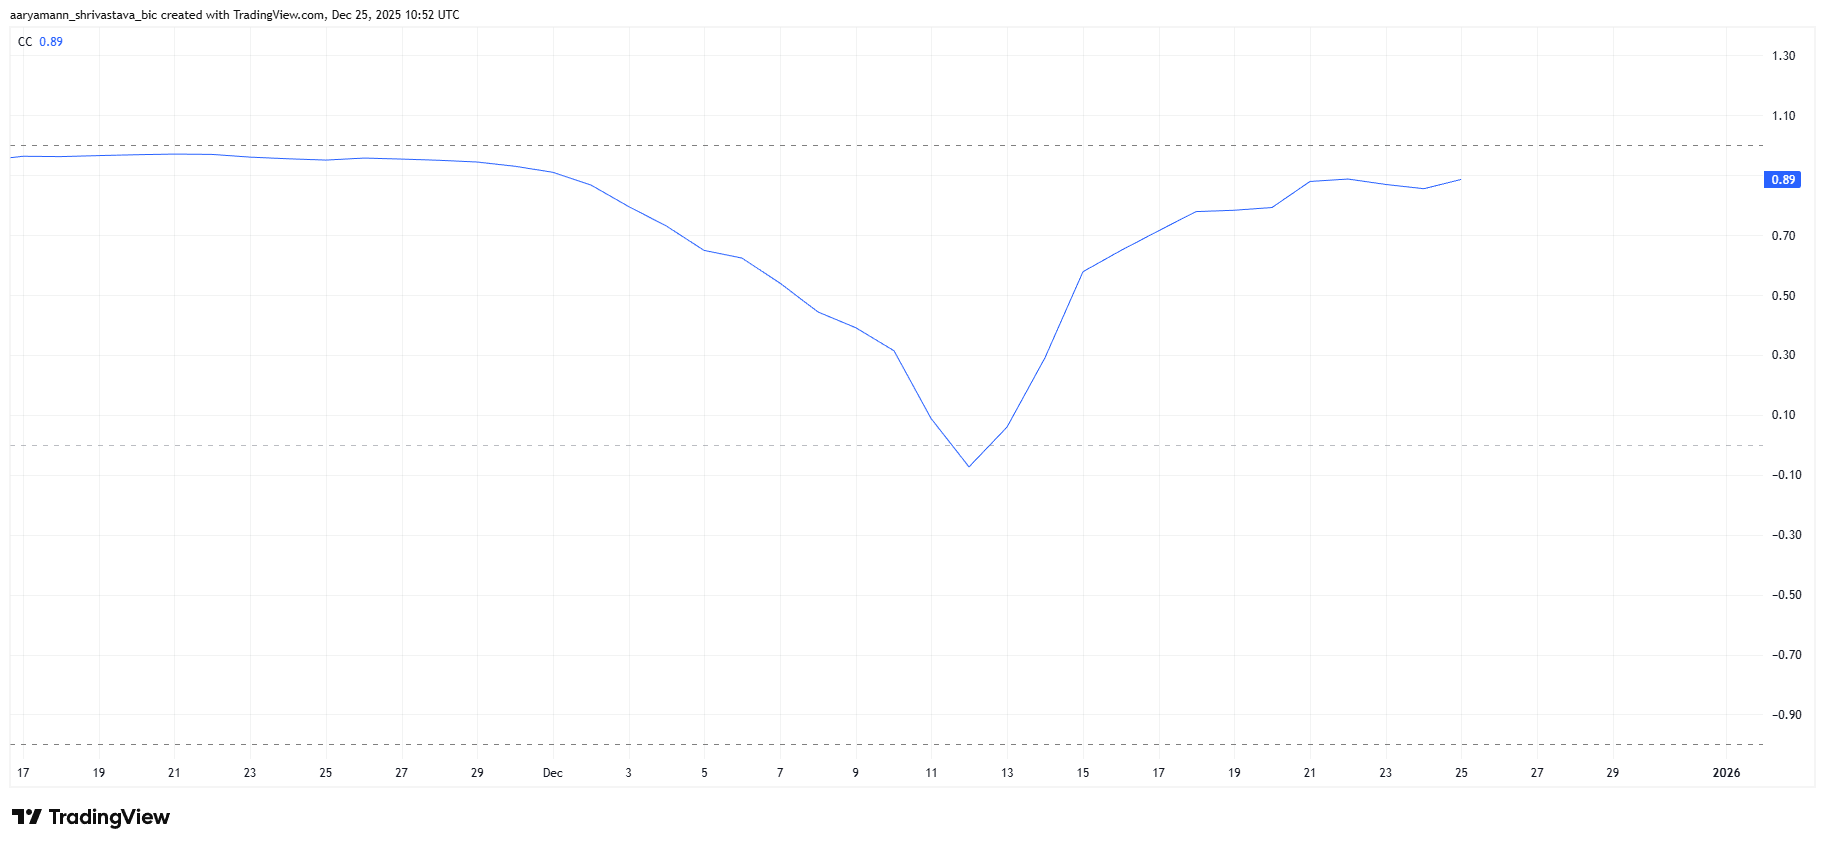
HBAR maintains a strong correlation with Bitcoin, currently measured at 0.89. This relationship has strengthened over recent days, signaling that Hedera price movements increasingly mirror broader market direction. Such alignment reinforces Bitcoin’s role as a primary driver of short-term momentum.
Correlation presents both opportunity and risk. A Bitcoin recovery would likely lift HBAR alongside other large-cap altcoins. Conversely, renewed weakness in BTC could undermine any standalone recovery attempt by Hedera.
Macro conditions, therefore, remain critical. As long as Bitcoin holds key support levels, HBAR may benefit from positive spillover. Any sharp BTC correction would likely weigh heavily on Hedera’s price structure.
Can HBAR Price Reclaim This Critical Support?
HBAR price traded near $0.110 at the time of writing. The token remains capped below the 23.6% Fibonacci retracement drawn from the $0.155 high to the $0.102 swing low. Recovery from this zone remains possible, though momentum appears gradual rather than impulsive.
A deeper pullback may be required to rebuild strength. A move toward the $0.100 psychological level could attract stronger demand. Liquidity often concentrates near round numbers. As long as the price remains below the $0.112–$0.115 range, activity reflects distribution rather than accumulation.
If buyers regain control, the first objective would be reclaiming the 23.6% Fib level at $0.115 as support. Success there could open the path toward $0.130 during January. However, a failure to sustain bullish momentum or a downturn in Bitcoin could push HBAR below $0.100. Such a move would expose the HBAR price to $0.099 or lower, invalidating the bullish prediction.
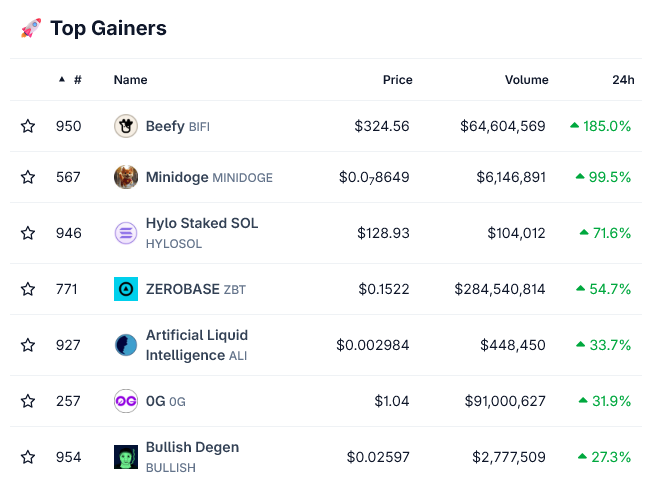
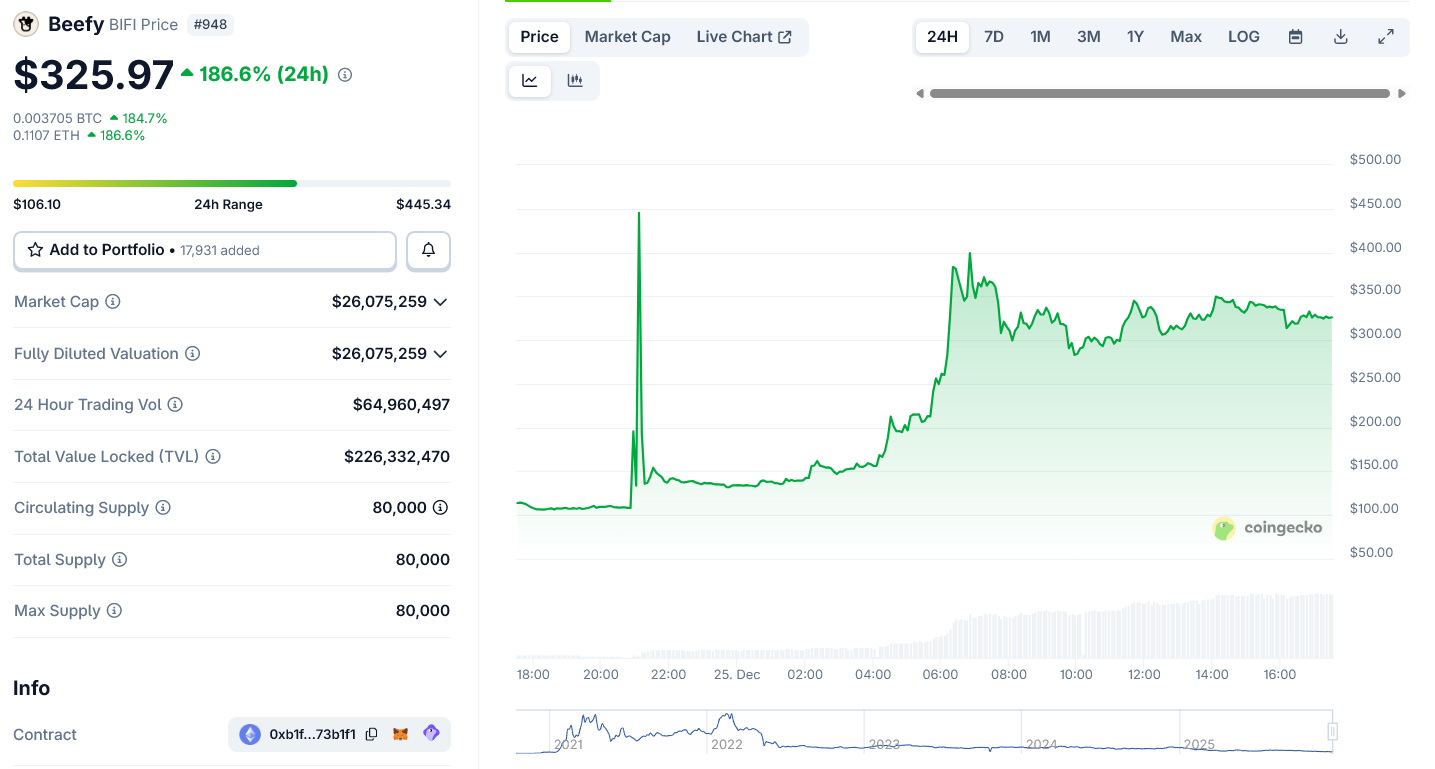
A little-known DeFi yield token stunned markets on Christmas Day after posting a triple-digit rally while most crypto assets traded quietly. Beefy Finance’s BIFI token surged more than 200% in 24 hours, briefly touching the $400 level before cooling, according to market data.
The move placed BIFI among the top gainers across the crypto market on December 25, despite no major protocol announcement or ecosystem shock.
BIFI Tops the Charts on Christmas Day. Source: CoinGecko
Beefy operates automated “vaults” across multiple blockchains, compounding rewards from liquidity pools and staking strategies. Users retain custody of funds and can withdraw at any time.
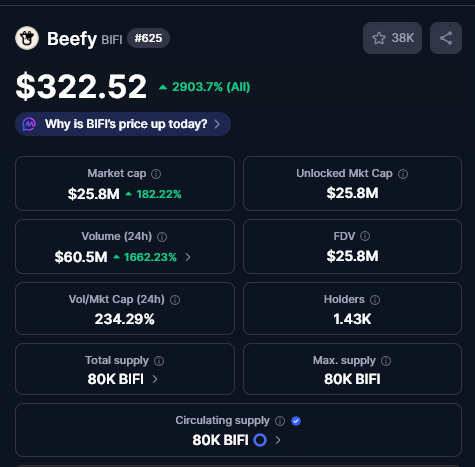
Unlike many DeFi tokens, BIFI has a hard-capped supply of just 80,000 tokens, with no minting or burning mechanism. All tokens are already in circulation.
Interesting pump for $BIFI today, never heard of them until now. Insane tokenomics –> listed on Binance w/ only 80,000 supply? $226M in TVL? Only $23M market cap? hmm 👀👀 pic.twitter.com/vofBXxnOKa
Holders who stake BIFI receive a share of protocol revenue generated from vault fees and can participate in DAO governance. This design makes BIFI closer to a yield-linked governance asset than a pure utility token.
BIFI Token Rallies 200% on Christmas Day 2025. Source: CoinGecko
Why BIFI Exploded on Christmas Day
The rally was driven less by new fundamentals and more by market structure.
First, BIFI’s ultra-low supply created a classic supply shock. With only 80,000 tokens outstanding, even modest buying pressure can move price aggressively.
On Christmas Day, demand overwhelmed thin order books.
Second, the token broke out after a long period of sideways trading. Once BIFI cleared key resistance levels, momentum traders and algorithmic scanners piled in, accelerating the move.
At the same time, 24-hour trading volume briefly exceeded BIFI’s market capitalization, a signal of intense short-term speculation rather than organic accumulation. That imbalance amplified volatility.
BIFI Daily Trading Volume Explodes on DEXs. Source: CoinMarketCap
Finally, the rally coincided with a rotation back into DeFi yield narratives. As meme coins cooled late in December, traders sought exposure to established revenue-generating protocols.
Beefy, with its multichain footprint and years-long operating history, fits that profile.
What the Rally Does, and Doesn’t Mean
Importantly, the Christmas surge did not reflect a sudden change in Beefy’s revenues, vault performance, or governance structure.
Instead, it highlighted how scarce DeFi governance tokens can experience extreme price swings when liquidity is thin and momentum builds.
While BIFI’s structure makes it sensitive to demand spikes, the same mechanics can work in reverse. Sharp retracements remain a clear risk once speculative flows fade.
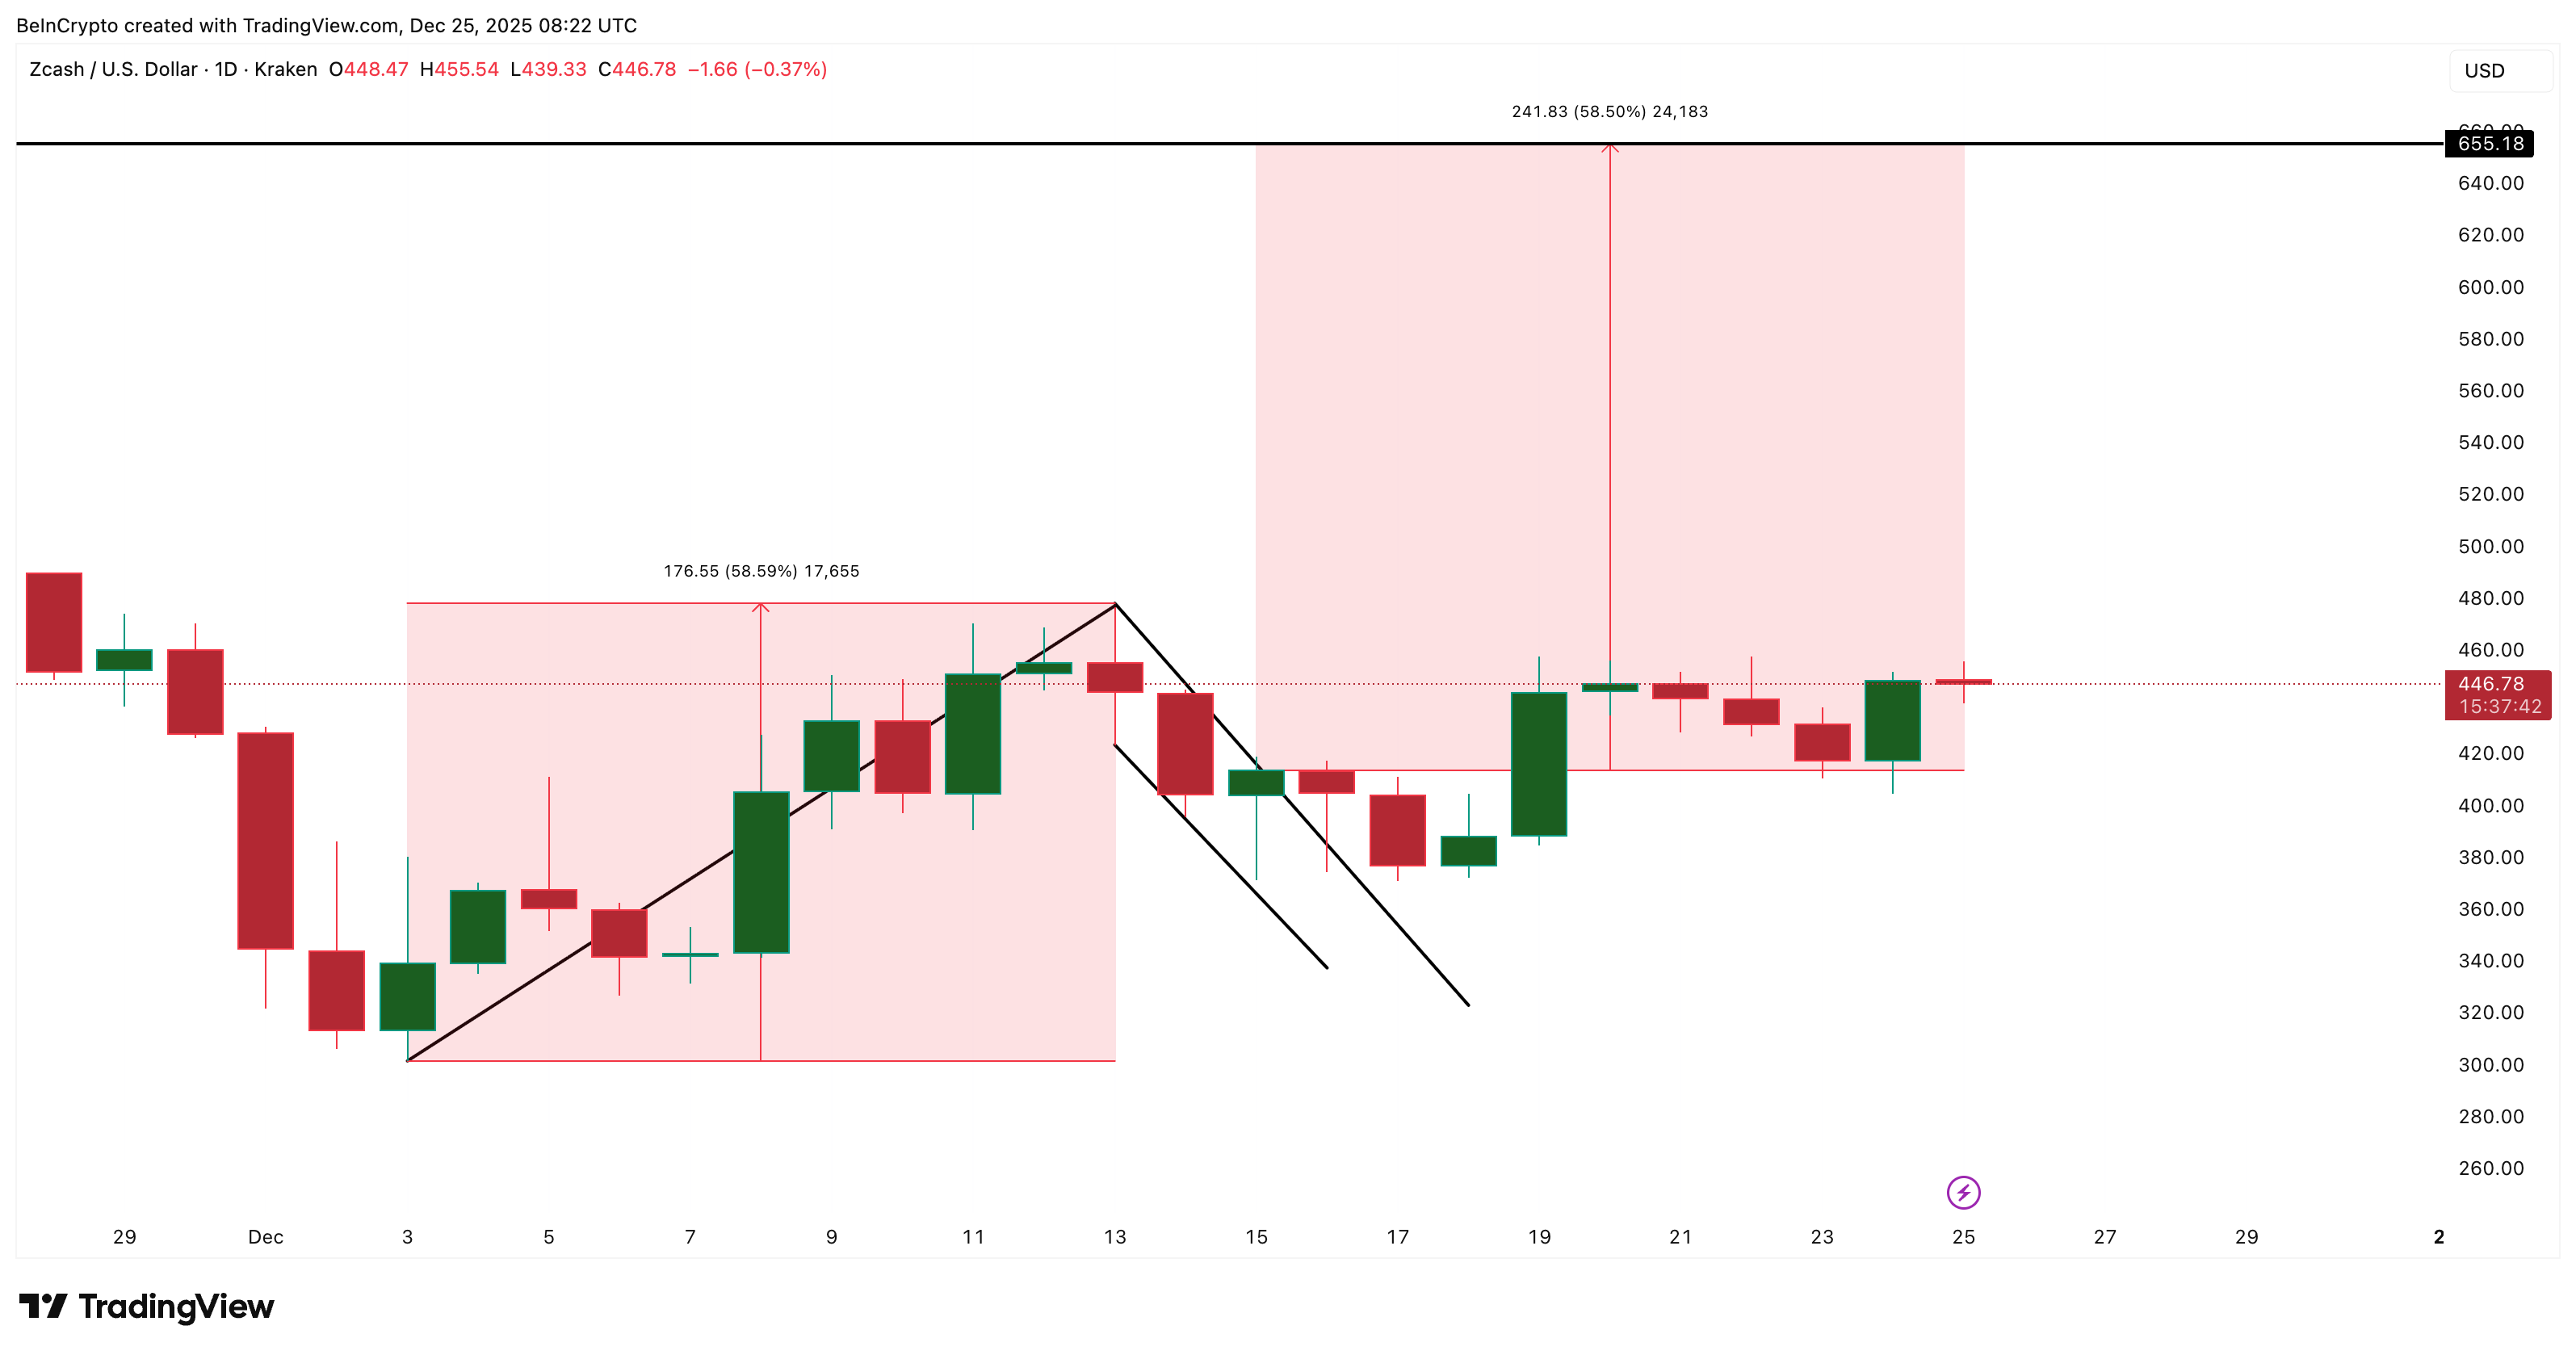
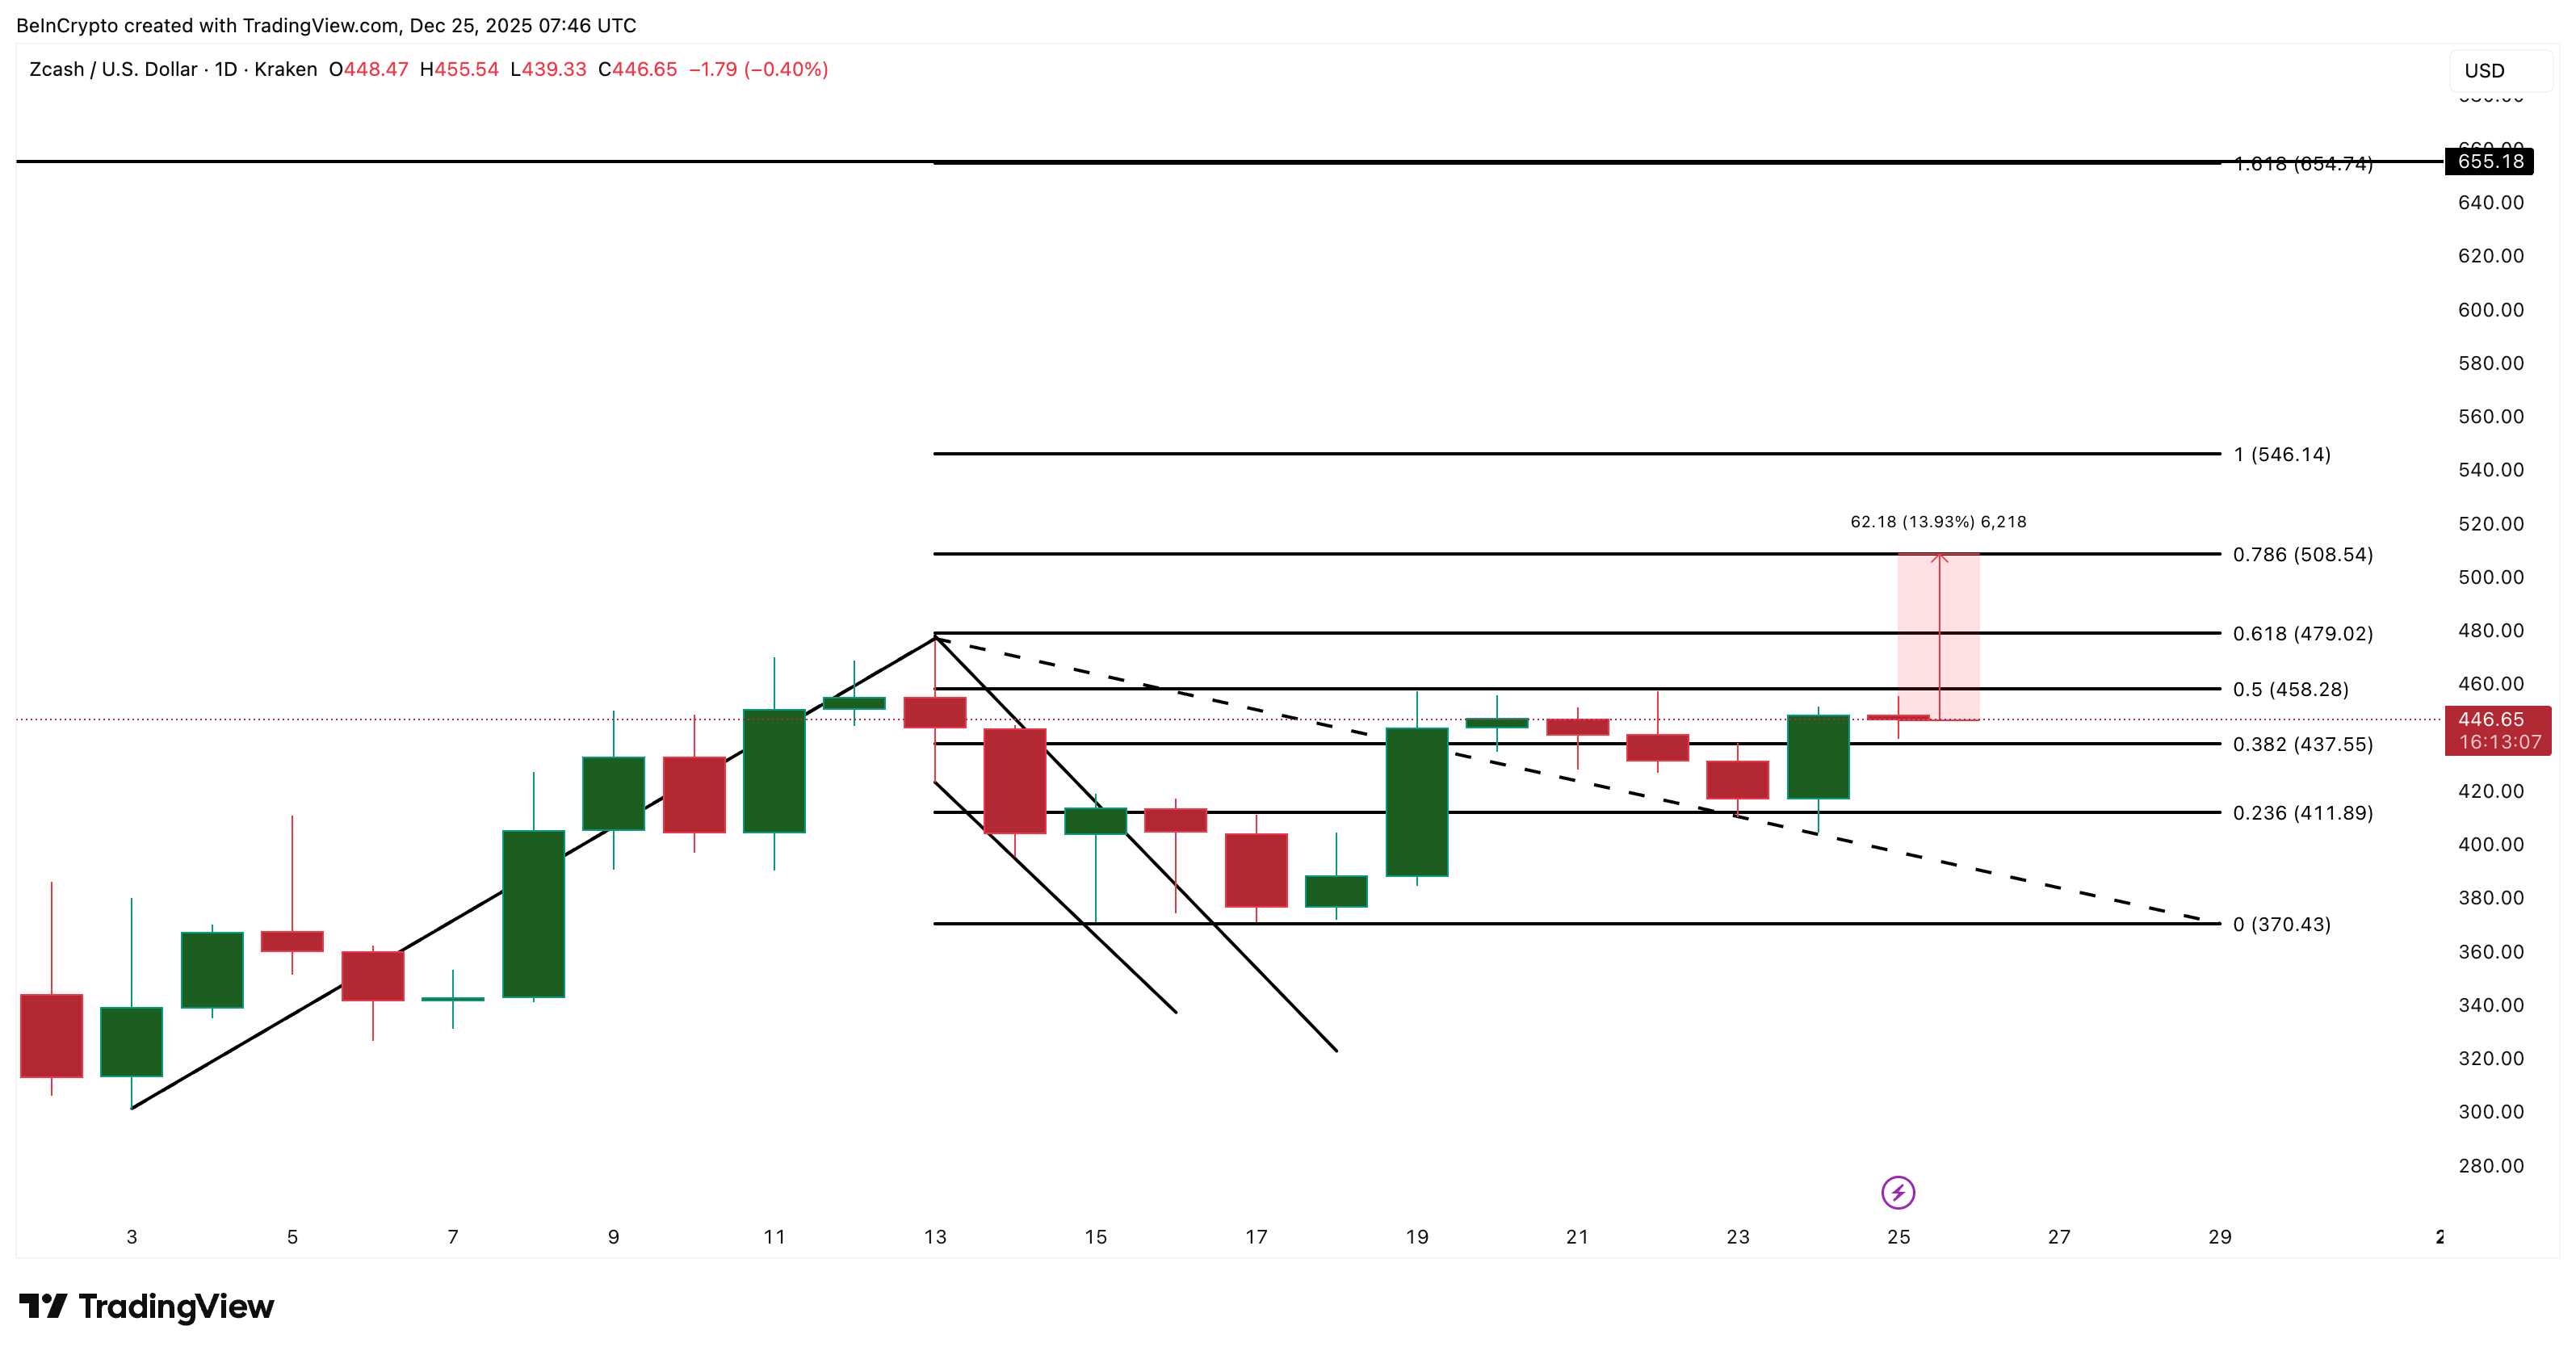
Zcash is up almost 10% in the past 24 hours and is trading near $446. The breakout from the bull flag pattern on December 15 remains active, and the projected target is near $655. That is the level that the flag projection and Fibonacci extension agree on. So the target survives. The problem is timing.
Mega whales have stepped in like Zcash price Santa, but the rest of the market is not ready to sing carols just yet.
Mega Whales Try To Deliver The Gift
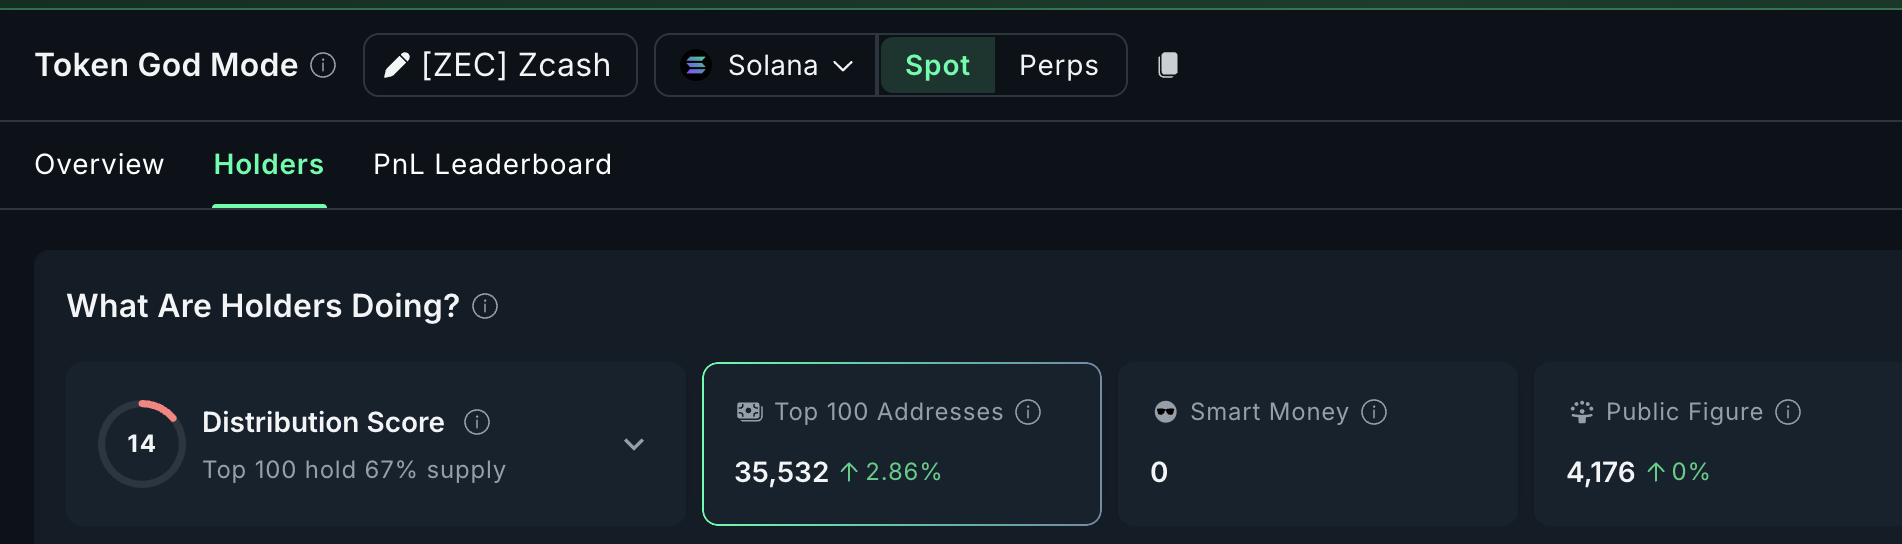
The top 100 Zcash addresses on Solana increased their spot holdings by 2.86% in the past 24 hours, moving from 34,542 to 35,532 ZEC. At the current ZEC price, that is roughly $441,480 in fresh positioning (small yet critical). That activity supports the idea that the bull flag breakout still matters and that long-term conviction is alive.
Want more token insights like this? Sign up for Editor Harsh Notariya’s Daily Crypto Newsletter here.
The structure is simple. A bull flag broke on December 15 and has not been invalidated yet. The price retraced, but the pattern still points higher. Whales adding into that structure is the closest thing to a price Santa this market has had all month.
That said, timing could be an issue as retail is not following.
Dip Buying Isn’t Convincing, And Derivatives Don’t Agree
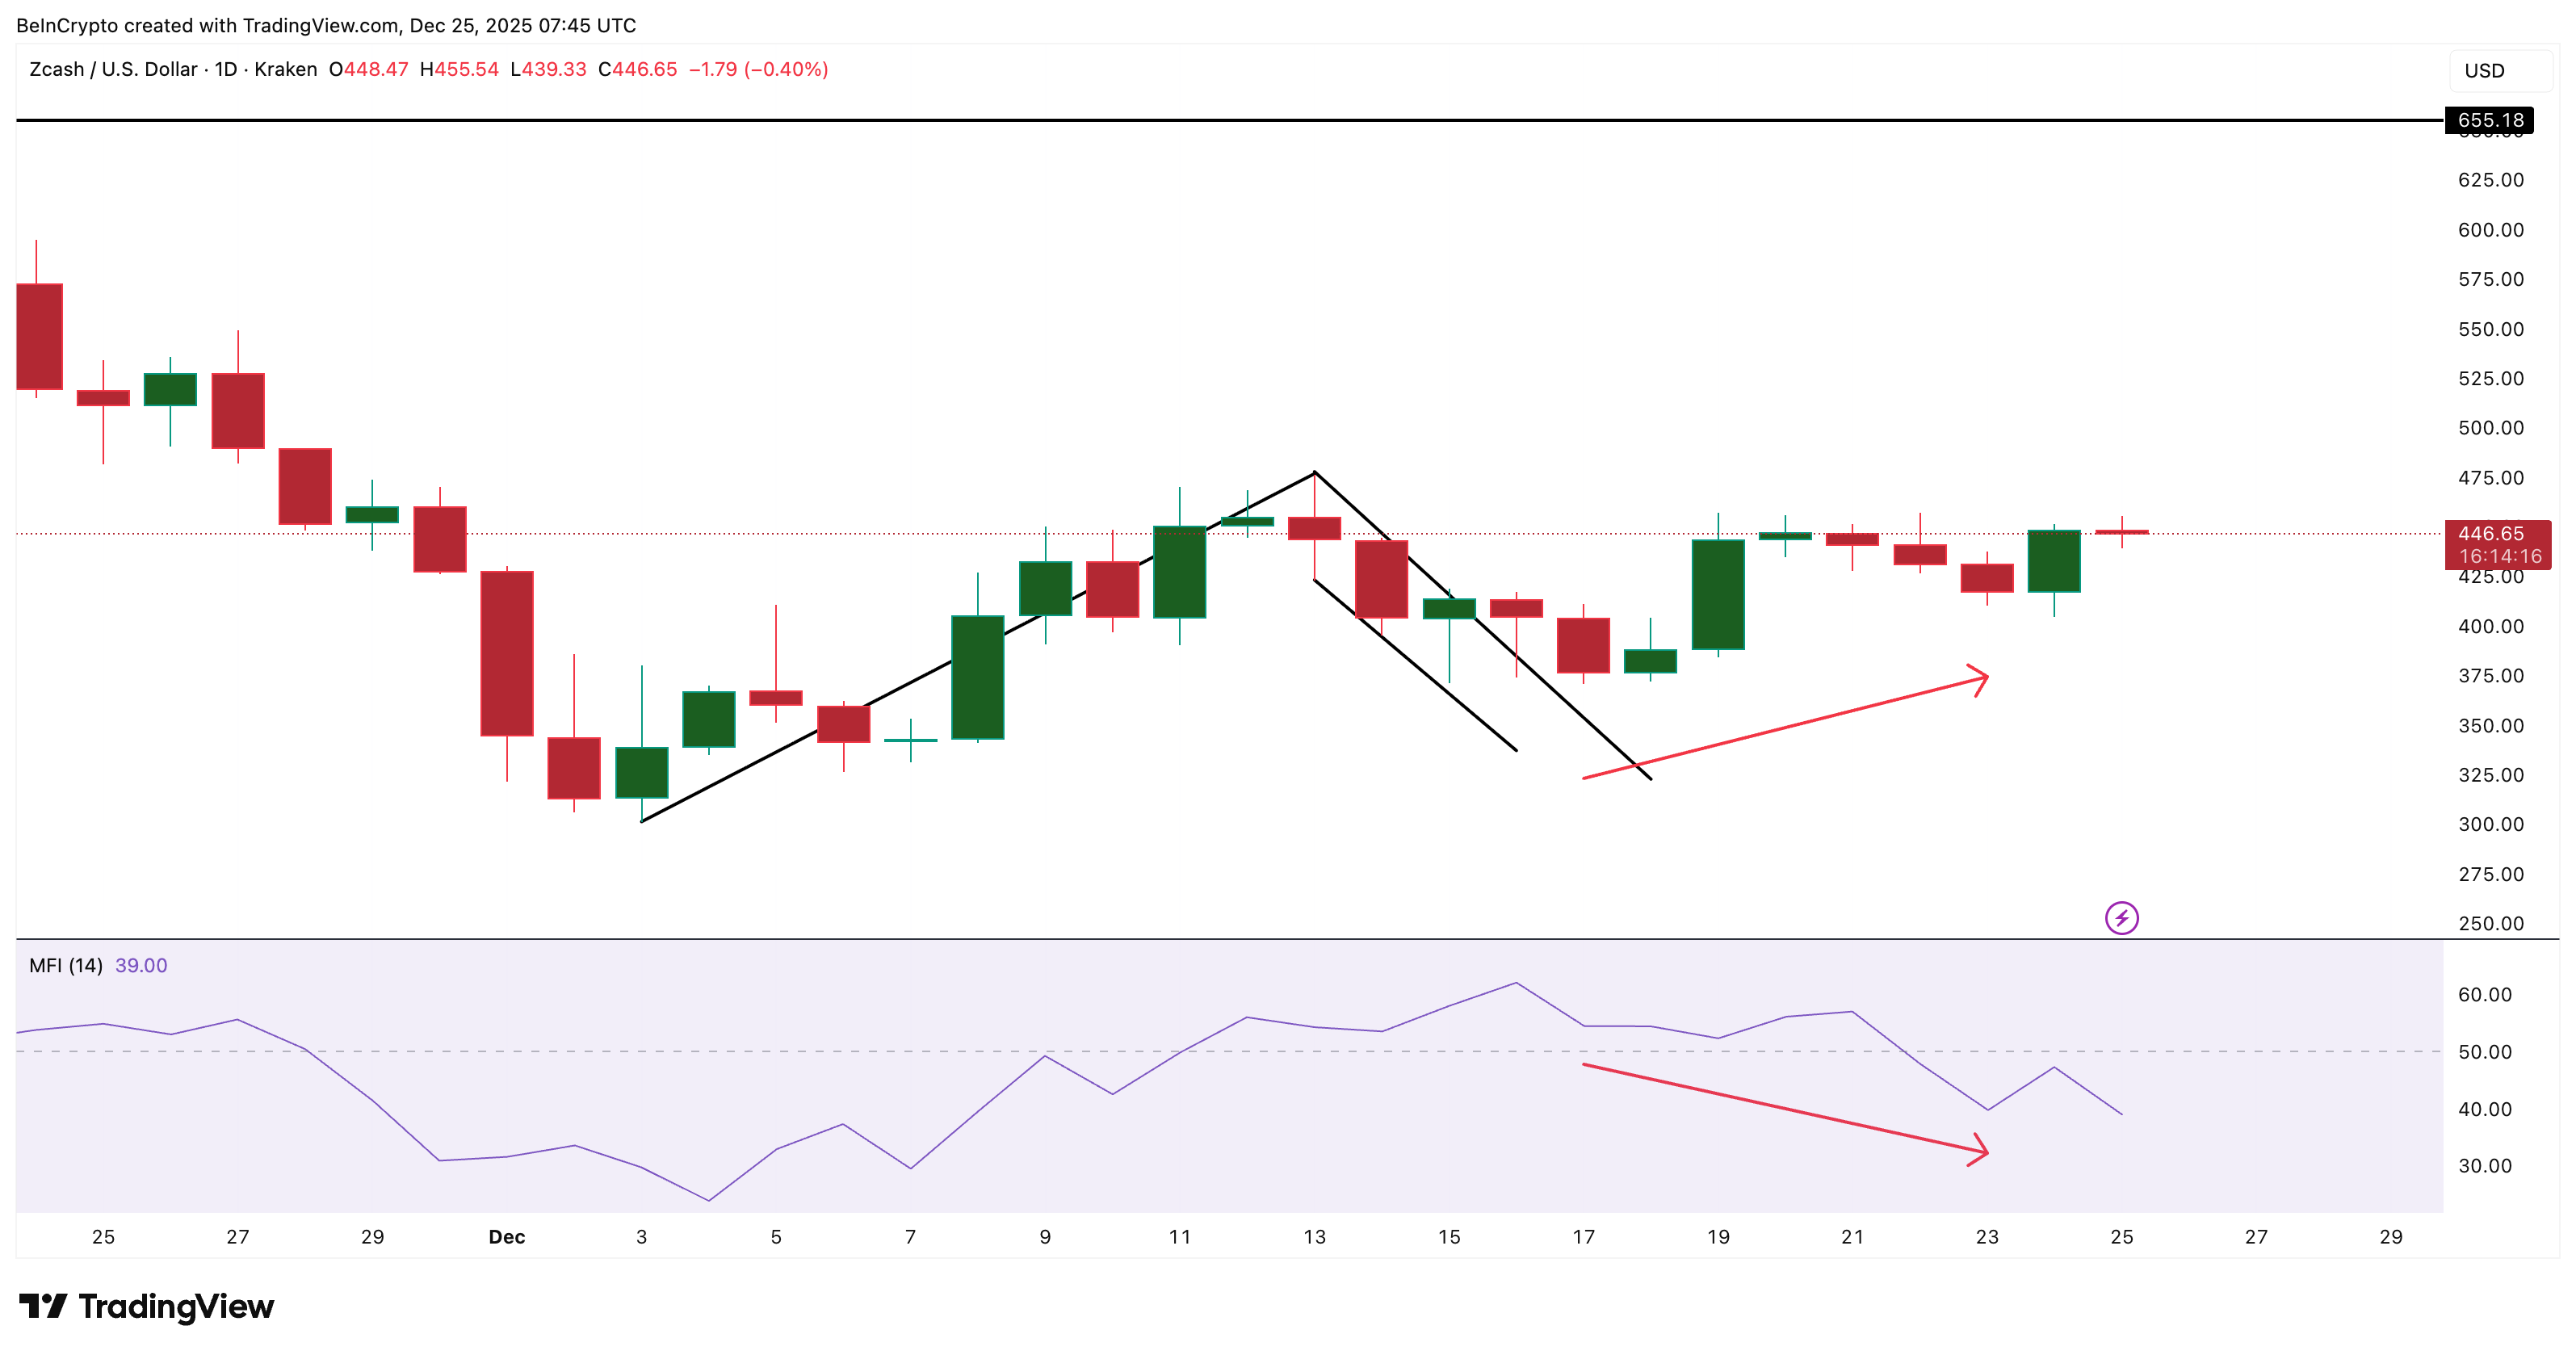
Between December 17 and December 23, the Zcash price trended higher. At the same time, the Money Flow Index (MFI) made lower lows. MFI measures buy and sell pressure using price and volume. When prices rise, but MFI fails to follow, it signals weak dip buying and a lack of confidence among smaller participants. It is not yet a breakdown signal, but it is a warning.
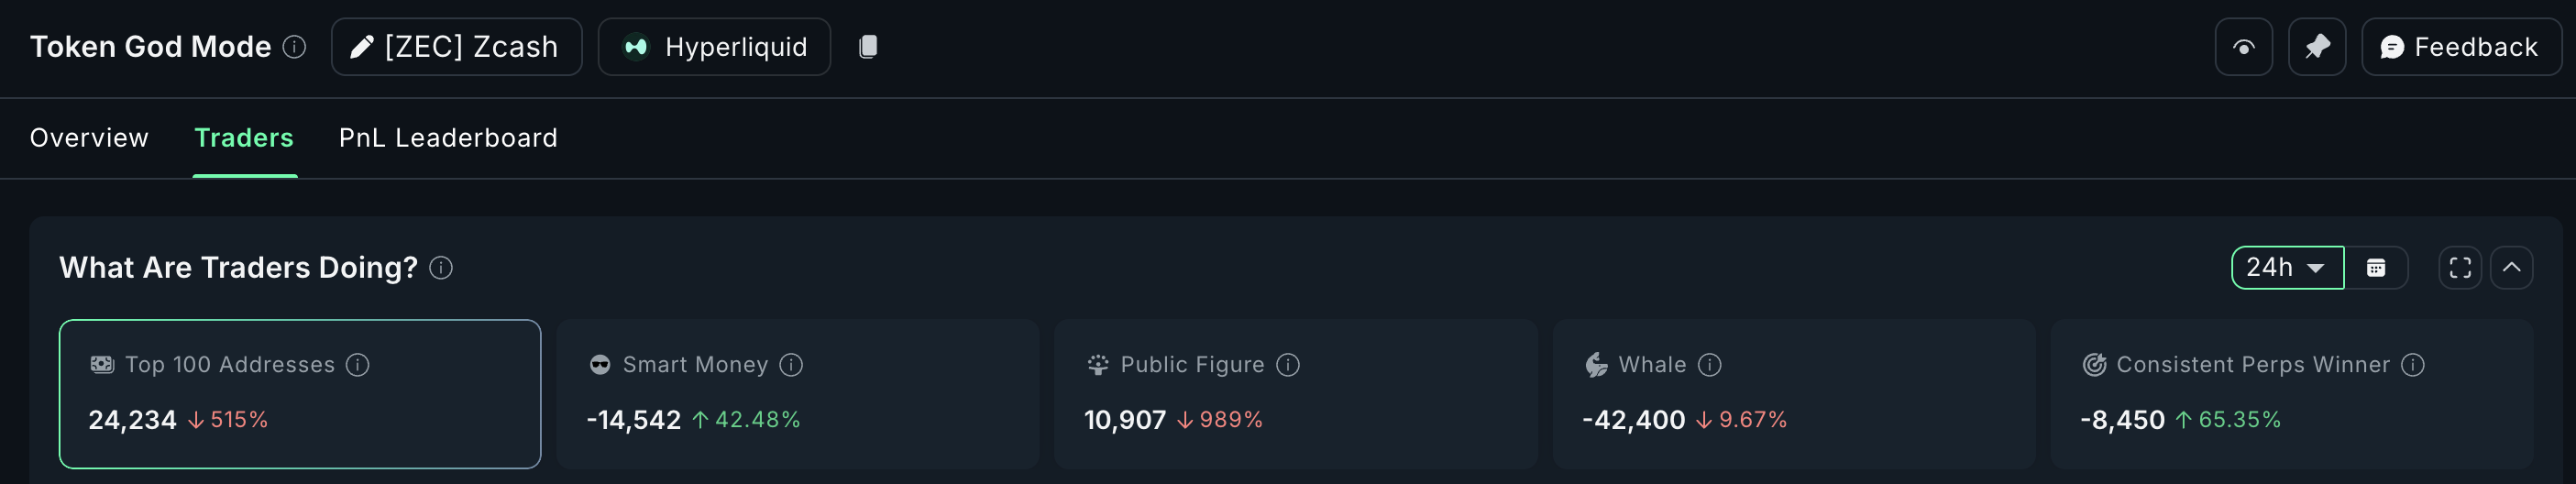
So even while spot mega whales accumulate ZEC (spot buying), the derivatives side is not backing the move. It shows a market that accepts the breakout thesis but does not trust the timing.
Put simply, the $655 target remains, but the rally lacks broad-based near-term support.
Zcash Price Levels That Decide The Route To $655
The first checkpoint for momentum sits near $458. That is the 0.5 Fibonacci level. Clearing that area with a daily close opens room toward $479 and then $508. If the Zcash price reaches $546, momentum would match the original bull flag projection, and $655 becomes realistic, not just mathematical.
If Zcash reaches $655, that satisfies the measured move of the flag and the 1.618 Fibonacci extension.
If momentum fails, $411 becomes the first check for damage. Below that, $370 threatens a full invalidation. For now, the flag structure stays intact. Whales are trying to deliver. Retail and derivatives are not ready to open the door.
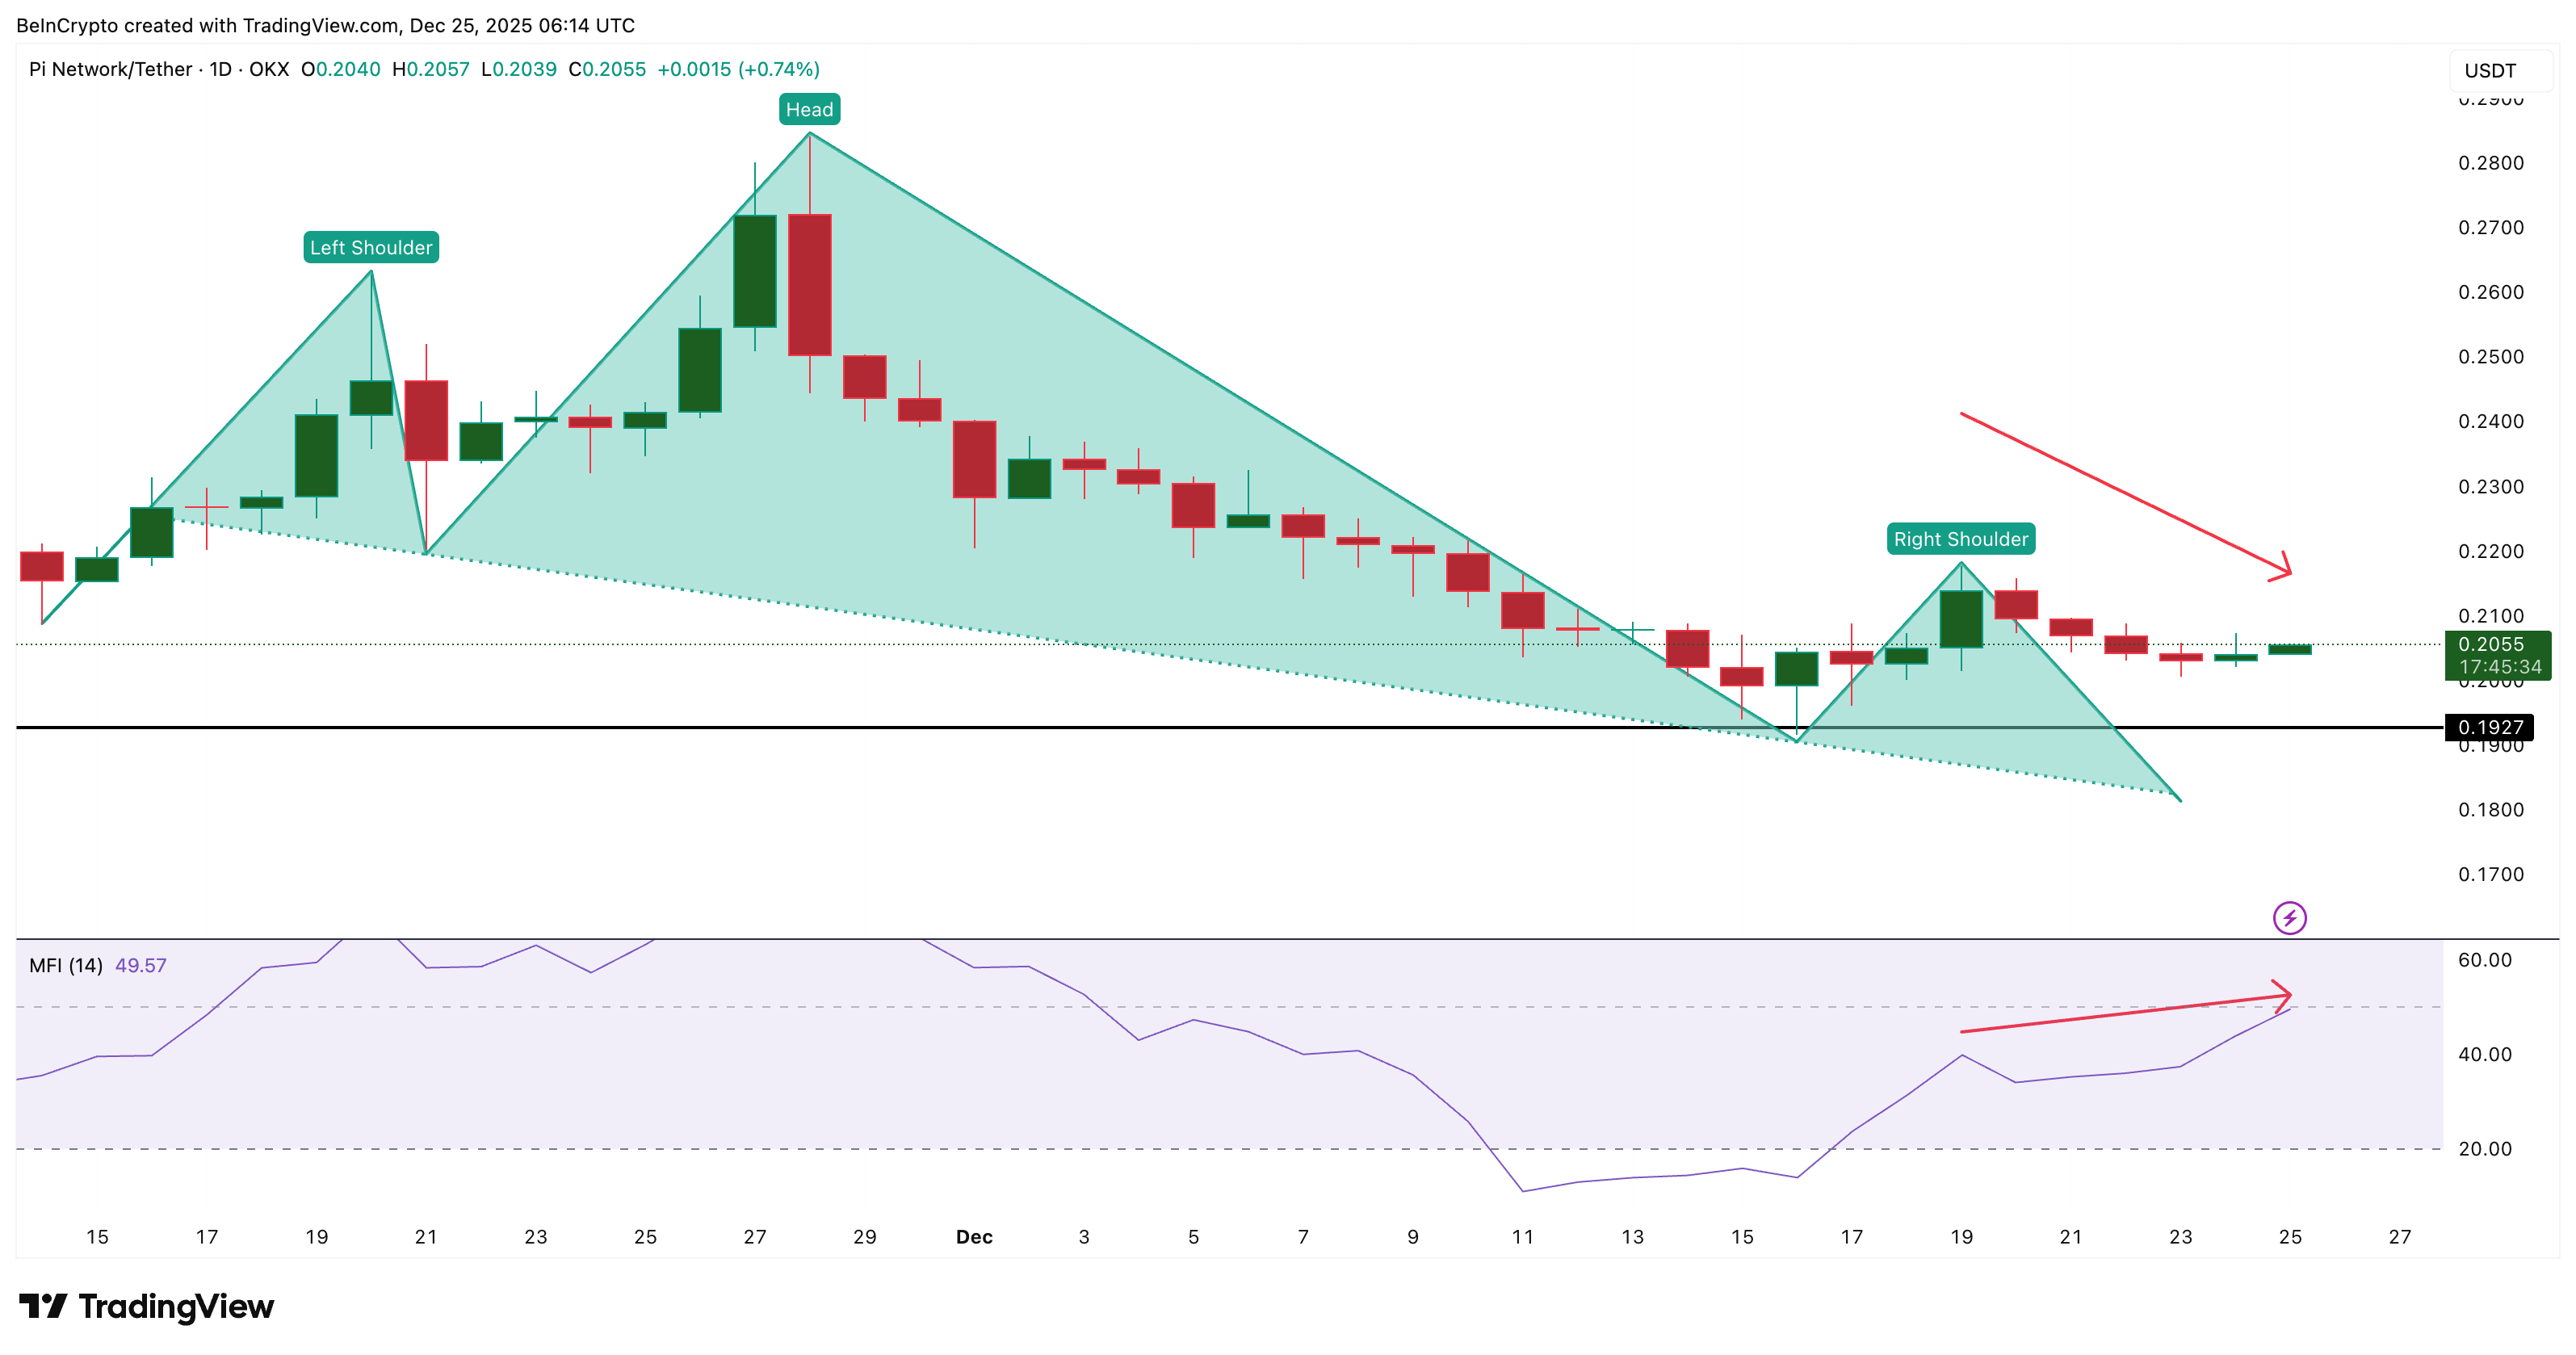
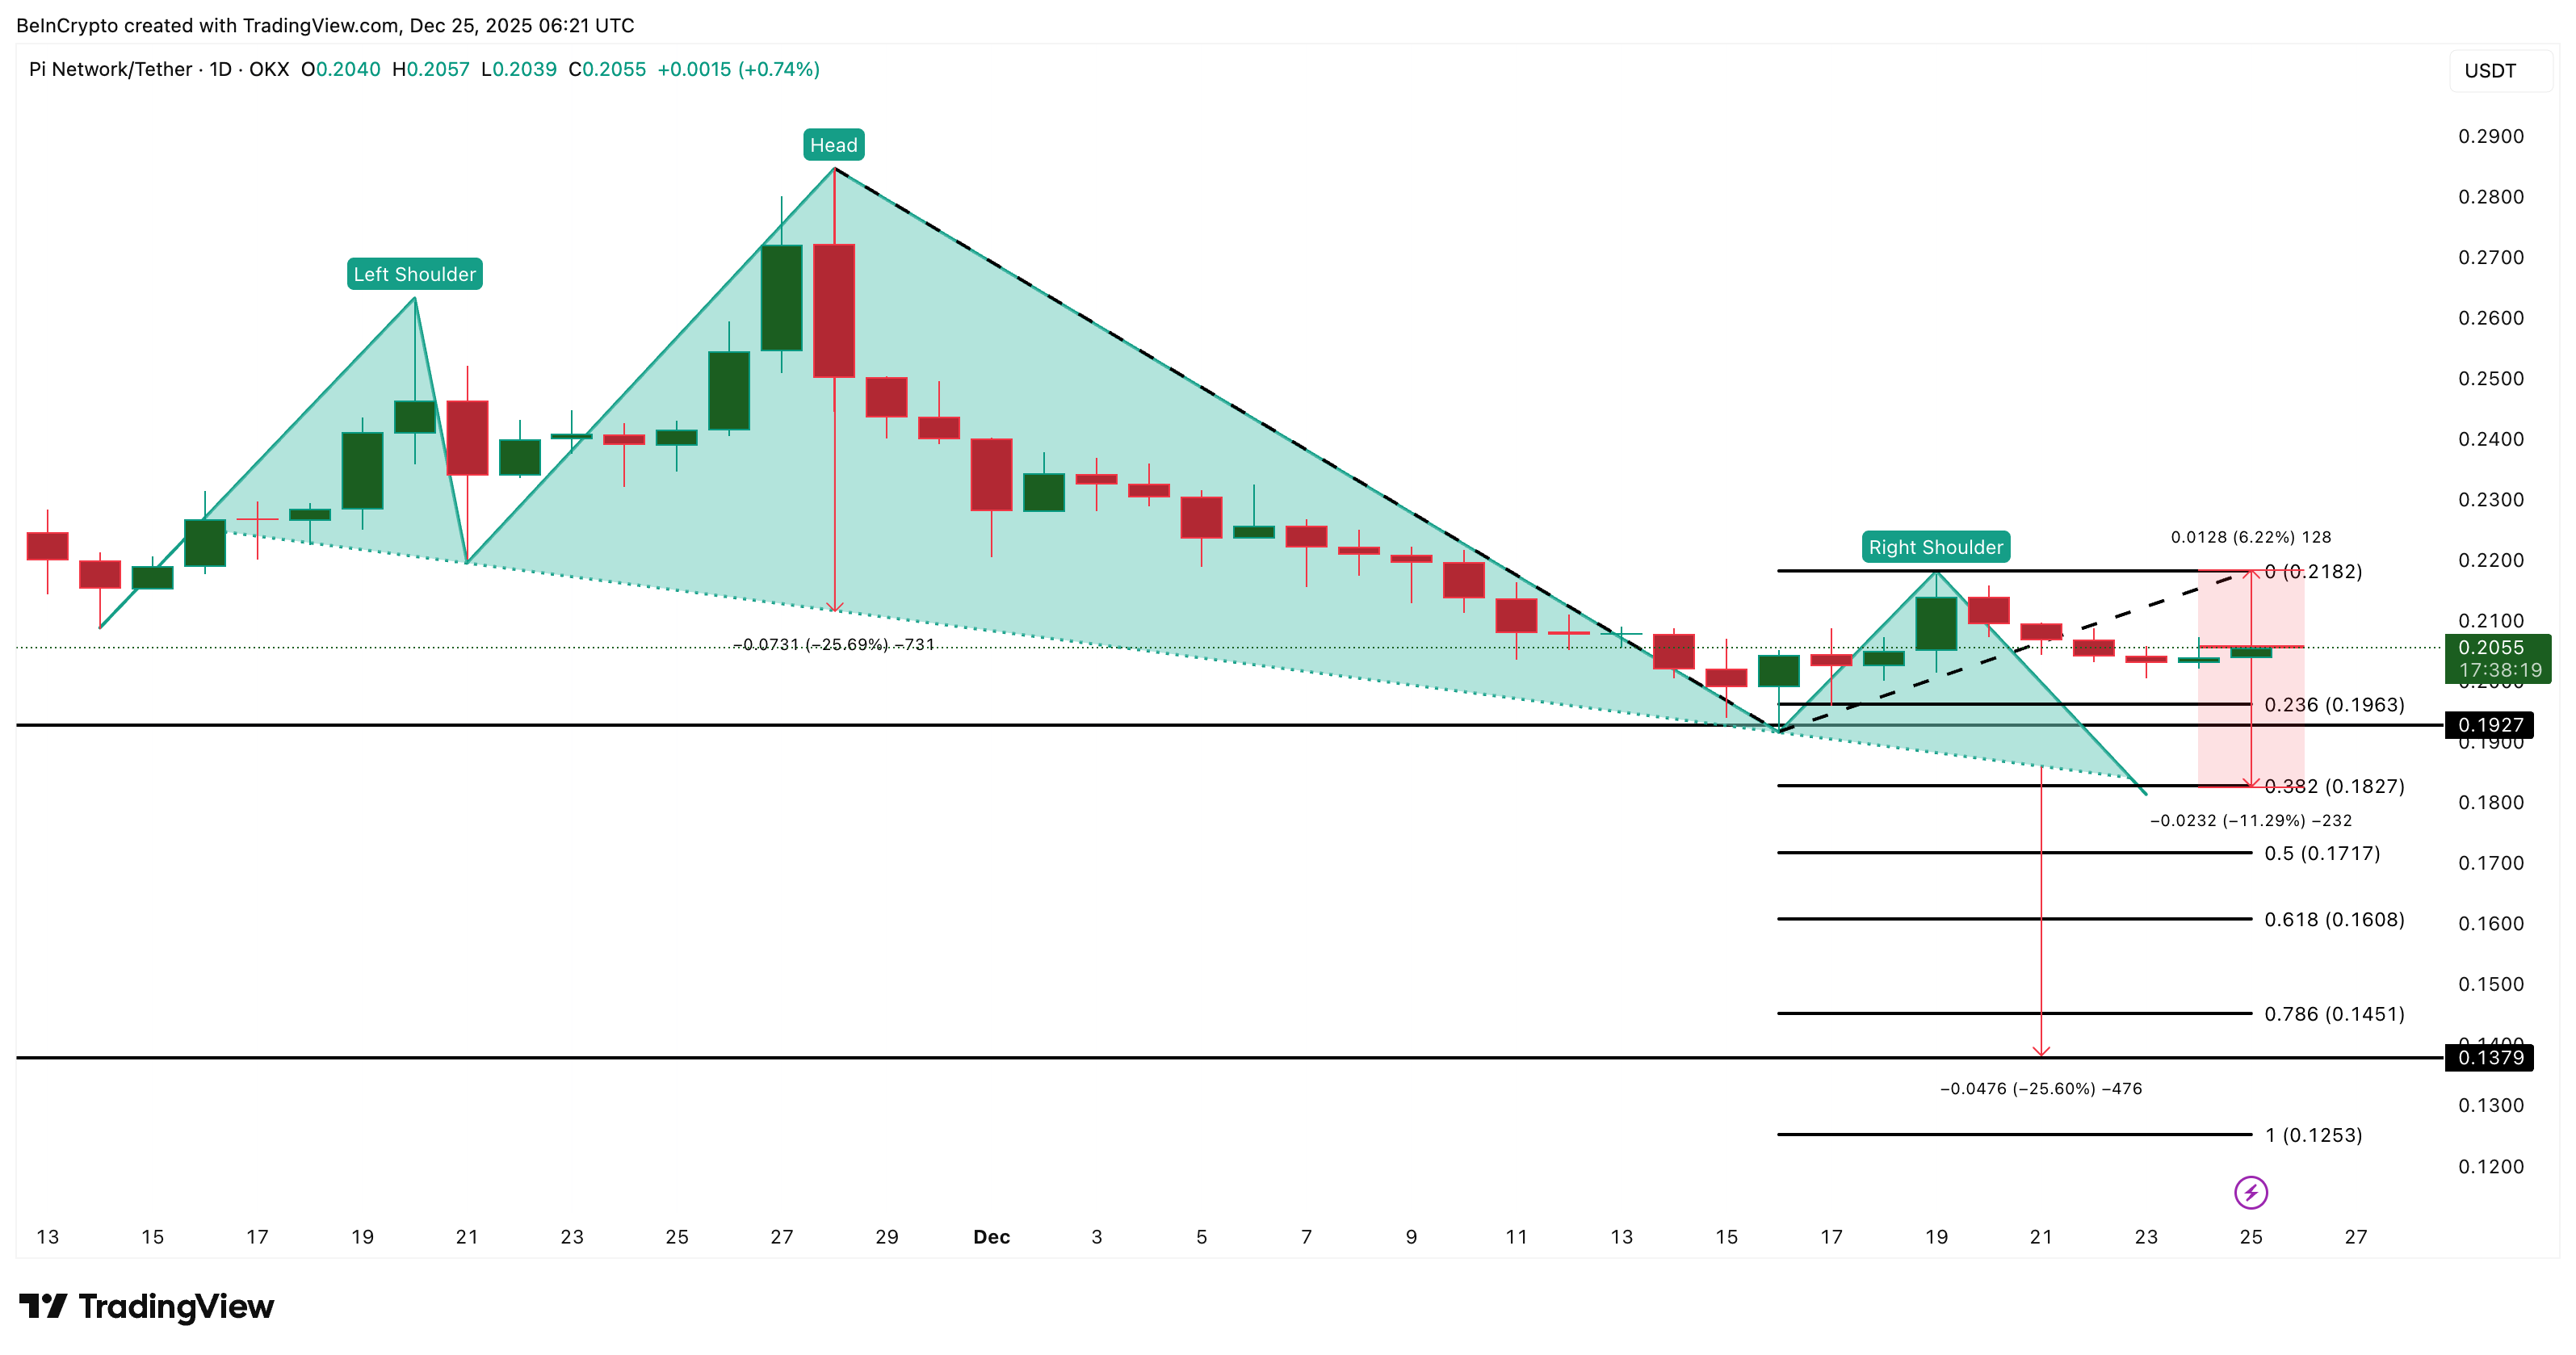
Pi Coin price is up a little over 1% in the past 24 hours, but it still trades more than 20% lower over the last three months. The downtrend has not reversed, yet something has shifted.
A breakdown was forming on the chart, but dip buyers have stepped in at the last possible moment. Now, only big money can confirm whether this survival attempt becomes a strong rebound, or if Pi Coin goes right back toward the breakdown zone.
Dip Money Tries to Hold the Line
Between December 19 and December 25, the price of Pi Coin trended lower. At the same time, the Money Flow Index (MFI), which tracks whether capital is entering on dips, made higher highs. That is a bullish divergence. It suggests dip buyers are absorbing sell pressure before it can trigger a full breakdown.
Want more token insights like this? Sign up for Editor Harsh Notariya’s Daily Crypto Newsletter here.
The divergence isn’t cosmetic. The MFI curled upward at the exact moment the Pi Coin price started moving toward the neckline of its head and shoulders pattern. That pattern still points down, but the reaction in MFI helped prevent the immediate breakdown.
Only Big Money Can Turn the Price Right Side Up
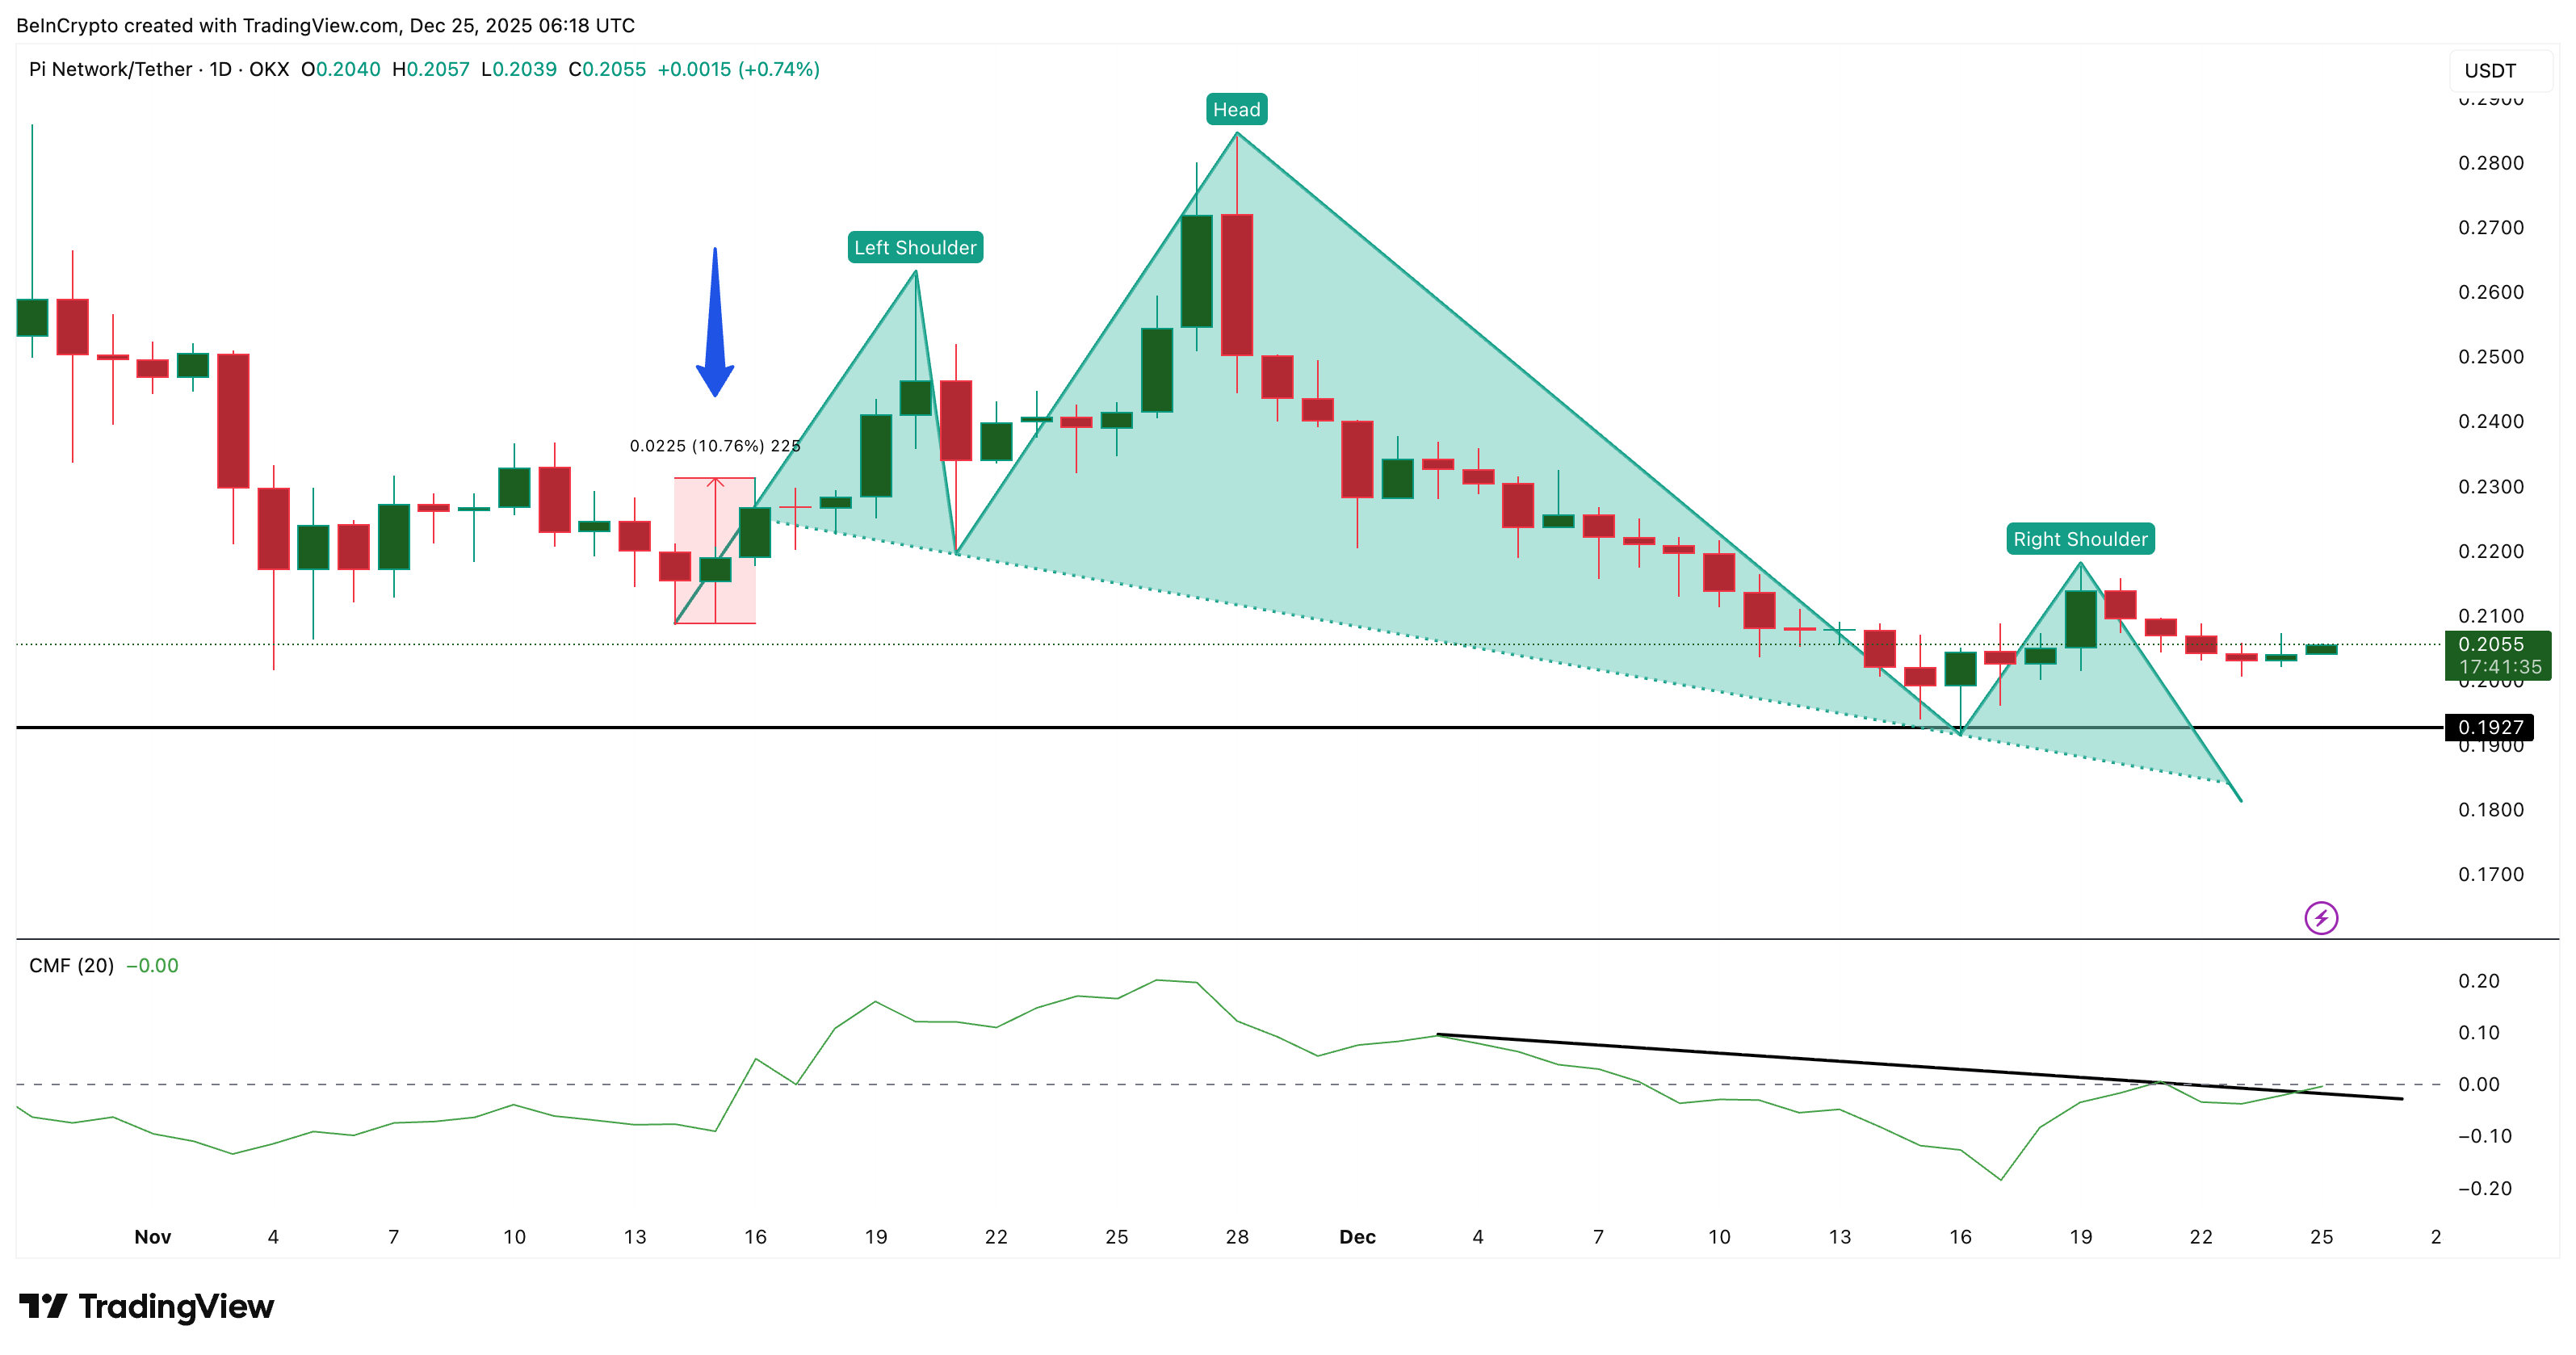
This is where the Chaikin Money Flow (CMF) enters. CMF tracks big money flows. It measures whether deep liquidity and larger orders are actually entering the market. Pi Coin’s CMF has broken above its descending trend line and is now aiming for a zero line break for the first time since mid-November.
For this attempt to flip the structure right side up, CMF must close above the zero line. The last time CMF did this was between November 14 and November 16. When that occurred, Pi Coin rallied by 10.76% in the subsequent sessions.
The structure is similar at present, but confirmation is lacking. Without CMF above zero, the move stays incomplete. The PI price chart is paused mid-pivot.
Pi Coin Price Levels That Decide Everything
The neckline of the head and shoulders pattern sits near $0.182. As long as Pi Coin holds above this line, the bearish structure remains unconfirmed. A move above $0.218 would mark a 6% push higher and break above the right shoulder of the pattern. That would weaken the breakdown thesis and signal that the CMF shift is real.
Below $0.192 (the warning level), the breakdown story restarts. A daily close under $0.182 (11% down) confirms the neckline break, opening the door to a measured move toward $0.137. That is the 25% risk implied by the head-to-neckline measurement. It is not guaranteed, but the math is not forgiving.
For now, the Pi Coin price is caught between dip money and big money. MFI has already acted. CMF still hasn’t. Not fully. Until both align, Pi Coin is suspended between survival and continuation.
Ethereum (ETH) has traded sideways around the $3,000 level for the past two weeks. Although recent buying came from firms such as BitMine and Trend Research, the demand appears insufficient.
The following data reveals the rest of the picture, as selling pressure remains equally strong. As a result, ETH is unlikely to stage a quick recovery in the short term.
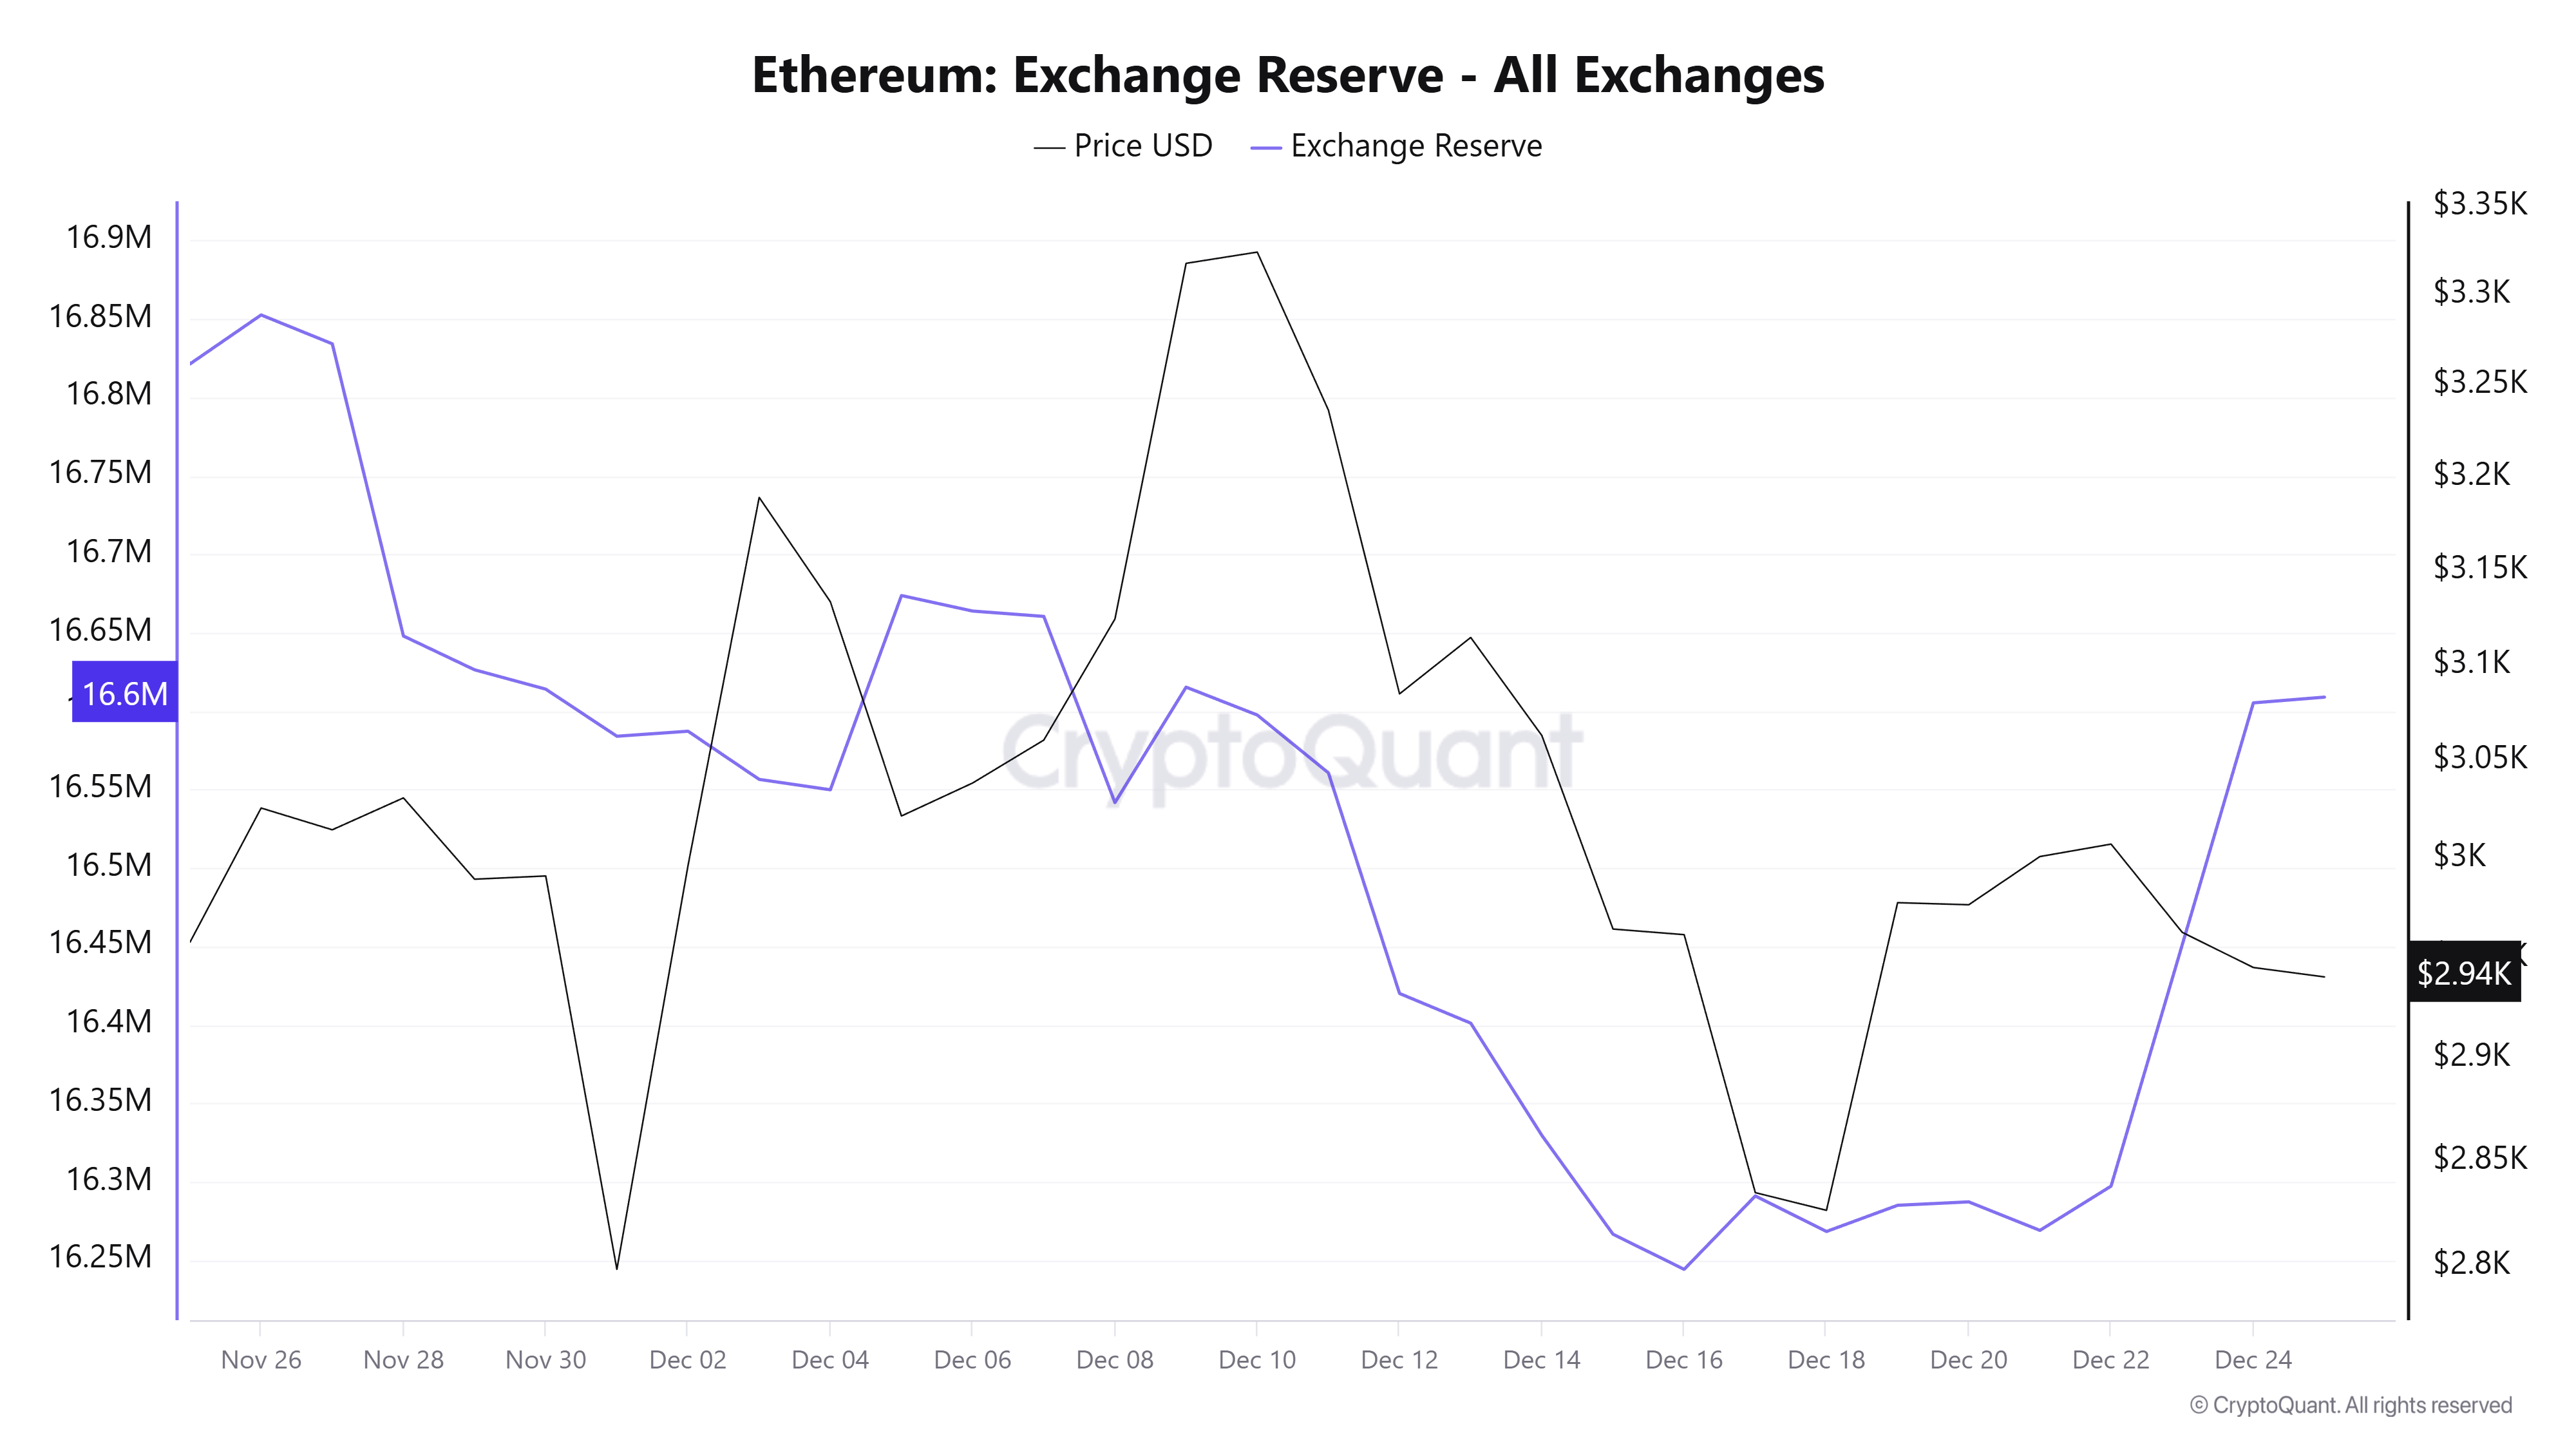
1. ETH Exchange Reserves Rise Again During Christmas Week
Data from CryptoQuant shows that ETH reserves across all exchanges had declined steadily for several months.
However, the trend reversed in December. This week, ETH exchange reserves increased from 16.2 million to 16.6 million. That rise equals roughly 400,000 ETH transferred onto exchanges.
On-chain data reveals that one “OG whale” alone deposited 100,000 ETH into Binance.
Recent BeInCrypto reports show that BitMine Immersion Technologies bought 67,886 ETH this week. Trend Research also purchased 46,379 ETH. Even so, these figures remain smaller than the amount of ETH moved onto exchanges.
If ETH is transferred to exchanges for liquidation and exceeds buying absorption, selling pressure could intensify. If this trend continues into the final days of the year, ETH prices may face further downside pressure.
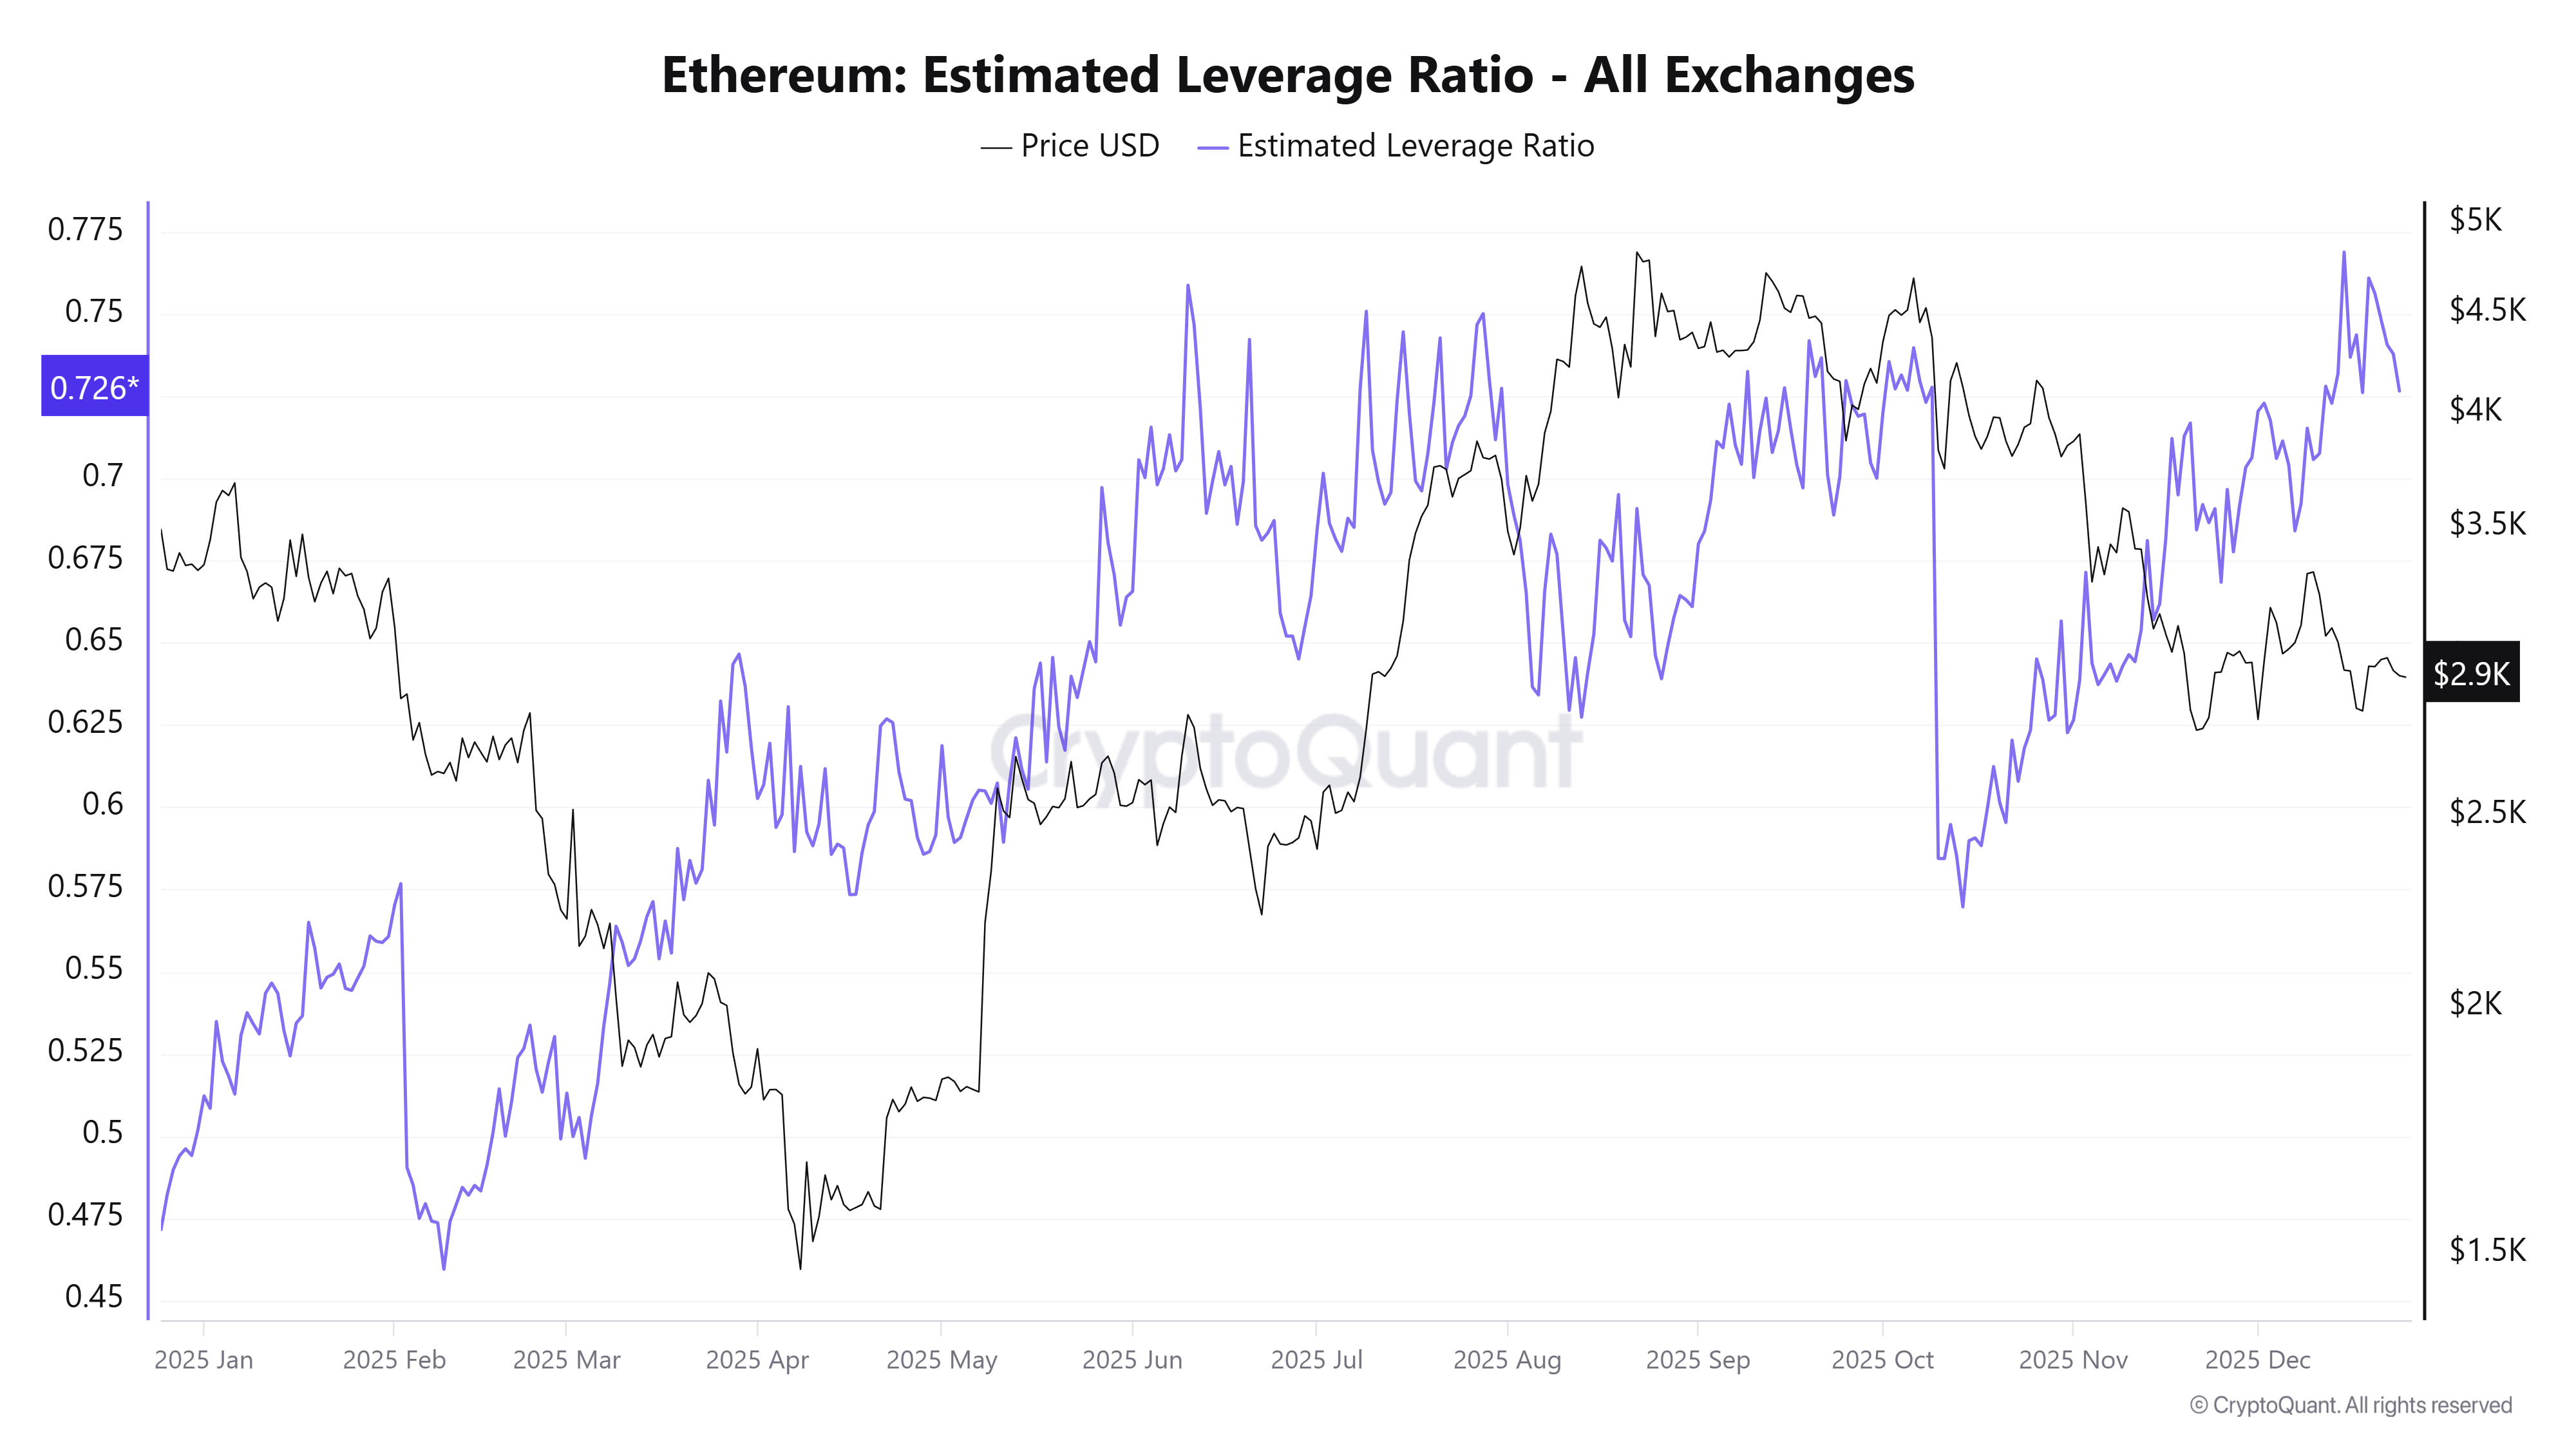
2. Ethereum’s Estimated Leverage Ratio Remains Elevated
Another key metric is Ethereum’s Estimated Leverage Ratio, which remains at an alarming level, according to CryptoQuant.
This ratio equals exchange open interest divided by coin reserves. It reflects the average leverage used by traders. Rising values suggest more investors are taking on higher leverage in derivatives markets.
On October 10, the day with the largest liquidation losses in market history, the ratio stood at 0.72. Currently, the ratio has returned to similar levels. Some readings even reach as high as 0.76.
With leverage still elevated, Ethereum remains vulnerable to small price moves. Such moves could trigger cascade liquidations.
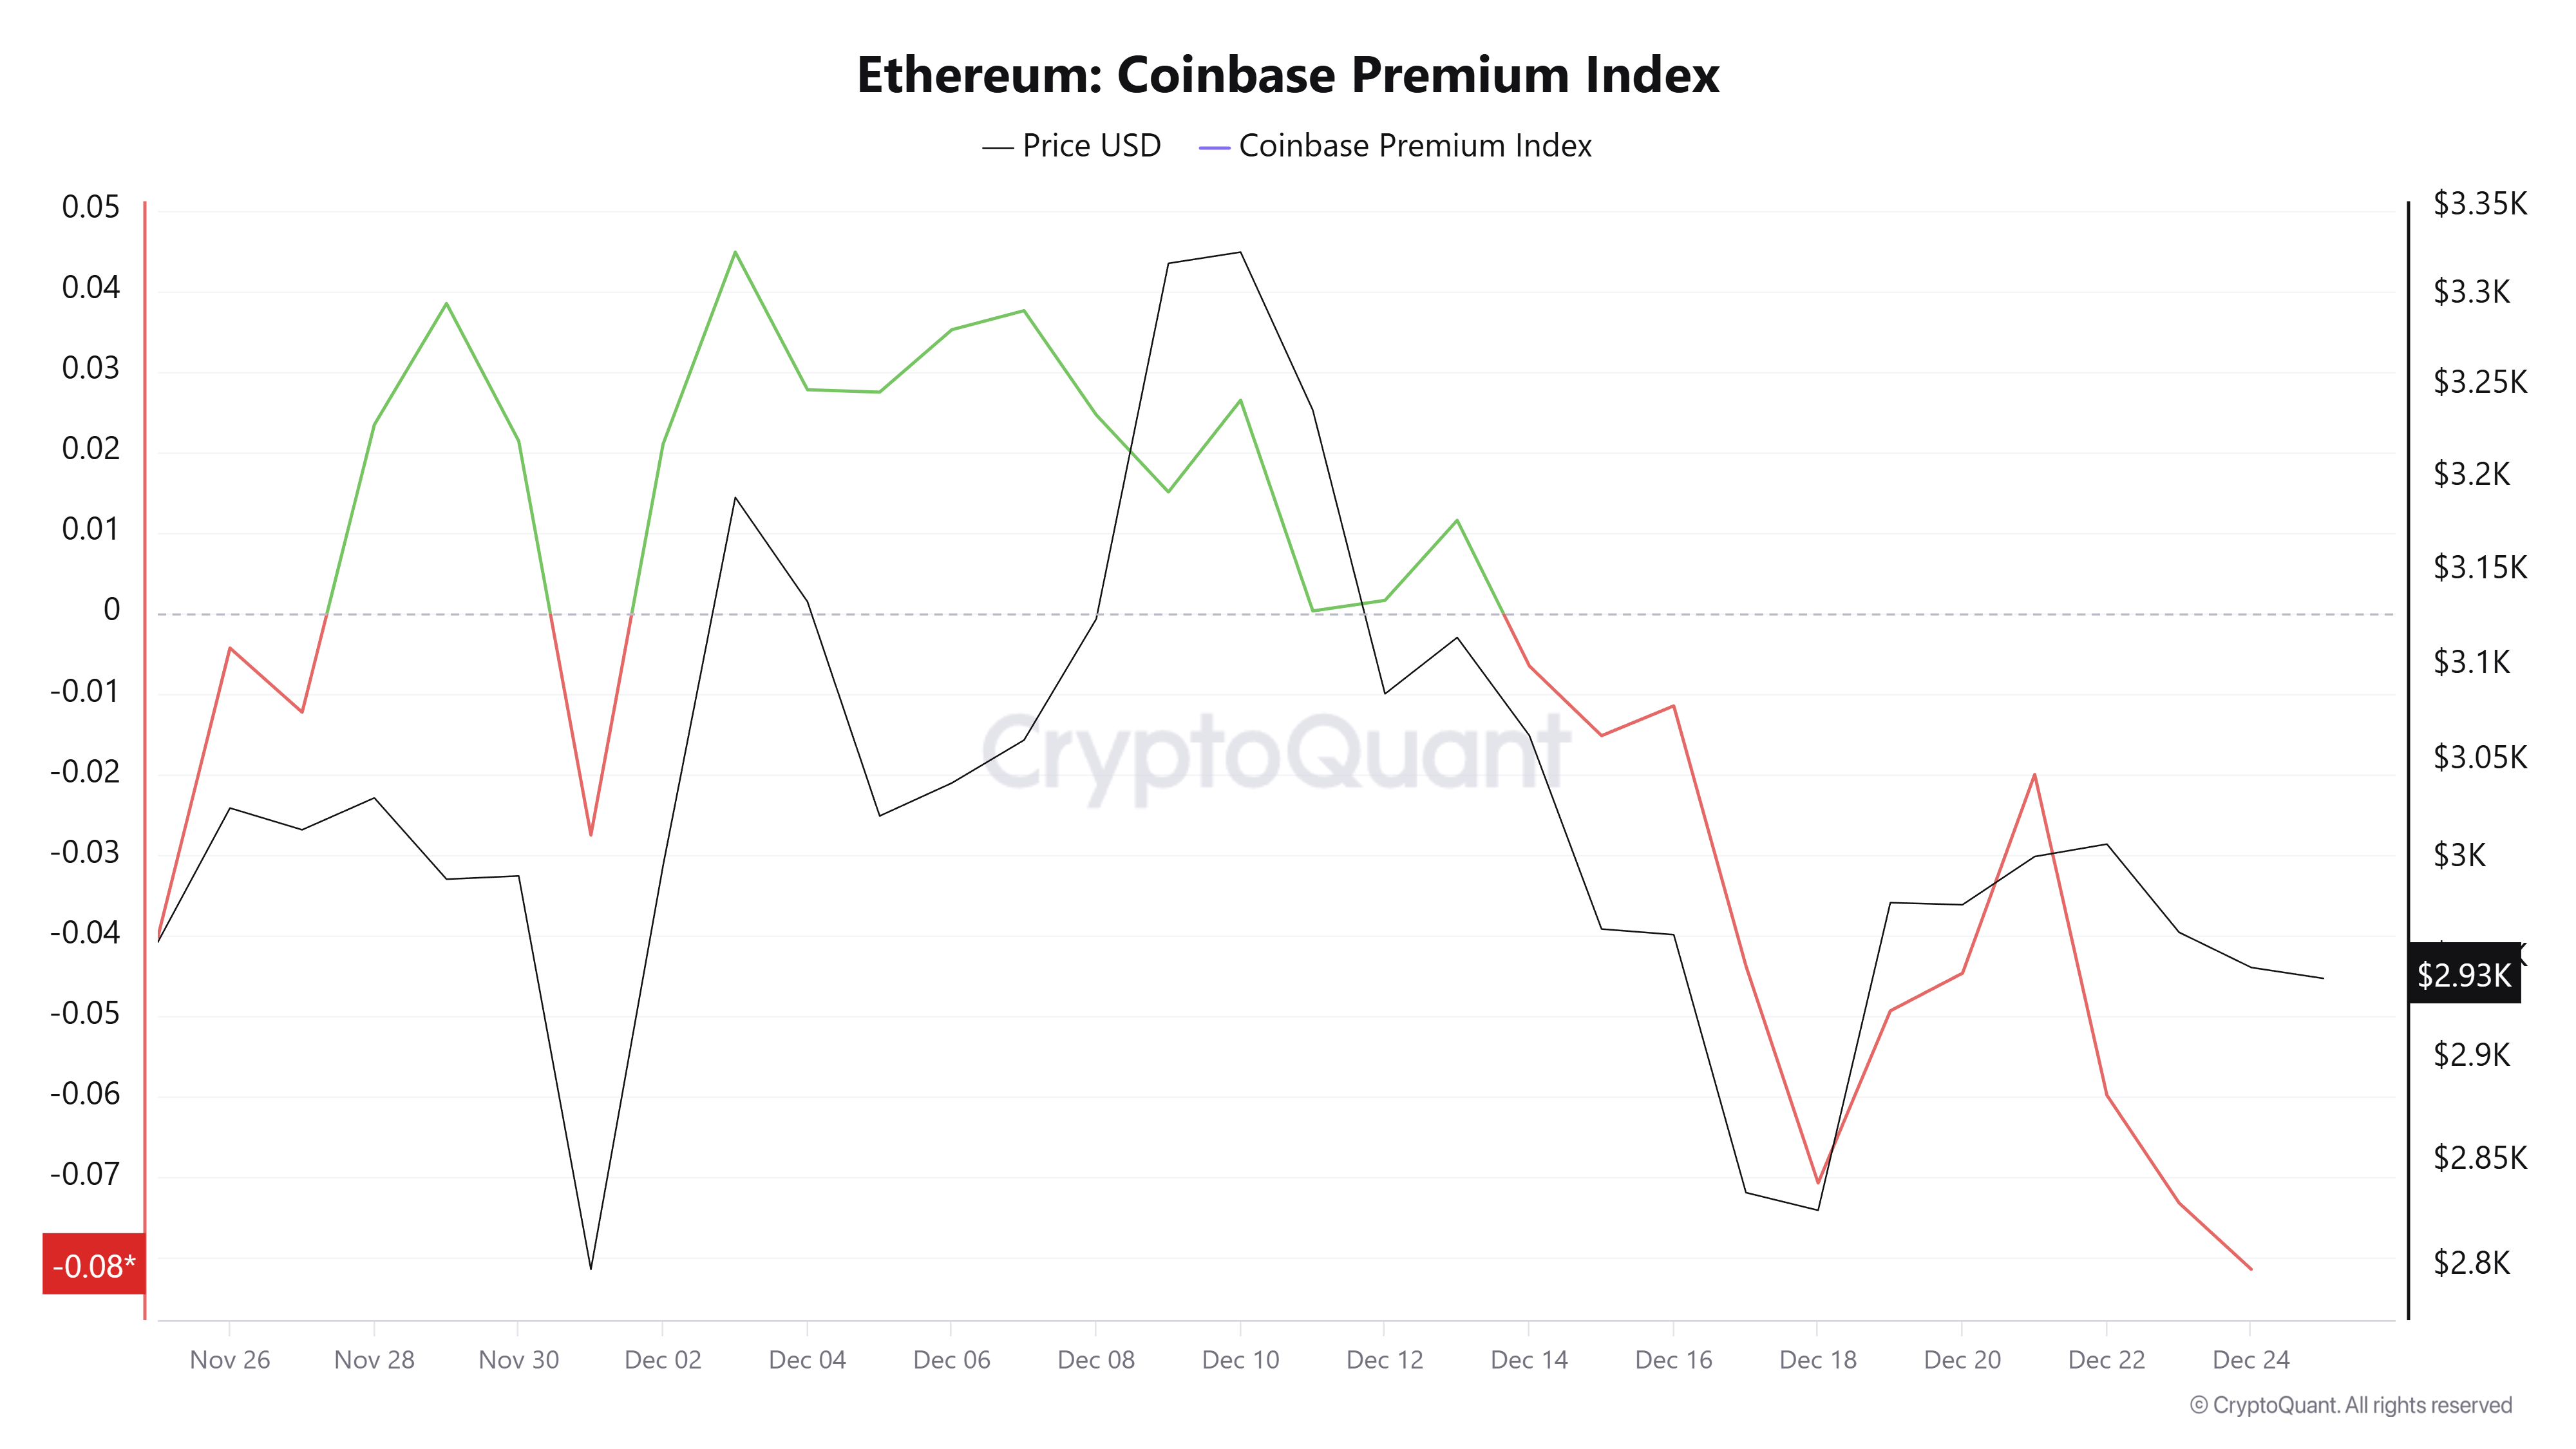
3. Ethereum Coinbase Premium Turns Deeper Negative in December
BeInCrypto previously reported that Ethereum’s Coinbase Premium turned negative in December.
During Christmas week, the indicator moved further into negative territory. It currently stands at -0.08, the lowest level in the past month.
This indicator measures the percentage price difference between ETH on Coinbase Pro (USD pair) and Binance (USDT pair). Negative values indicate lower prices on Coinbase.
This trend suggests that US investors continue selling at discounted prices. ETH may struggle to recover in the short term until the Coinbase Premium turns positive again.
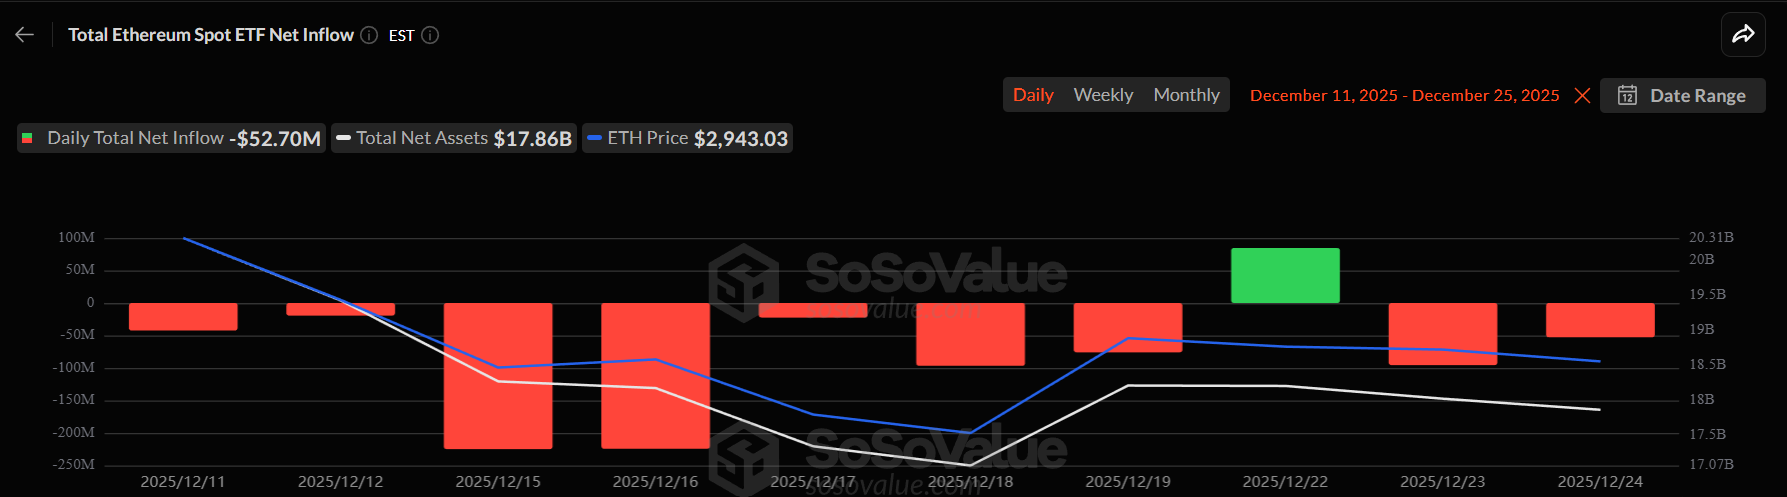
4. ETH ETF Flows Enter a Second Consecutive Month of Outflows
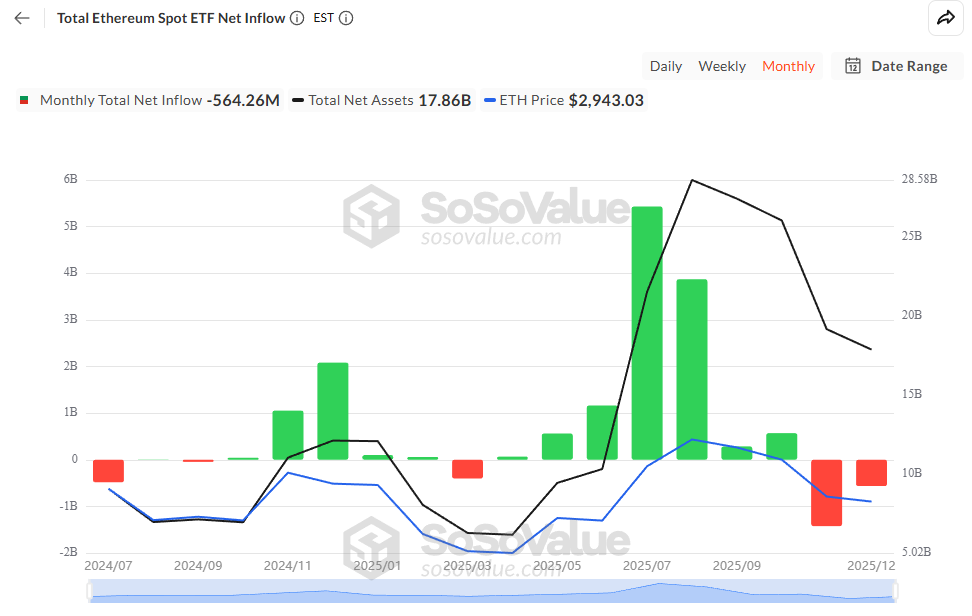
December is nearing its end, and ETH ETF flows are likely to close with a second straight month of net outflows.
Last month, net flows across all ETH ETFs reached -$1.42 billion. This month, outflows have already exceeded $560 million.
Total Ethereum Spot ETF Net Inflow. Source: SoSoValue.
Without fresh inflows, ETH lacks upward momentum. If outflows persist, especially during low-volume year-end holidays, prices may retest lower support levels.
“Since early November, the 30D-SMA of net flows into both Bitcoin and Ethereum ETFs has turned negative and remained so. This persistence suggests a phase of muted participation and partial disengagement from institutional allocators, reinforcing the broader liquidity contraction across the crypto market,” Glassnode reported.
In summary, four signals—rising exchange reserves, elevated leverage, deeply negative premiums, and sustained ETF outflows—suggest that ETH may remain in a consolidation phase or face further downside.
Maintaining proper stop-loss levels for derivatives positions and using prudent capital allocation for spot buying can help traders reduce risk amid unexpected volatility.
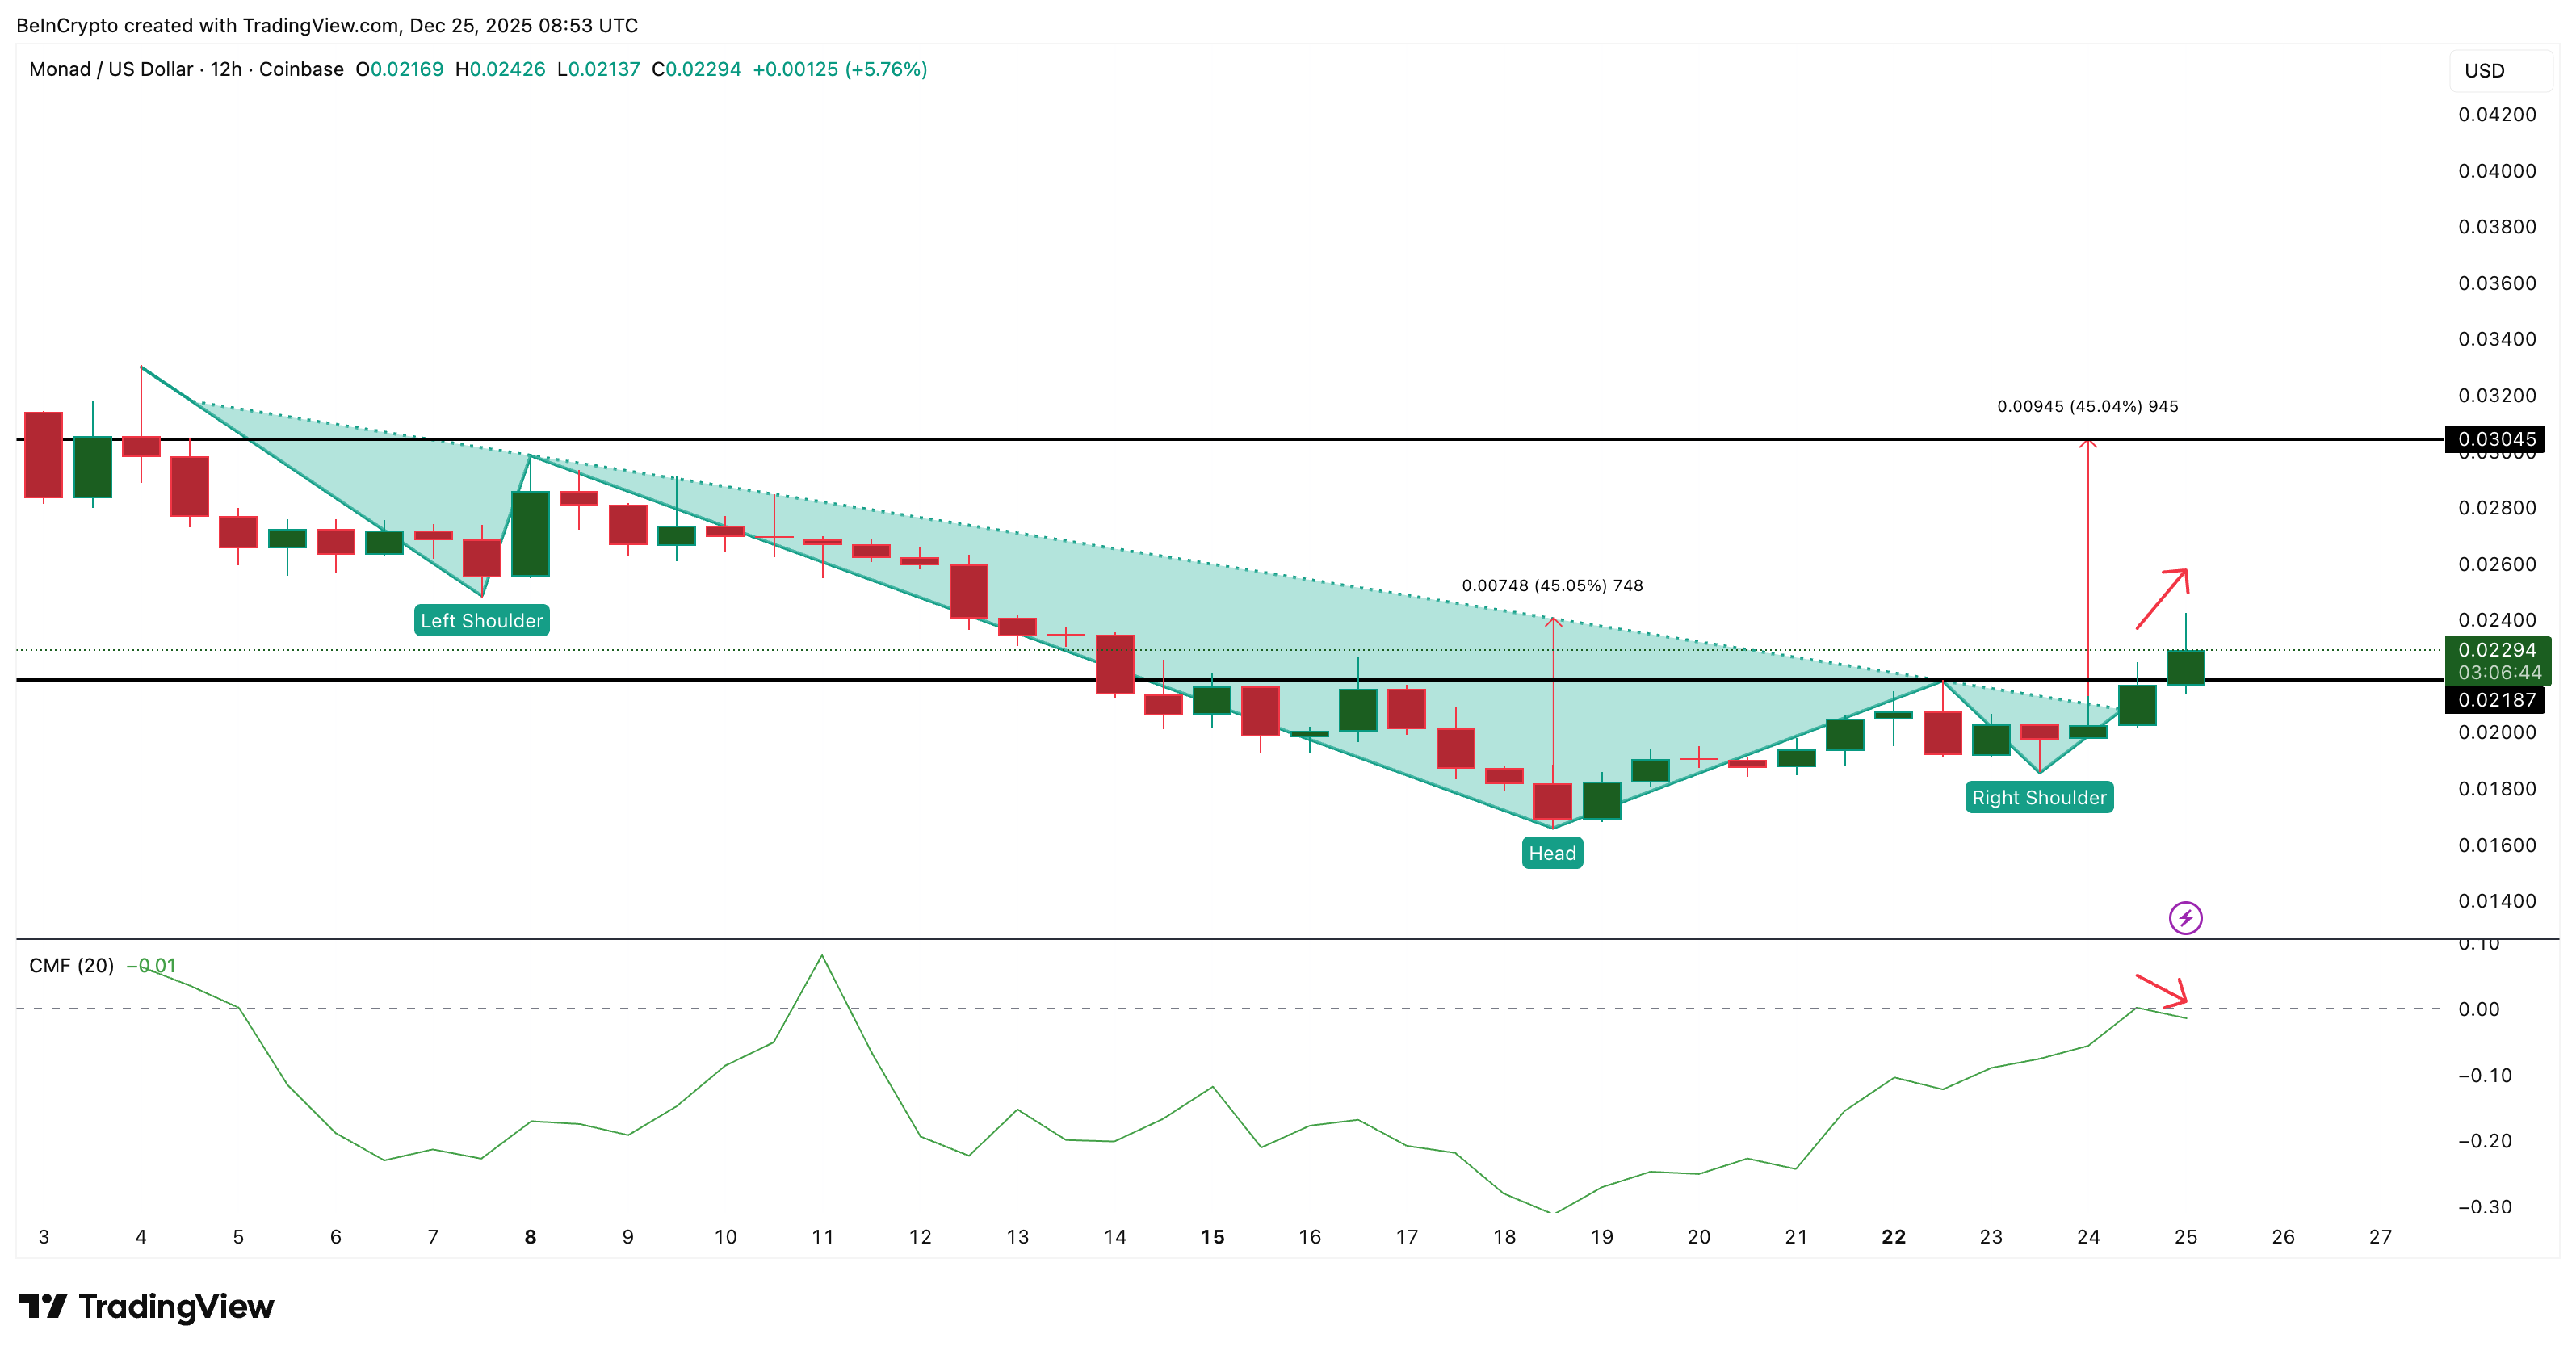
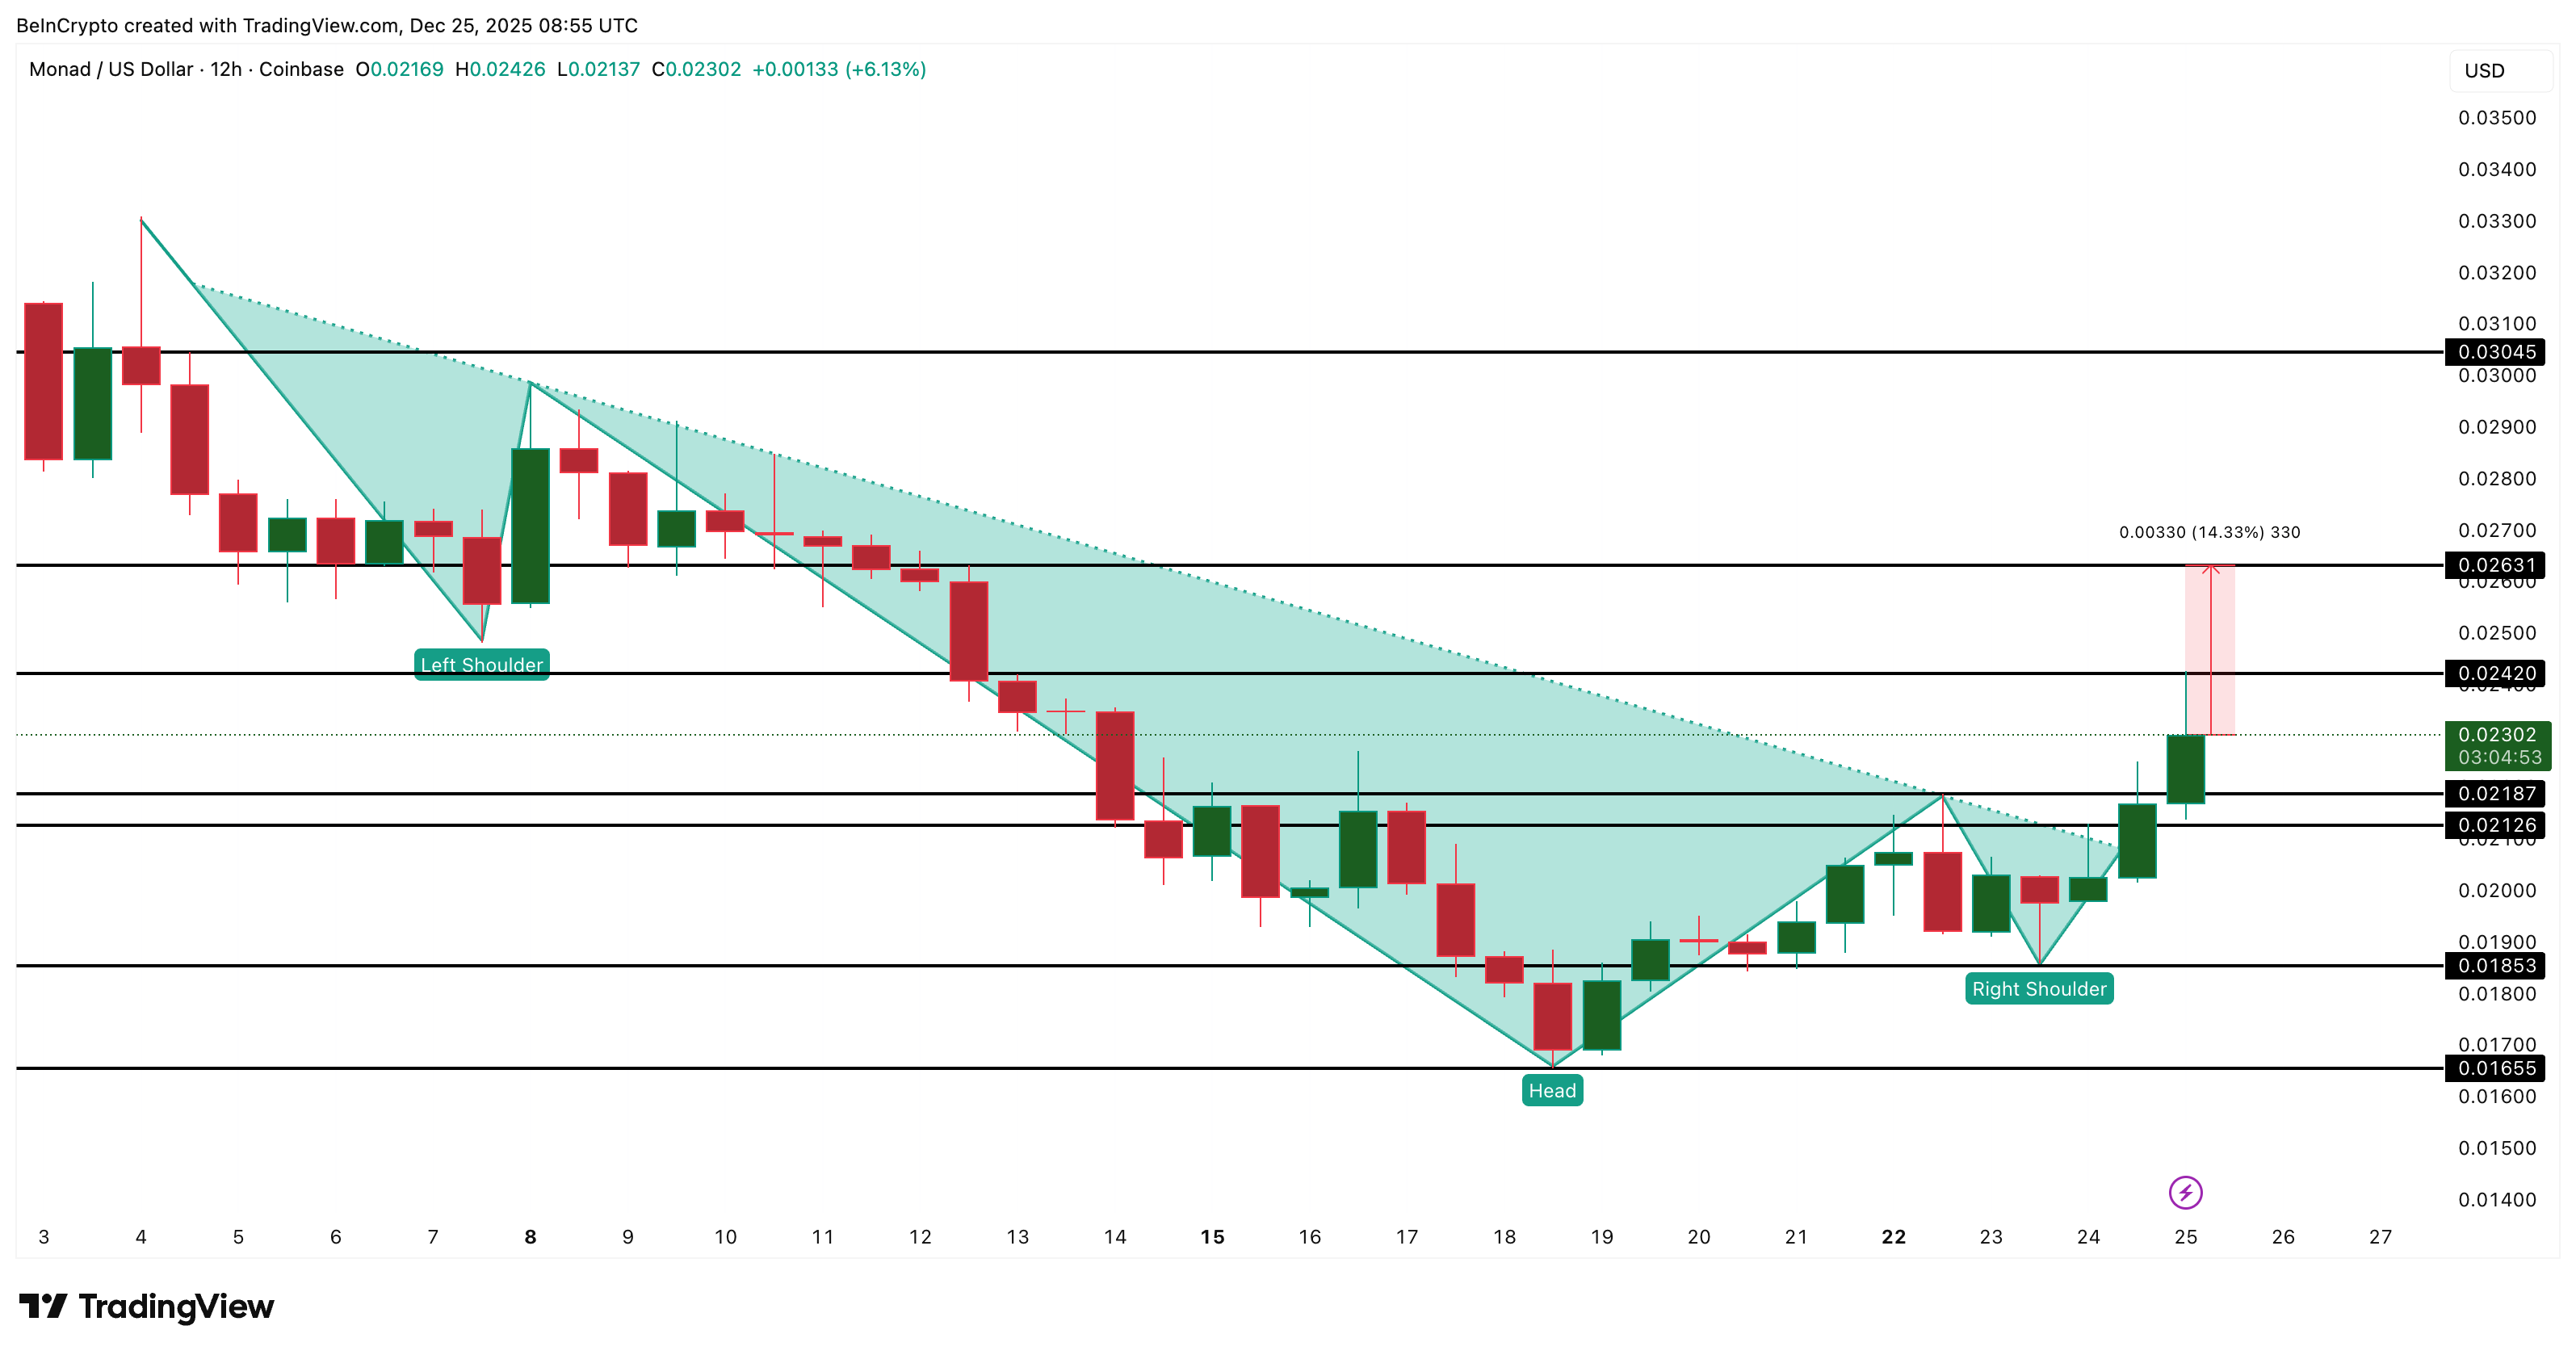
Monad (MON), the relatively new layer-1 project, is up more than 29% in the last seven days. The Monad price even broke out of an inverse head and shoulders pattern on December 24. For a moment, it looked like the breakout was ready to stretch higher.
But the reaction since then shows pressure building. Three signals, big money, spot flows, and derivative positioning now suggest this rally could struggle as the market moves into Boxing Day (the day after Christmas).
Breakout Holds, But Capital Flow Weakens
The breakout is real. Monad cleared the neckline of the inverse head-and-shoulders pattern and broke above the descending neckline, which typically indicates seller-dominated resistance. The price did react, but long wicks on recent candles show sellers pushing back. Long wicks are usually a sign that supply is waiting overhead.
The Chaikin Money Flow (CMF), which measures whether bigger capital is supporting a move, tried to break above the zero line when the breakout happened. It failed. CMF has now trended lower, while the price has risen. Breakout attempts with CMF stuck under zero are often built on weak funding or small buyers. The last time CMF failed above zero and dipped was on December 11, and the price dropped soon after.
Monad Breakout Amid Weak Capital Flow: TradingView
Want more token insights like this? Sign up for Editor Harsh Notariya’s Daily Crypto Newsletter here.
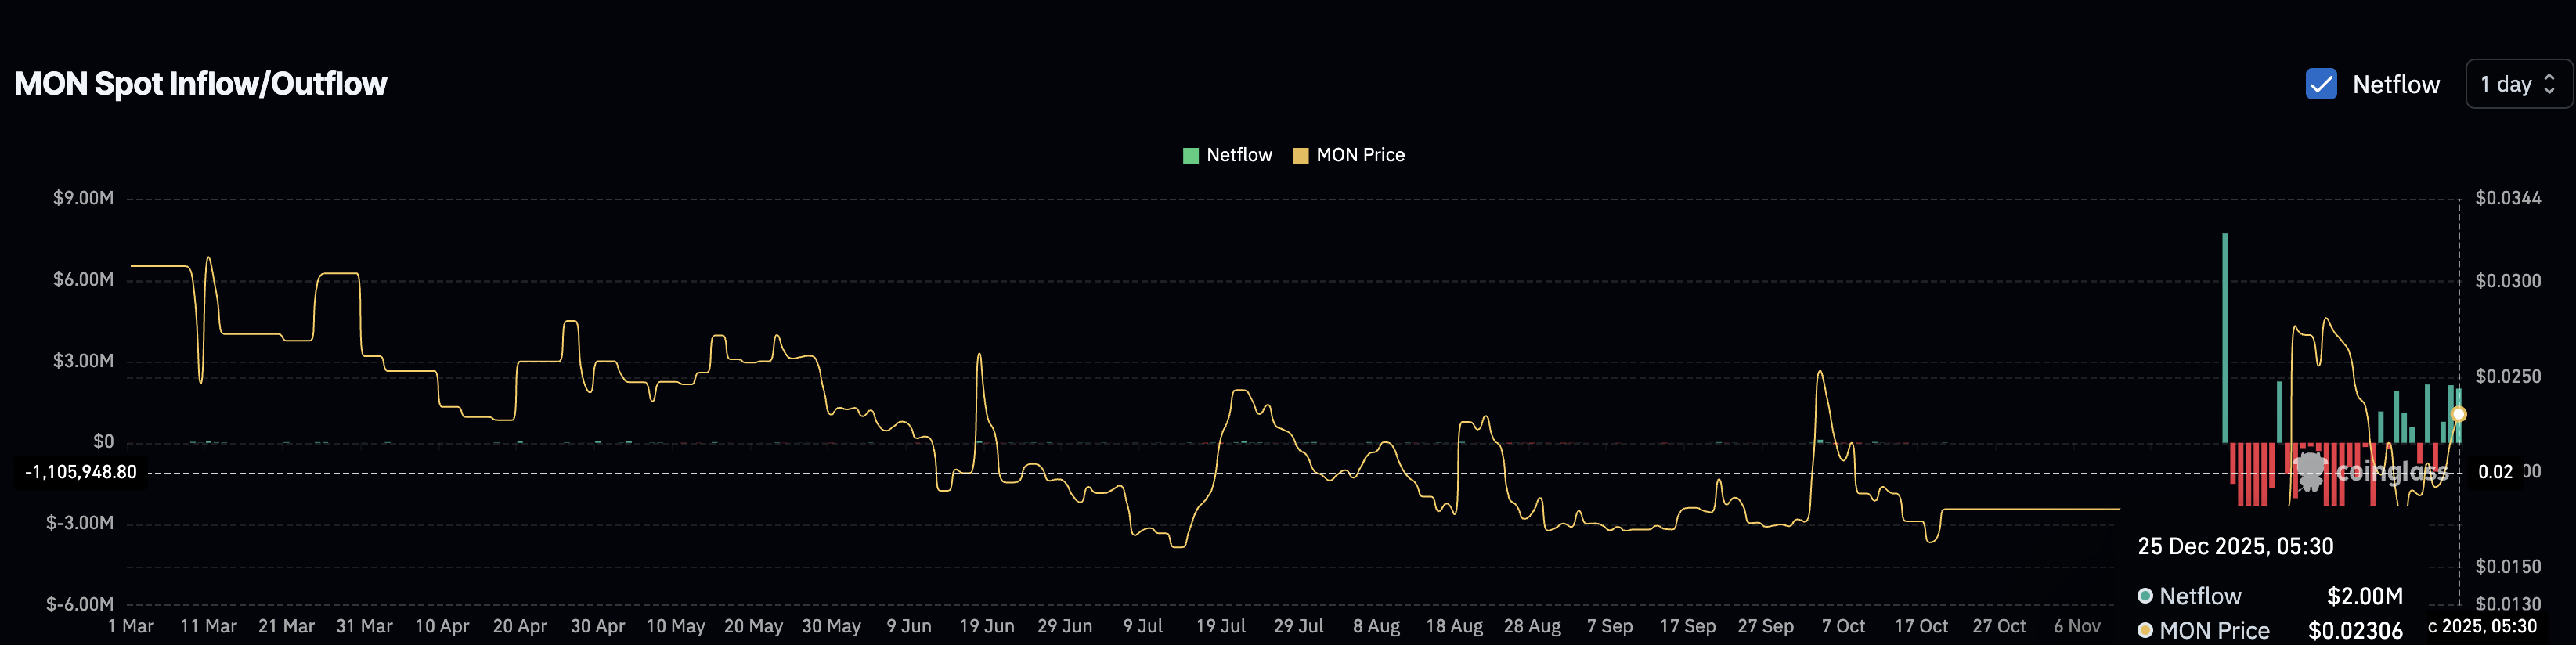
Spot behavior confirms this imbalance.
Since December 22, net flows have flipped from more than $1 million in outflows to roughly $2 million in exchange inflows, suggesting profit taking.
A breakout without capital commitment from CMF and with rising spot inflows usually hints at a stall.
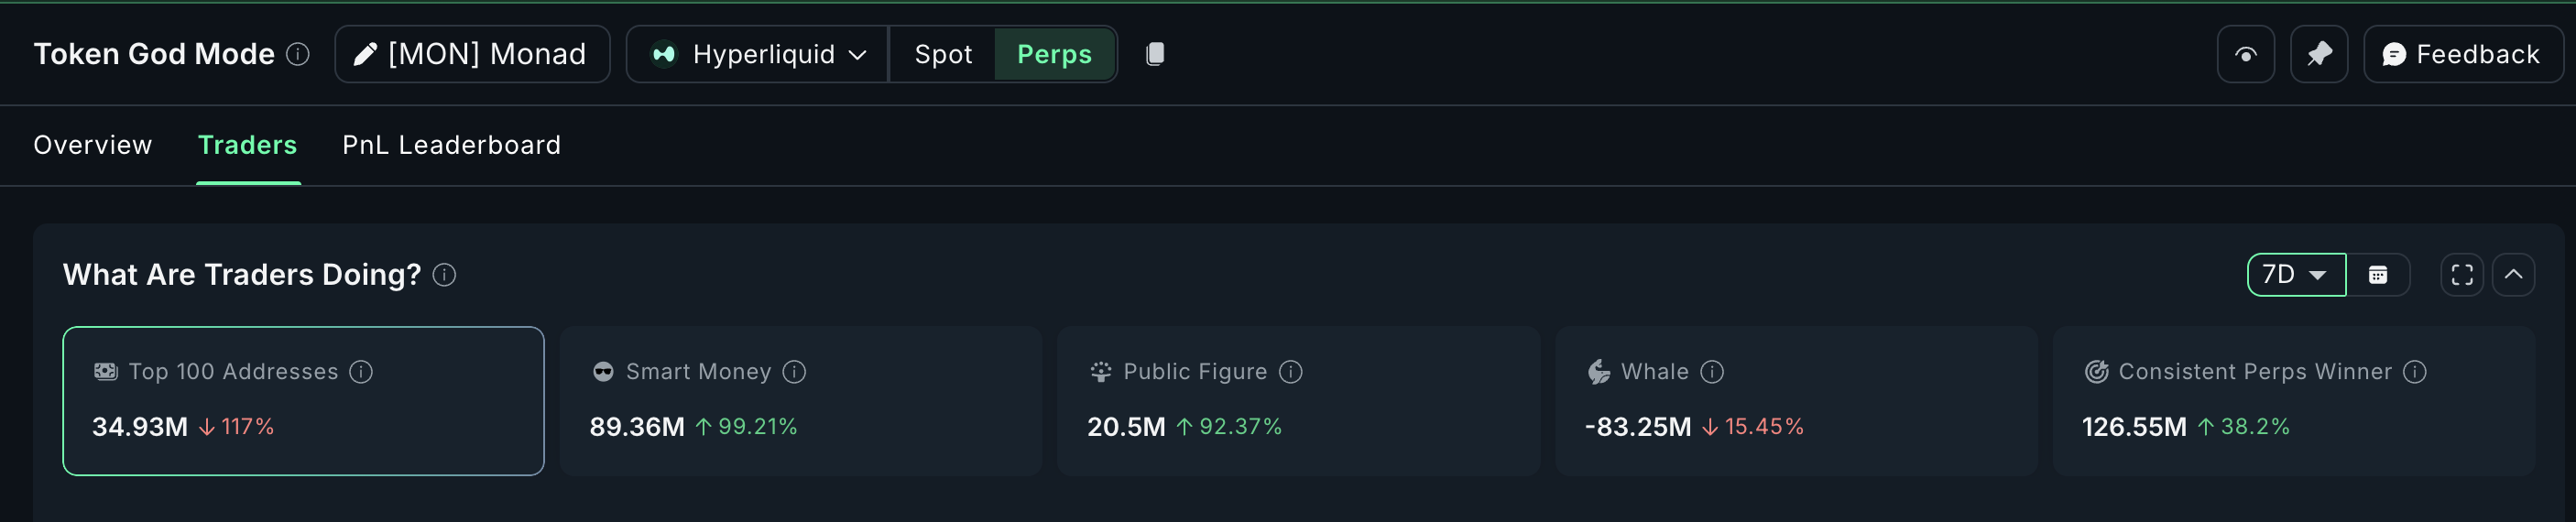
Derivatives Positioning Shows A Reversal In Mood
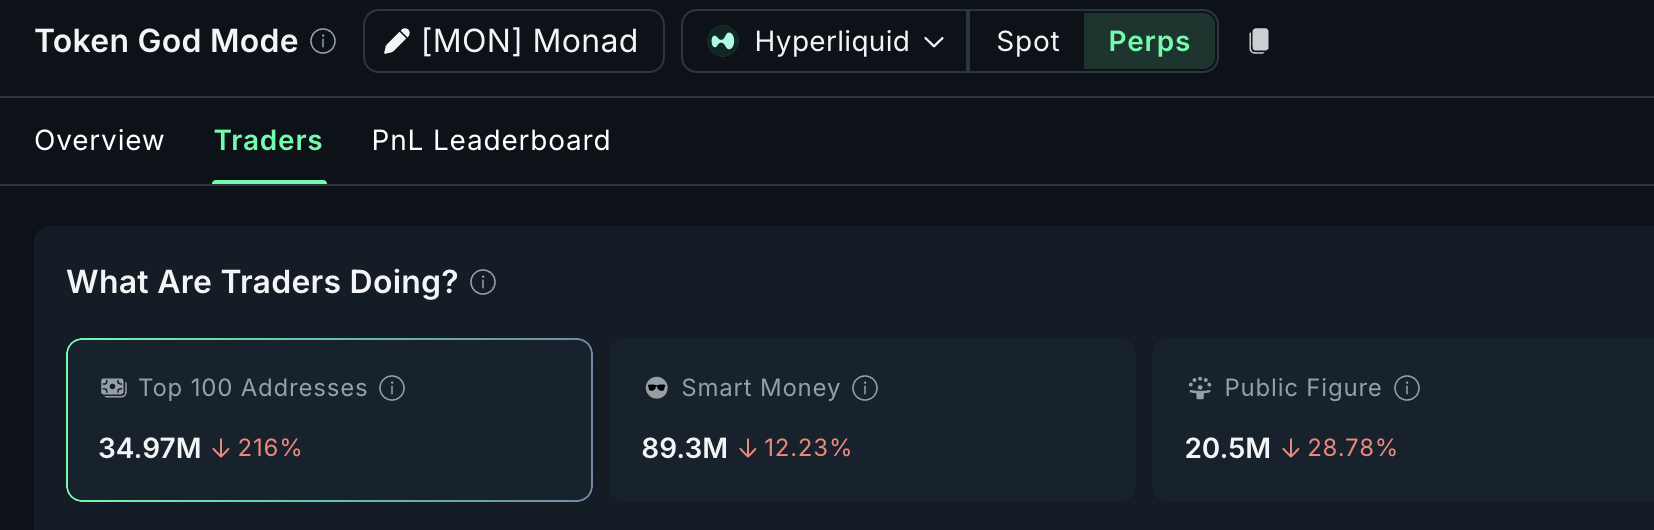
The derivatives side explains the hesitation. Over the last seven days, smart money on perpetuals added aggressively. Long exposure reached $89.36 million and increased more than 99%, which lined up with the breakout on December 24 and the climb into December 25. That long bias helped MON clear the neckline.
The last 24 hours tell a different story. Smart money long exposure has dropped more than 12.23%. The top 100 perpetual addresses have cut positions by more than 216%. Public figures, typically late trend followers, reduce their exposure by nearly 28.78%.
The fading long bias across perpetuals often occurs when a strong breakout is getting tired. The rally might not reverse immediately, but the market is no longer aligned behind the move. That is why the next 24 hours, into Boxing Day, become a pressure point.
Monad Price Levels Decide If Boxing Day Brings Follow-Through Or Failure
The Monad price sits at a fragile point. Above $0.024, MON can try another breakout leg. A 12-hour close above $0.026 would confirm a roughly 14% extension and open the path to $0.030. Clearing that zone would finally break the curse of the downward-sloping neckline, where sellers might keep pressurizing every price surge attempt.
If the rally loses strength, $0.021 acts as the first line of defense. A drop under $0.018 would weaken the breakout structure. A close below $0.016 would break the pattern, invalidate the inverse head-and-shoulders pattern, and open the path back to the mid-December lows.
For now, the MON price is stuck between real breakout mechanics and short-term pressure. CMF has not confirmed. Spot inflows look like profit-taking. Derivatives are cooling off. Boxing Day, or December 26, will likely decide whether Monad respects the breakout or hands most of the gains back.
As major asset managers and industry experts begin outlining their expectations for 2026, one analyst has summarized what Crypto Twitter (CT) broadly anticipates for the crypto market in the coming year.
CT’s emerging consensus suggests the market is bracing for a more selective, fundamentals-driven phase rather than a broad speculative boom.
Crypto Sectors That Could Perform Well in 2026
In a recent X (formerly Twitter) post, analyst Ignas noted that Crypto Twitter’s outlook for 2026 reflects a stark shift from the 2022 outlook.
“The consensus is the exact opposite to when we entered the bull run in 2022,” the analyst stated.
At the time, many investors positioned for Ethereum (ETH) and altcoins to outperform Bitcoin. Instead, Bitcoin dominated, leaving the market trailing behind. This year, sentiment was quite bullish, with many forecasting higher valuations for major assets.
However, the market moved in the opposite direction. As a result, Crypto Twitter’s outlook has shifted toward a more cautious and concentrated set of expectations. Here is what CT believes will perform well in 2026.
1. Bitcoin
Bitcoin is widely viewed as the primary outperformer heading into 2026. This confidence comes despite the asset’s recent weakness.
BeInCrypto highlighted that BTC has lagged behind precious metals and stocks in 2025. Furthermore, the asset is down 6.2% year-to-date.
If the declines continue, Bitcoin could end the year in the red, breaking its two-year positive streak. Even so, CT consensus continues to favor Bitcoin over the broader crypto market.
At the same time, concerns around quantum computing remain part of the discussion. Quantum advances pose a structural risk to Bitcoin’s cryptography. Nonetheless, analysts remain divided on whether such threats are imminent or still years away.
2. Real-world assets (RWA)
Real-world assets (RWA) and tokenization are emerging as one of the key growth areas in crypto for 2026. The RWA sector has already defied the market slump with distributed value and users growing steadily, and the momentum could continue.
“RWAs and tokenization will grow BIG but hard to find great proxies to bet on growth (Plasma, Stable terrible TGEs are clear examples),” Ignas wrote.
Notably, Plume CEO Chris Yin also projects 10- to 20-fold growth in both value and users by 2026, even with conservative forecasts. Furthermore, Jesse Knutson, Head of Operations at Bitfinex Securities, suggests the tokenization market will reach at least $100 billion by the end of 2026.
3. Prediction Markets and Perpetual Financial Products
CT expects prediction markets and perpetual products to increasingly “financialize everything,” extending to real-world events and even pre-IPO instruments.
According to BeInCrypto’s recent report, interest in prediction markets accelerated in late 2025. During October and November, trading volumes on prediction platforms surpassed those of meme coins and non-fungible tokens (NFTs). User activity also increased as participants turned to these platforms to speculate on outcomes ranging from election results to weather forecasts.
Institutional involvement has followed. Major firms, including Coinbase and Gemini, have begun expanding into the sector in an effort to capitalize on the growing momentum.
Perpetual markets are also gaining attention. Coinbase previously identified real-world asset perpetuals as a key investment theme for 2026, citing their potential to unlock new forms of on-chain financial exposure.
“Because perpetuals do not require securing an underlying asset, markets can form around virtually anything, enabling the ‘perpification’ of everything,” Coinbase stated.
Crypto Sectors That Could Face Pressure
Ignas pointed out that besides Bitcoin, the CT consensus suggests major gains are likely to concentrate in only a small number of winners. Many other sectors could face continued pressure as capital becomes increasingly selective.
1. Broad Altcoin Markets
The market largely anticipates continued pressure across the altcoin sector, with many tokens at risk of going to zero. This might happen due to high token emissions, limited retail participation, and weak institutional demand.
As a result, expectations for a broad altcoin season similar to 2021 remain low. In October, Bitget CEO Gracy Chen said an altcoin season is unlikely to materialize in either 2025 or 2026.
2. Decentralized Finance (DeFi) Tokens
The analyst added that the recent ongoing governance disputes surrounding Aave (AAVE) also raise concerns about all DeFi tokens.
The debate centers on Aave’s decision to integrate CowSwap into its frontend, replacing ParaSwap. Critics argue that the move, finalized after Aave Labs received a grant from CowSwap, redirected up to $10 million in potential annual revenue away from the DAO.
In response, Aave founder Stani Kulechov and Aave Labs have maintained that frontend-generated revenue is separate from core protocol revenue and has been voluntary.
Aave DAO Faces Governance Clash Over Control of Aave Labs 👀
An AAVE token holder has proposed a controversial “poison pill” strategy that would allow the Aave DAO to seize control of Aave Labs’ intellectual property, brand, and equity, effectively turning the company into a DAO… pic.twitter.com/SC1gd1KYhs
Market Divided on Whether Ethereum’s Success Translates Into ETH Gains
Meanwhile, the author revealed that there is no clear market narrative about what could happen to Ethereum (ETH).
On one side, some remain bullish on Ethereum, as it stands to benefit from the rapid expansion of tokenized assets. Others remain unconvinced that this adoption will materially benefit ETH holders.
“ETH as an asset does not necessarily benefit from tokenization: Ethereum just becomes boring infra layer with most upside enjoyed by user-facing apps. Like Facebook, Microsoft benefiting most from the rise of internet,” Ignas said.
Crypto Twitter’s 2026 Market Focus
In addition to these, Ignas also outlined that tokens launched with high fully diluted valuations and limited circulating supply are viewed as “perma shorts.” It essentially means that these tokens are consistently good candidates for shorting (betting against).
Market data reinforces this view. According to an analysis by Memento Research, which covered 118 token generation events in 2025, projects that debuted with elevated FDVs have struggled to sustain momentum. Notably, among the 28 tokens that launched with a fully diluted valuation of $1 billion or more, none are currently trading in positive territory.
Lastly, the market is placing increased emphasis on tokenholder rights, alongside a growing focus on revenue generation. These discussions are expected to intensify and continue into 2026.
As the crypto industry matures, it is likely to become less speculative and less driven by hype, but significantly larger in scale. In parallel, Crypto Twitter’s influence over the broader narrative could wane, as crypto-native voices gradually lose prominence.
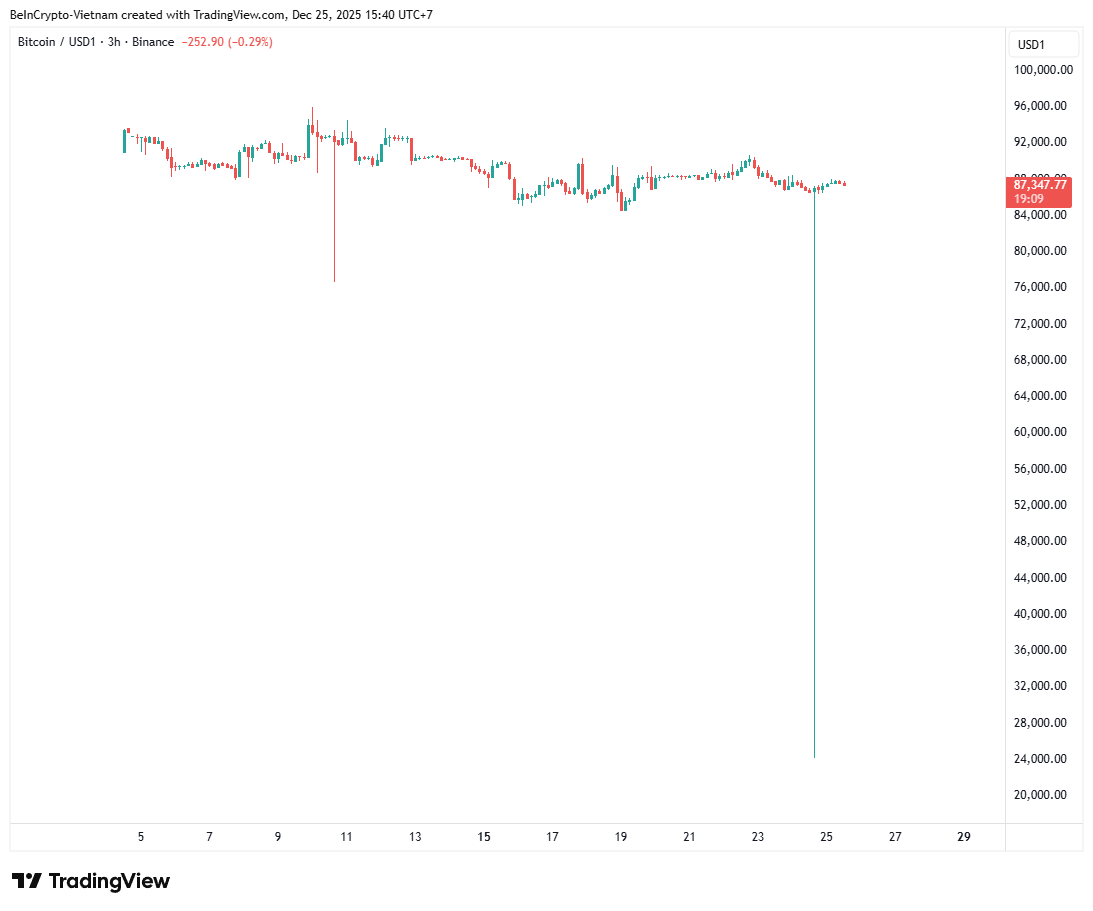
The incident occurred during the Christmas holiday period. Trading volumes dropped sharply at that time. Some observers speculated that the move was a liquidity test for the BTC/USD1 pair.
Joao Wedson, founder of Alphractal, explained that this phenomenon appears more often in bear markets. Capital inflows tend to weaken during those phases.
“Low liquidity in some trading pairs across multiple exchanges has been causing sharp volatility. It leads to temporary price dislocations and arbitrage issues for a few minutes. This is more common than it seems when the market is in a bearish phase,” Joao Wedson explained.
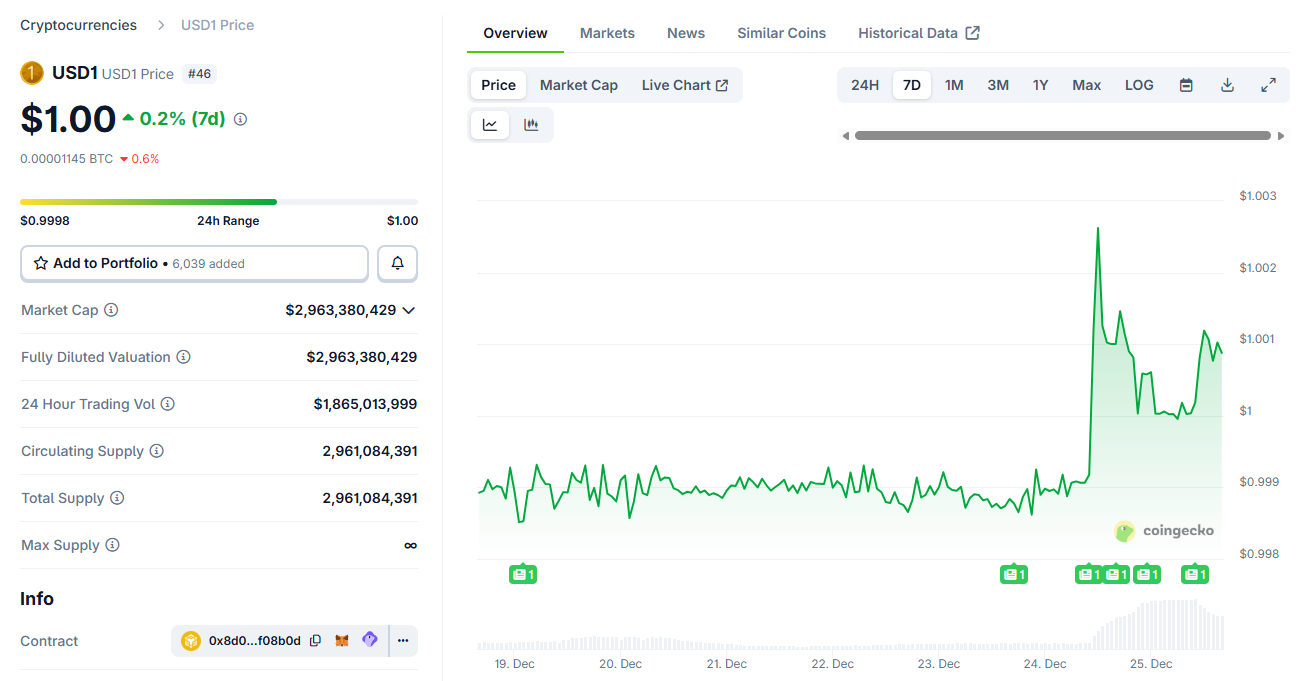
Another, more detailed explanation from the investor community linked the incident to Binance’s promotional campaign for USD1. Binance recently launched a 20% APY promotion for up to $50,000 in USD1 per user.
WuBlockchain, a reputable market-watching account, reported a sharp surge in USD1 supply after the launch. Supply increased by more than 45.6 million tokens within a few hours. Total market capitalization rose above $2.79 billion.
The sudden inflow of capital into USD1 pushed the stablecoin’s price up by 0.2%.
The X account Punk explained that many investors attempted arbitrage. They borrowed USD1 and gradually sold it on the spot market to participants joining the promotion.
Meanwhile, some traders chose to sell through the BTC/USD1 pair. Thin liquidity caught them off guard. Prices collapsed sharply, causing the outcome described above.
“This is just a small fluctuation in the bear market. There is no need to worry. Many similar fluctuations will appear later,” investor Punk said.
Could a similar situation happen to BTC/USDT?
A broader question now draws attention. Could a similar event occur on the BTC/USDT pair? This pair holds the highest liquidity in the market. A sudden drop there would cause massive liquidation losses.
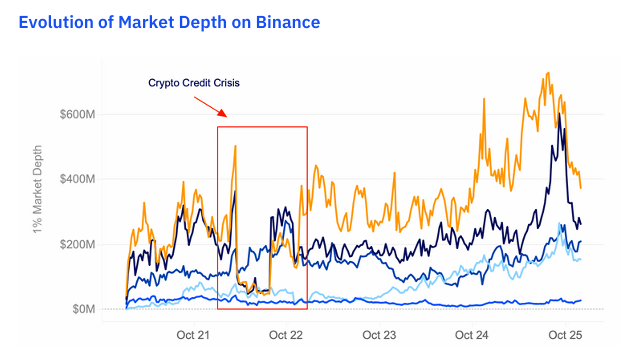
Analyst Maartunn cited Kaiko data. He noted that Bitcoin’s 1% market depth has increased significantly over the years.
“Depth didn’t just recover. It expanded. By the October 2025 highs, Binance 1% depth exceeded $600 million. That level stands above pre-2022 crash levels,” Maartunn said.
He also emphasized that the decline in BTC/USDT prices did not erode liquidity. Over the course of more than 100 days, the BTC/USDT pair fell 21.77% (from $110,291 to $86,089). During that period, average daily spot volume reached $19.8 billion, totaling $613.5 billion.
With deeper market depth and abundant volume, a similar event on BTC/USDT remains unlikely.
However, the incident serves as a lesson for traders. Careful selection of trading pairs is essential. Low-liquidity pairs can cause severe slippage and unexpected losses.
As 2025 winds down, stablecoins like USDC are being used for more than just trading. They are increasingly part of payments, business transfers, and routine movement of funds, not only activity tied to market cycles. As more money moves more often, the way those transfers settle has started to matter far more than it used to.
That change has put pressure on existing blockchain networks. Activity picked up over the second half of the year, and during busy periods this showed up through higher fees, slower confirmations, and less predictable transfer costs.
On Ethereum, for example, sending USDC late in 2025 has often cost anywhere from a few dollars to well over ten dollars during periods of congestion, meaning even a basic transfer can end up costing more than expected.
By the second half of the year, fee volatility had become another familiar issue. Gas-based pricing means the cost of a stablecoin transfer can change quickly depending on network conditions, making routine payments harder to plan for traders, businesses, and treasury teams. In practice, once exchange and transfer fees are factored in, the cost advantage of using stablecoins can narrow more than many users expect.
That’s where Bybit’s decision to add USDC support on the XDC Network fits in. As stablecoin transfers become part of everyday activity, exchanges are under pressure to offer routes that are easier to manage and more predictable. How quickly and cheaply funds can move now matters as much as access itself.
“Most users don’t care about blockchain labels anymore. They care about whether a transfer clears quickly and what it costs them in the end,” said Angus O’Callaghan, head of trading and markets at XDC Network. “If stablecoins are going to function as everyday financial tools, the infrastructure underneath them has to feel reliable, not stressful.”
Bybit Waives USDC Fees on XDC and Launches $200,000 Reward Program
For most stablecoin users, access isn’t the problem anymore. USDC is already available on nearly every major exchange. What people care about now is whether moving funds actually works the way they need it to: quickly, regularly, and without having to think twice about the cost.
Bybit’s recent changes make sense within this context. Alongside opening another route for USDC transfers, the exchange is waiving withdrawal fees on XDC from December 1, 2025 through January 1, 2026, and offering a 200,000 USDC reward pool for new users who register and make qualifying deposits.
From a user point of view, this is less about features and more about convenience. When transfers start to feel expensive or unpredictable, people naturally change how they move money. Some wait longer to transfer, others batch payments, and some avoid smaller transactions altogether. Having another option available makes those decisions easier.
For Bybit users, USDC on XDC simply adds flexibility. It gives them another way to move funds when the usual routes don’t feel like the best choice, without changing what they’re using or how they think about stablecoins.
What This Signals for Exchanges
Bybit’s recent move around USDC transfers reflects a change that’s starting to show up across the exchange landscape. While Bybit has taken a clear step in expanding how users can move funds, it’s also part of a wider pattern playing out over the past few weeks.
BTSE, KuCoin, MEXC, Gate.io, Bitrue, and Pionex have also expanded support for XDC, enabling deposits, withdrawals, and trading. Taken together, these moves point to growing interest among exchanges in settlement networks that can handle regular transfer activity without the fee swings seen on more congested chains.
For exchanges, the reasoning is largely practical. As stablecoin flows increase, relying on a small set of networks can make platforms more exposed to sudden cost changes and slower settlement during peak periods. Adding alternative routes gives exchanges more flexibility, helps smooth out those pressures, and offers users more consistent ways to move funds without changing the assets they already use.
All of this is also happening as stablecoins start to be treated more like real payment tools. In the U.S., proposals such as the GENIUS Act are focused on putting clearer rules around how stablecoins are issued and used, especially for payments and institutional activity. As that happens, the way stablecoins move between platforms and networks becomes more than a technical detail and part of what users and institutions expect by default.
“When stablecoins start getting used outside of trading, the conversation changes,” O’Callaghan added. “Once there are clearer rules around how they’re meant to work, like what’s being discussed with the GENIUS Act, people stop treating transfers as experiments. They expect them to behave like regular payments: to go through on time, at a cost they can understand, and without needing to second-guess every move.”
XDC in Practice
XDC Network is mostly used for practical, behind-the-scenes work rather than consumer-facing crypto activity. It’s been used in areas like trade finance, real-world asset tokenization, and settlement processes where systems need to work consistently and without surprises.
That same setup also works well for moving stablecoins. Transfers on XDC tend to go through quickly and usually cost very little, which matters more now that stablecoin transfers became more common. For people or businesses sending USDC often, lower and more predictable costs make those transfers easier to manage over time.
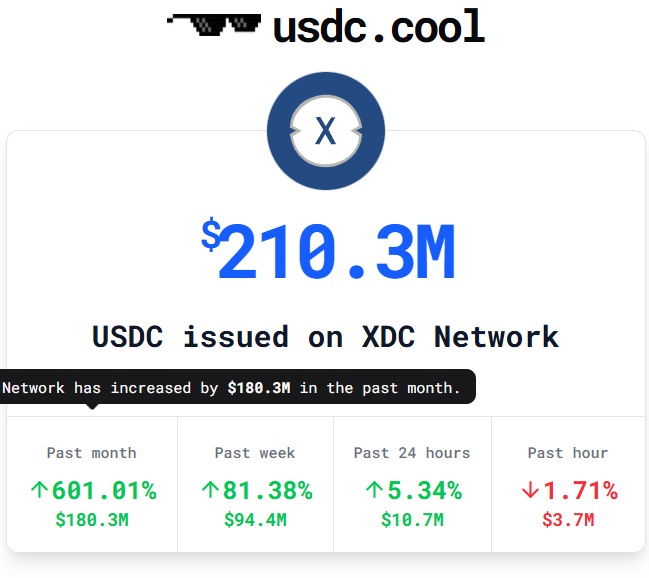
This is starting to show in the data. The amount of USDC issued on XDC has continued to rise and recently passed $200 million, indicating that usage is moving beyond early tests and into more regular activity. Rather than brief spikes, the numbers point to steady use by participants who move funds often.
From XDC’s side, integrations like Bybit’s are mainly about being useful. The network is being used as another place where stablecoin transfers can happen reliably, rather than as something meant to attract attention on its own.
XDC was also designed with institutional payment flows in mind, where predictable settlement and consistent costs matter more than short-term optimization. That makes it practical for businesses and financial institutions moving stablecoins at scale, where delays or sudden fee swings quickly turn into operational problems.
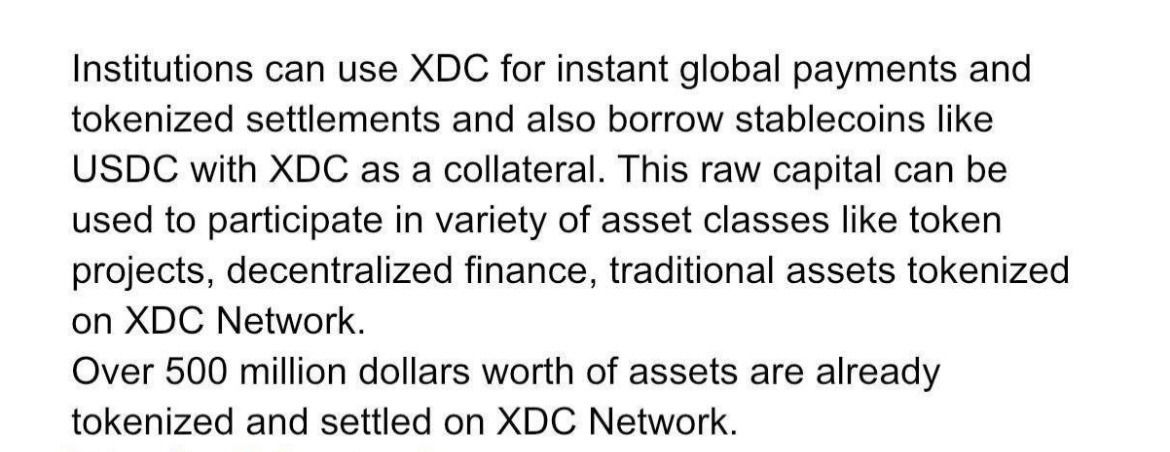
That focus is already showing up in how the network is being used. Beyond basic transfers, XDC supports more complex financial workflows, including global payments, tokenized settlement, and stablecoin-based liquidity. Assets like USDC are increasingly used within these flows, including as collateral, and more than $500 million worth of assets have already been tokenized and settled on the network.
This kind of activity is especially relevant for trade finance and cross-border settlement, where funds need to move reliably across jurisdictions rather than fluctuate with market conditions. As more payment and trade processes move on-chain, infrastructure that can handle steady, high-volume transfers becomes less of a nice-to-have and more of a requirement.
Closing
In the end, decisions like Bybit’s USDC support on XDC are not about any single network or promotion and more about how exchanges are adjusting to a maturing market. For the exchange, offering another way to move USDC is part of that adjustment – making sure the experience holds up not just during quiet periods, but when activity picks up and small frictions start to matter. XDC’s role in that setup reflects how infrastructure choices are becoming part of the exchange’s responsibility, even if they stay largely out of sight.
“Good infrastructure doesn’t draw attention to itself,” O’Callaghan concludes. “When it works properly, users barely think about it, and that’s usually the goal.”
China’s currency hits a 2.5-year high as the dollar weakens — a classic bullish setup for Bitcoin that isn’t working.
China’s onshore yuan closed at its strongest level since May 2023 on Thursday, trading at 7.0066 per dollar and nearly breaching the psychologically key 7-per-dollar mark. The move caps a 5% appreciation against the greenback since early April.
Yuan’s Rally, Dollar’s Exit
The rally is being driven by Chinese exporters rushing to convert their dollar revenues into yuan before year-end. This is more than seasonal housekeeping — analysts estimate that over $1 trillion in corporate dollars held offshore could eventually flow back to China.
Why now? The calculus has shifted. China’s economy is showing signs of recovery, the US Federal Reserve has been cutting rates, and the yuan itself is strengthening — creating a self-reinforcing cycle. Holding dollars looks less attractive when the currency you’re converting into keeps rising.
Some brokerages believe this is only the beginning. The headwinds that pressured the yuan for years — trade tensions, capital flight, a surging dollar — are now reversing into tailwinds. If the Fed eases more aggressively in 2026, as some expect, the yuan’s climb could accelerate further.
The Setup That Should Work
A weakening dollar typically lifts Bitcoin. The logic is straightforward: as the world’s reserve currency loses ground, dollar-denominated assets like BTC become relatively cheaper, and the “digital gold” narrative gains traction.
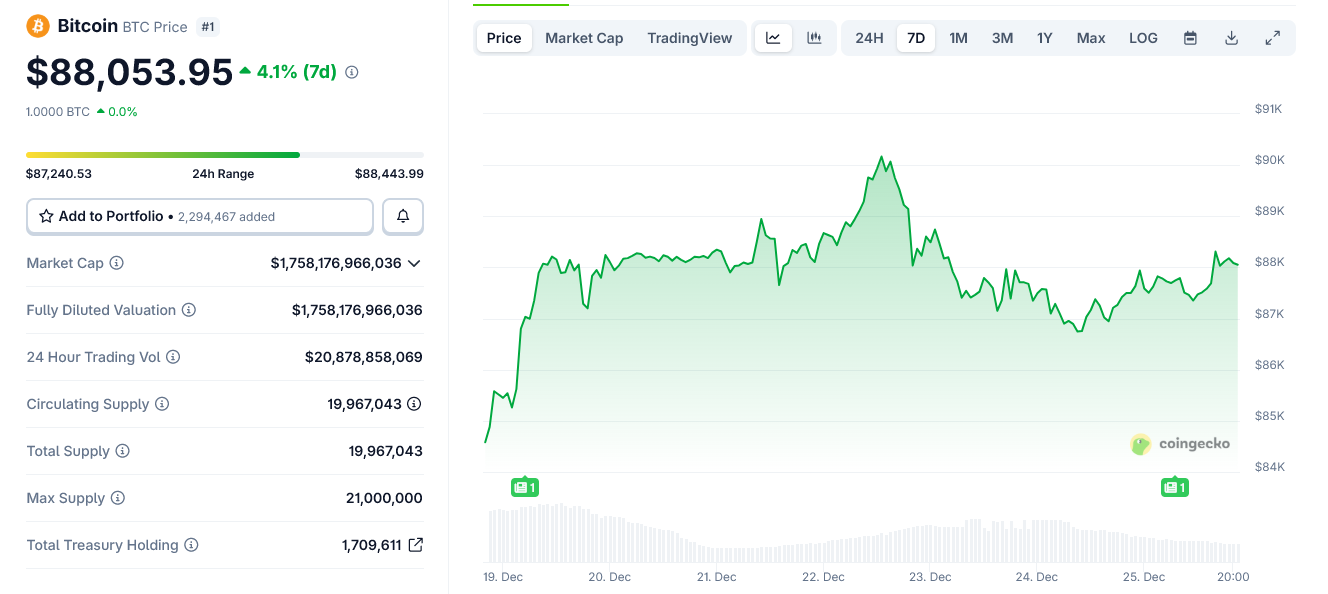
Gold is playing its part — the metal has hit record highs this month. Yet Bitcoin remains stuck in a $85,000-$90,000 range, unable to sustain breaks above $90,000 despite three attempts this week alone.
Why the Disconnect?
Several factors are muting Bitcoin’s response to what should be favorable macro conditions.
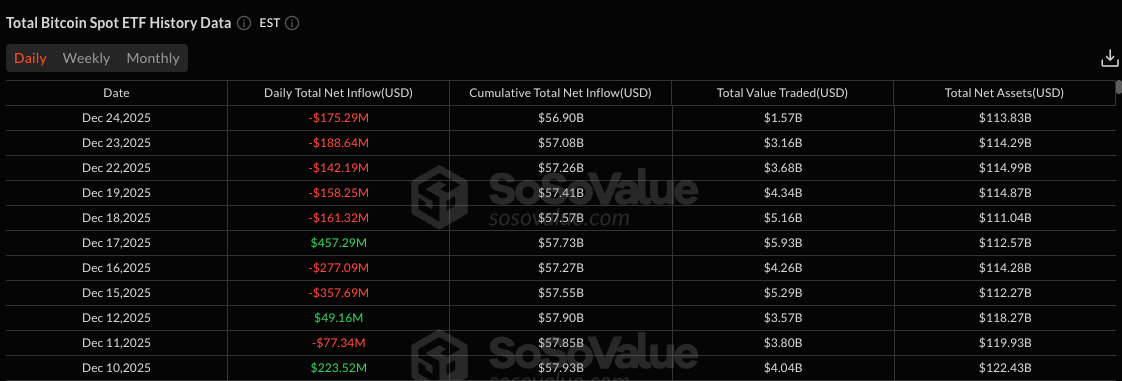
First, year-end liquidity is thin. Holiday trading volumes have amplified volatility while limiting conviction-driven moves. Second, institutional flows have turned negative — US spot Bitcoin ETFs have seen five consecutive days of net outflows totaling over $825 million, according to SoSoValue data.
Source: SoSoValue
Third, the Bank of Japan’s rate hike last week to a three-decade high has kept markets on edge. Although the yen weakened rather than strengthened after the decision — limiting carry trade unwind pressure — uncertainty over the BOJ’s future path continues to weigh on risk appetite.
2026: Delayed Rally?
The bullish case isn’t dead, just deferred. Some analysts expect the dollar to weaken further in 2026, particularly if US monetary easing exceeds current market expectations.
If that thesis plays out, Bitcoin’s muted response to current dollar weakness may reflect timing rather than a structural breakdown in the correlation. Once liquidity normalizes in January and Fed policy clarity improves, the yuan’s signal may finally reach crypto markets.
For now, Bitcoin watches from the sidelines as China flashes one of the clearest dollar-bearish signals in years.
Canton Network price has surged sharply over recent weeks, capturing market attention with a near 40% weekly gain. The rally accelerated after Canton announced a strategic collaboration with The Depository Trust & Clearing Corporation earlier last week.
This development positioned CC at the center of institutional tokenization discussions, driving renewed investor interest.
Canton Network and DTCC Join Hands
DTCC and Canton Network confirmed a partnership last week to support the tokenization of assets custodied by The Depository Trust Company on the Canton Network. The initiative aims to enable compliant, privacy-enabled blockchain infrastructure for regulated financial institutions. This move highlights a shared commitment to advancing digital asset adoption.
The partnership highlights Digital Asset’s long-standing collaboration with DTCC on institutional-grade blockchain solutions. Market participants interpreted the announcement as a major validation of Canton’s architecture. As a result, demand for CC rose quickly, reflecting growing confidence in its role within regulated financial markets.
Canton Holders Outperform Chainlink
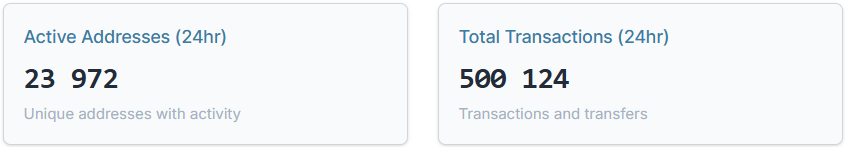
Investor participation has remained elevated throughout the past week, supporting the sustainability of the rally. On-chain data shows 23,972 active addresses over the last 24 hours. These addresses collectively executed more than 500,000 transactions, indicating strong network engagement.
For context, comparable activity across established tokens remains lower. XRP recorded roughly 39,000 active addresses, Cardano posted about 25,000, and Chainlink logged near 4,000. This comparison suggests CC’s price increase is driven by genuine usage rather than speculative spikes or thin liquidity.
Want more token insights like this? Sign up for Editor Harsh Notariya’s Daily Crypto Newsletter here.
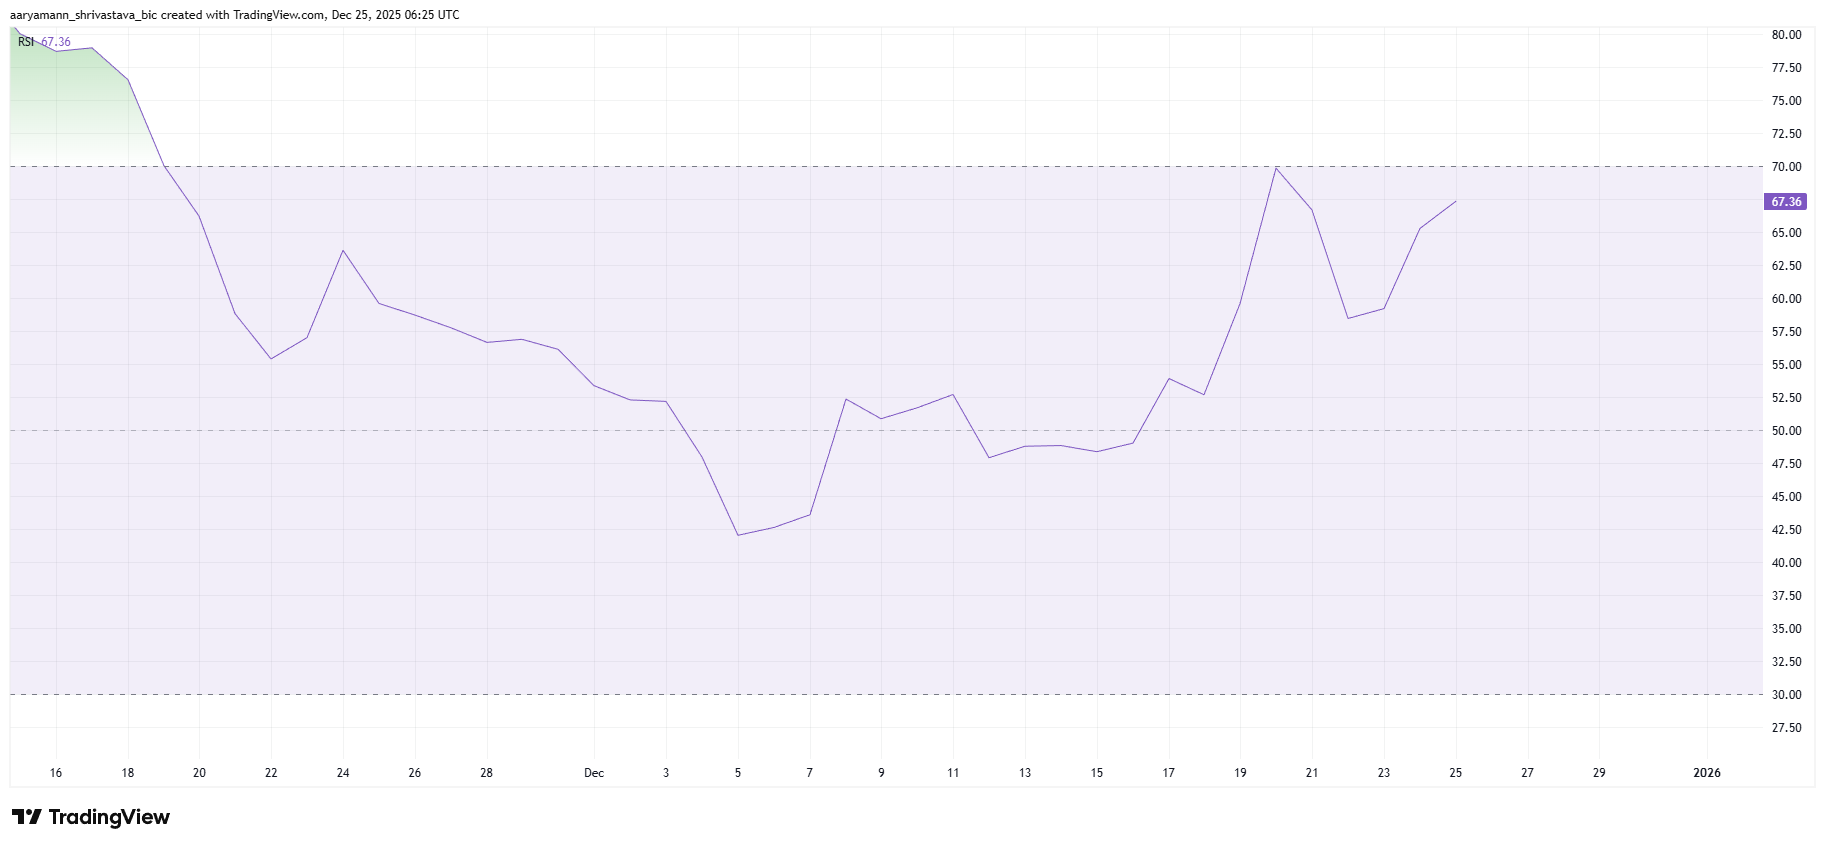
Technical indicators further support the bullish outlook. The Relative Strength Index currently sits above the neutral zero line, signaling positive momentum. This positioning confirms that buyers remain in control, aligning with the sustained rise in network activity and transaction volume.
However, caution is warranted as the RSI approaches overbought territory. Such conditions often precede short-term pullbacks. As long as the indicator avoids breaching extreme levels, CC’s broader uptrend remains technically intact.
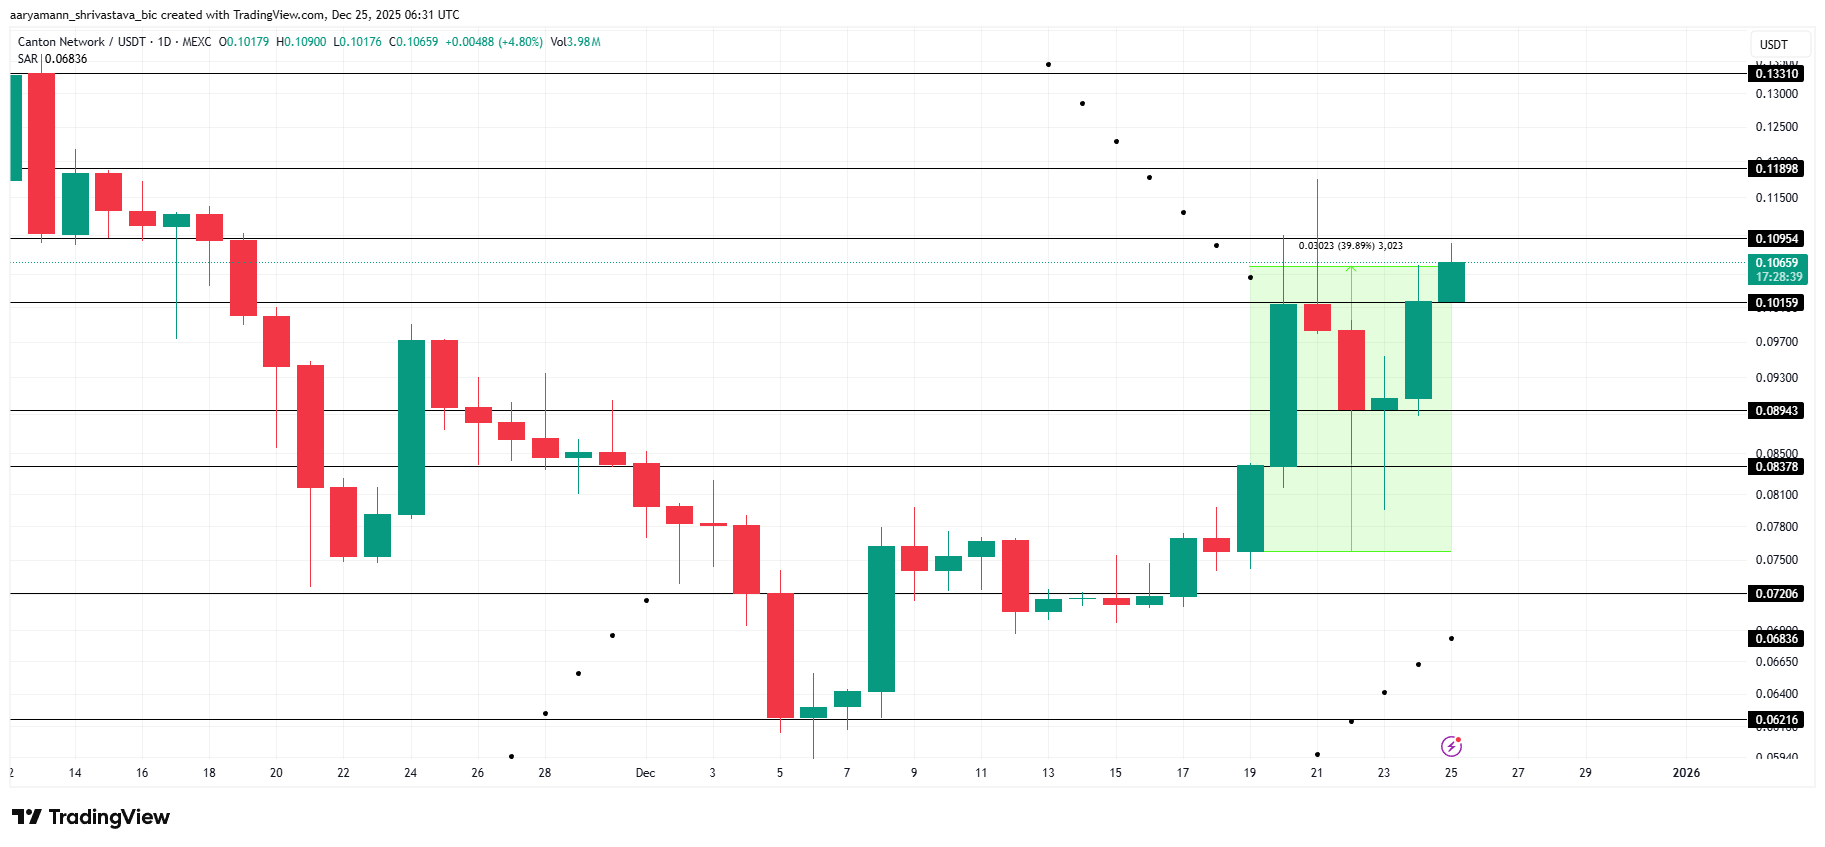
CC price traded near $0.106 at the time of writing, reflecting a near 40% weekly increase. The Parabolic SAR continues to signal an active uptrend. This indicator suggests the altcoin may extend gains if broader market conditions remain supportive.
A decisive break above the $0.109 resistance could push CC toward $0.118. Clearing that level may open the path to $0.133. Such a move would build on the token’s recent monthly high and reinforce bullish structure.
Downside risks persist if momentum weakens. Overbought conditions or profit-taking could pressure price action. A drop below $0.101 may expose CC to a decline toward $0.089, invalidating the current bullish thesis.
Bitcoin price action has remained mixed in recent sessions, reflecting uncertainty across global markets. At the time of writing, broader risk cues offer little direction for short-term momentum.
However, one notable signal is emerging from gold, whose recent strength may be positioning Bitcoin for a renewed rally if historical correlations continue to hold.
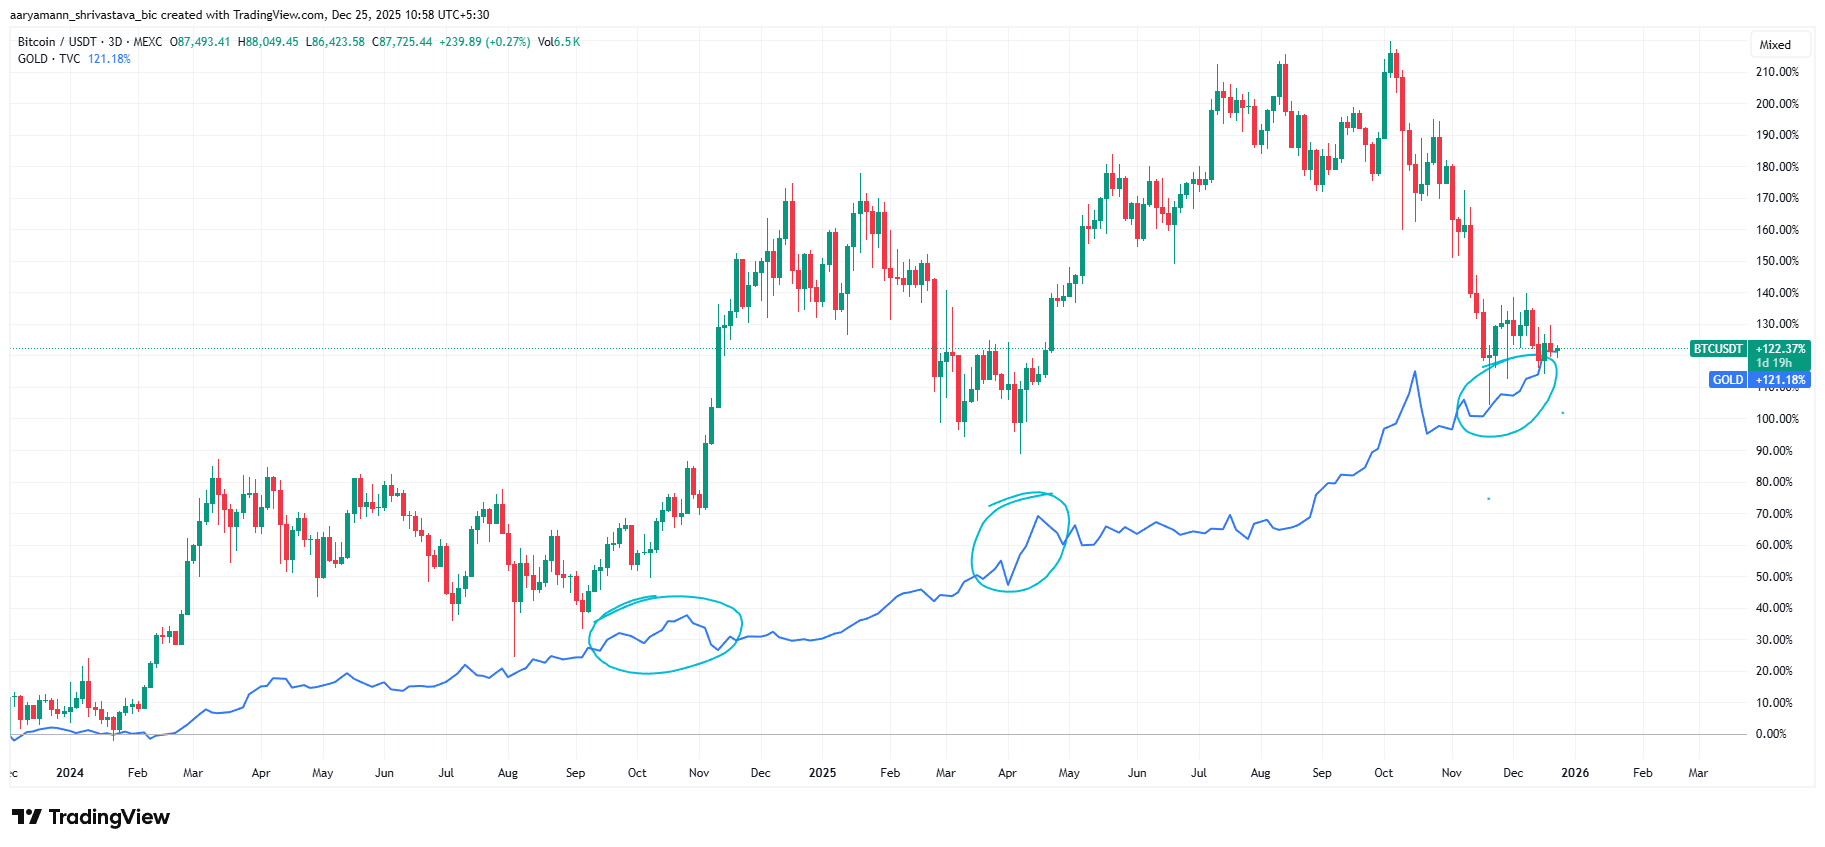
Bitcoin Is Tracking Gold
Bitcoin has increasingly mirrored gold’s trajectory over the past year, reinforcing its role as a macro-sensitive asset. Historically, sharp advances in gold prices have often preceded upside moves in Bitcoin. This relationship stems from rising risk appetite once capital rotates from defensive assets into higher-risk alternatives.
As gold strengthens, investors tend to seek asymmetric returns, benefiting Bitcoin inflows. This pattern has repeated several times since early 2024. Sustained gold rallies have coincided with higher Bitcoin demand, supported by both retail and institutional participation across spot and derivatives markets.
An exception emerged in October this year, when Bitcoin declined sharply alongside gold. That drop followed intensified macroeconomic pressure, including higher bond yields and tighter financial conditions. Currently, gold is regaining momentum. If Bitcoin maintains stability near current levels, it could once again benefit from this renewed risk-on shift.
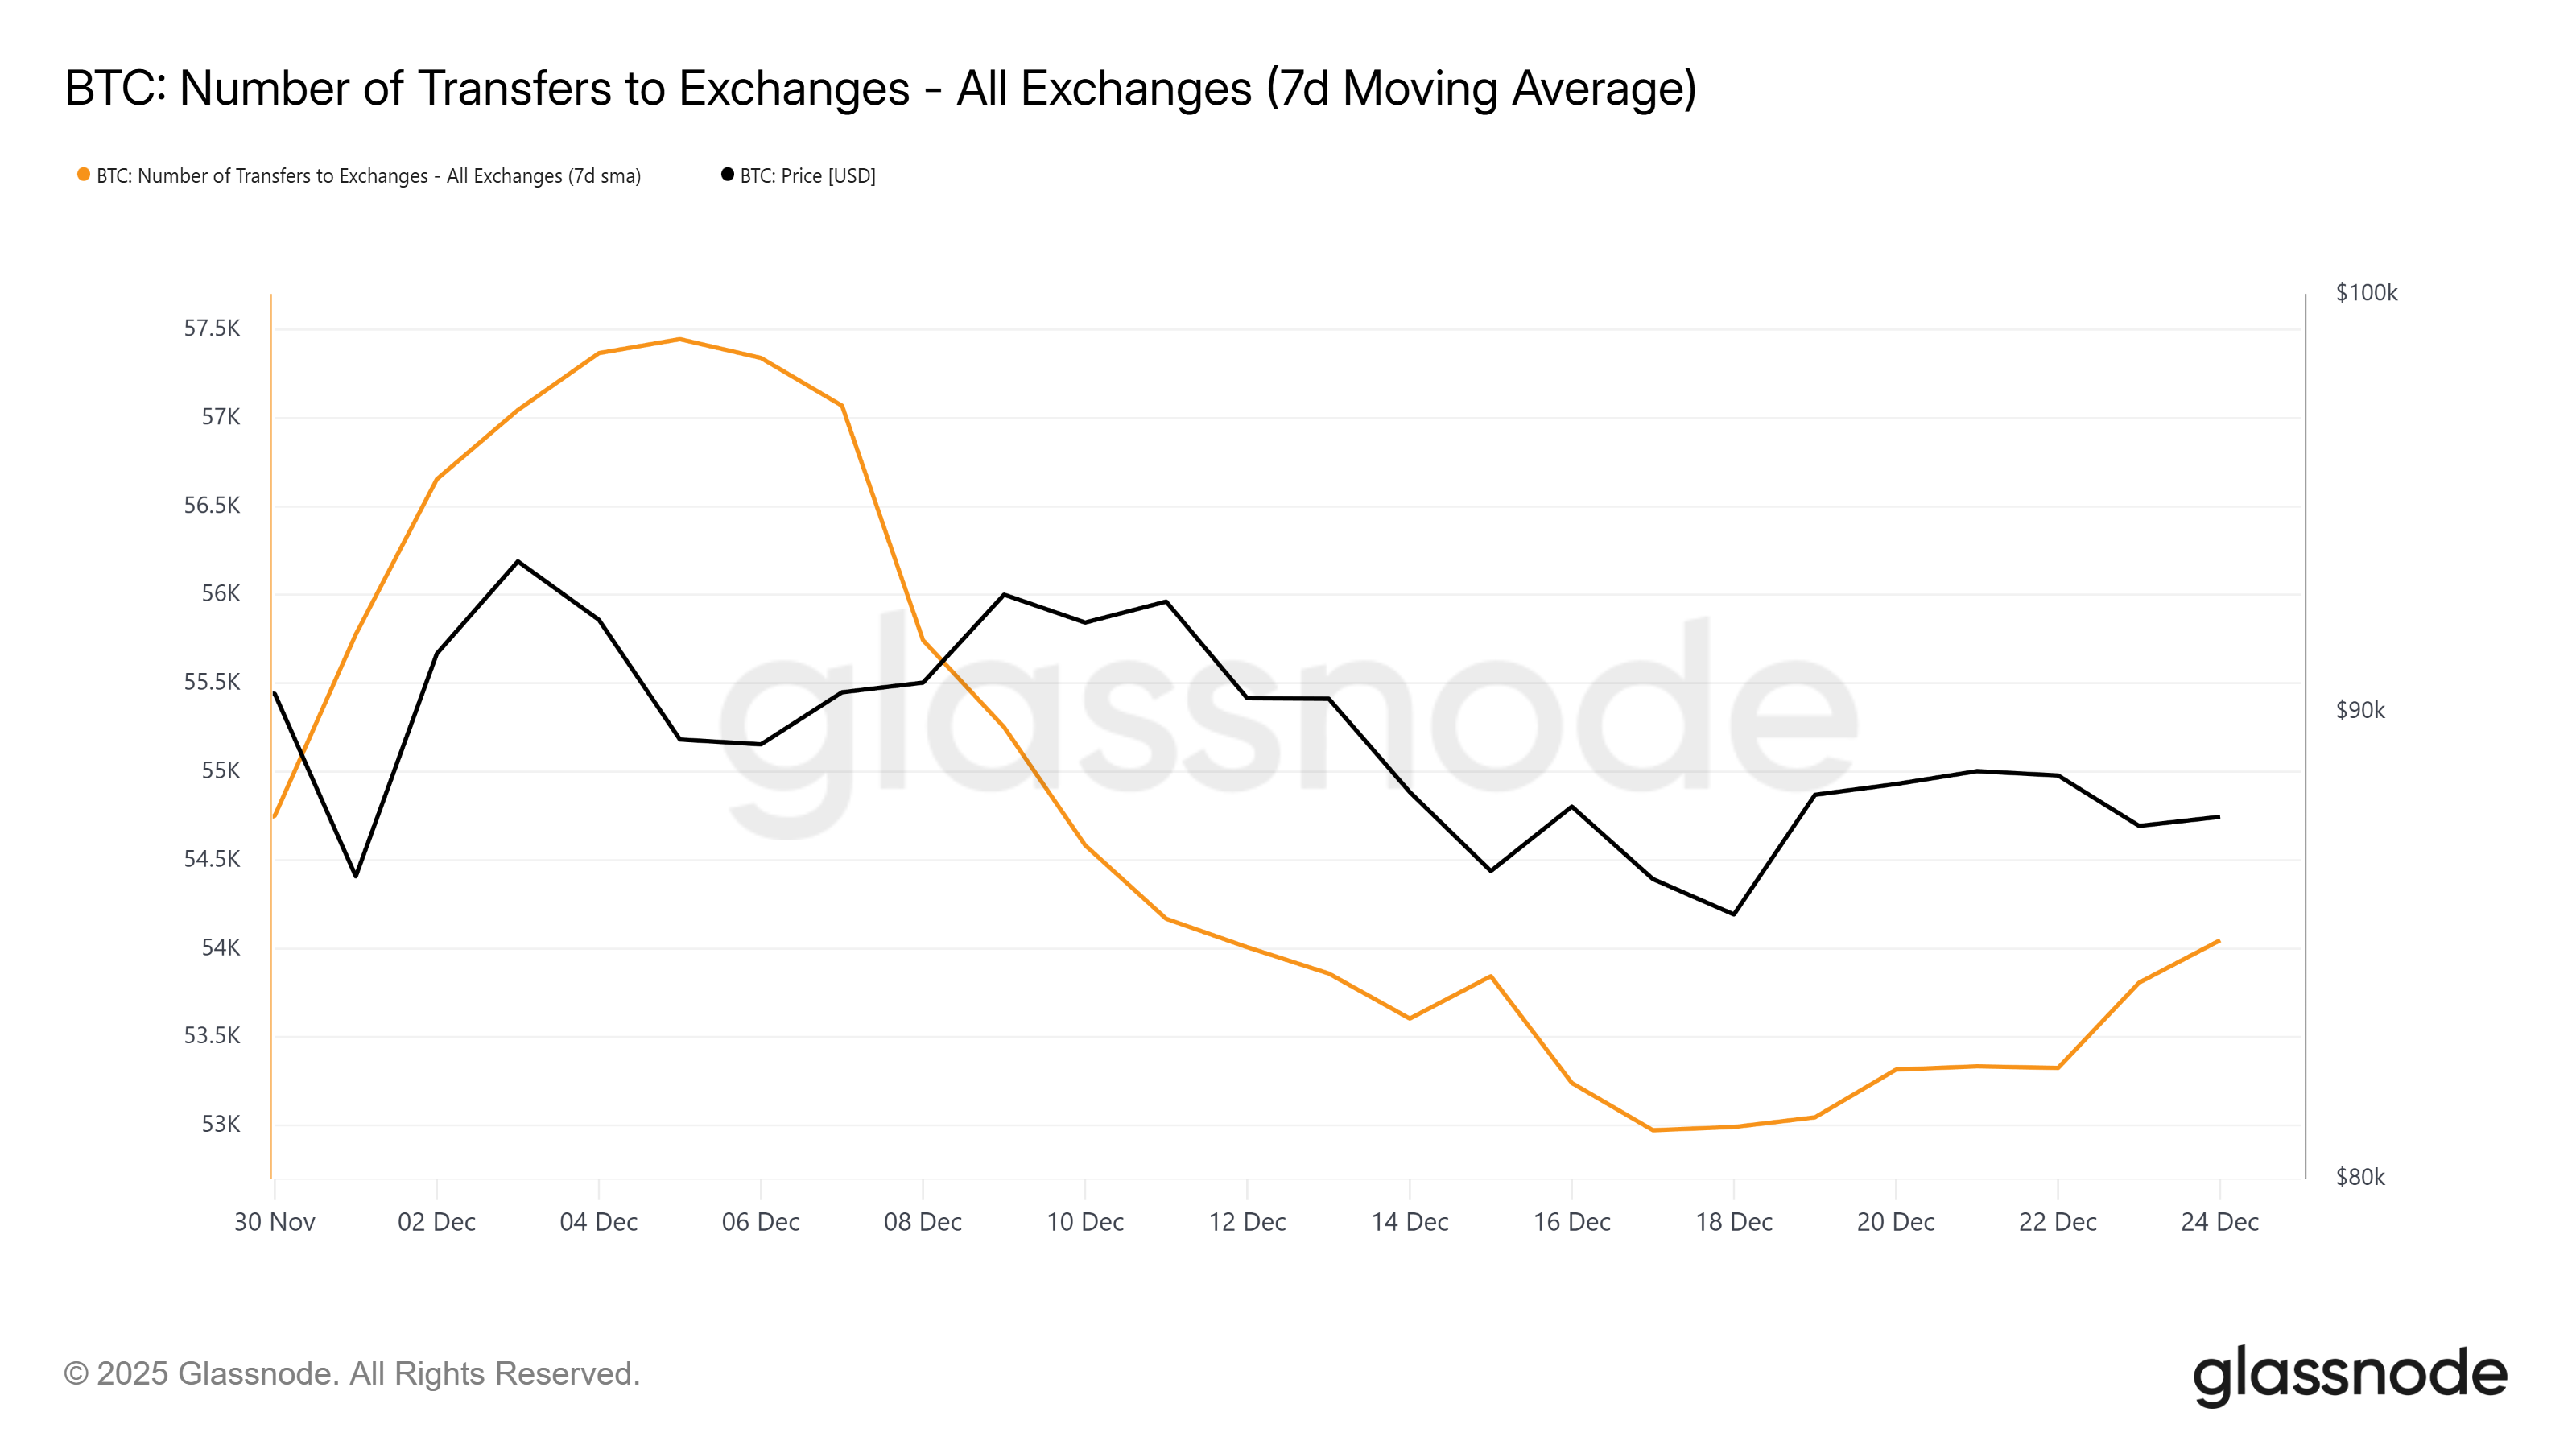
On-chain data suggests caution remains present among Bitcoin holders. Transfers to exchanges have increased in recent weeks, signaling elevated deposits from investors. This metric often reflects profit-taking behavior or preparation for potential downside protection during uncertain market phases.
Rising exchange inflows do not always signal immediate selling pressure. However, sustained increases typically precede heightened volatility. In Bitcoin’s case, growing deposits suggest some investors are managing risk rather than aggressively accumulating. This dynamic aligns with the mixed sentiment currently shaping price action.
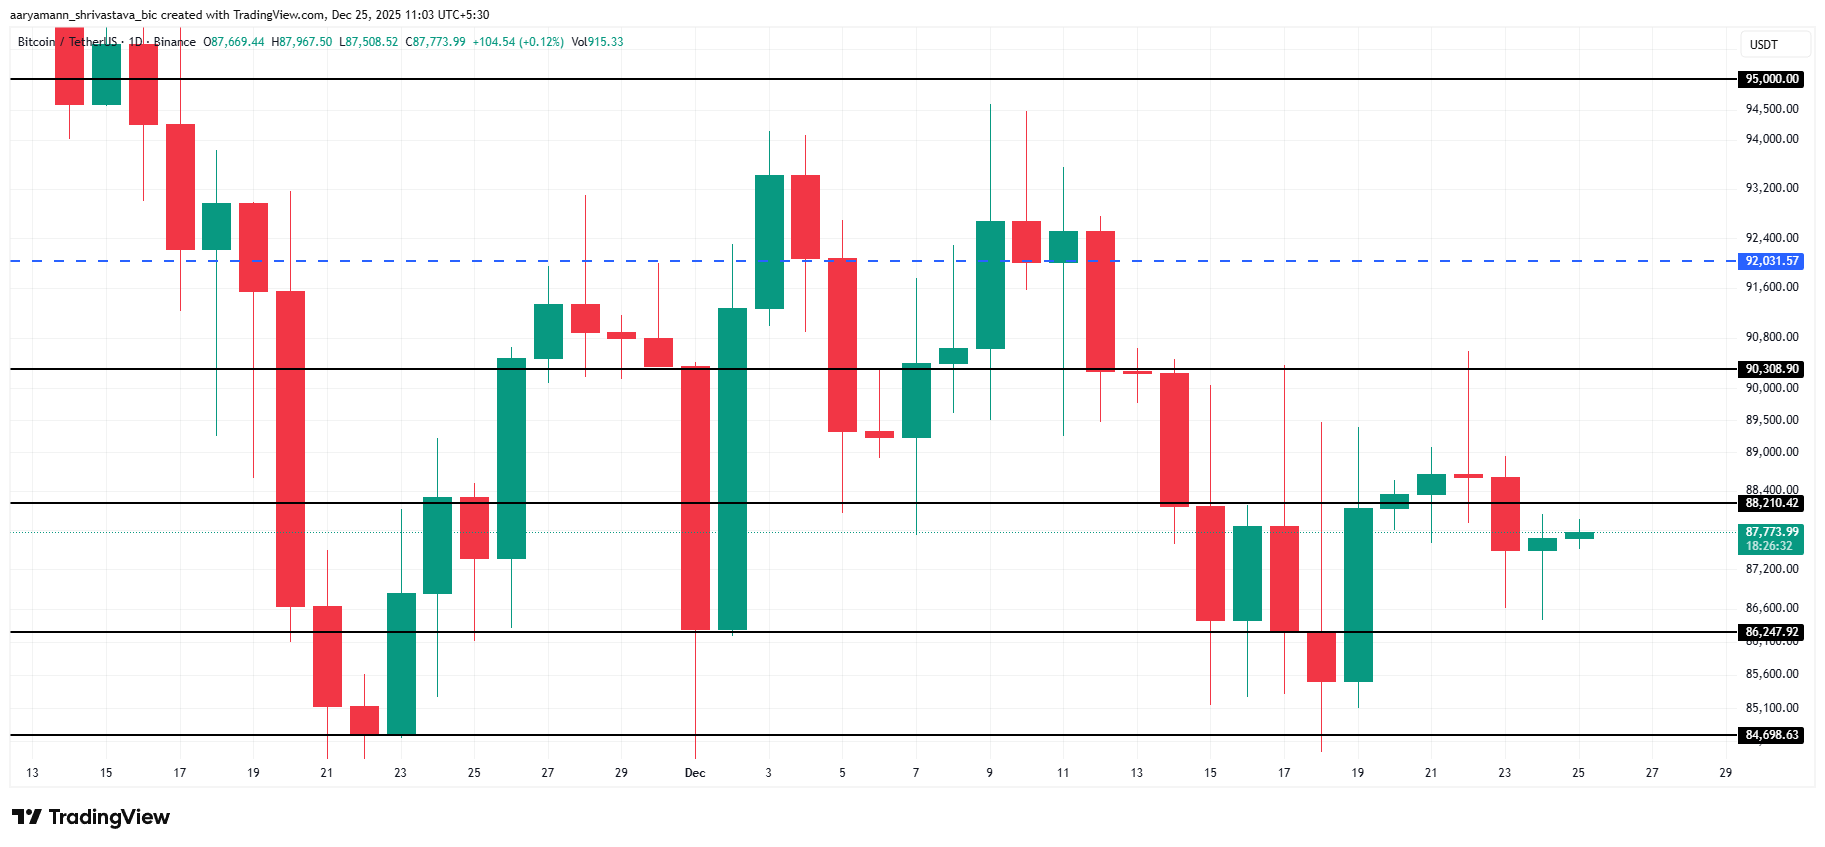
Bitcoin price traded at $87,773 at the time of writing, sitting below the $88,210 resistance. BTC began 2025 near $93,576. For now, the primary objective remains reclaiming that level before year-end, provided market conditions improve, and volatility remains contained.
This scenario becomes more likely if Bitcoin continues tracking gold’s bullish cues. A confirmed breakout would require flipping $88,210 into support. A sustained move above $90,308 would strengthen upside conviction and signal renewed momentum across spot markets.
Conversely, increased selling pressure could disrupt this setup. If Bitcoin loses the $86,247 support, downside risks expand. A drop toward $84,698 would invalidate the bullish thesis and reintroduce near-term bearish pressure.
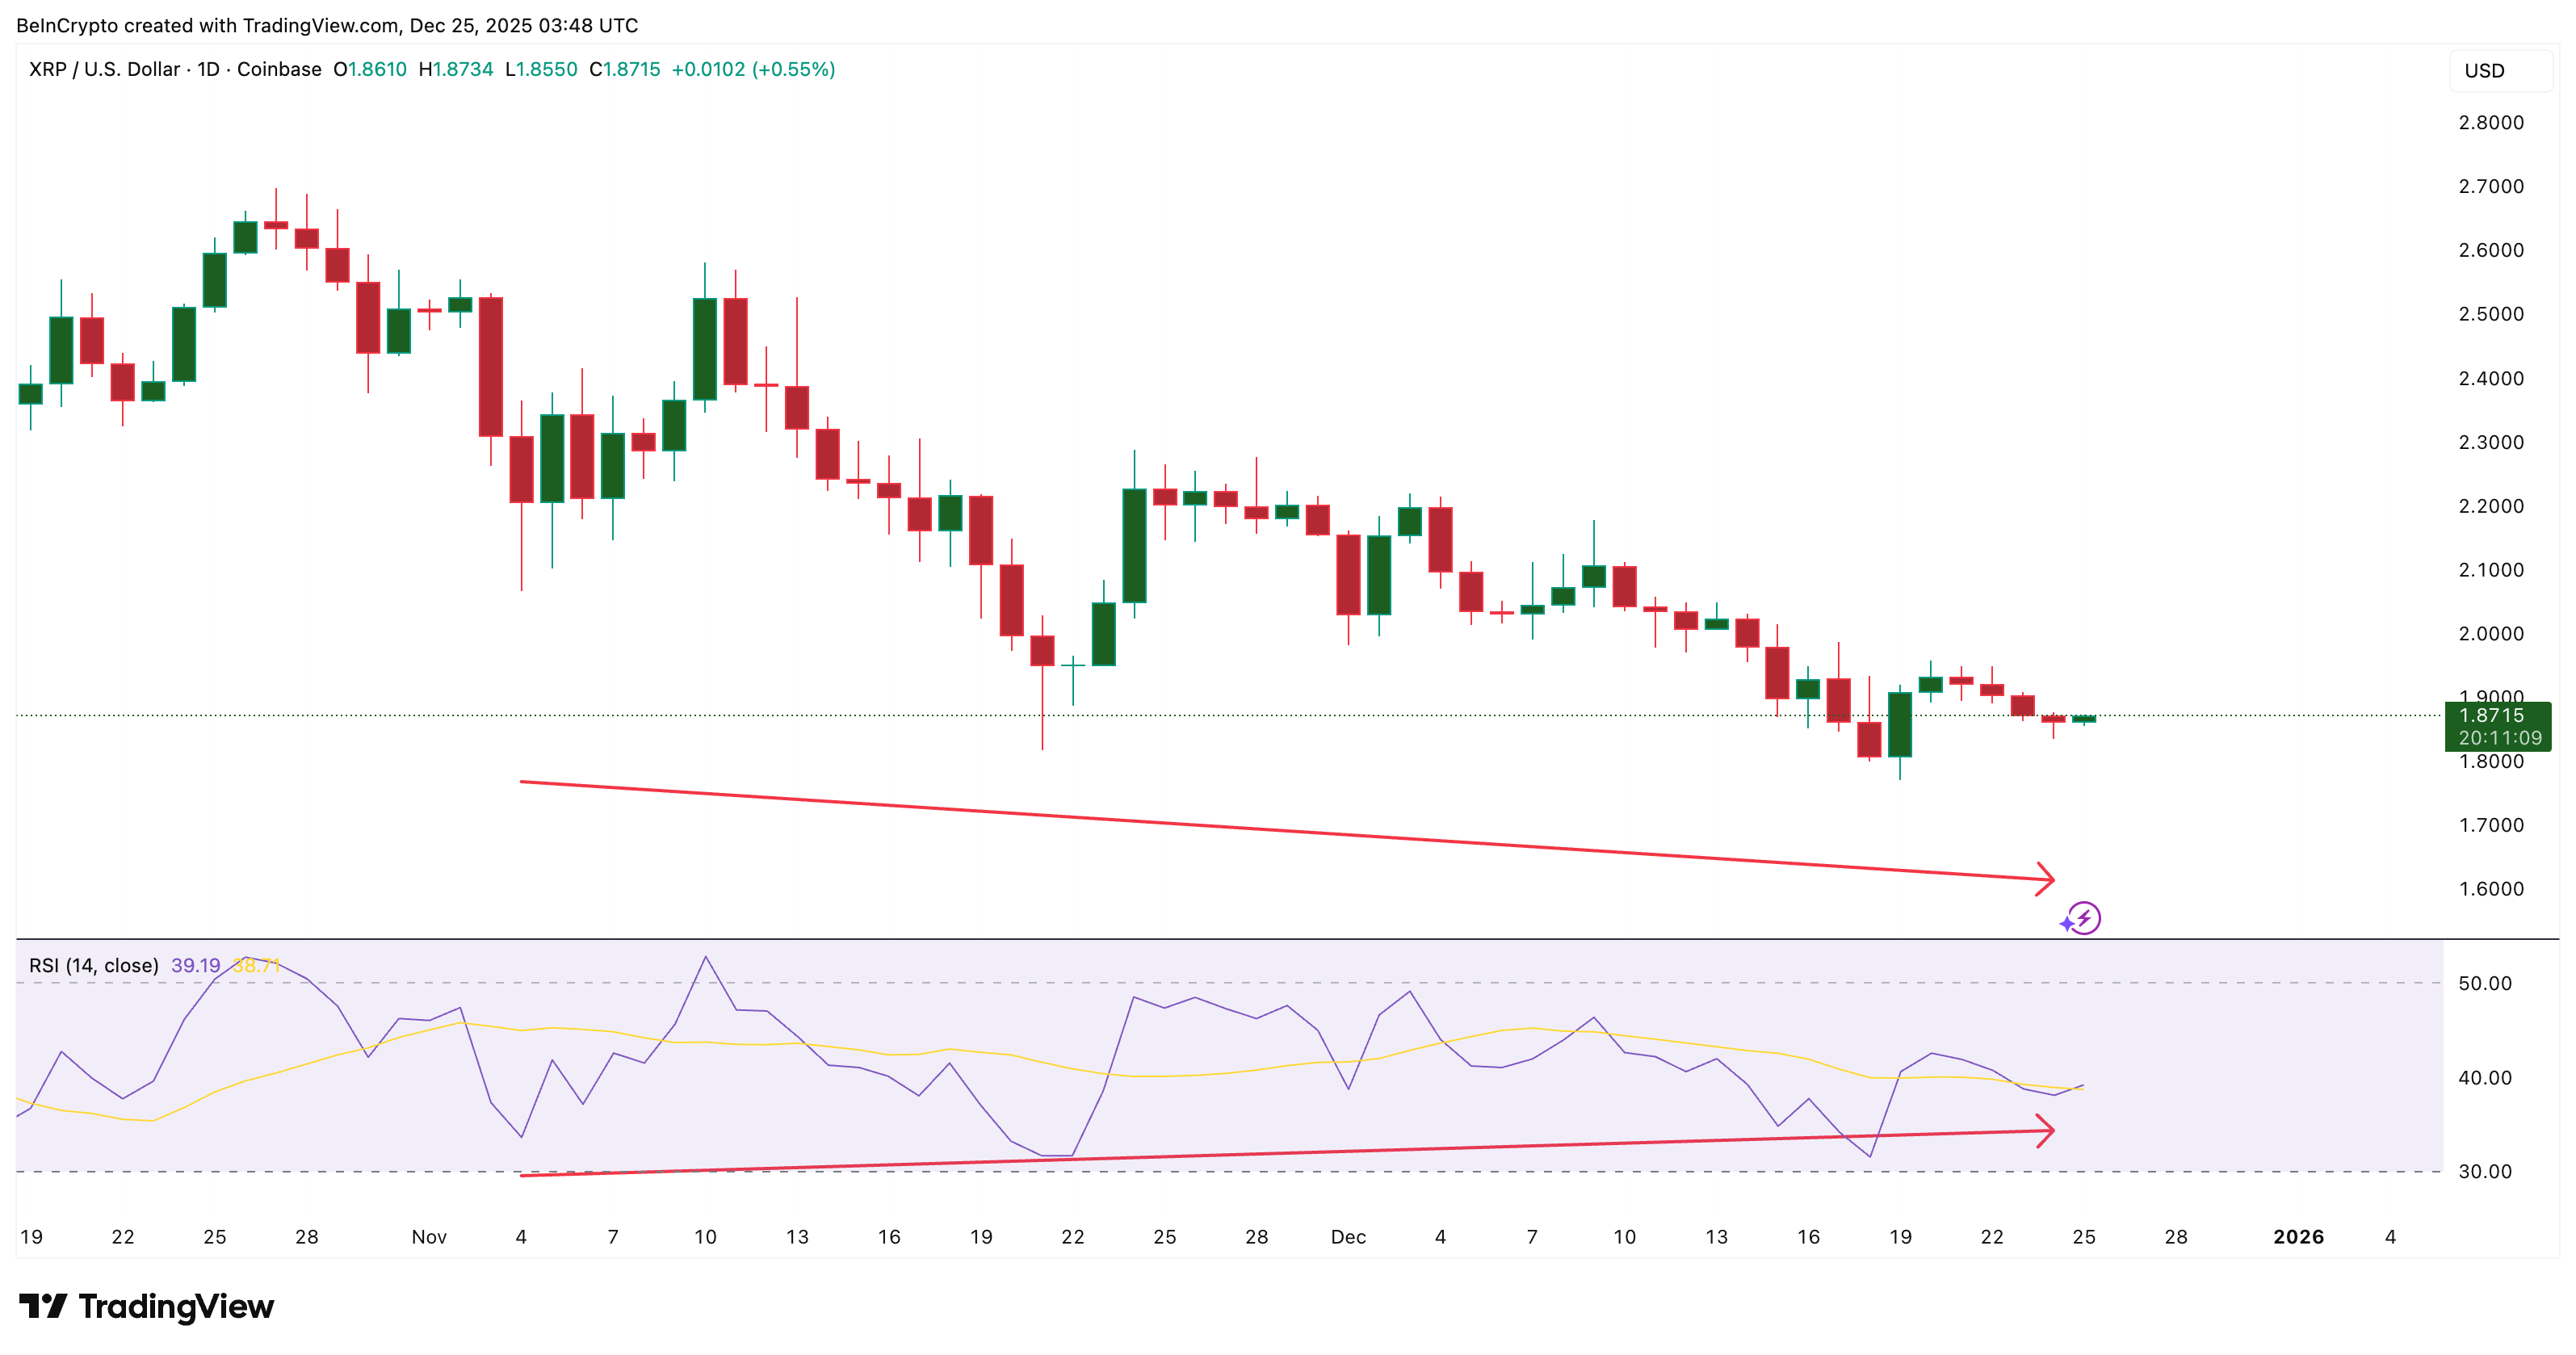
XRP has been flat for most of the last 24 hours and remains down about 16.8% over the past 30 days. The chart still feels bearish, but this 2025 Christmas season brings three tailwinds that look like they are trying to pull the sleigh in a new direction.
It is not a rally call. It is a setup. If buyers follow through, this could be the start of something.
Momentum and Money Flow Try To Join The Christmas Choir
The XRP price has been trending lower between November 4 and December 24, forming clear lower lows. But the relative strength index (RSI), which measures momentum, has made higher lows in the same period. That is called a bullish divergence. It happens when the price goes down, but momentum quietly turns up, and it often appears before a reversal attempt.
Want more token insights like this? Sign up for Editor Harsh Notariya’s Daily Crypto Newsletter here.
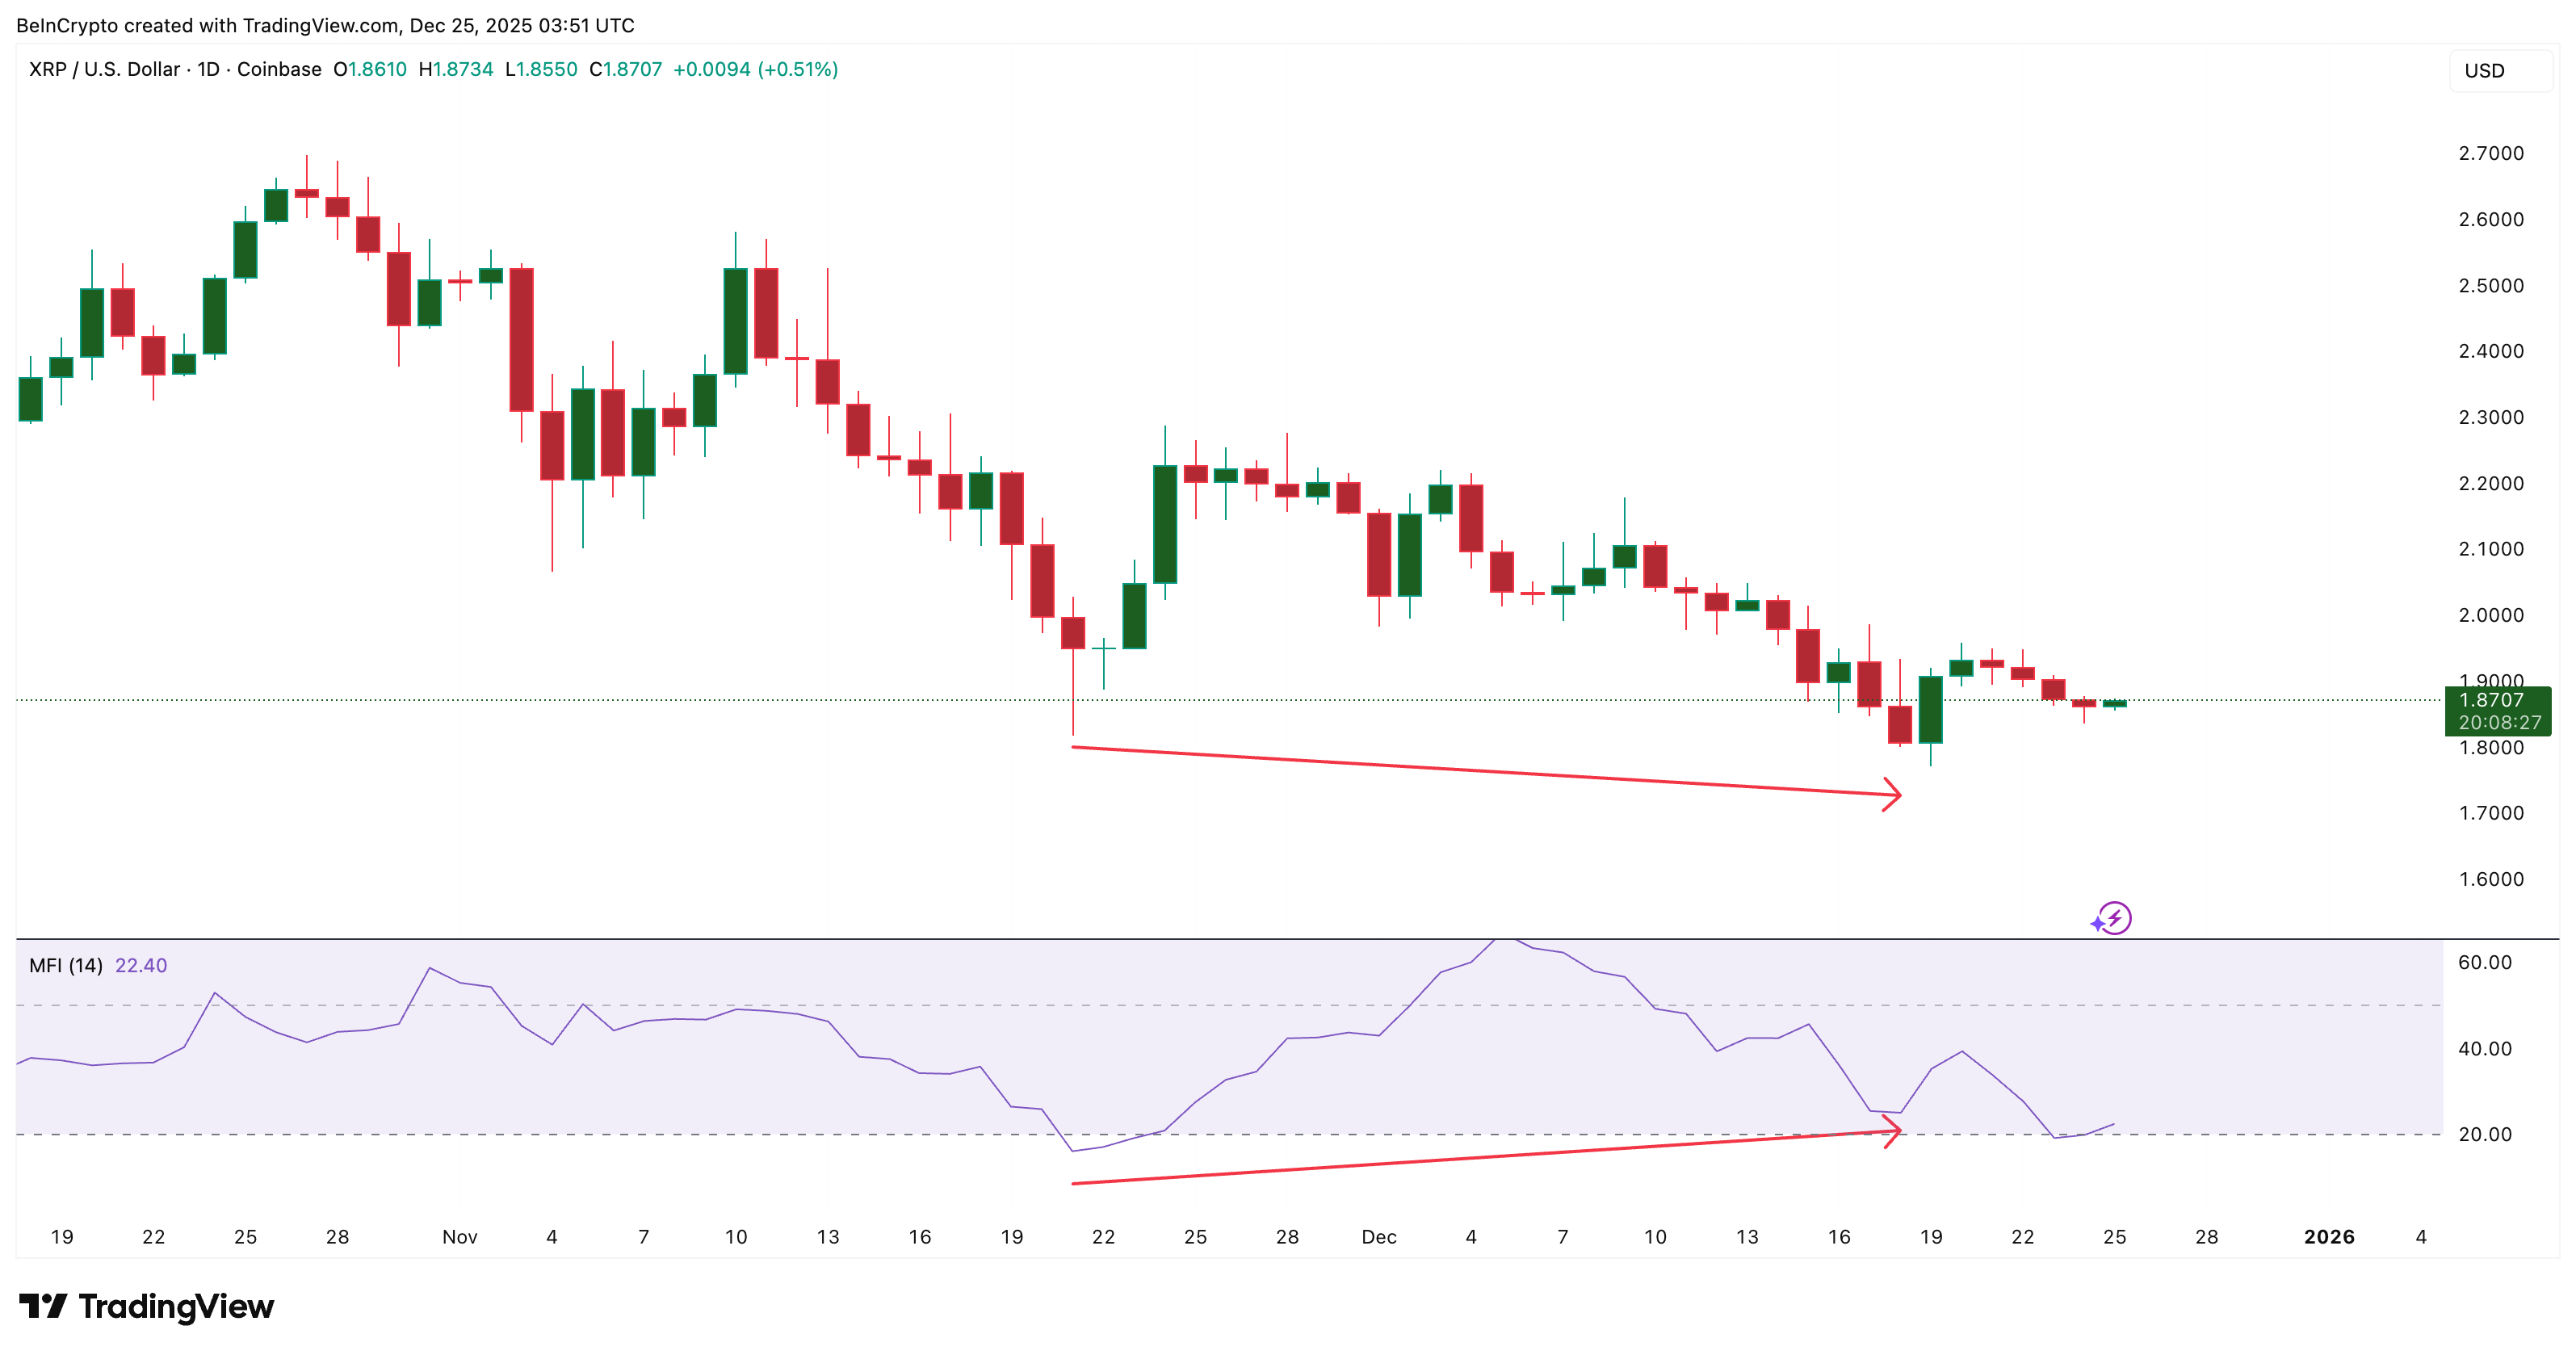
The money flow index (MFI), which tracks volume and inflows, is also showing a divergence.
Between November 21 and December 18, the price trended lower, but the MFI trended higher. That hints at dip-buying pressure and money rotating back in even while the price hesitated. In response, the XRP price began to rebound after December 18.
Currently, the MFI still maintains the higher low setup relative to November 21, despite the recent dip against the rising price. Plus, it has now moved out of deeply oversold territory, hinting at a resumption of dip-buying narrative, near the reversal zone.
Both signals suggest sellers could be losing authority. They are not confirmations, but they are Christmas carols humming under the surface.
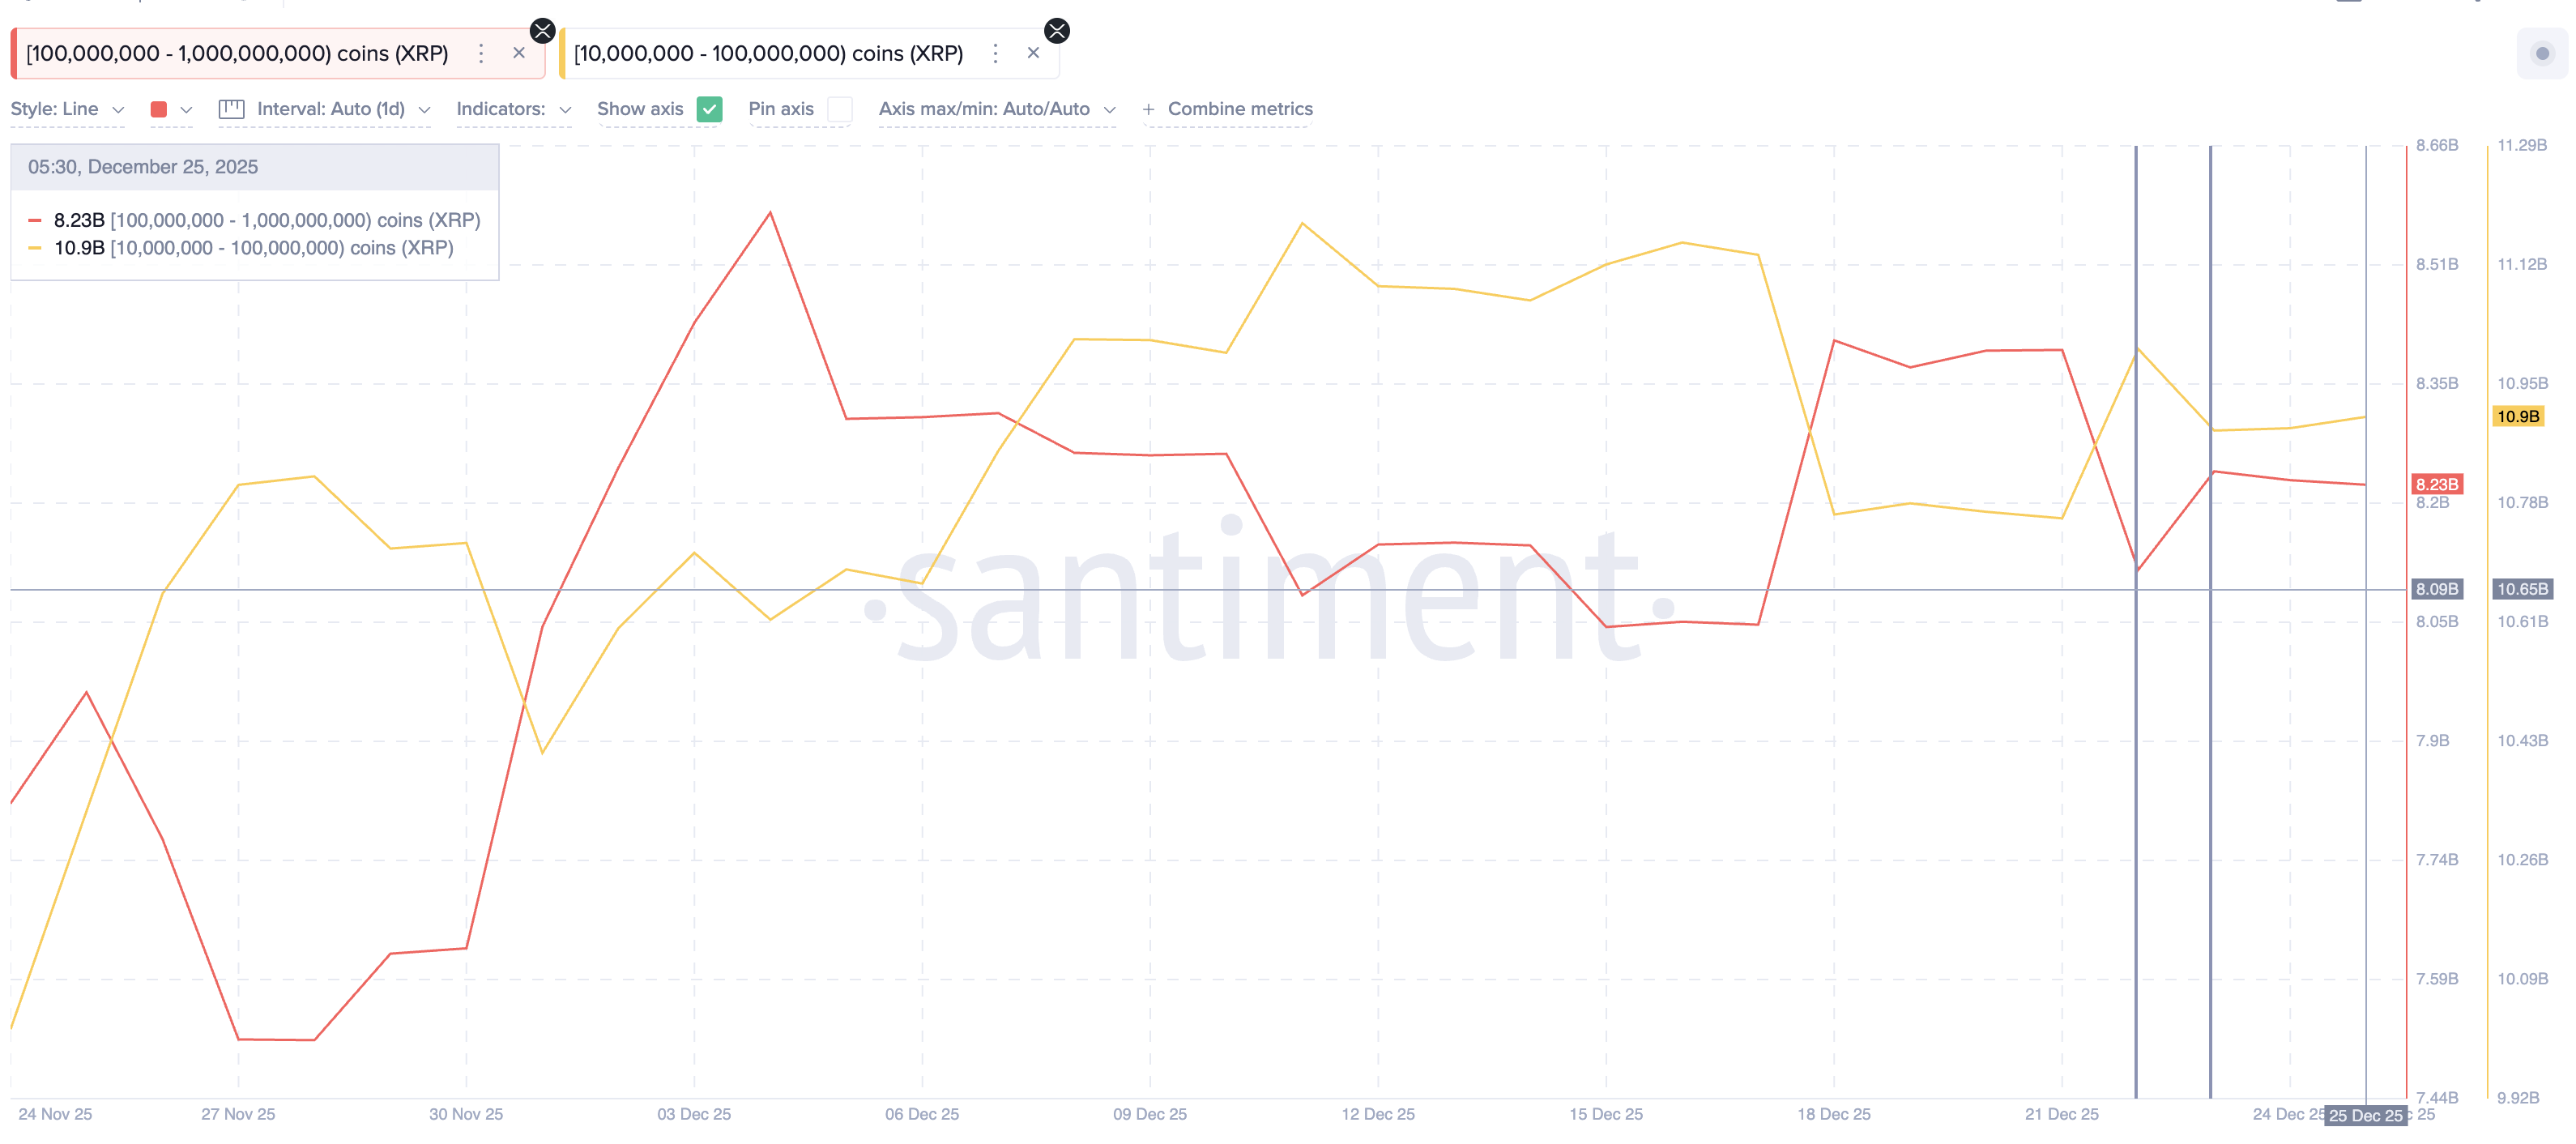
Whales Return Like Cautious Reindeer
Two whale cohorts have resumed adding, but not dramatically. The second-largest cohort, holding between 100 million and 1 billion XRP, increased its holdings from 8.11 billion XRP to 8.23 billion XRP starting on December 22. At the current price, that is roughly a $150 million change.
The next cohort holding between 10 million and 100 million XRP increased from 10.88 billion XRP to 10.9 billion XRP, a tad late on December 23. At current prices, that is roughly a $50 million increase.
This is not aggressive accumulation like the mid-December spikes. It is cautious, like reindeer testing the snow before charging forward. Still, whales adding while momentum improves gives the reversal attempt a spine. It shows the market’s deepest pockets are not abandoning ship at current levels.
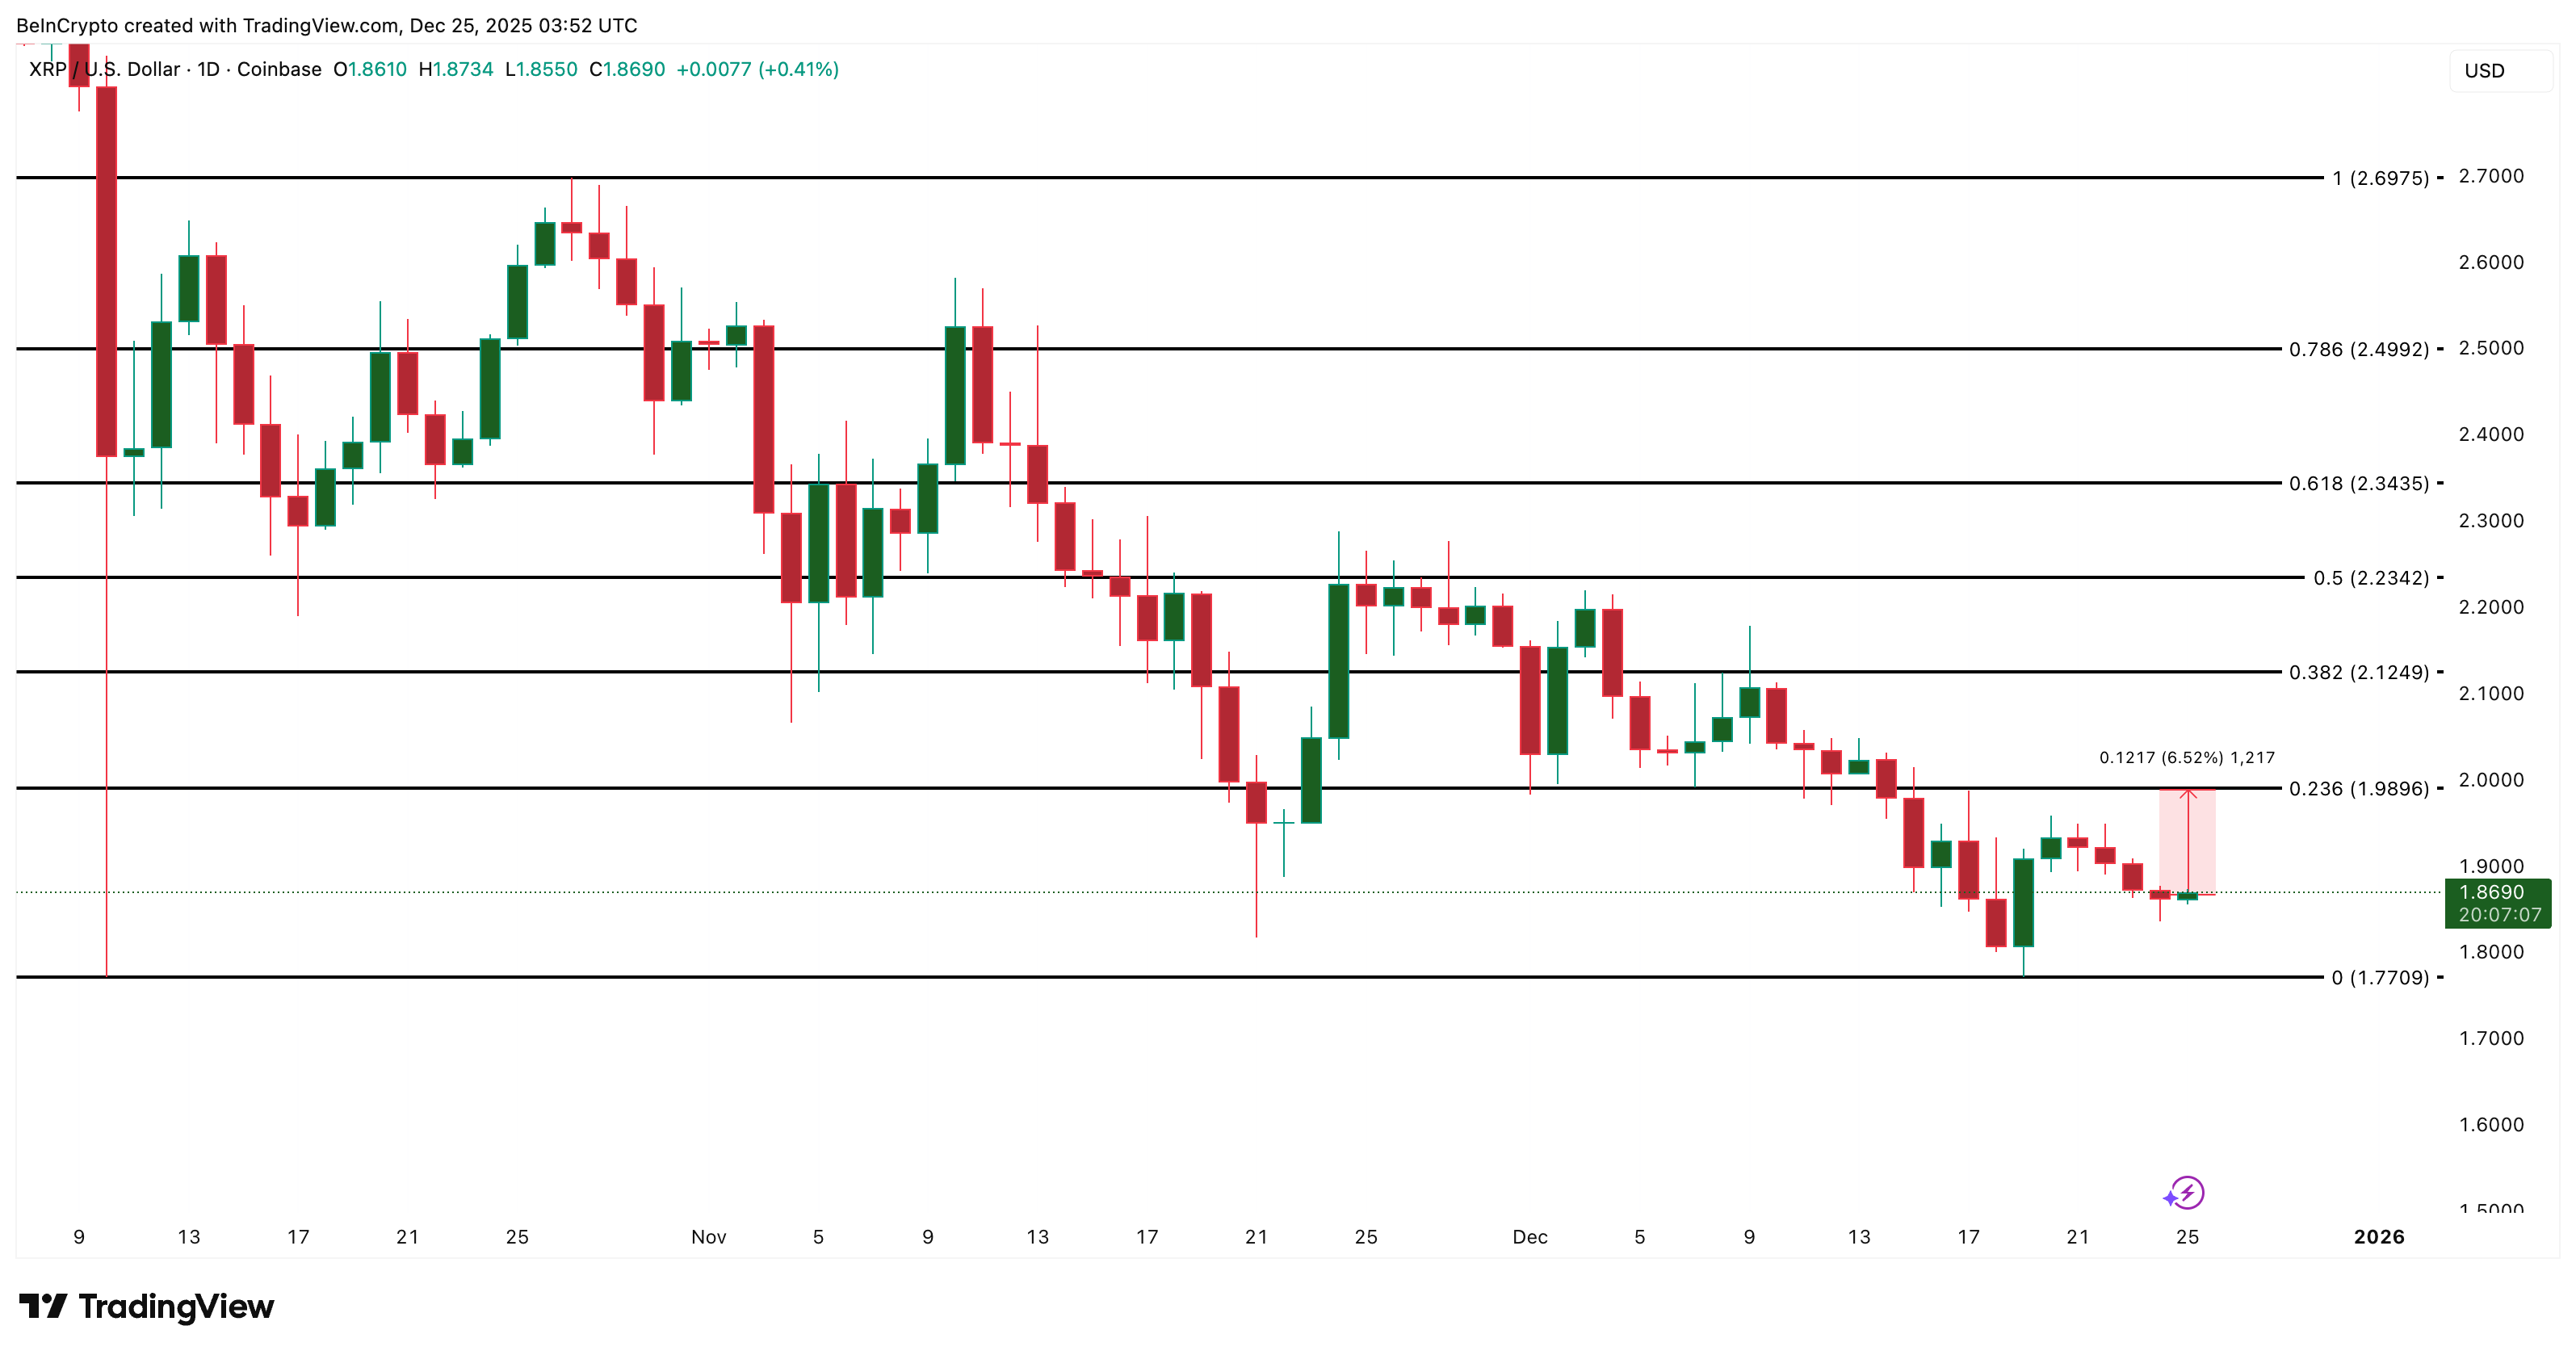
XRP Price Levels That Can Light Up The Christmas Tree
If the XRP price wants to turn these signals into real results, it needs to work with them. The first hurdle sits near $1.98. That level has capped every upside move since December 15. If XRP buyers can help clear it, a move into the $2.12 zone becomes possible. Above that, $2.23 is where buyers would prove they are more than holiday visitors.
On the downside, the key level is $1.77. That has acted as structural support since October 10. A daily close below $1.77 would signal the sleigh might not get off the ground and that sellers still own the season.
For now, XRP is holding above $1.77 with momentum slowly improving, money flow no longer bleeding out, and whales stepping back in. None of these turns the chart bullish on its own. Together, they set the stage for a potential trend change if the price cooperates.
If XRP climbs above $1.98 with strength, the Christmas tailwinds pushing from underneath might get loud enough to matter. Until then, the sleigh is pulling forward, but it has not taken flight.
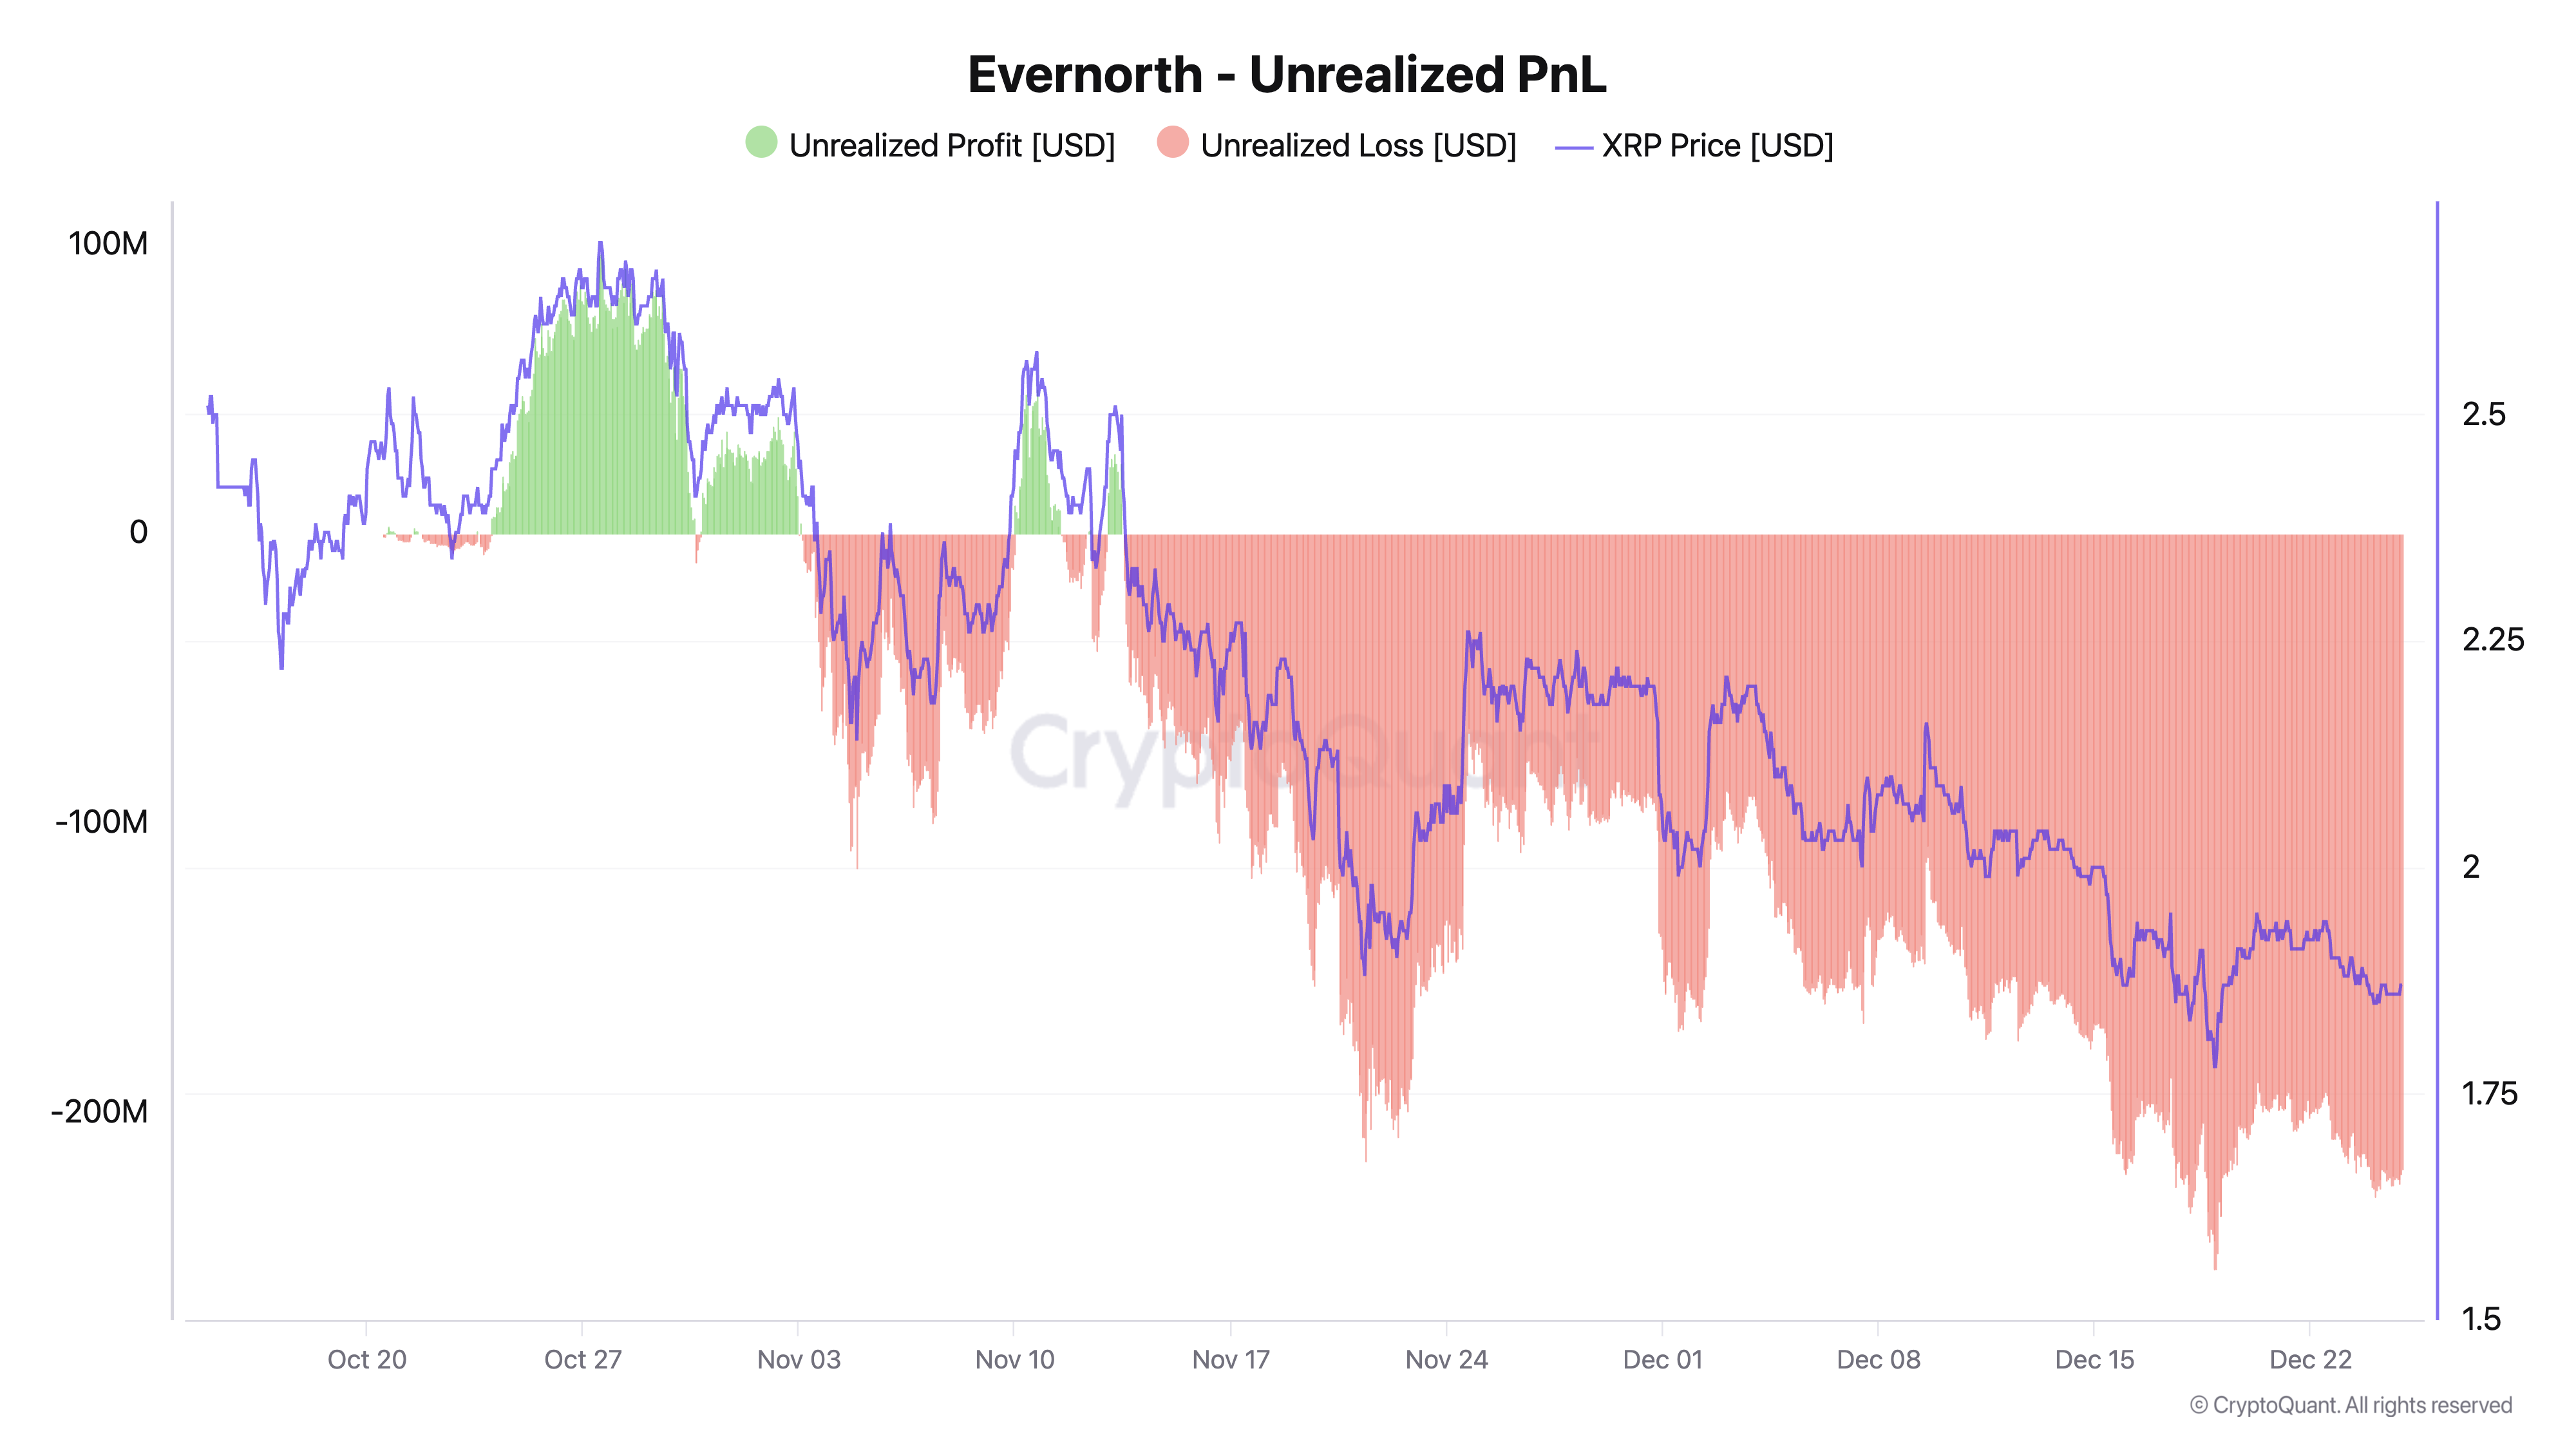
Evernorth, the largest institutional holder of XRP, is sitting on more than $200 million in unrealized losses.
This position highlights the volatility and risks associated with institutional cryptocurrency holdings during a market downturn.
XRP Treasury Firm Evernorth Sees Value of Holdings Drop by Over $200 Million
Evernorth has emerged as a prominent player in the institutional adoption of XRP. In late October, the Nevada-based firm announced plans to raise $1 billion to establish what it described as the “largest public XRP treasury company.”
On November 4, 2025, Evernorth acquired 84.36 million XRP at an average price of $2.54 per token. The transaction pushed the company’s total XRP holdings to more than 473.27 million tokens.
“This continued accumulation reflects Evernorth’s conviction in XRP as the most important asset of the internet, and its mission to build a long-term, institutional-grade XRP treasury with compounding yield,” the firm stated.
However, these purchases have come at a cost. According to data from CryptoQuant, Evernorth’s XRP position is now showing unrealized losses exceeding $200 million.
This mirrors broader weakness across the XRP market. Nearly half of the token’s circulating supply is currently held at a loss. The drawdown stems from XRP’s recent price weakness.
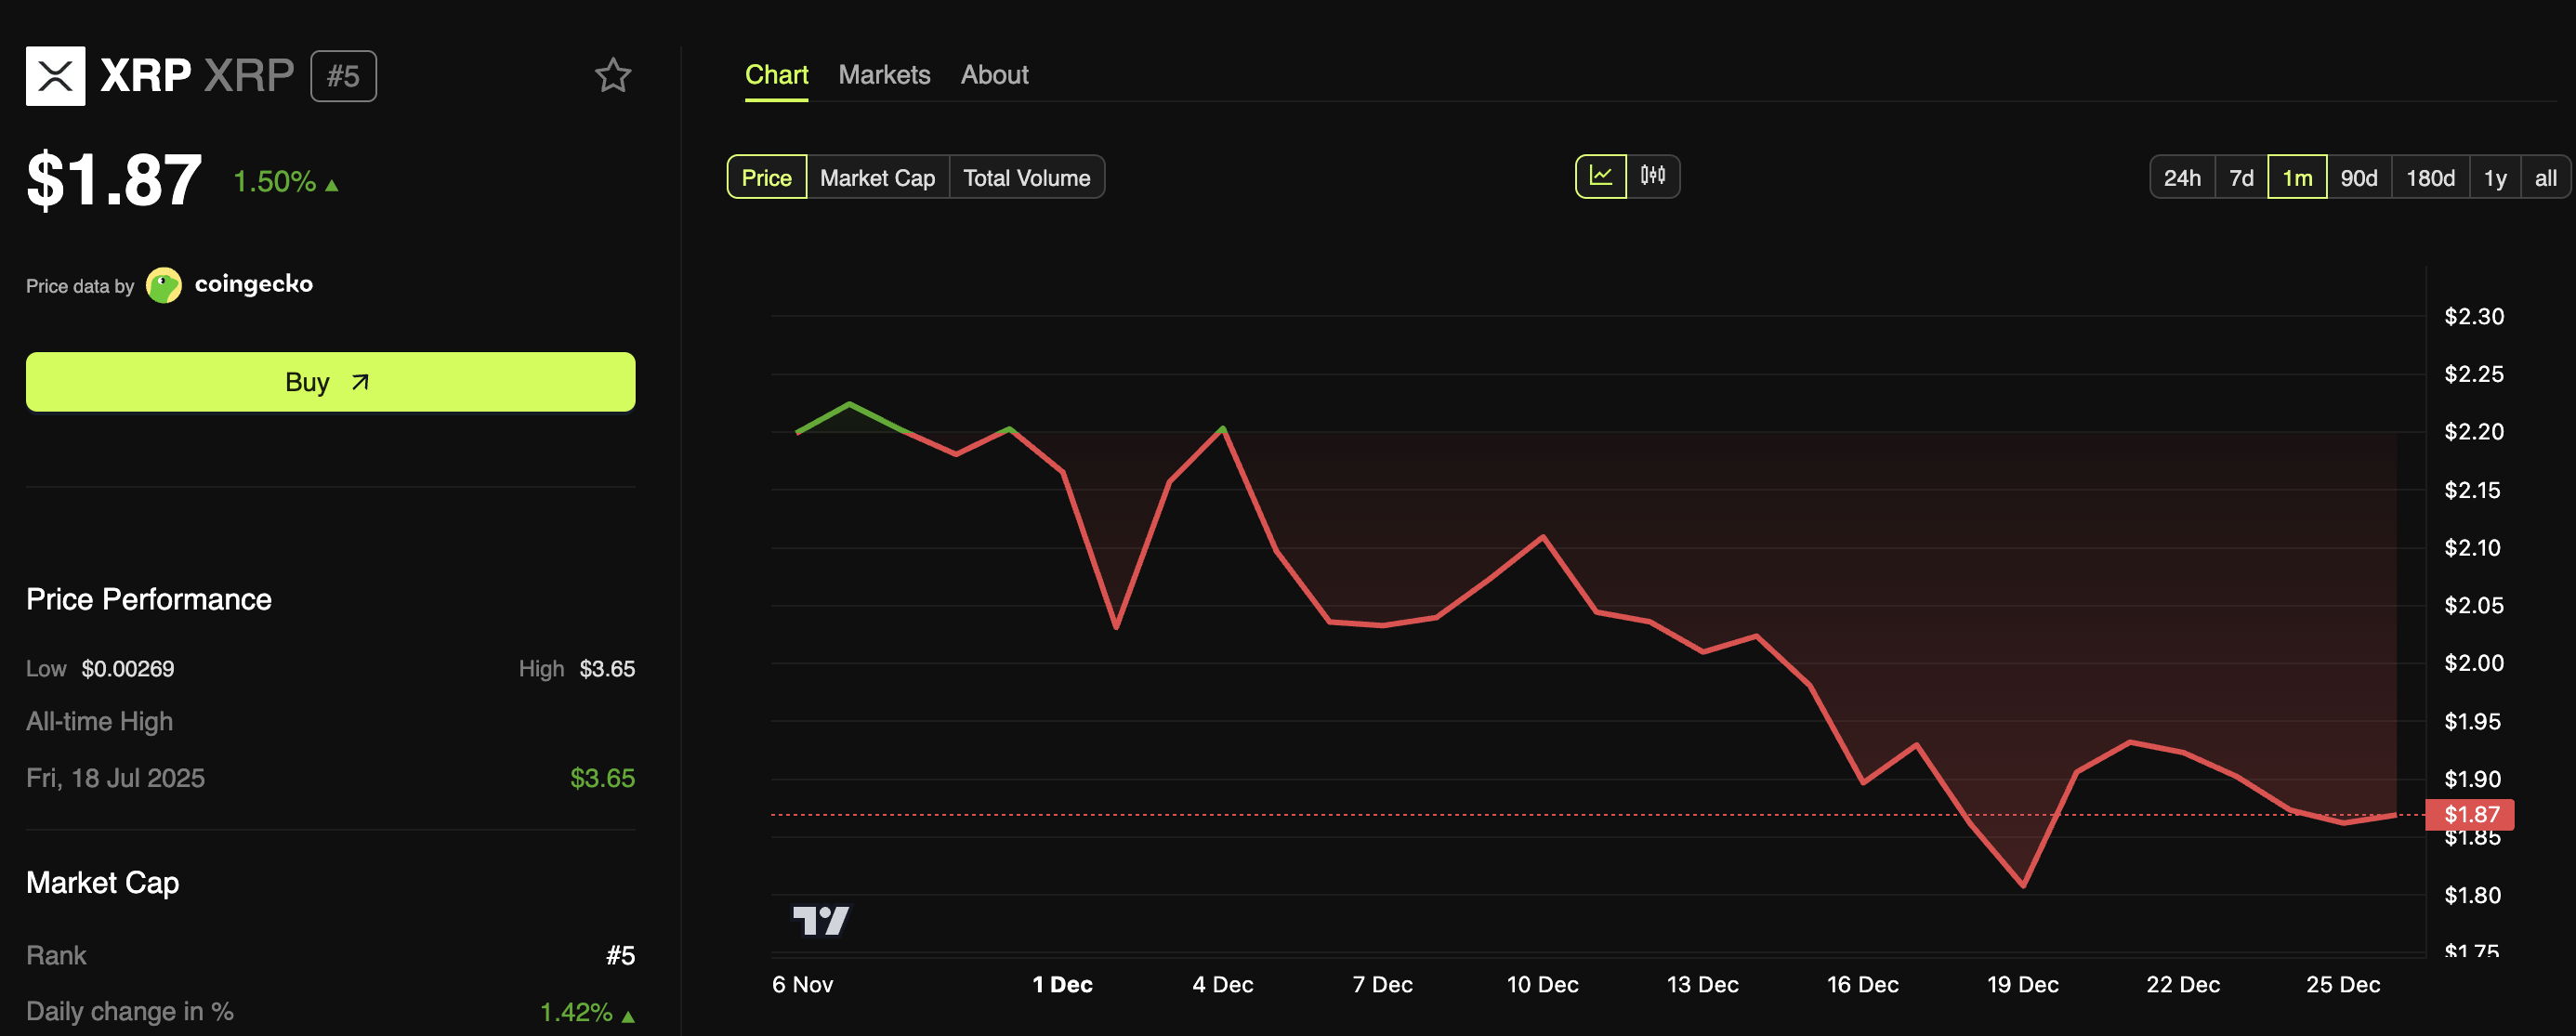
The altcoin has fallen by roughly 25% since Evernorth’s initial treasury announcement. It is now trading below price levels seen at the start of the year, highlighting the challenges facing XRP as momentum continues to fade.
At the time of writing, XRP’s trading price stood at $1.87. The price rose 1.5% over the past day as part of the broader market rally.
Still, BeInCrypto reported that the current market cycle threatens to end XRP’s two-year streak of positive annual returns, with the token likely to close the year down approximately 11%.
Meanwhile, XRP is not the only major crypto asset facing pressure in the fourth quarter of 2025. Other leading cryptocurrencies have also declined, weighing on institutional investors with large on-chain positions.
According to analyst Maartunn, BitMine is currently sitting on an unrealized loss of approximately $3.5 billion on its Ethereum holdings. Despite the drawdown, the firm has continued to accumulate ETH.
Bitmine is currently sitting on an unrealized loss of -$3.5B — a massive drawdown. 🤯 pic.twitter.com/dp2lQMaPWl
Bitcoin-focused treasuries are facing similar challenges. Metaplanet’s Bitcoin holdings are down roughly 18.8%, while several other institutional holders are showing comparable declines as broader market weakness persists.
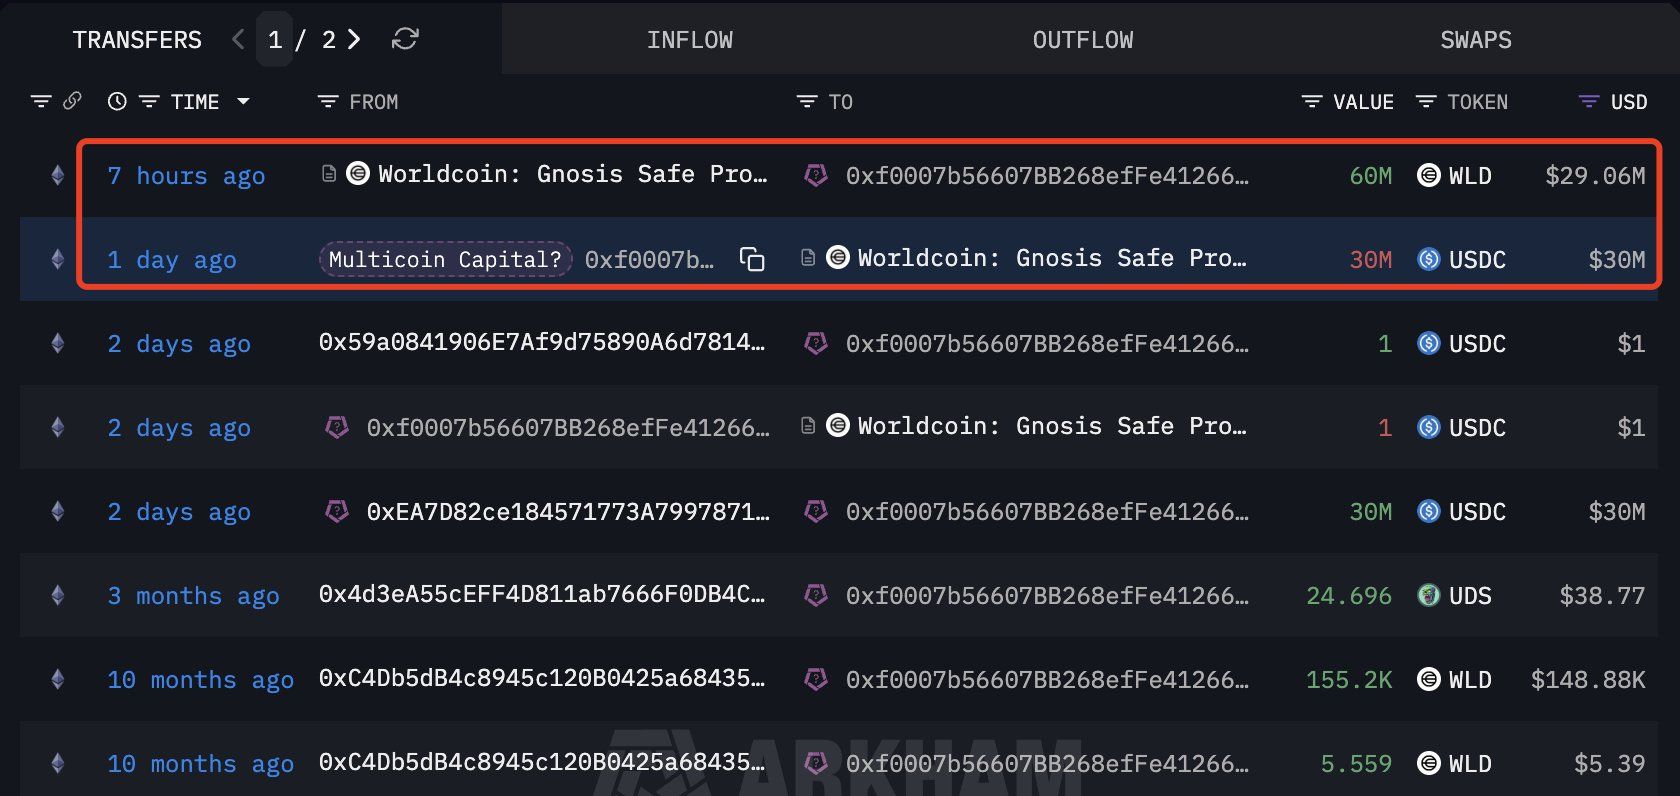
Multicoin Capital has reportedly purchased 60 million Worldcoin (WLD) in an over-the-counter transaction with the project’s team, betting on the biometric identity protocol.
The acquisition comes amid a period of declining investor engagement, with WLD’s price slipping 21% over the past month.
Multicoin Capital Doubles Down on Worldcoin Despite Price Slide
Founded in 2017, Multicoin Capital is a thesis-driven firm specializing in crypto and blockchain projects. Blockchain analytics firm Lookonchain identified a large transaction involving a wallet reportedly associated with Multicoin Capital (0xf0007b56607BB268efFe4126655f077F8cf42696).
According to on-chain data, the address transferred 30 million USDC to the Worldcoin team one day ago. Then, Multicoin received 60 million WLD tokens, suggesting an OTC deal directly with the project rather than an open-market purchase.
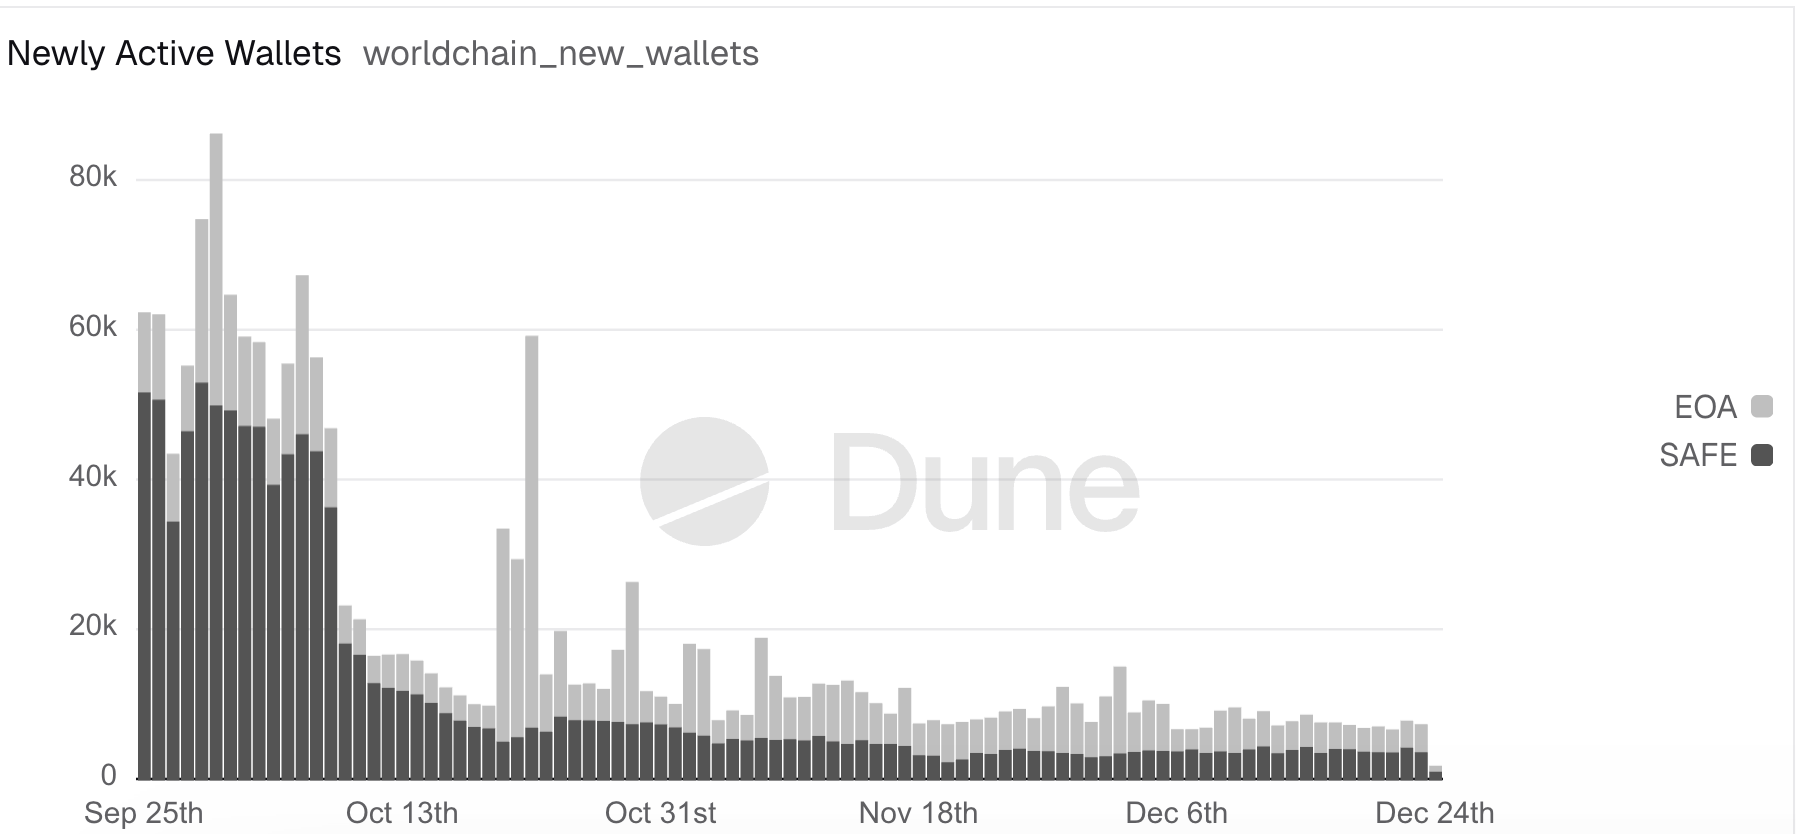
The timing of the transaction is notable, as on-chain and search data point to declining interest in Worldcoin. Dune Analytics showed that the number of new active wallet addresses has fallen sharply since September.
The slowdown in new participants suggests weakening retail demand, even as institutional investors continue to accumulate. Search interest has followed a similar trajectory.
Google Trends data revealed that searches for “Worldcoin” dropped significantly after peaking at a score of 100 in September. That surge was largely driven by Upbit’s listing of WLD, which also pushed the token’s price up at the time. Since then, however, Worldcoin has erased those gains, with search interest falling to a score of 6 at press time.
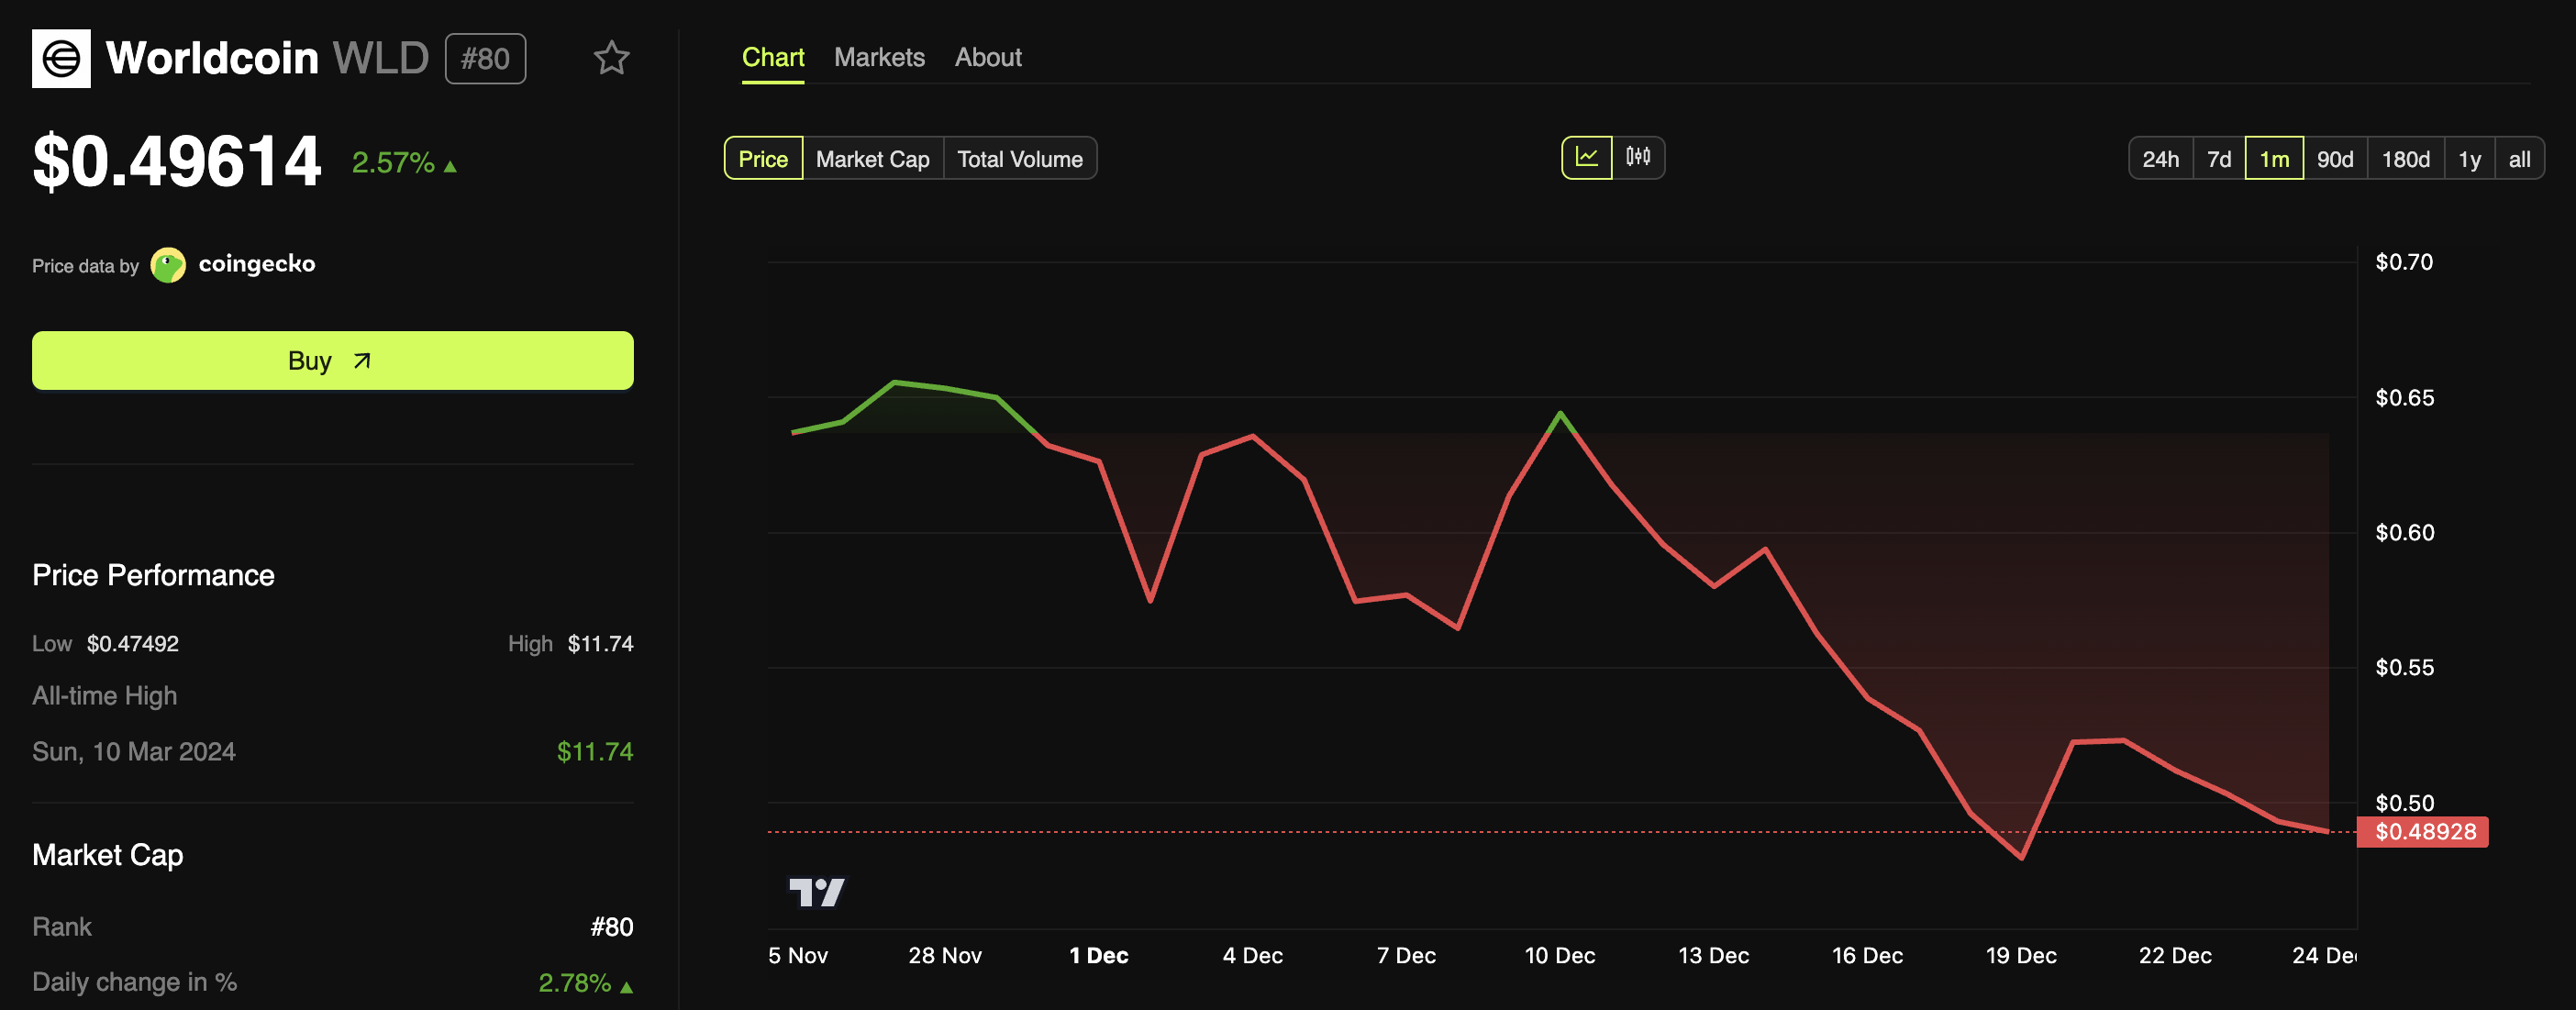
Price action reflects this cooling momentum. According to BeInCrypto Markets data, WLD has lost more than 21% of its value over the past month.
At the time of writing, the token was trading at $0.49614, representing a 2.57% increase over the past 24 hours. The short-term rebound comes amid a broader market recovery, with the total crypto market capitalization rising by nearly 0.5%.
Beyond its price performance, the project is also under growing regulatory pressure. In late November, Thai authorities ordered World to suspend its iris-based enrollment activities in the country and erase biometric data gathered from more than 1 million individuals.
The order followed an October enforcement action, during which officials raided one of the project’s iris-scanning sites in Thailand.
“This collaboration will enhance the effectiveness of law enforcement in prosecuting and suppressing unlicensed digital asset businesses, while protecting users from lack of legal protection and mitigating risks of scams and money laundering,” Ms. Jomkwan Kongsakul, SEC Deputy Secretary-General, noted.
Retail participation in the cryptocurrency market has continued to decline throughout this cycle, with interest weakening further as the year draws to a close.
While some analysts still interpret fading retail engagement as a classic bottom signal, others argue the current downturn reflects a deeper cultural and social shift, where investor attention has moved away from crypto altogether.
Does Retail Apathy Mark a Bottom or a New Phase?
The crypto market’s downturn has prompted many analysts to call for a potential bottom, citing a range of factors from on-chain data and technical patterns to shifts in investor behavior. Among these indicators, retail disengagement has often been viewed as a key bottom signal.
Analysts argue that periods of extreme pessimism and low participation have coincided with market bottoms, leading them to interpret today’s widespread indifference as a similar turning point.
“Retail comes in at the TOP, not at the bottom, and the absence of retail at this moment implies this is not a market top, but rather a market bottom in the making,” an analyst stated.
However, new data suggests things may have changed. In a recent post, analyst Luc highlighted a deeper shift in retail. According to him,
“It’s cultural. A social shift. Attention has relocated.”
One clear sign is plunging interest in crypto content platforms. For example, a crypto YouTuber with 139,000 subscribers reported that their views have dropped more than at any other point in the past five years.
Well-known crypto influencers are also shifting focus to traditional equities. Together, these trends suggest a fading of attention rather than a temporary retracement.
Among younger investors, perceptions have changed. Crypto now competes with accessible alternatives such as prediction markets and crypto stocks, which have a lower risk of “rug pulls.”
“Every vehicle is becoming more accessible. From COIN adding stock trading, to HOOD adding 0DTE options, to prediction markets as a whole…Everything’s right there…without the perceived risk of a rug-pull via the “lawless” crypto landscape that defined crypto’s appeal in the first place,” Luc said.
Recently, BeInCrypto reported that many new investors are favoring gold and silver over crypto amid persistent inflation and broader macroeconomic uncertainty. This shift points to a wider generational turn.
Crypto’s image struggles further due to the rising number of hacks and scams. According to Chainalysis, the crypto industry lost more than $3.4 billion between January and early December.
Security incidents have increased during this period, with attackers employing increasingly sophisticated tactics to steal funds and exploit users.
“It’s now considered cringe to be in crypto. There’s too many scams for the average degen to handle. Kids would rather work in AI or something. general population doesnt really wanna do anything with crypto we didnt redeem ourselves after luna + ftx + illiquid jpegs debacles of 2022,” Kate, another market watcher, said.
Institutional Entry Is Changing Market Dynamics
While retail interest wanes, established financial firms are expanding their presence in crypto. Polygon Labs’ Aishwary Gupta told BeInCrypto that institutions account for an estimated 95% of crypto inflows, while retail participation has dropped to around 5–6%.
From the rise of digital asset treasuries (DATs) to legacy financial institutions increasingly entering the space, the market is becoming more institutionally driven. Yet, increased institutional involvement is a double-edged sword.
This adds legitimacy and easier access, but the sector’s original appeal drew people keen to escape traditional finance. Growing institutional dominance may undermine that core.
“But with legacy brokerages like Schwab/JPMorgan getting involved + gov’t interest, is crypto losing the demographic that made it popular in the first place?” Luc remarked.
Luc acknowledged that many of these dynamics have appeared in previous crypto bear markets. However, he emphasized that new variables now “change the game.”
“Crypto seems to be in a transition phase…from a momentum asset to an infrastructure asset,” he added.
If retail participation has indeed structurally declined, the key question becomes whether real-world crypto utility can offset fading speculative demand. Blockchain adoption in payments, supply chains, and decentralized finance is growing.
Still, it remains unclear whether these developments can generate the level of enthusiasm that fueled previous market cycles. As 2026 approaches, the dynamics of the crypto sector may offer clearer insight into whether this shift represents a temporary phase or a lasting transformation.