Bitcoin heads into 2026 with a clear macro risk: President Donald Trump’s tariff agenda. In 2025, crypto traders saw tariff headlines move prices as fast as ETF flows.
Several tariff levers now sit on the 2026 runway. Some already have dates. Others depend on diplomacy and court fights. Either way, they can flip sentiment from risk-on to risk-off in hours.
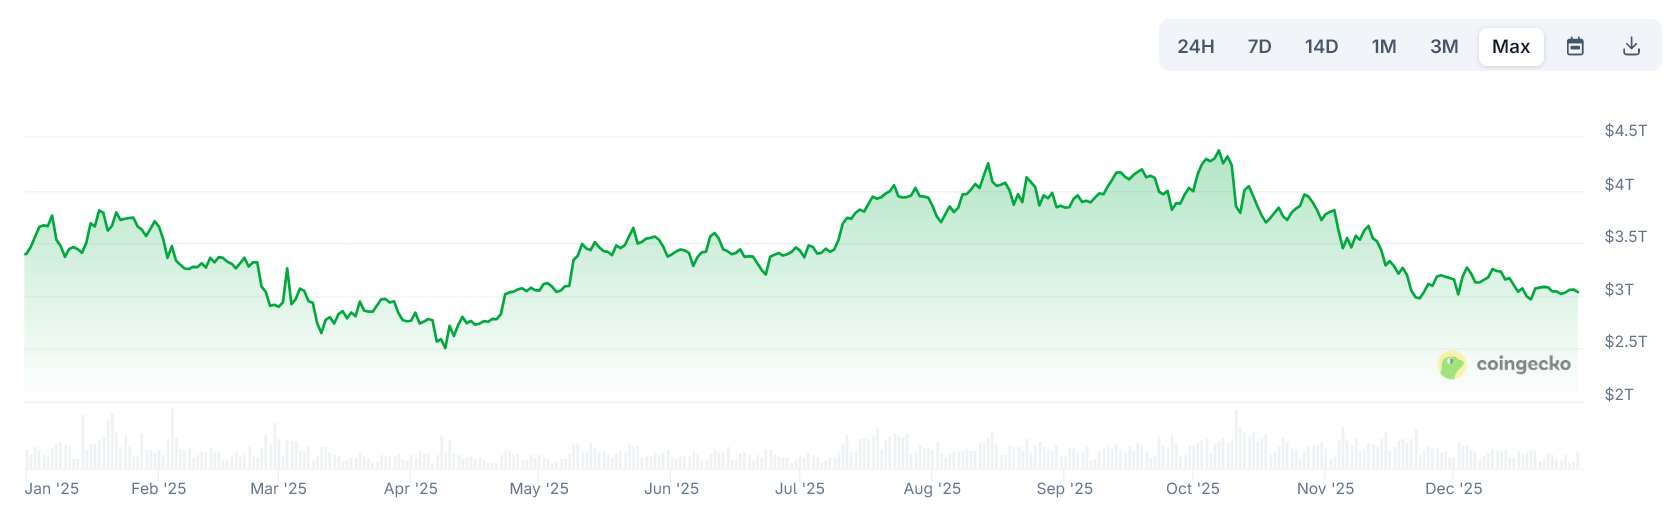
When Trump announced new tariffs on Mexico, Canada, and China in early February, Bitcoin slid to a three-week low near $91,400. Etherum fell about 25% over three days, and a large share of top tokens dropped more than 20% in a day as traders rushed to cut risk.
Crypto Market Cap Througout 2025. Source: CoinGecko
Then came April’s “Liberation Day” tariff shock and the US–China escalation. Bitcoin briefly fell below $82,000 during the worst of the risk-off wave, alongside a sell-off in crypto-linked stocks.
However, once the White House signaled possible pauses, crypto rebounded. By May, after the US and China agreed to a temporary tariff truce, Bitcoin climbed back above $100,000, while ETH jumped sharply.
Digital asset funds also saw fresh inflows during the relief phase.
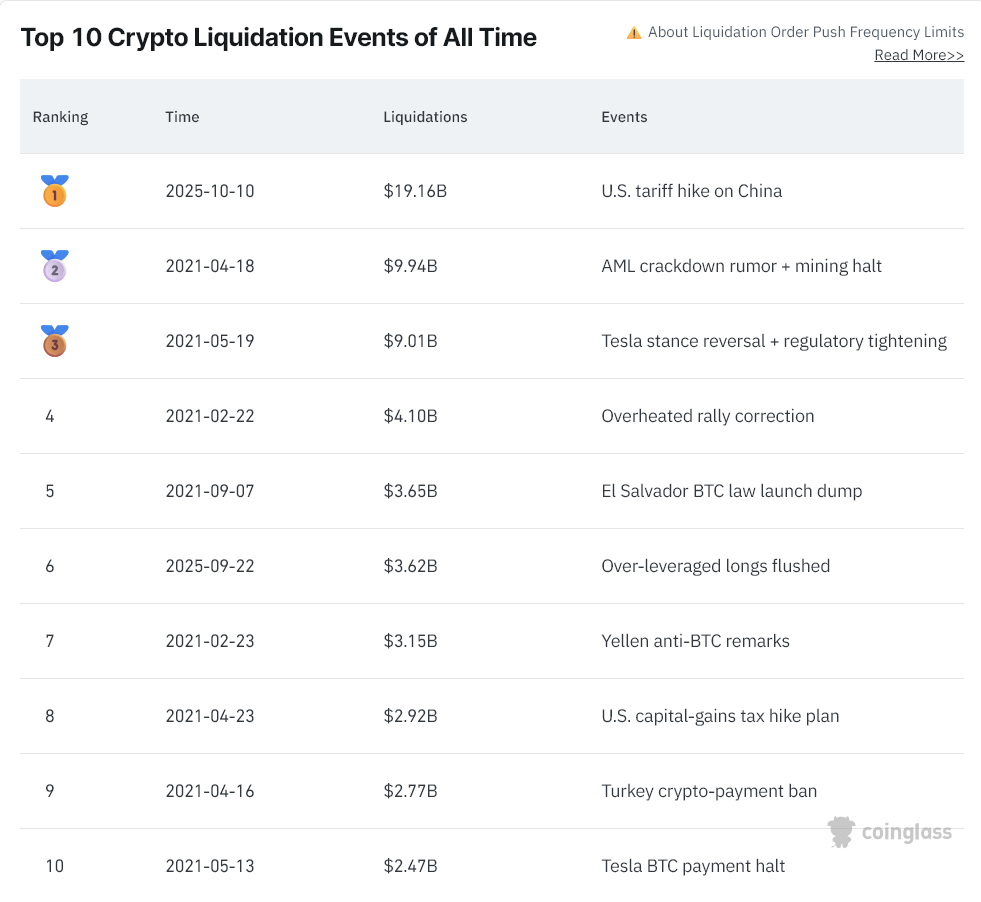
The sharpest stress test arrived in October. After Trump floated a new 100% tariff on Chinese imports tied to rare-earth tensions, Bitcoin dropped over 16% in a fast move.
Liquidations surged, with reports of $19 billion wiped out in forced closes across exchanges in a single day. As of December 2025, the market still hasn’t recovered from this liquidation shock.
Biggest Crypto Liquidation Events in History. Source: Coinglass
1. The Deferred 100% China Tariff Cliff
This tariff would add a new 100% duty on all Chinese imports, unless talks produce a deal. Trump announced it in October 2025 and later pushed it out, putting late 2026 in focus.
If Trump reactivates it, markets will price weaker growth and stickier inflation. That combo can hit Bitcoin by tightening financial conditions, pushing traders out of leverage, and dragging risk assets lower in sync.
2. A Higher Global Baseline Tariff
The US president previously hinted at a potential increase in the across-the-board import tariff beyond the 10% baseline imposed in 2025. Trump also campaigned on a much higher universal rate, which keeps this risk alive.
A baseline hike would not be a one-day headline. It would act as persistent pressure on risk appetite.
For Bitcoin, that usually means choppier rallies, thinner dips getting bought, and higher sensitivity to rate expectations.
4/ Trump’s baseline 10% tariff—and 55% for China—is forcing global companies to choose:
🇺🇸 Make it here, sell it here, create jobs here 🇨🇳 Or face steep penalties
3. Digital Services Tax Retaliation Tariffs on Europe
These would be new tariffs targeting countries that impose digital services taxes or similar rules on US tech firms. Trump warned in 2025 that countries keeping these taxes could face “substantial” tariffs.
If the US hits EU or UK exports, global equities can reprice lower. Crypto tends to follow that risk-off tape first.
Senior Counselor Peter Navarro explains @POTUS' memo to revive investigations aimed at imposing tariffs on countries that slap 'digital service taxes' on U.S. tech companies:
"As soon as these countries remove their DSTs on American companies, the tariffs will go away." pic.twitter.com/XHkV4TcjvS
4. Pharmaceutical Tariffs that Could Rise Toward 200%
This tariff targets imported branded or patented drugs, with penalties for firms that do not shift manufacturing to the US Trump signaled very high rates in 2025 and positioned the policy as an industrial reshoring tool.
If rates climb toward 200% in 2026, investors may treat it as an inflation impulse. Bitcoin can attract “hedge” talk during inflation scares, but trading often moves the other way first: risk assets sell as liquidity tightens.
President Donald Trump announces deals with nine pharmaceutical companies, the latest in a series of pacts designed to lower drug prices for some Americans in exchange for a three-year reprieve from threatened tariffs on their products https://t.co/Agi22RLMSGpic.twitter.com/Q1HTaekn0J
5. Expanded Secondary Tariffs Tied to Sanctioned Trade
Secondary tariffs would punish countries for buying oil or goods from US adversaries, even if those countries are not the direct target. Trump introduced the concept in 2025 and applied it in a high-profile way.
If Trump expands this tool in 2026, it can pull more countries into tariff crossfire and raise global uncertainty.
For Bitcoin, the biggest channel is volatility. More uncertainty usually means wider swings, more forced selling, and slower recoveries unless liquidity improves.
Bitcoin and the broader crypto market enter the New Year under renewed pressure after the Federal Open Market Committee released its December meeting minutes.
The FOMC minutes make it very clear that there’s little urgency to cut interest rates again in early 2026.
Higher-for-Longer Rates Weigh on Crypto Sentiment
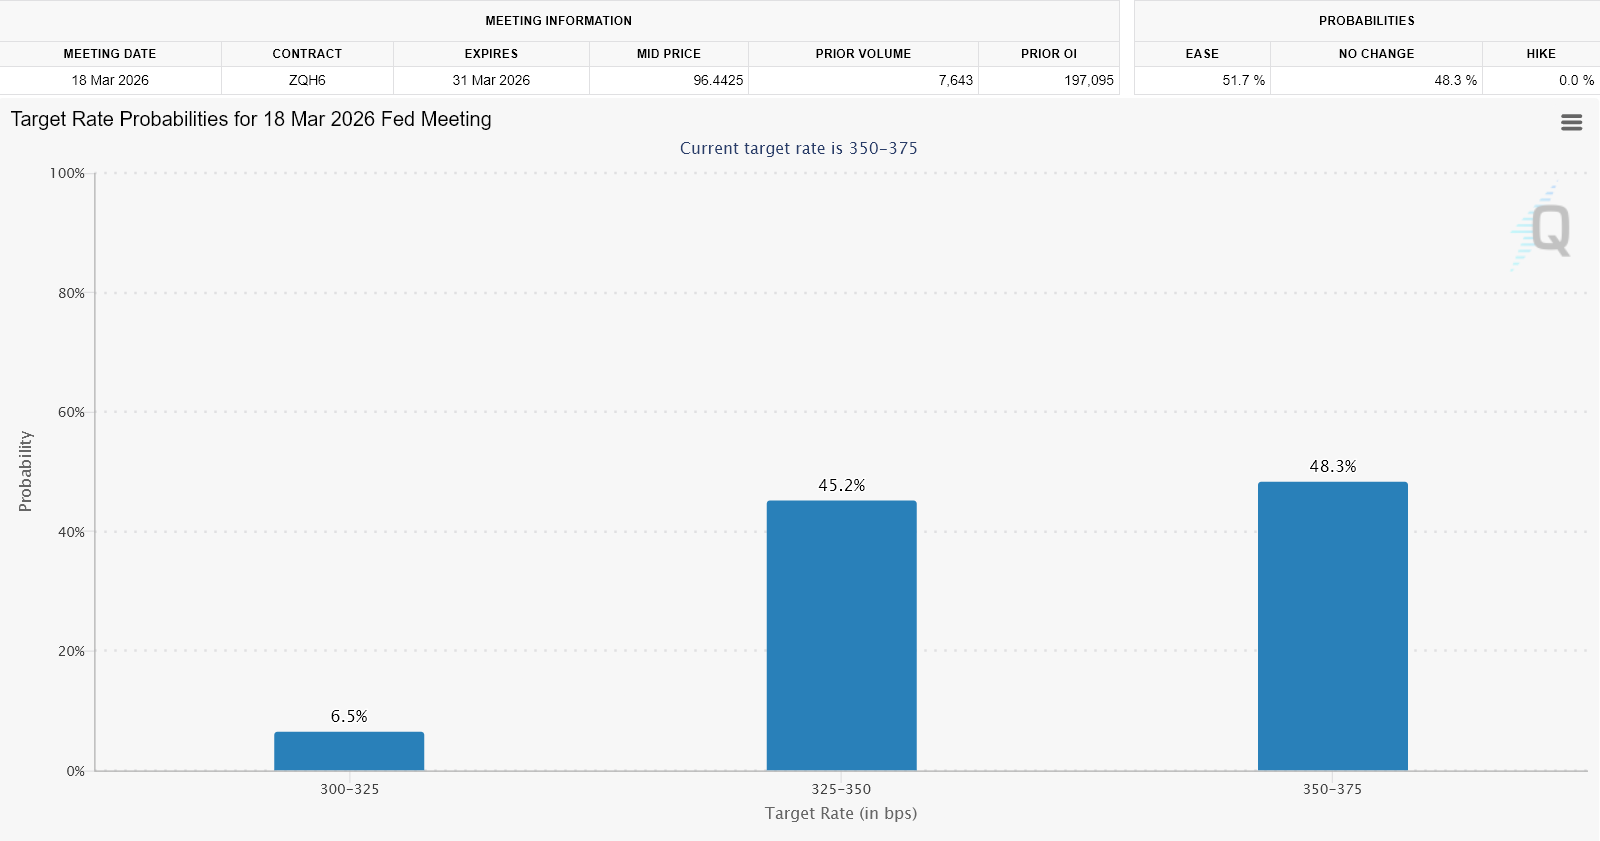
The minutes, published December 30, suggest policymakers favor a pause following December’s 25-basis-point cut, pushing expectations for the next reduction toward March at the earliest.
Markets had already priced out a January move, but the language reinforced that view. The FOMC minutes even shadowed rate cut hopes for March 2026.
So, the clear earliest interest rate cut could come in April.
Market Largely Expects No Interest Rate Cut in March 2026. Source: CME FedWatch
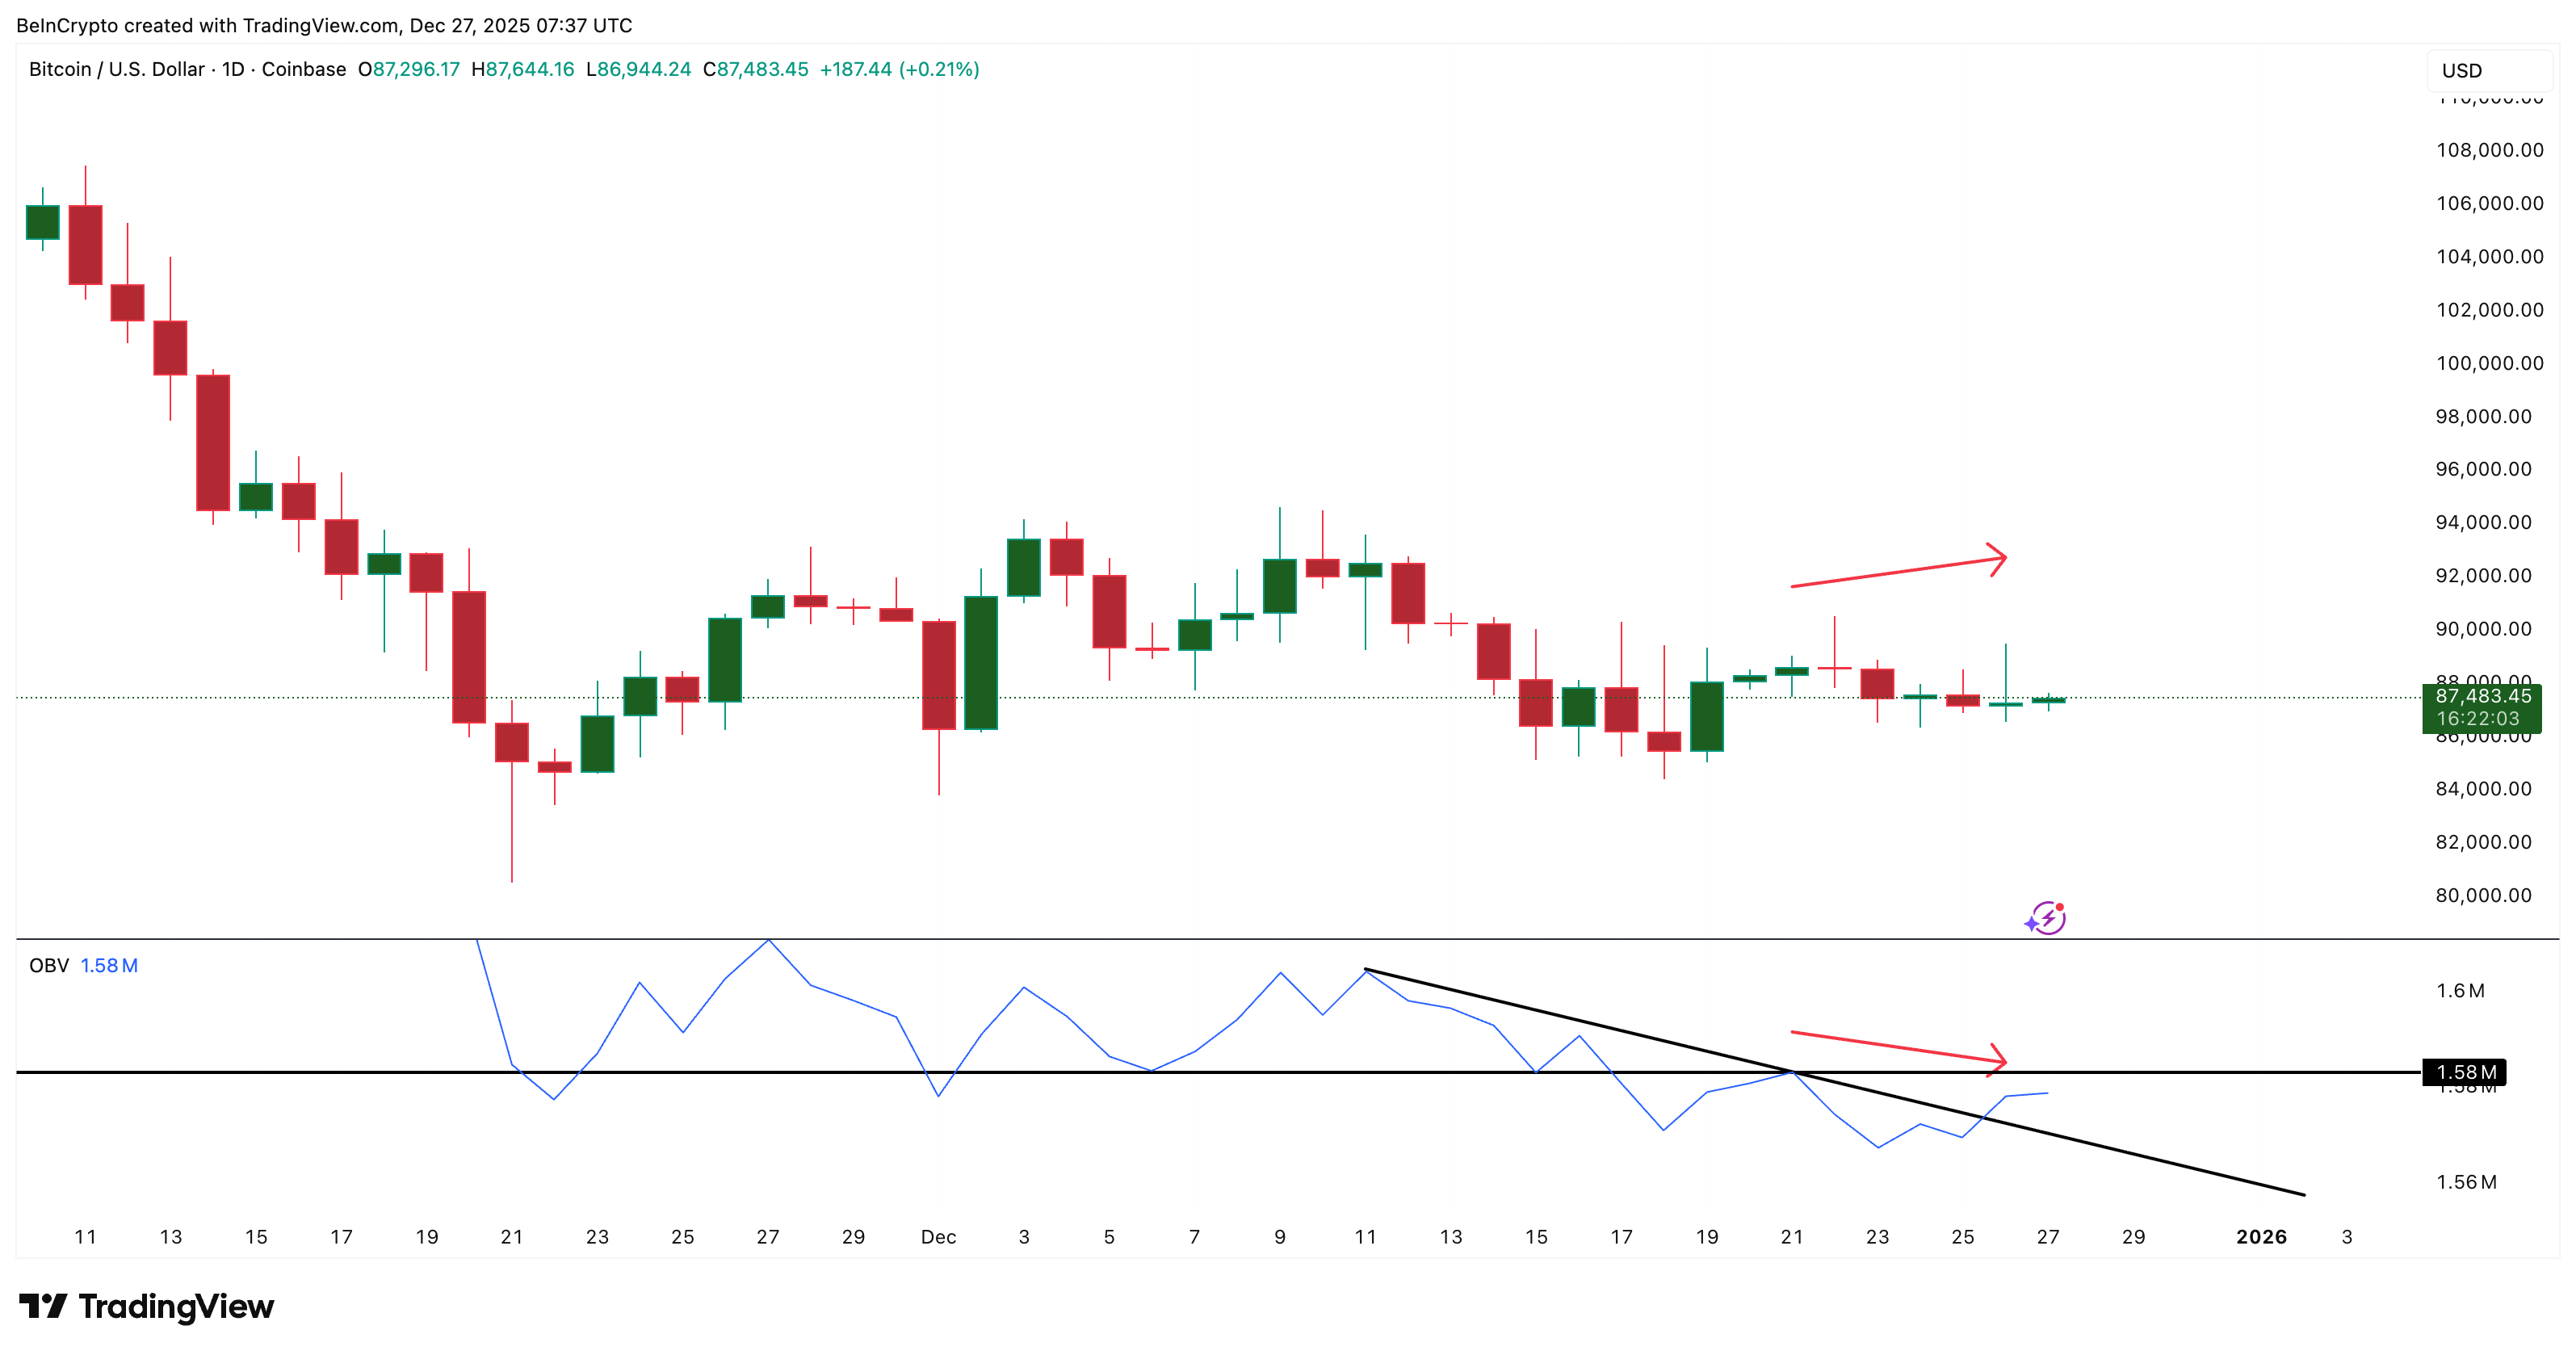
Bitcoin has traded in a tight range between roughly $85,000 and $90,000 in recent weeks.
Price action remains fragile after failing to reclaim higher resistance levels, while sentiment indicators point to caution rather than conviction.
Overall, daily crypto trading volumes remain thin. Risk appetite has yet to recover meaningfully after December’s pullback.
According to the minutes, several officials argued it would be “appropriate to keep the target range unchanged for some time” to assess the lagged effects of recent easing.
Others described the December cut as “finely balanced,” underscoring limited appetite for follow-up action without clearer inflation progress.
Inflation remains the central constraint. Policymakers acknowledged price pressures “had not moved closer to the 2 percent objective over the past year,” even as labor market conditions softened.
FOMC minutes summary:
Most participants supported a 25 bp cut to a 3.50%–3.75% fed funds range (9–3 vote), saying the balance of risks shifted as “downside risks to employment rose” even while inflation “remains somewhat elevated.”
FOMC cited Tariffs as a key driver behind stubborn goods inflation, while services inflation showed gradual improvement.
At the same time, the Fed flagged rising downside risks to employment. Officials noted slowing hiring, muted business plans, and growing concern among lower-income households.
Still, most participants preferred to wait for additional data before adjusting policy again.
For crypto markets, the message is straightforward. With real yields elevated and liquidity conditions tight, near-term upside catalysts remain scarce.
Bitcoin’s recent consolidation reflects that tension, as investors balance expectations for eventual easing against the reality of higher-for-longer rates.
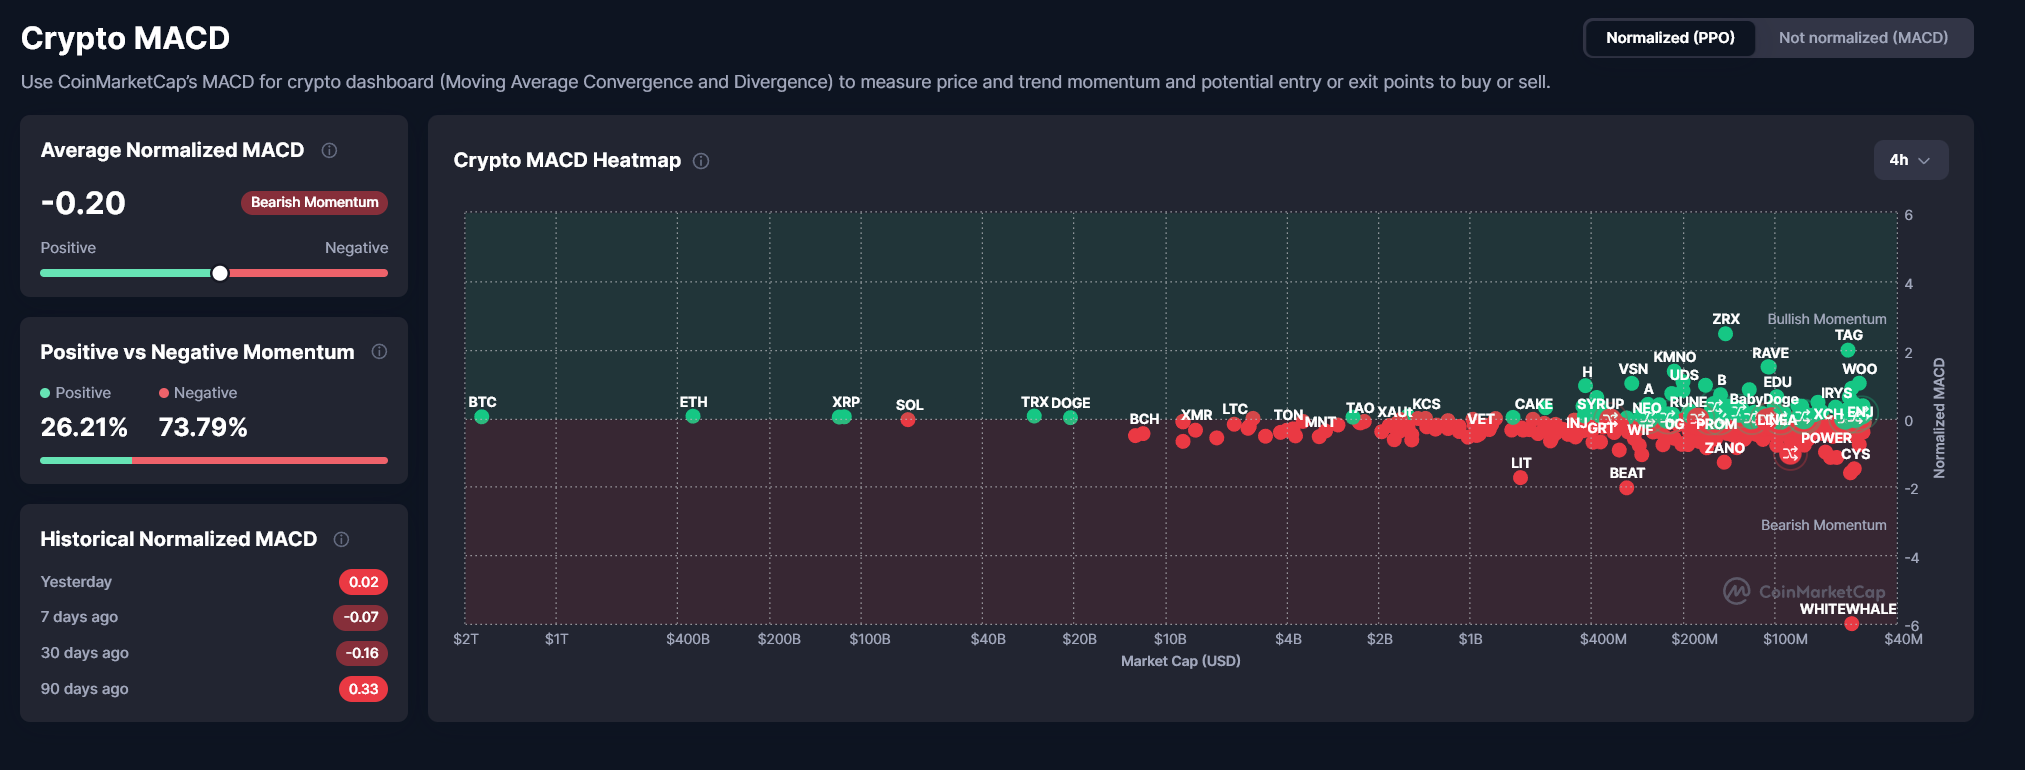
Crypto Market Activity at Large Shows Bearish Momentum. Source: CoinMarketCap
Looking ahead, March now emerges as the first realistic window for another cut, assuming inflation cools and labor conditions weaken further.
Until then, crypto markets may struggle to regain momentum. Prices are likely to remain vulnerable to further downside if macroeconomic data disappoints early in 2026.
Pi Coin has struggled to gain meaningful traction, reflecting weak conviction among investors. The altcoin endured a difficult 2025, marked by persistent selling pressure and limited recovery attempts.
Despite brief rebounds, sentiment remains fragile. As Pi Coin enters 2026, expectations of a sustained recovery remain uncertain amid inconsistent demand signals.
Pi Coin Has Not Performed Exceptionally
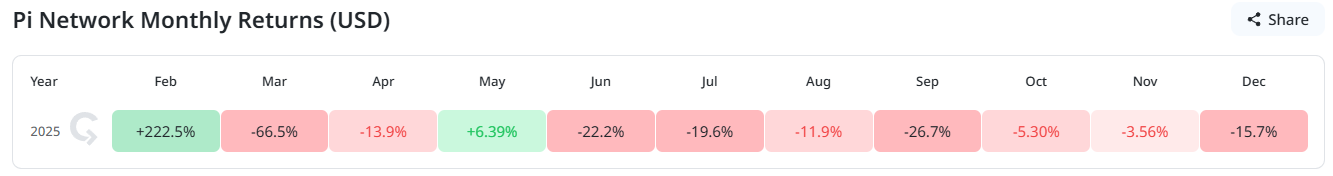
Monthly return data paints a challenging picture for Pi Coin’s first year. Since launching in February, the token has recorded losses in most months. Only two periods delivered positive returns, highlighting the asset’s inability to sustain momentum.
The steepest decline occurred shortly after launch. In March, Pi Coin fell 66.5%, erasing early optimism around the mobile mining network. This sharp drawdown set a negative tone that has persisted. Historically weak monthly performance suggests downside risks continue to outweigh upside expectations.
Want more token insights like this? Sign up for Editor Harsh Notariya’s Daily Crypto Newsletter here.
However, February 2026 could offer a short-term catalyst. The altcoin will mark its first anniversary, a milestone that often draws renewed attention. Speculative interest around anniversaries has previously driven temporary rallies across emerging crypto assets.
Investors Lost Their Confidence Early On
Capital flow indicators further explain Pi Coin’s prolonged weakness. Over the past year, the asset has oscillated between inflows and outflows without establishing a clear trend. This indecision among investors has constrained price recovery attempts.
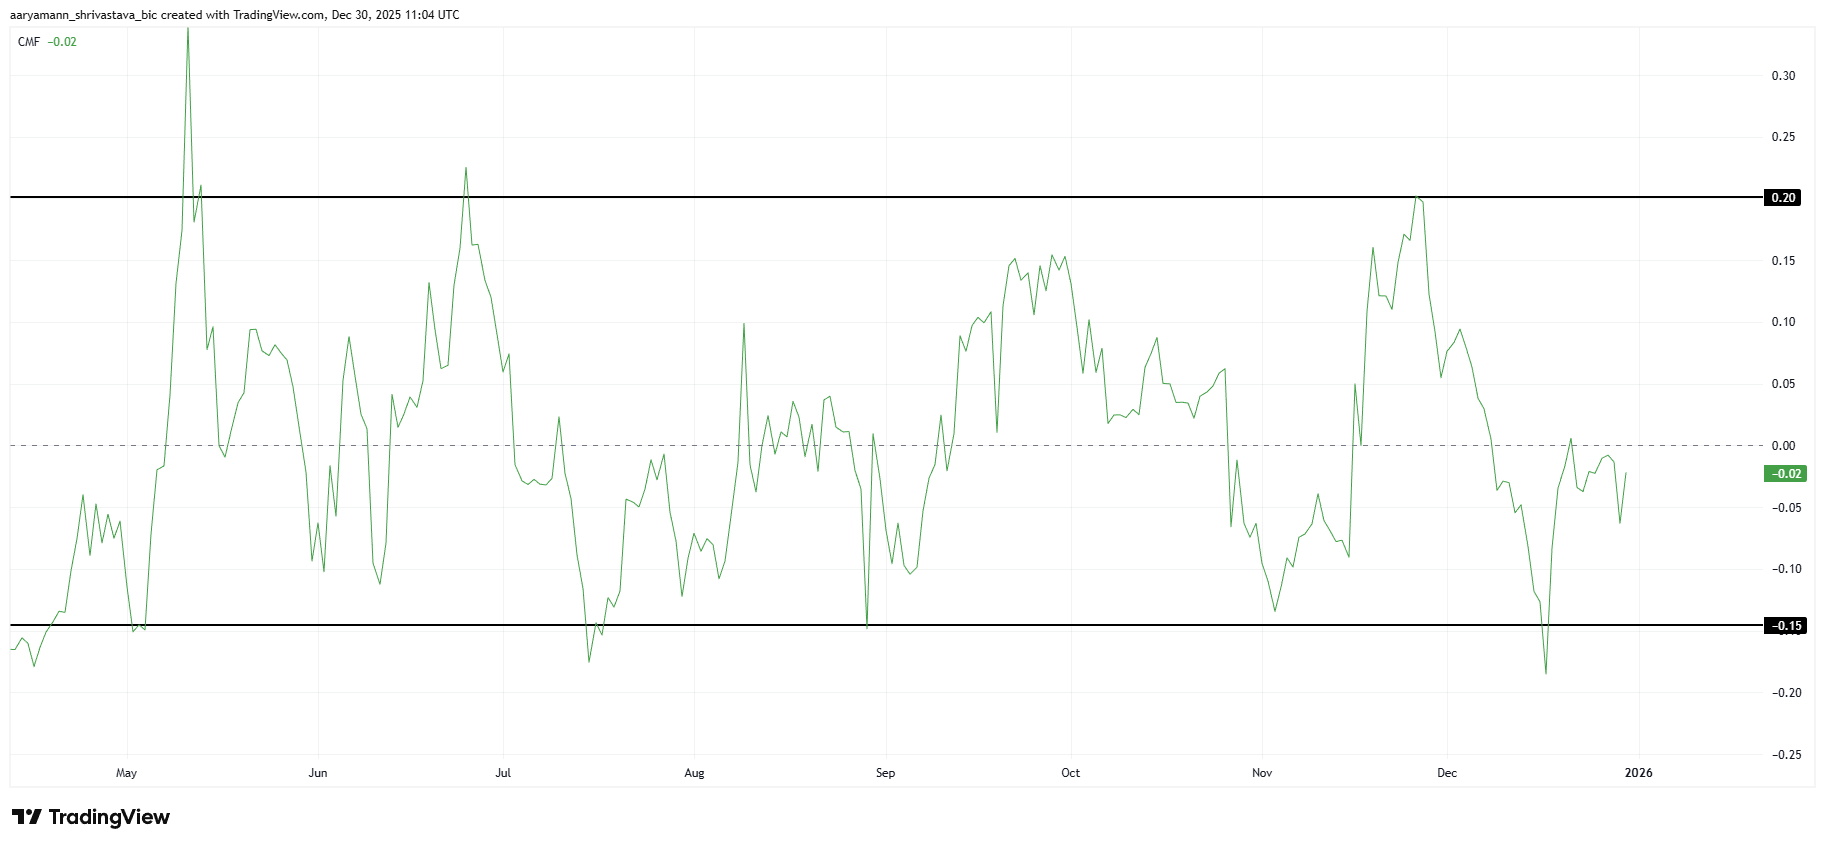
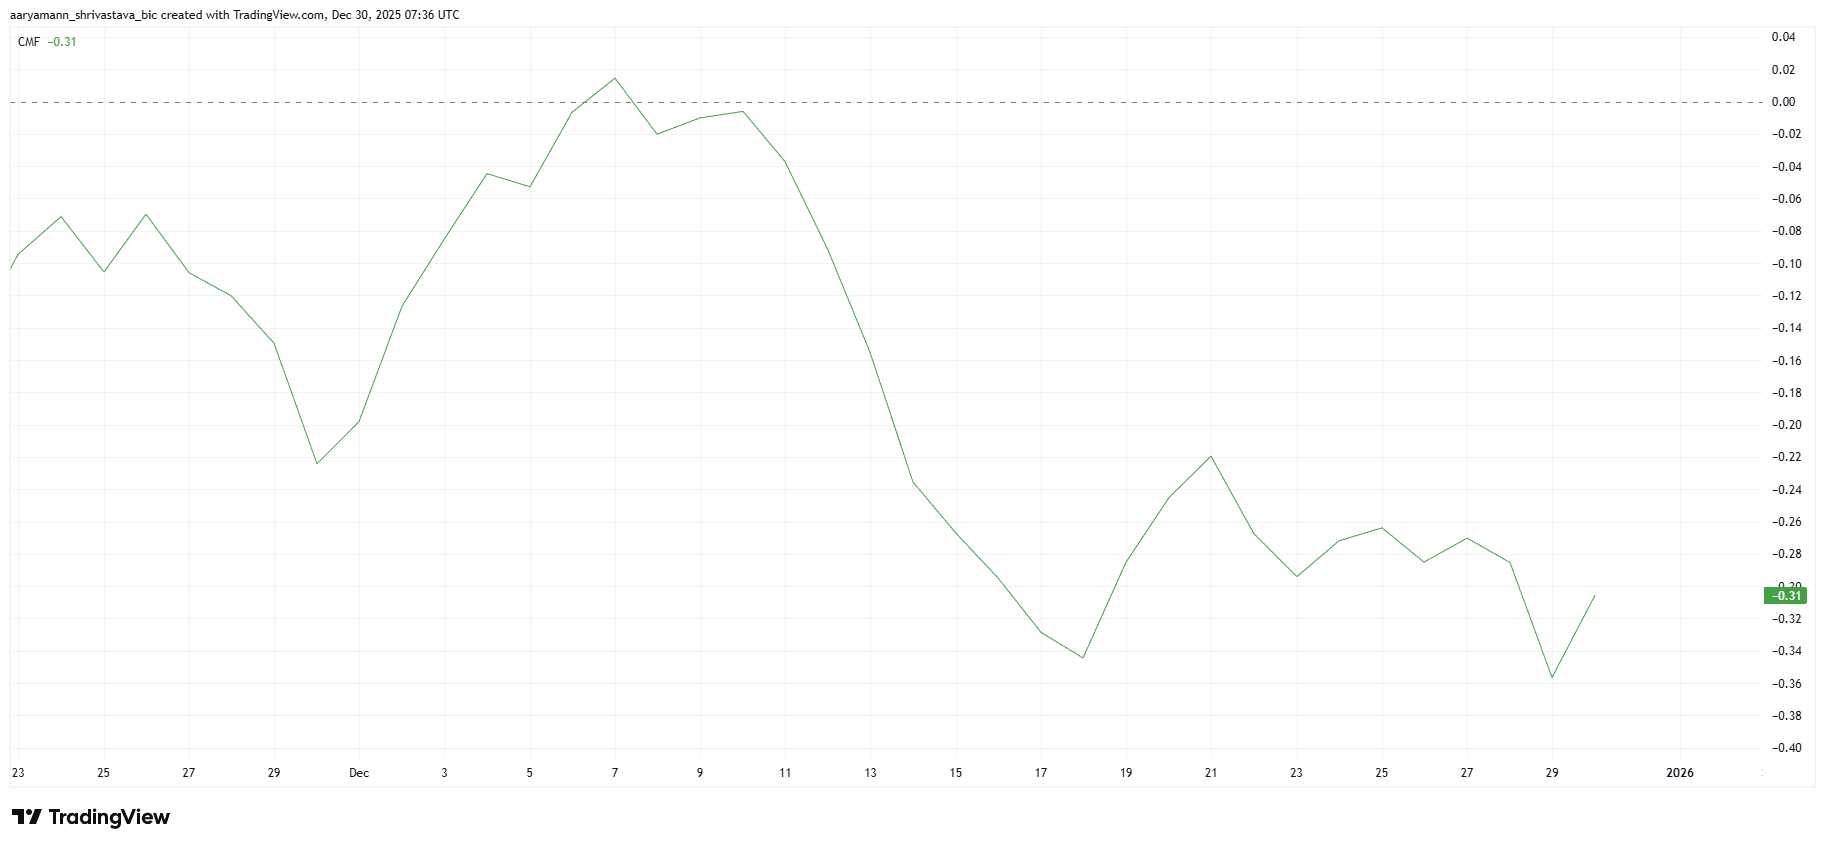
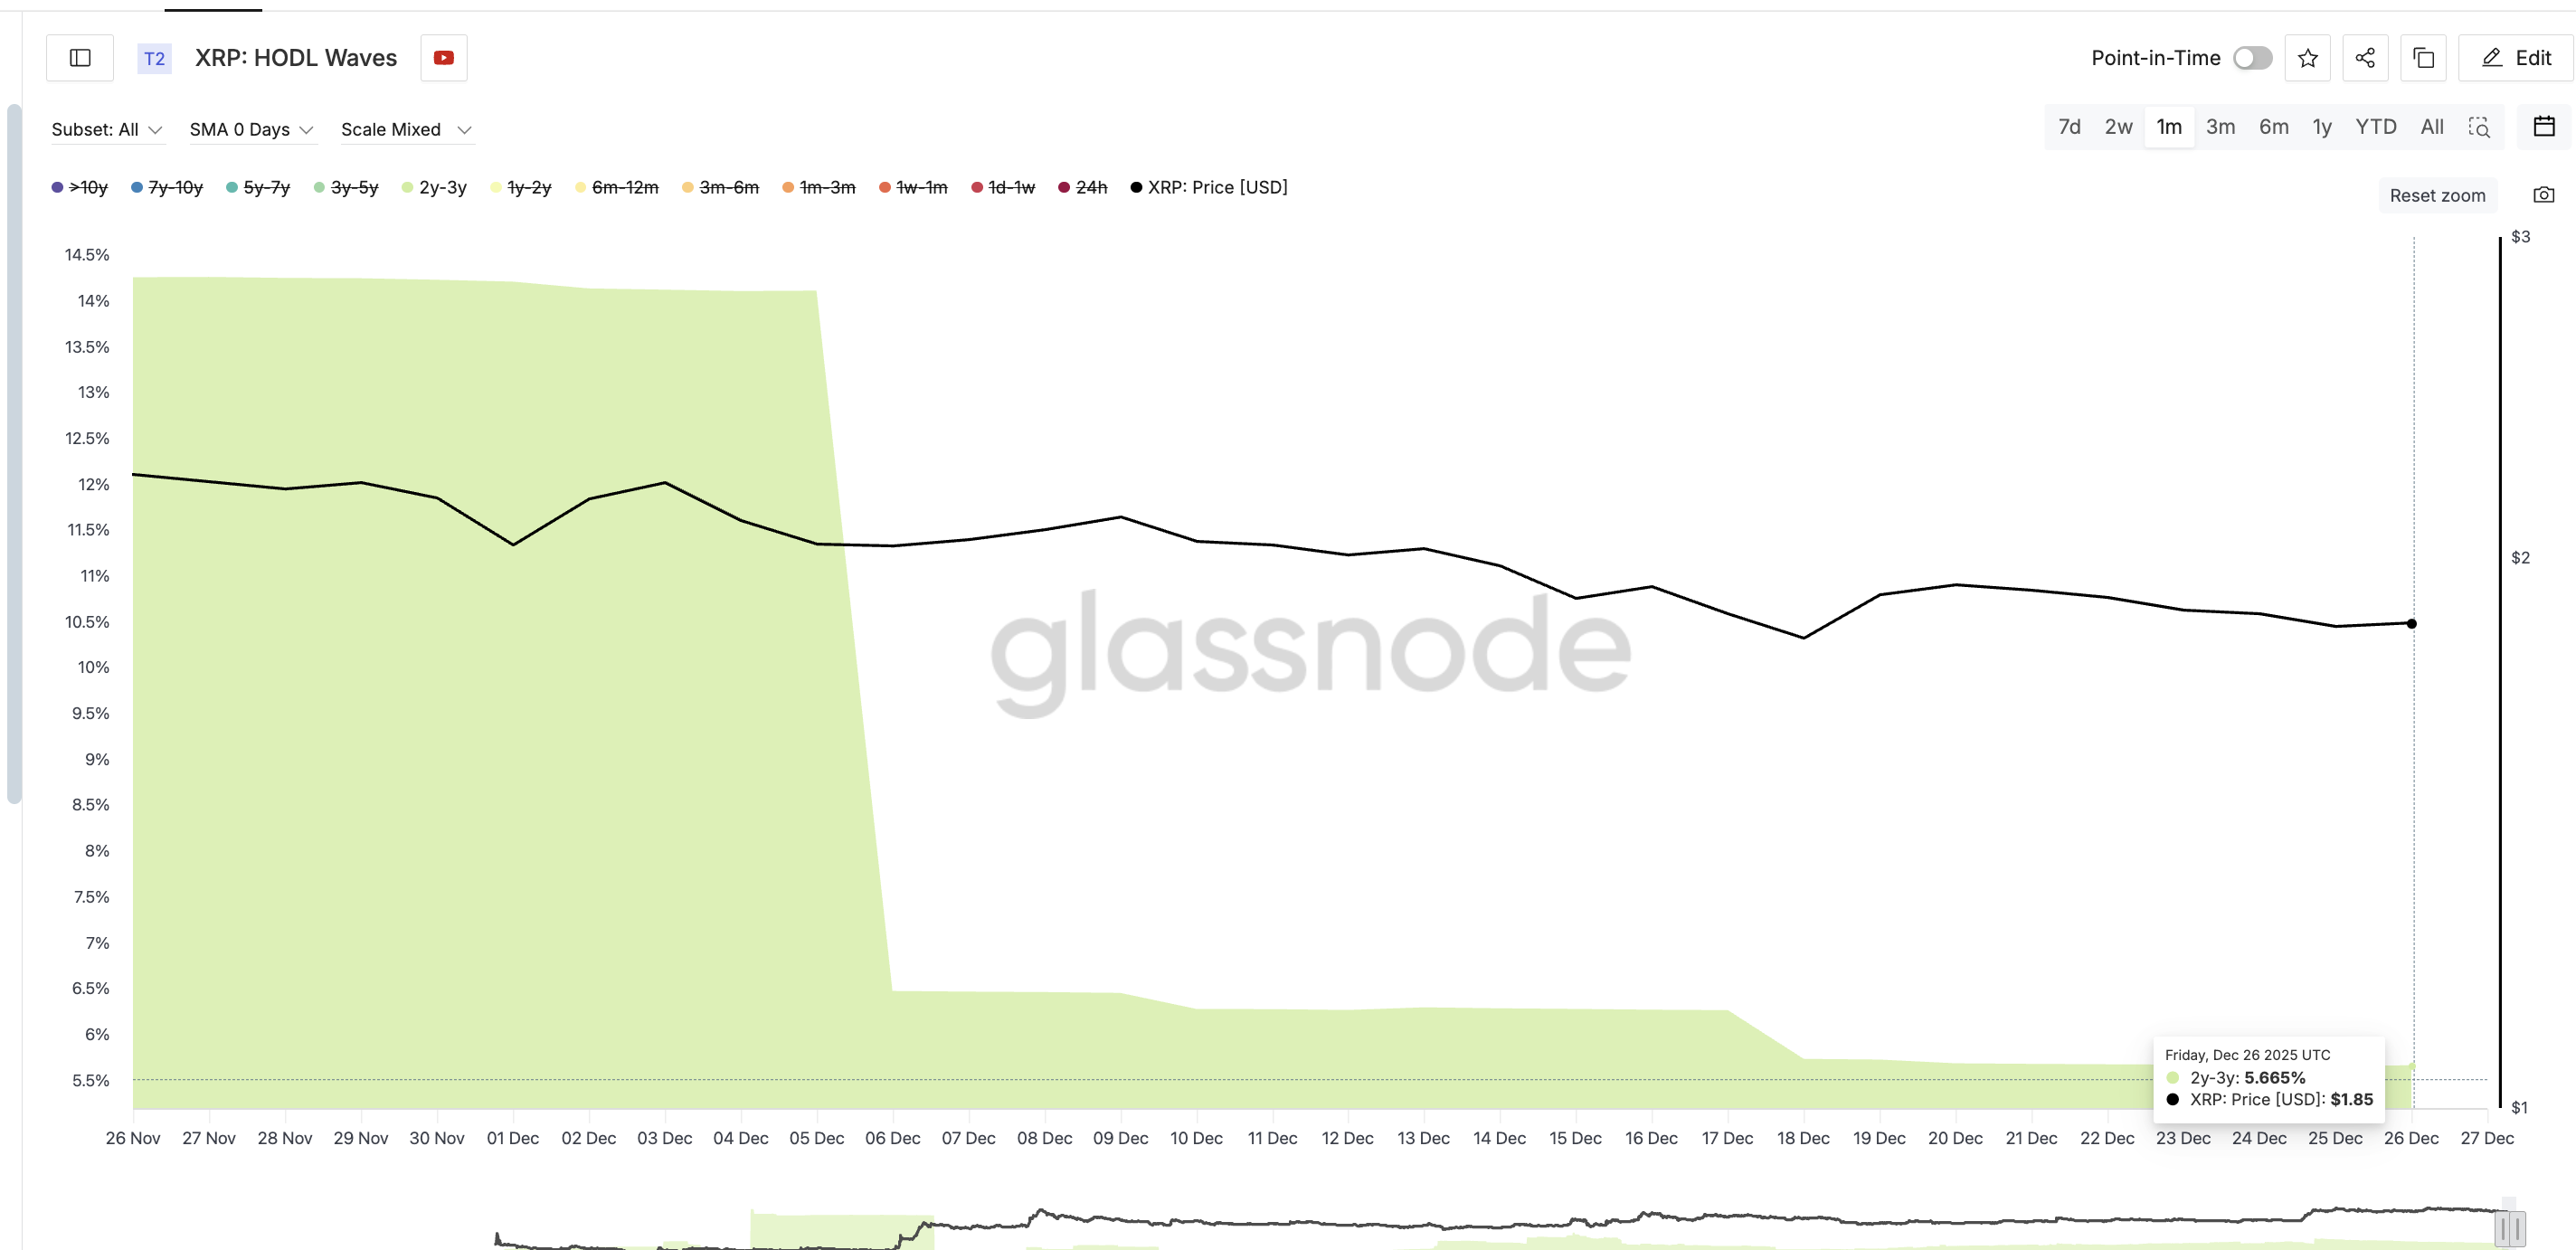
The Chaikin Money Flow highlights persistent selling dominance. Since launch, CMF has reached the oversold threshold of -0.15 on five occasions. By contrast, it has only touched the overbought level of 0.20 three times, signaling stronger selling pressure.
Even if CMF rises above the zero line, recovery remains uncertain. Historically, meaningful trend reversals for Pi Coin have required CMF to exceed 0.20. Without that confirmation, rallies risk fading quickly amid renewed distribution.
What Does Pi Coin Need To Recover?
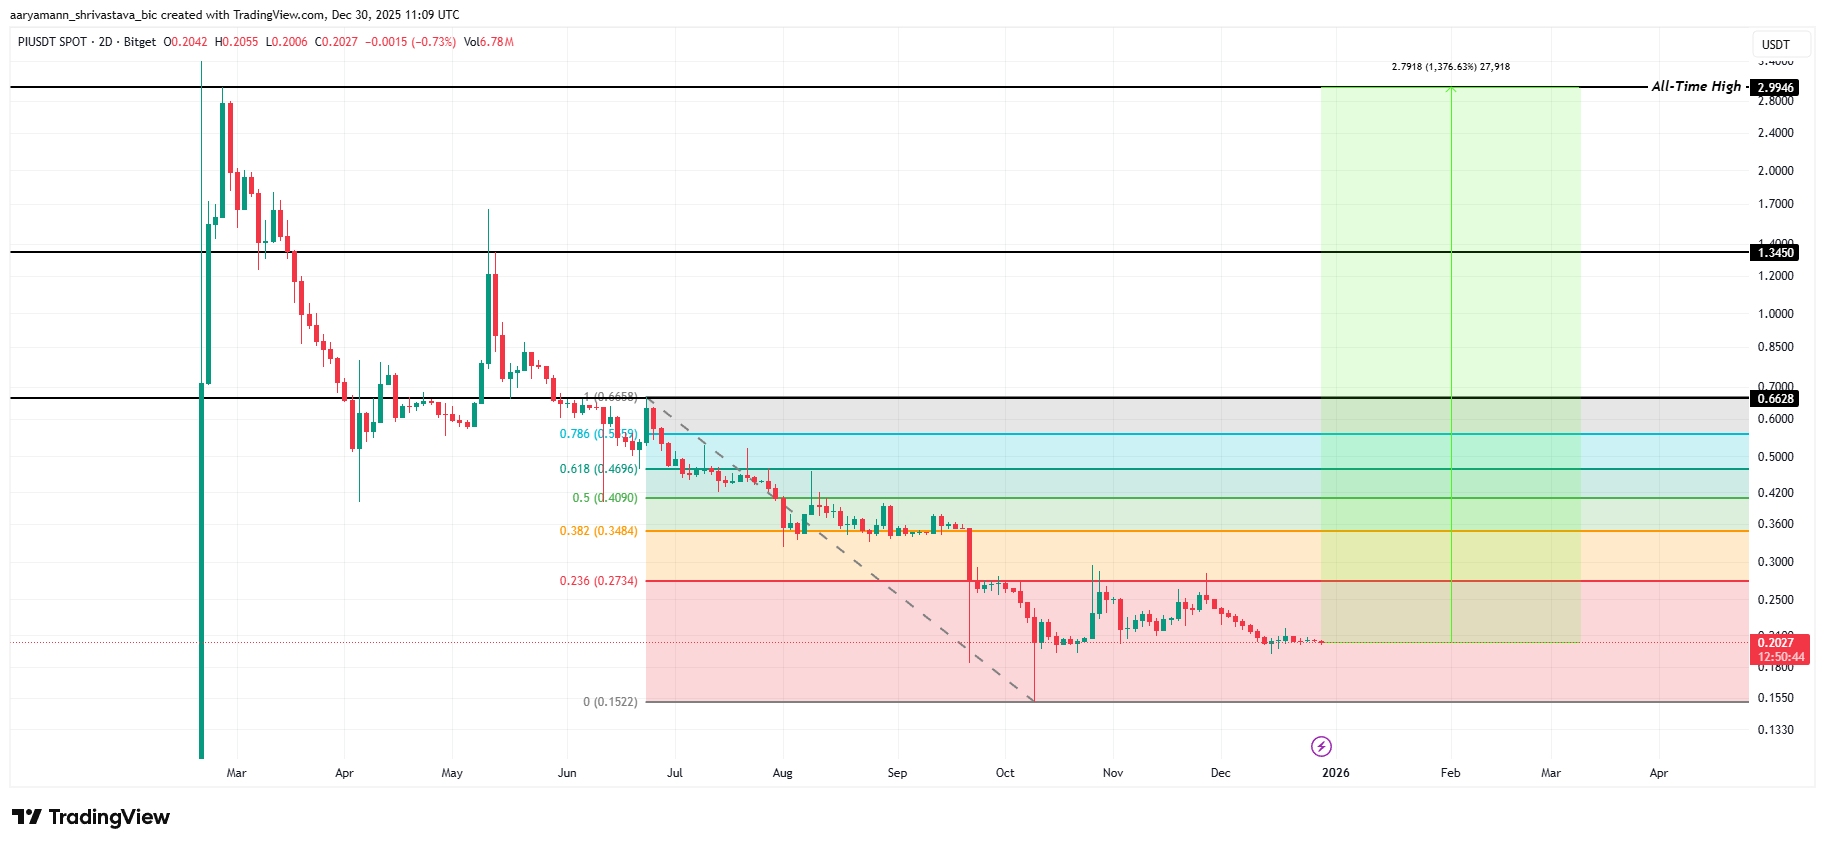
From a broader perspective, Pi Coin faces a steep climb to regain credibility. The altcoin must rise roughly 1,376% to revisit its all-time high of $2.994, set in early March. Such a move would require a significant shift in demand.
Initial recovery signals would emerge if Pi Coin flips the 23.6% Fibonacci Retracement level at $0.273 into support. This level represents the first technical threshold separating consolidation from early recovery.
Stronger confirmation remains distant. A sustained bullish structure would require reclaiming $0.662 as support. Until then, Pi Coin remains in a prolonged rebuilding phase with limited upside conviction.
PI Price May Not See Much Growth
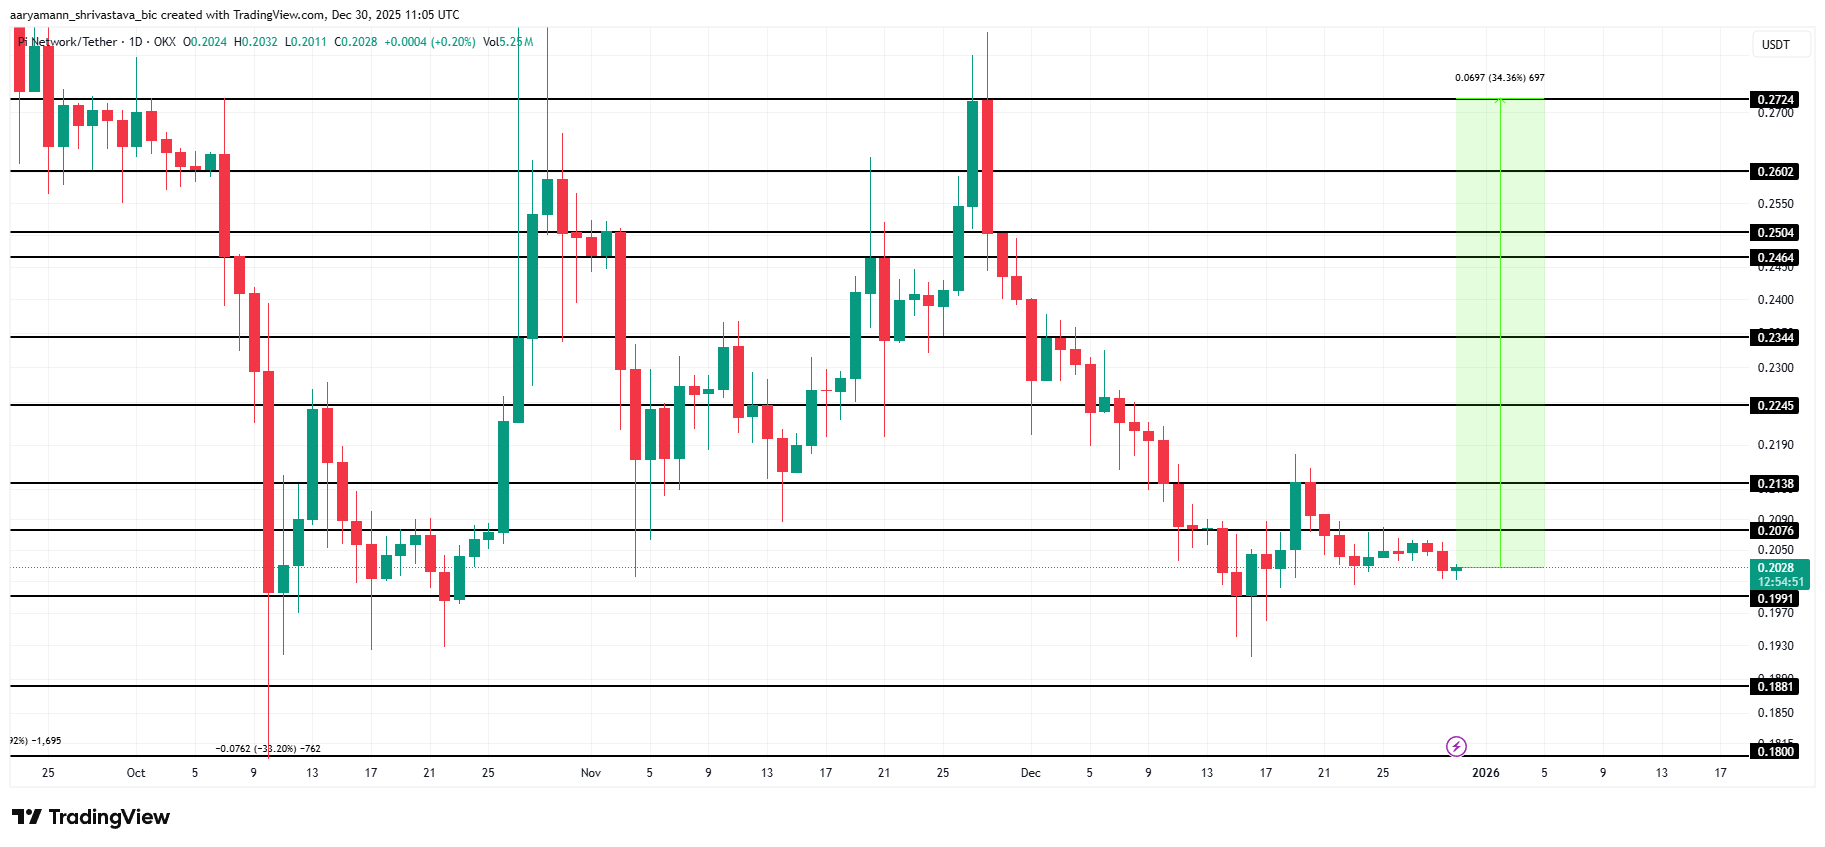
In the short term, Pi Coin shows tentative strength. The token holds above the critical $0.199 support level. This floor has been tested three times without a daily close below, suggesting buyers are defending this zone.
Maintaining this support keeps the short-term momentum constructive. As long as $0.199 holds, downside risks remain contained. This behavior supports a cautiously bullish outlook over the coming weeks.
To offset December’s losses, Pi Coin requires a 34% rally. Such a move would lift the price toward $0.272. In the near term, reclaiming $0.224 and $0.246 as support levels remains the primary objective.
Achieving these targets would indicate improving sentiment. Gradually higher lows could attract speculative interest, especially if broader market conditions stabilize. Still, volume confirmation remains essential for sustainability.
Downside risks persist if investor confidence deteriorates. A breakdown below $0.199 would invalidate the bullish thesis. Under that scenario, Pi Coin could slide toward $0.188 or lower, accelerating losses amid panic-driven selling.
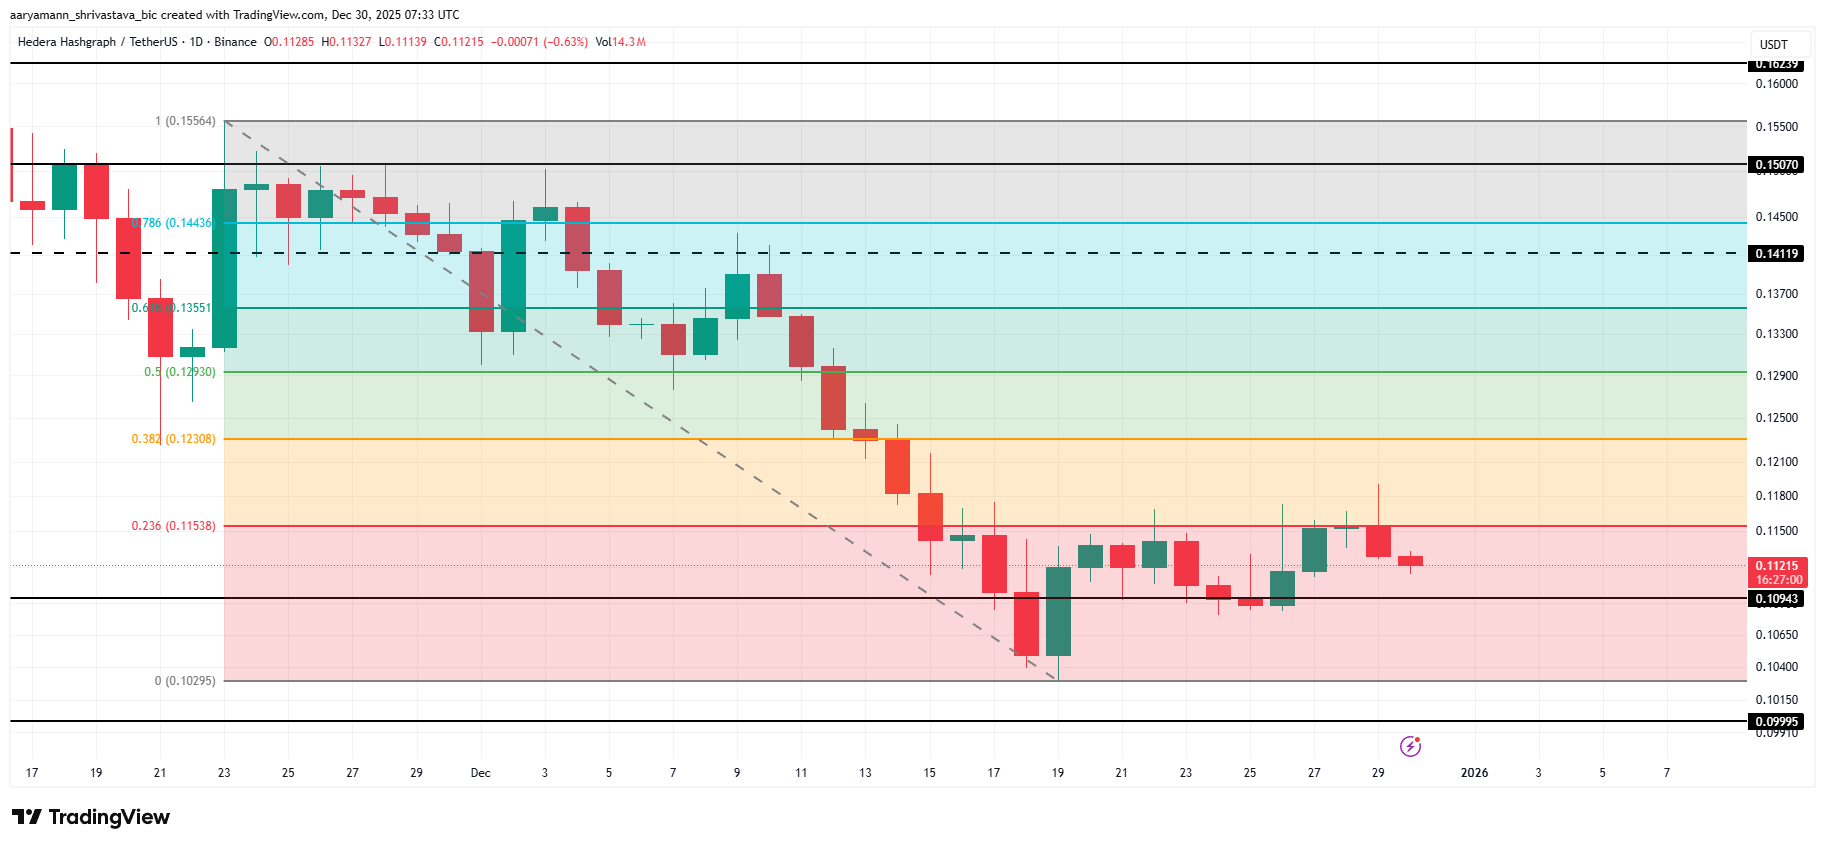
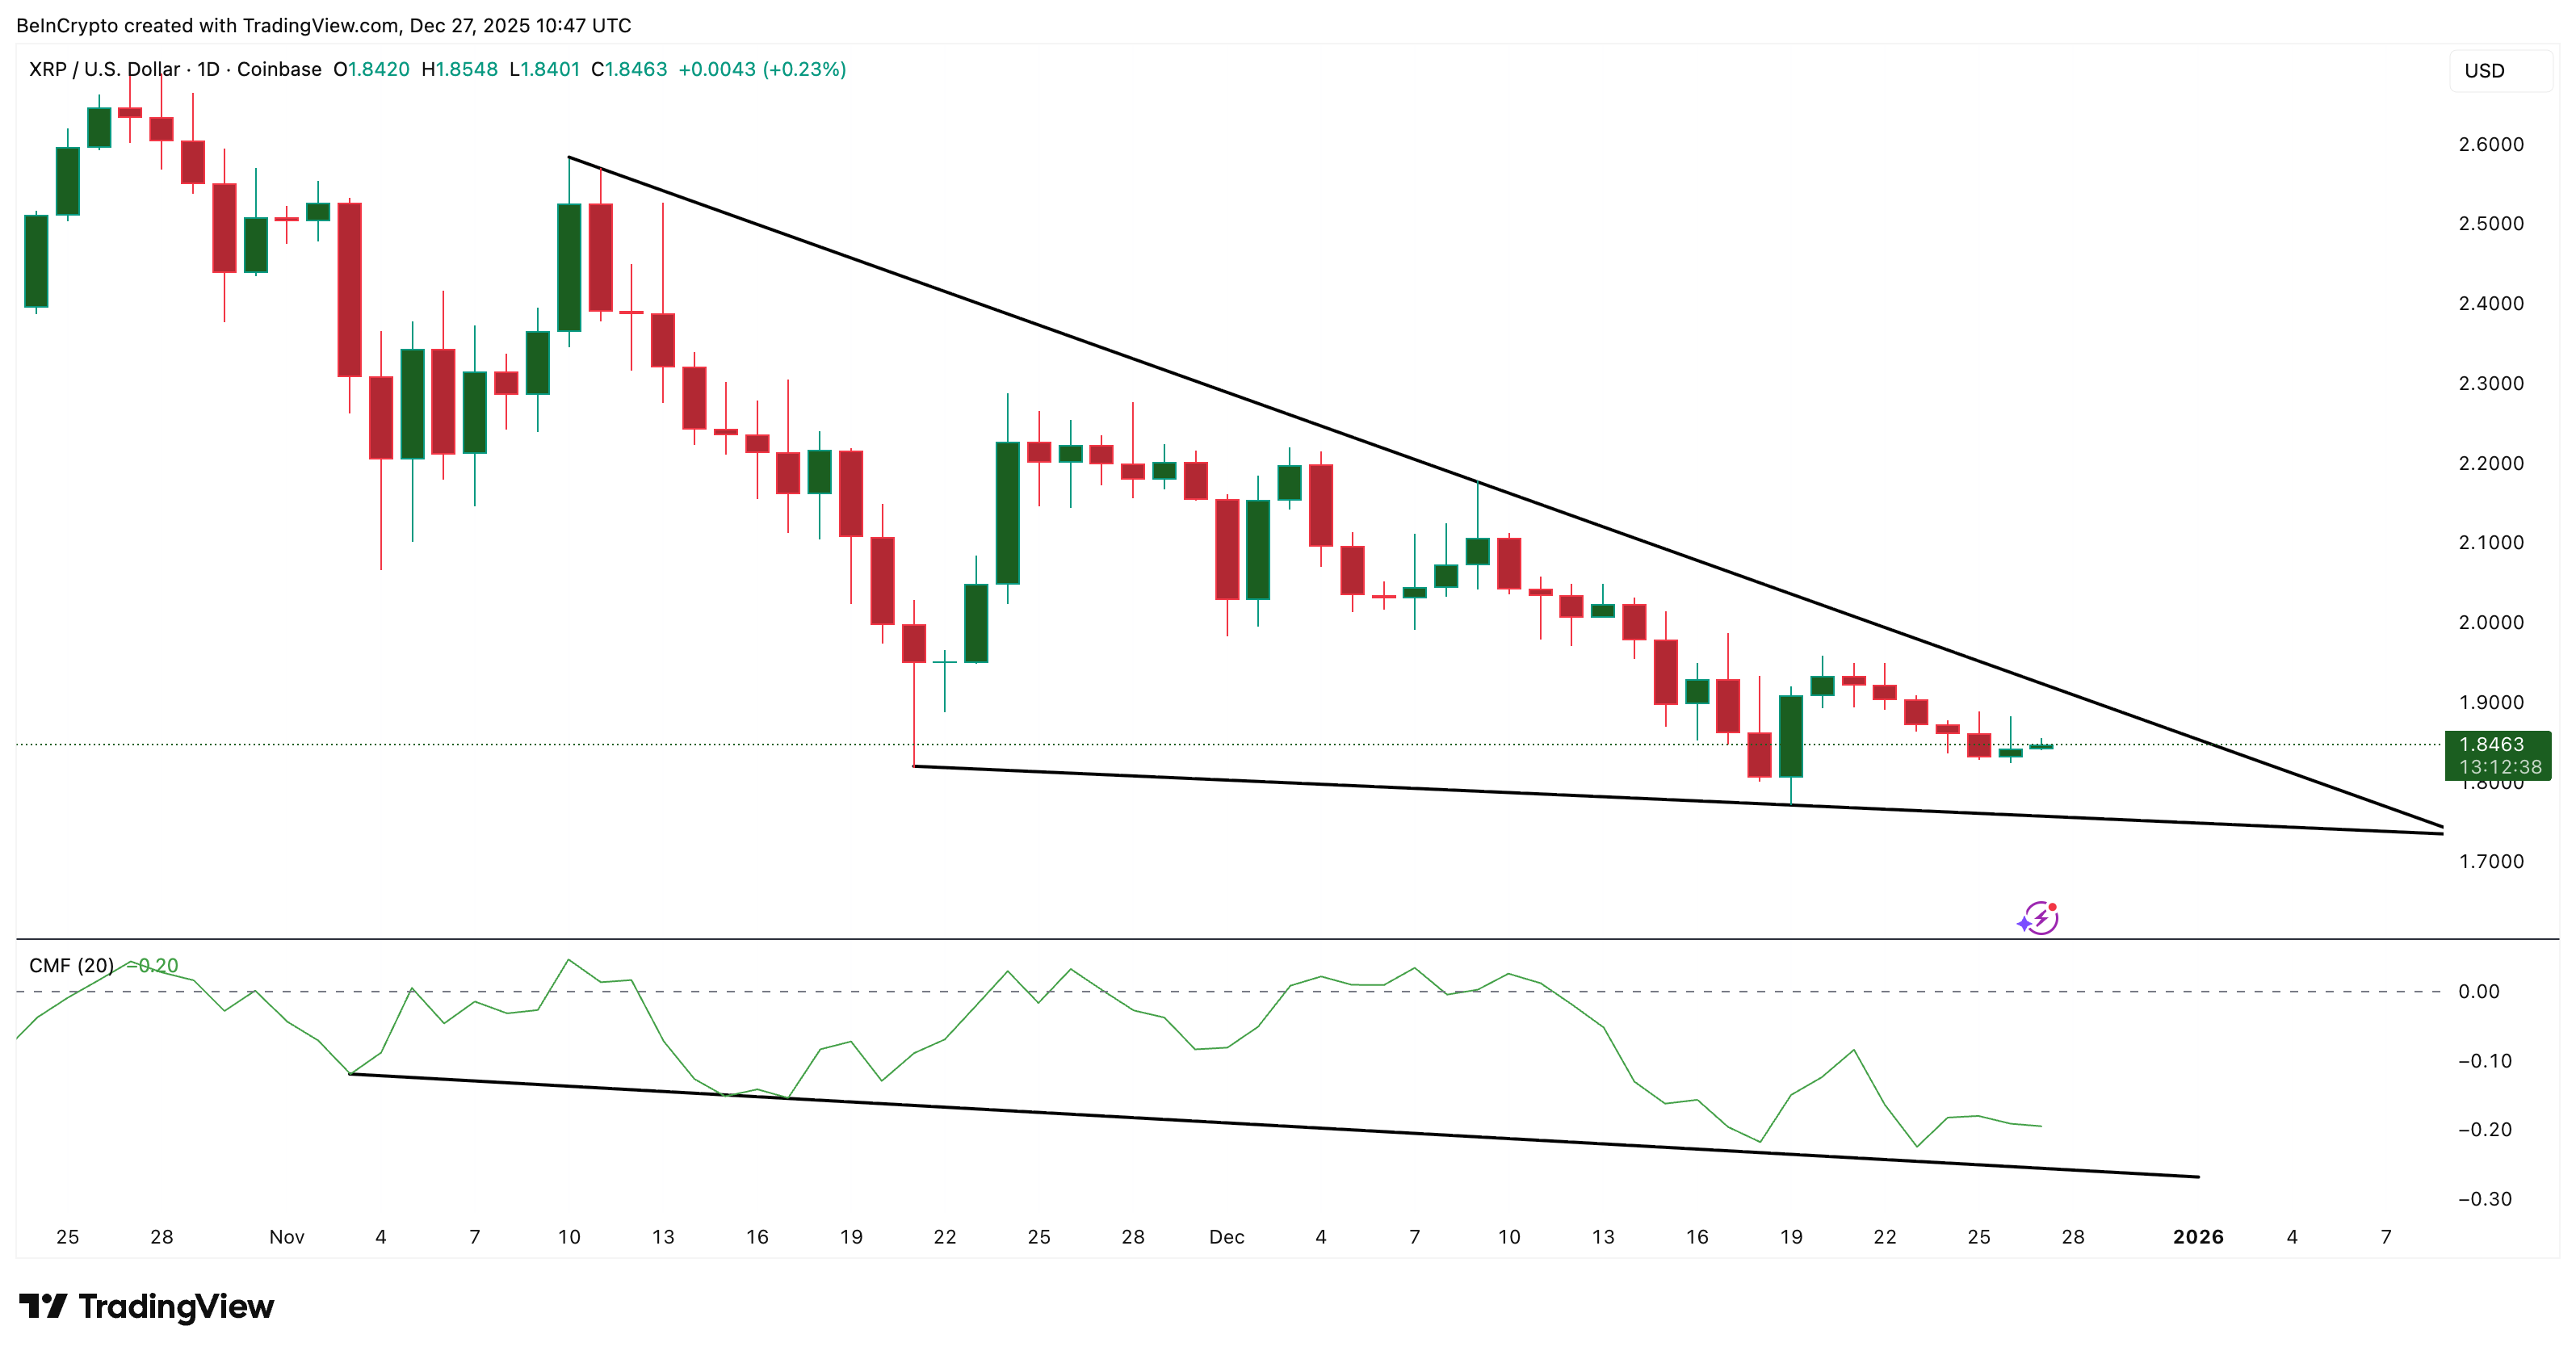
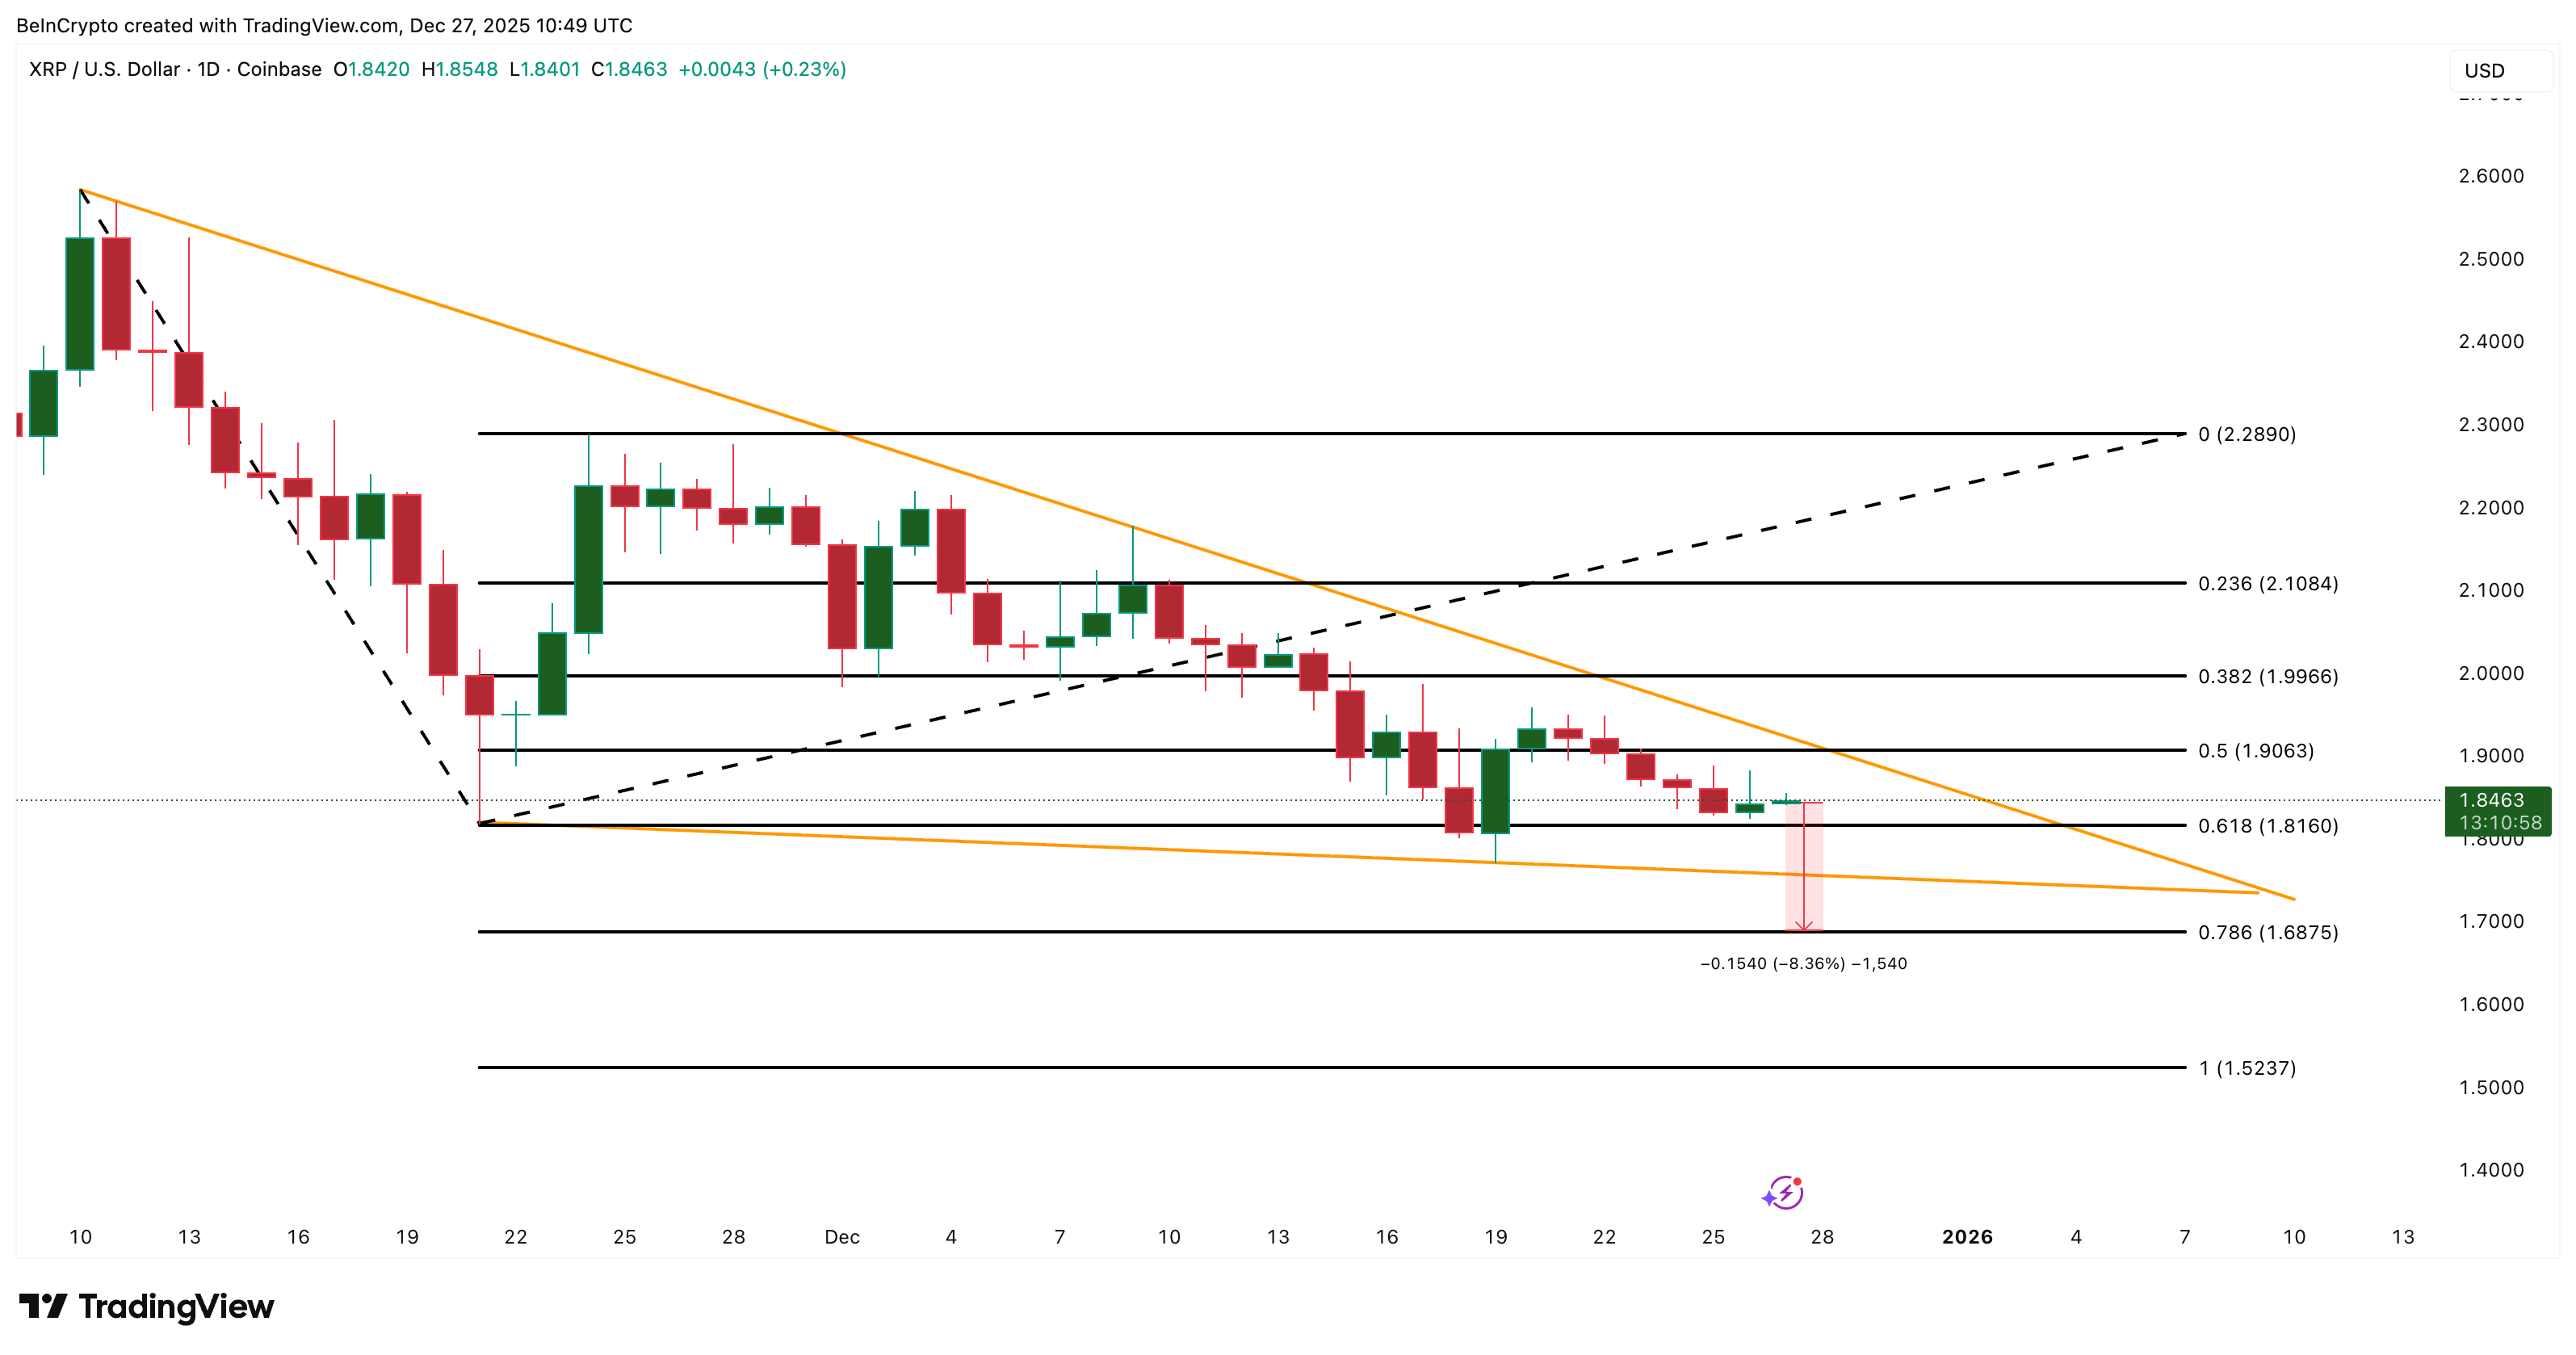
Hedera has attempted a modest recovery in recent sessions, yet HBAR remains capped below a key technical barrier. The altcoin continues to trade under the 23.6% Fibonacci Retracement level, limiting upside momentum.
While Hedera is preparing structural changes for 2026, investors remain focused on whether these developments can meaningfully influence HBAR price performance.
Hedera Hikes Its Service Fee
Hedera announced in July that it will increase its ConsensusSubmitMessage transaction fee by 800% starting January 2026. The fee will rise from $0.0001 to $0.0008. ConsensusSubmitMessage transactions allow users to submit data to the Hedera network for trusted timestamping and ordering.
🚨Important update for Hedera users🚨
📢 Starting Jan 2026, #Hedera’s ConsensusSubmitMessage price moves from $0.0001 → $0.0008 (USD fixed).
Why? ✔️ Long-term sustainability ✔️ Predictable pricing ✔️ Still one of the lowest-cost options in Web3
Despite the magnitude of the percentage increase, the absolute cost remains minimal. Industry participants have debated the precedent of higher network fees, yet the change is unlikely to materially affect demand. The fee adjustment primarily targets enterprise use cases and does not significantly alter the cost structure for most applications or users.
Hedera Holders Are More Bearish Than Bullish
Technical indicators reflect a cautious to bearish investor outlook. The Chaikin Money Flow, or CMF, remains well below the zero line, signaling sustained capital outflows from HBAR. This suggests that investors are reducing exposure rather than positioning for a recovery.
The absence of strong bullish macro signals has reinforced this trend. Risk appetite across altcoins remains muted, and HBAR has not attracted consistent inflows. Given current conditions, this bearish capital flow dynamic is likely to persist into 2026 unless broader sentiment improves materially.
Want more token insights like this? Sign up for Editor Harsh Notariya’s Daily Crypto Newsletter here.
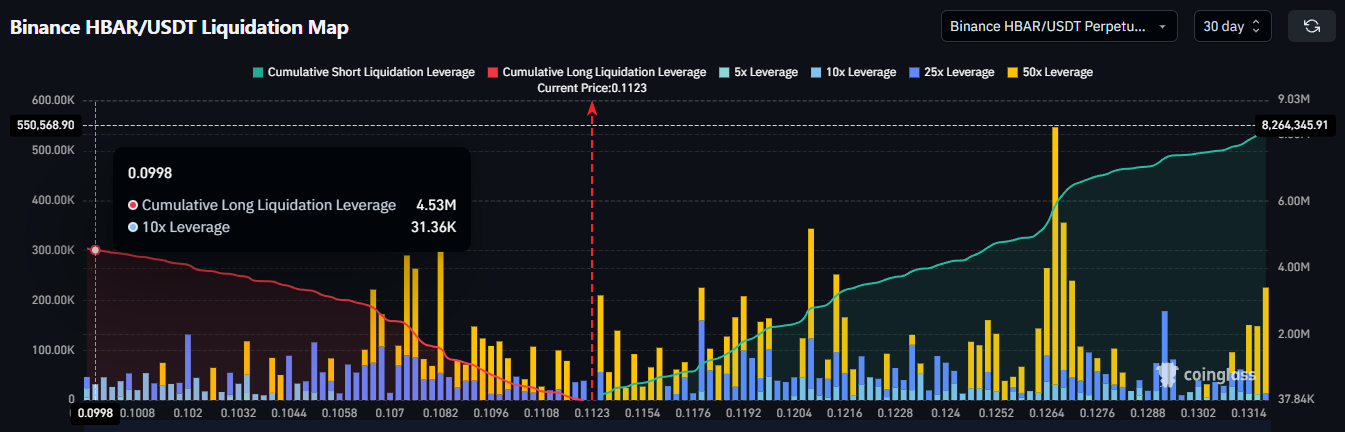
Derivatives data further highlights weak macro momentum. The liquidation map shows that traders are positioning for downside risk. Short exposure in HBAR currently stands near $8.21 million, while long exposure is significantly lower at approximately $4.5 million.
This imbalance indicates that bearish contracts dominate market positioning. Traders appear more confident in a potential price decline than a sustained rebound. Such skewed positioning often amplifies downside volatility, especially during periods of low liquidity or negative market catalysts.
HBAR Price Needs To Flip This Critical Level Into Support
HBAR trades at $0.112 at the time of writing, holding above the immediate $0.109 support level. However, price remains constrained below the 23.6% Fibonacci Retracement line near $0.115. This confluence continues to act as a strong resistance zone, limiting upward progress.
The prevailing technical and on-chain signals suggest that any recovery attempt will likely remain shallow. Consolidation above $0.109 appears more probable than a decisive breakout for HBAR. This range-bound behavior reflects weak demand and limited speculative interest under current market conditions.
A shift in the broader cryptocurrency market could alter this outlook. If macro conditions turn decisively bullish, HBAR may benefit from renewed risk appetite. Flipping the 23.6% Fibonacci level into support would confirm a recovery move, opening a potential path toward $0.120.
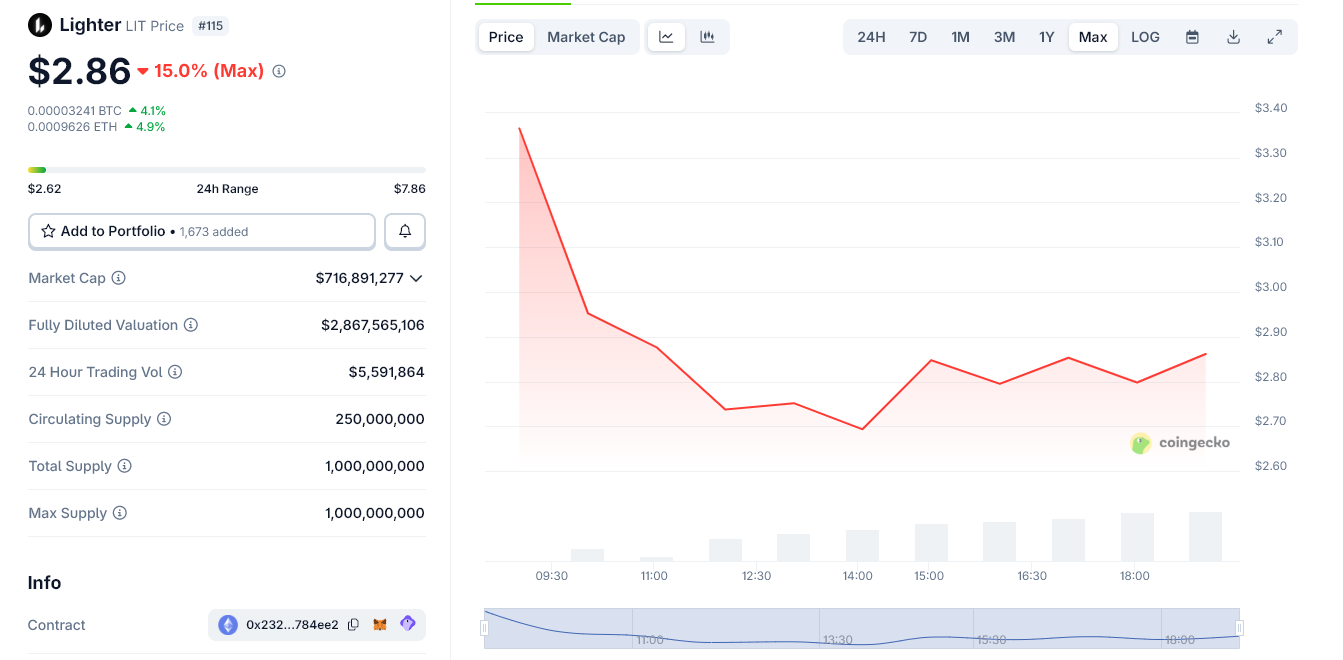
Coinbase said spot trading for Lighter’s LIT token will go live once liquidity conditions are met. This marks a major visibility milestone just hours after the token’s public launch.
The announcement applies to regions where the LIGHTER-USD pair is supported and comes as LIT trades just below the $3 level during early price discovery.
Coinbase Drives the Ligther Token Hype
The listing signal arrived on the same day Lighter completed its token generation event, releasing LIT into the market with roughly 25% of its 1 billion total supply circulating.
Spot trading for Lighter (LIGHTER) will go live when liquidity conditions are met, in regions where trading is supported for our LIGHTER-USD trading pair. pic.twitter.com/TQPWLAPNeg
Early trading showed sharp volatility, with LIT initially selling off before stabilizing in the $2.7–$2.9 range, according to market data shared by participants.
Lighter launched LIT as the native token for its Ethereum-based perpetual futures exchange, positioning it as the protocol’s core asset for governance, incentives, and future fee mechanics.
Half of the total supply is allocated to the ecosystem, including a 25% community airdrop distributed to early users who accumulated points during 2025 incentive campaigns.
Team and investor allocations remain locked for one year before vesting gradually over three years.
We are announcing the Lighter Infrastructure Token (LIT)! Lighter is building infrastructure for the future of finance and the native token is key to aligning incentives. In this thread, we will describe the structure of the token, broader vision, and roadmap of use cases.
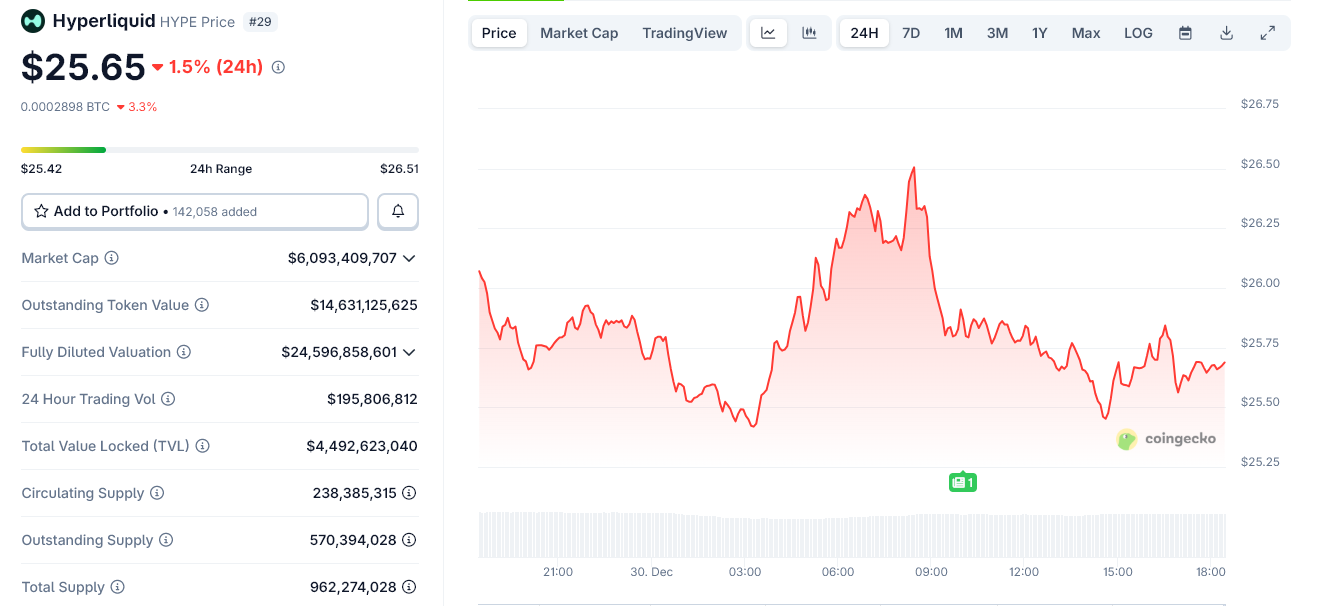
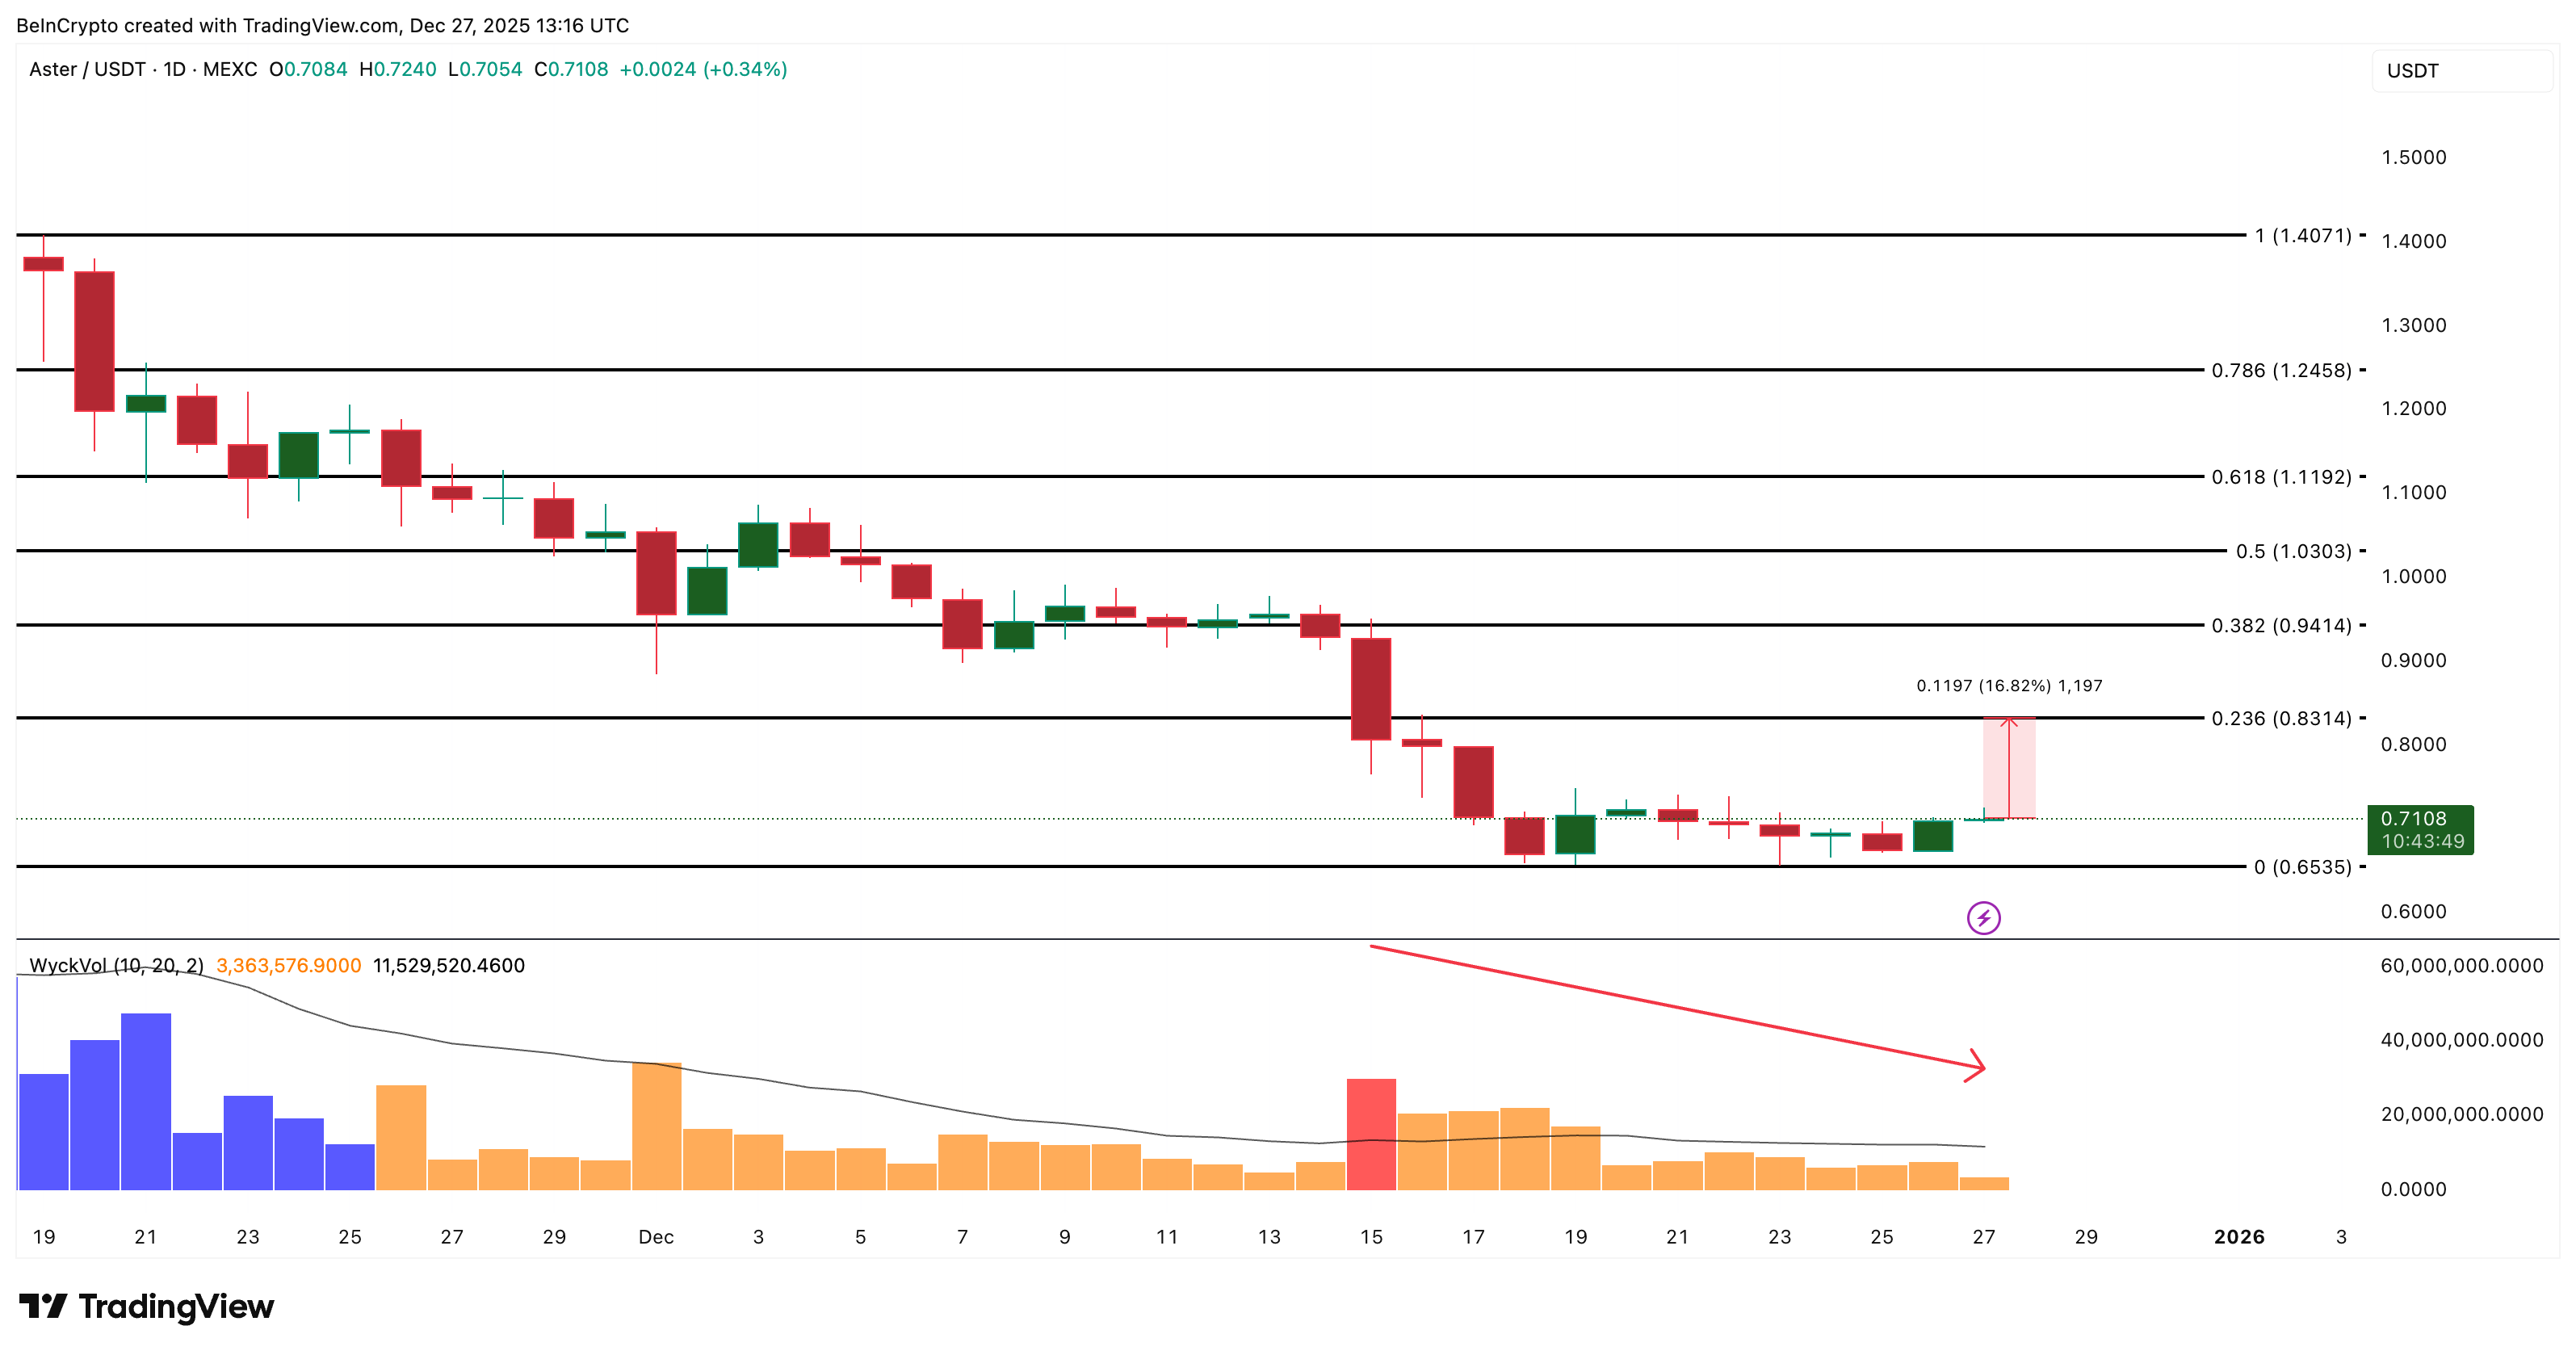
Meanwhile, broader perp DEX tokens moved lower following LIT’s debut. Hyperliquid’s HYPE token slipped around 1.5% on the day, while Aster’s ASTER token also trended down, despite no protocol-specific announcements.
Traders attributed the synchronized dip to short-term capital rotation and hedging as a new competitor entered the sector.
Historically, launches of large-cap perp DEX tokens have triggered temporary pressure across the category as liquidity fragments and traders rebalance exposure.
Lighter’s entry adds another high-valuation protocol into an already competitive market dominated by established platforms with deep liquidity and entrenched user bases.
Hyperliquid Token Price Drops After Ligther Launch. Source: CoinGecko
Looking ahead, market participants will watch how LIT’s price behaves as airdrop recipients decide whether to hold or sell, and whether Lighter can convert launch-day attention into sustained trading activity.
In the short term, volatility across perp DEX tokens is likely to remain elevated as the market absorbs the latest addition.
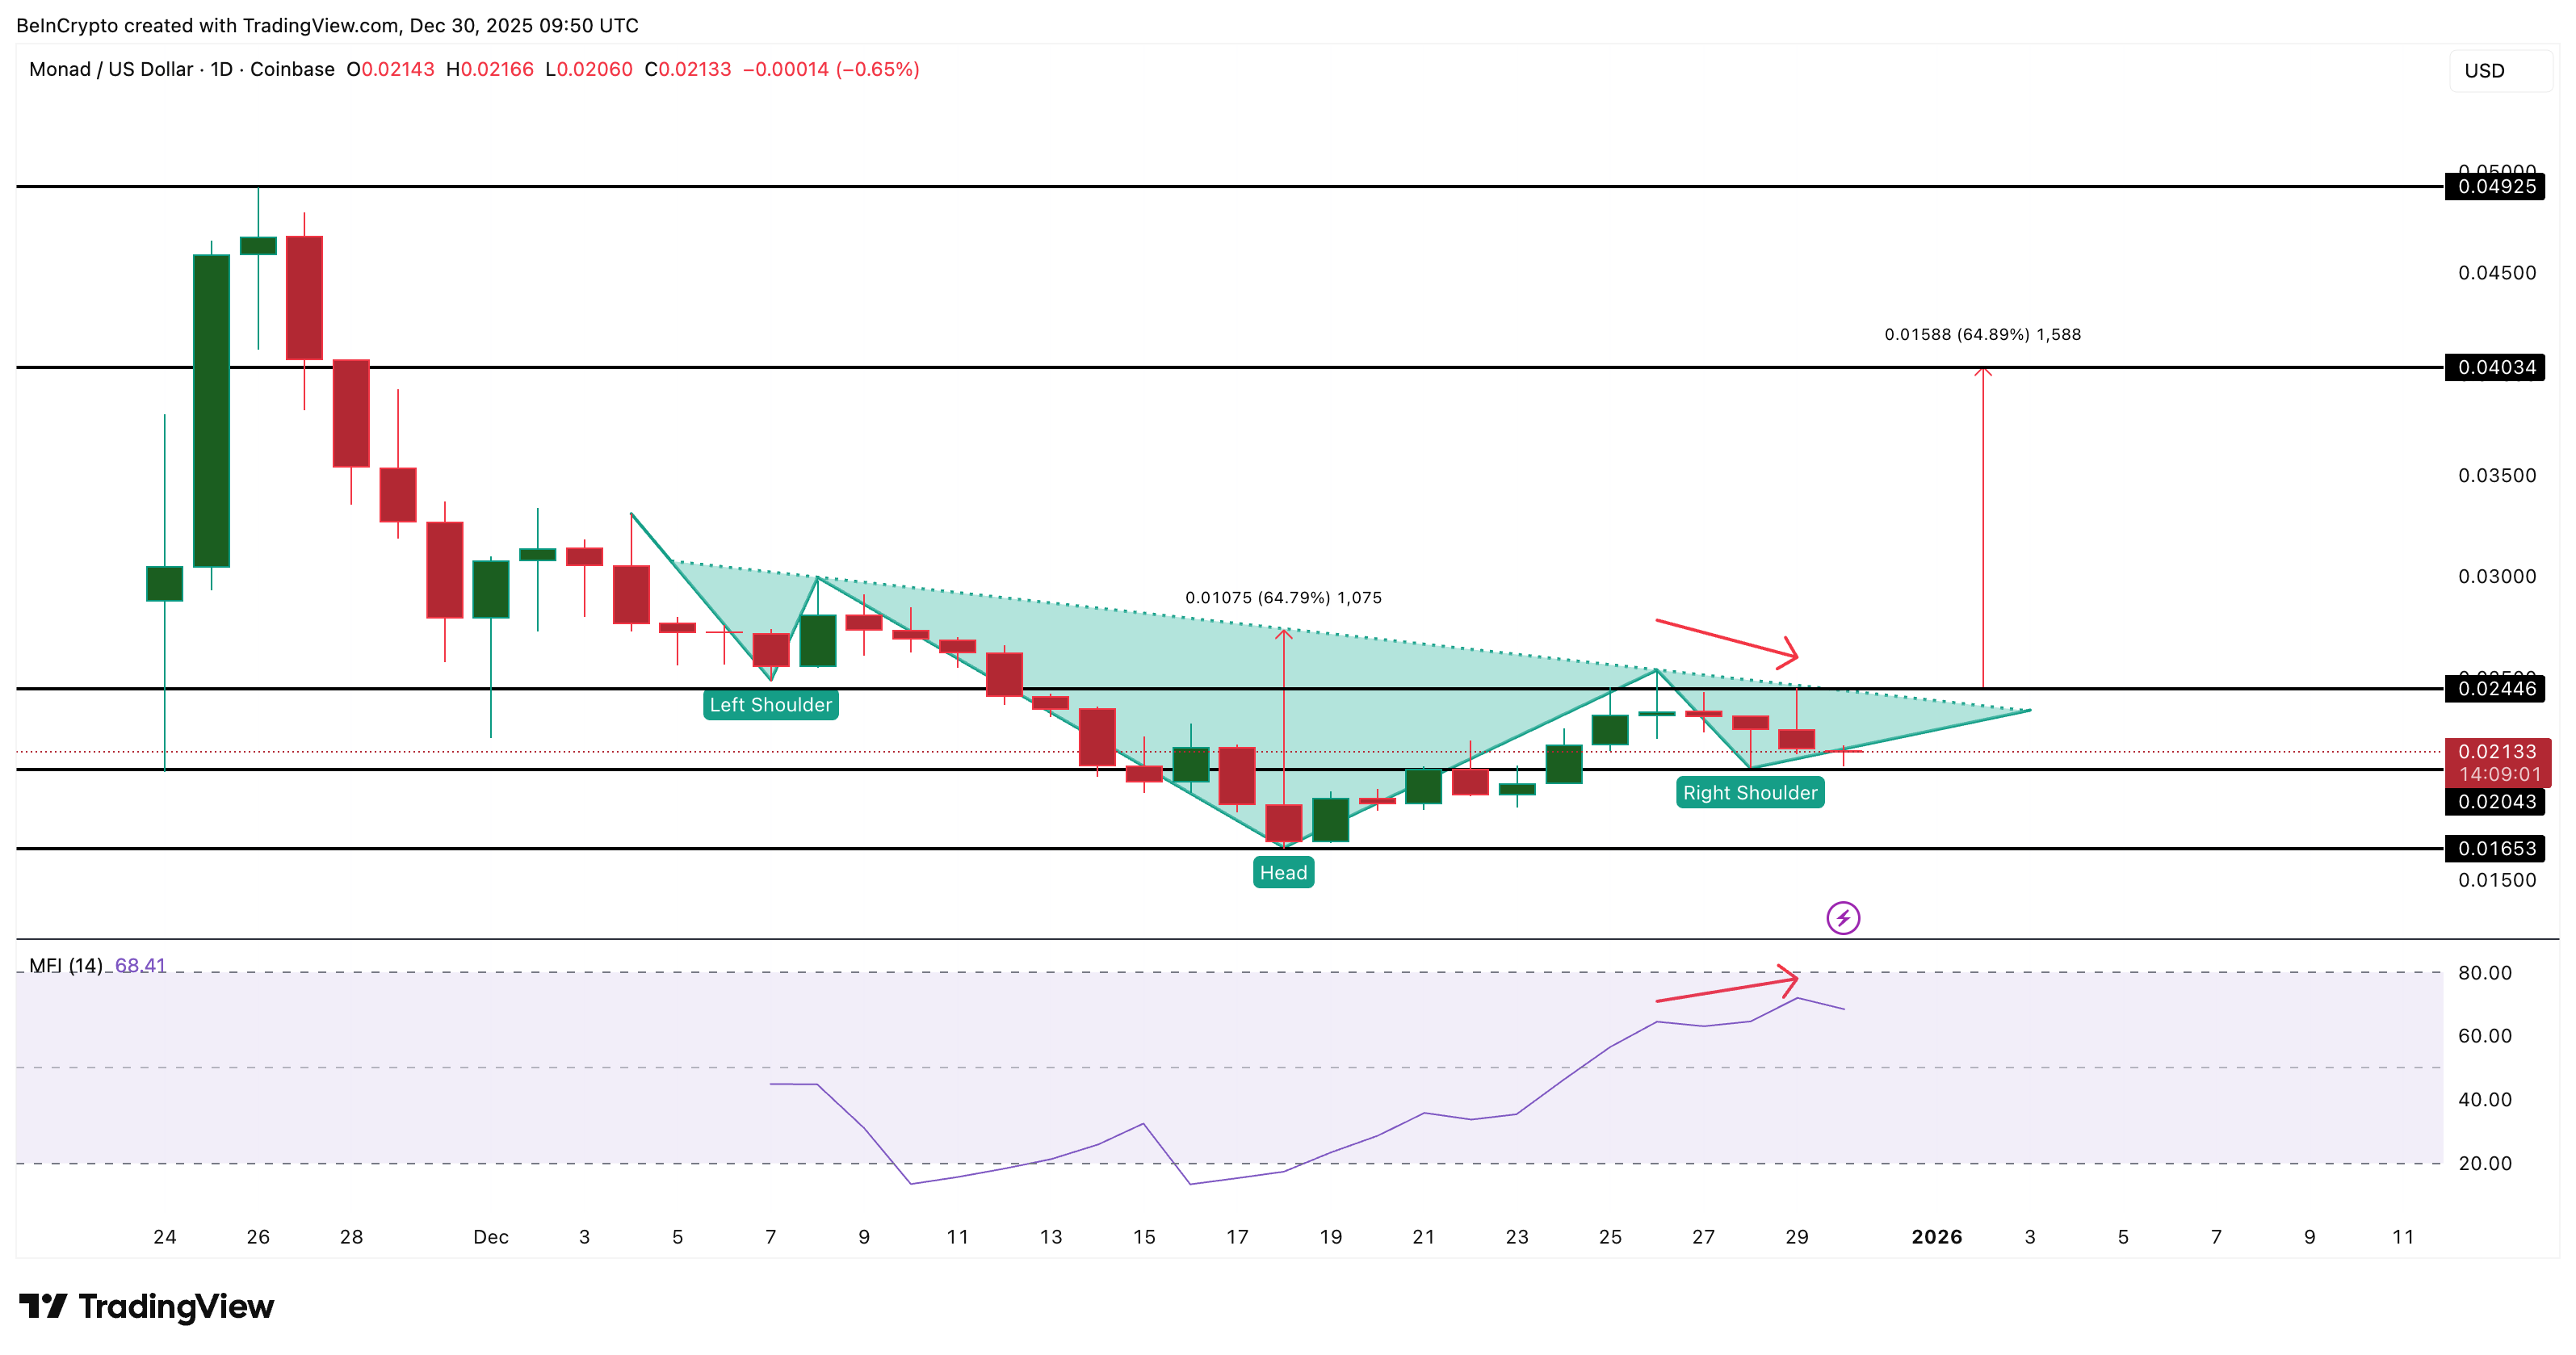
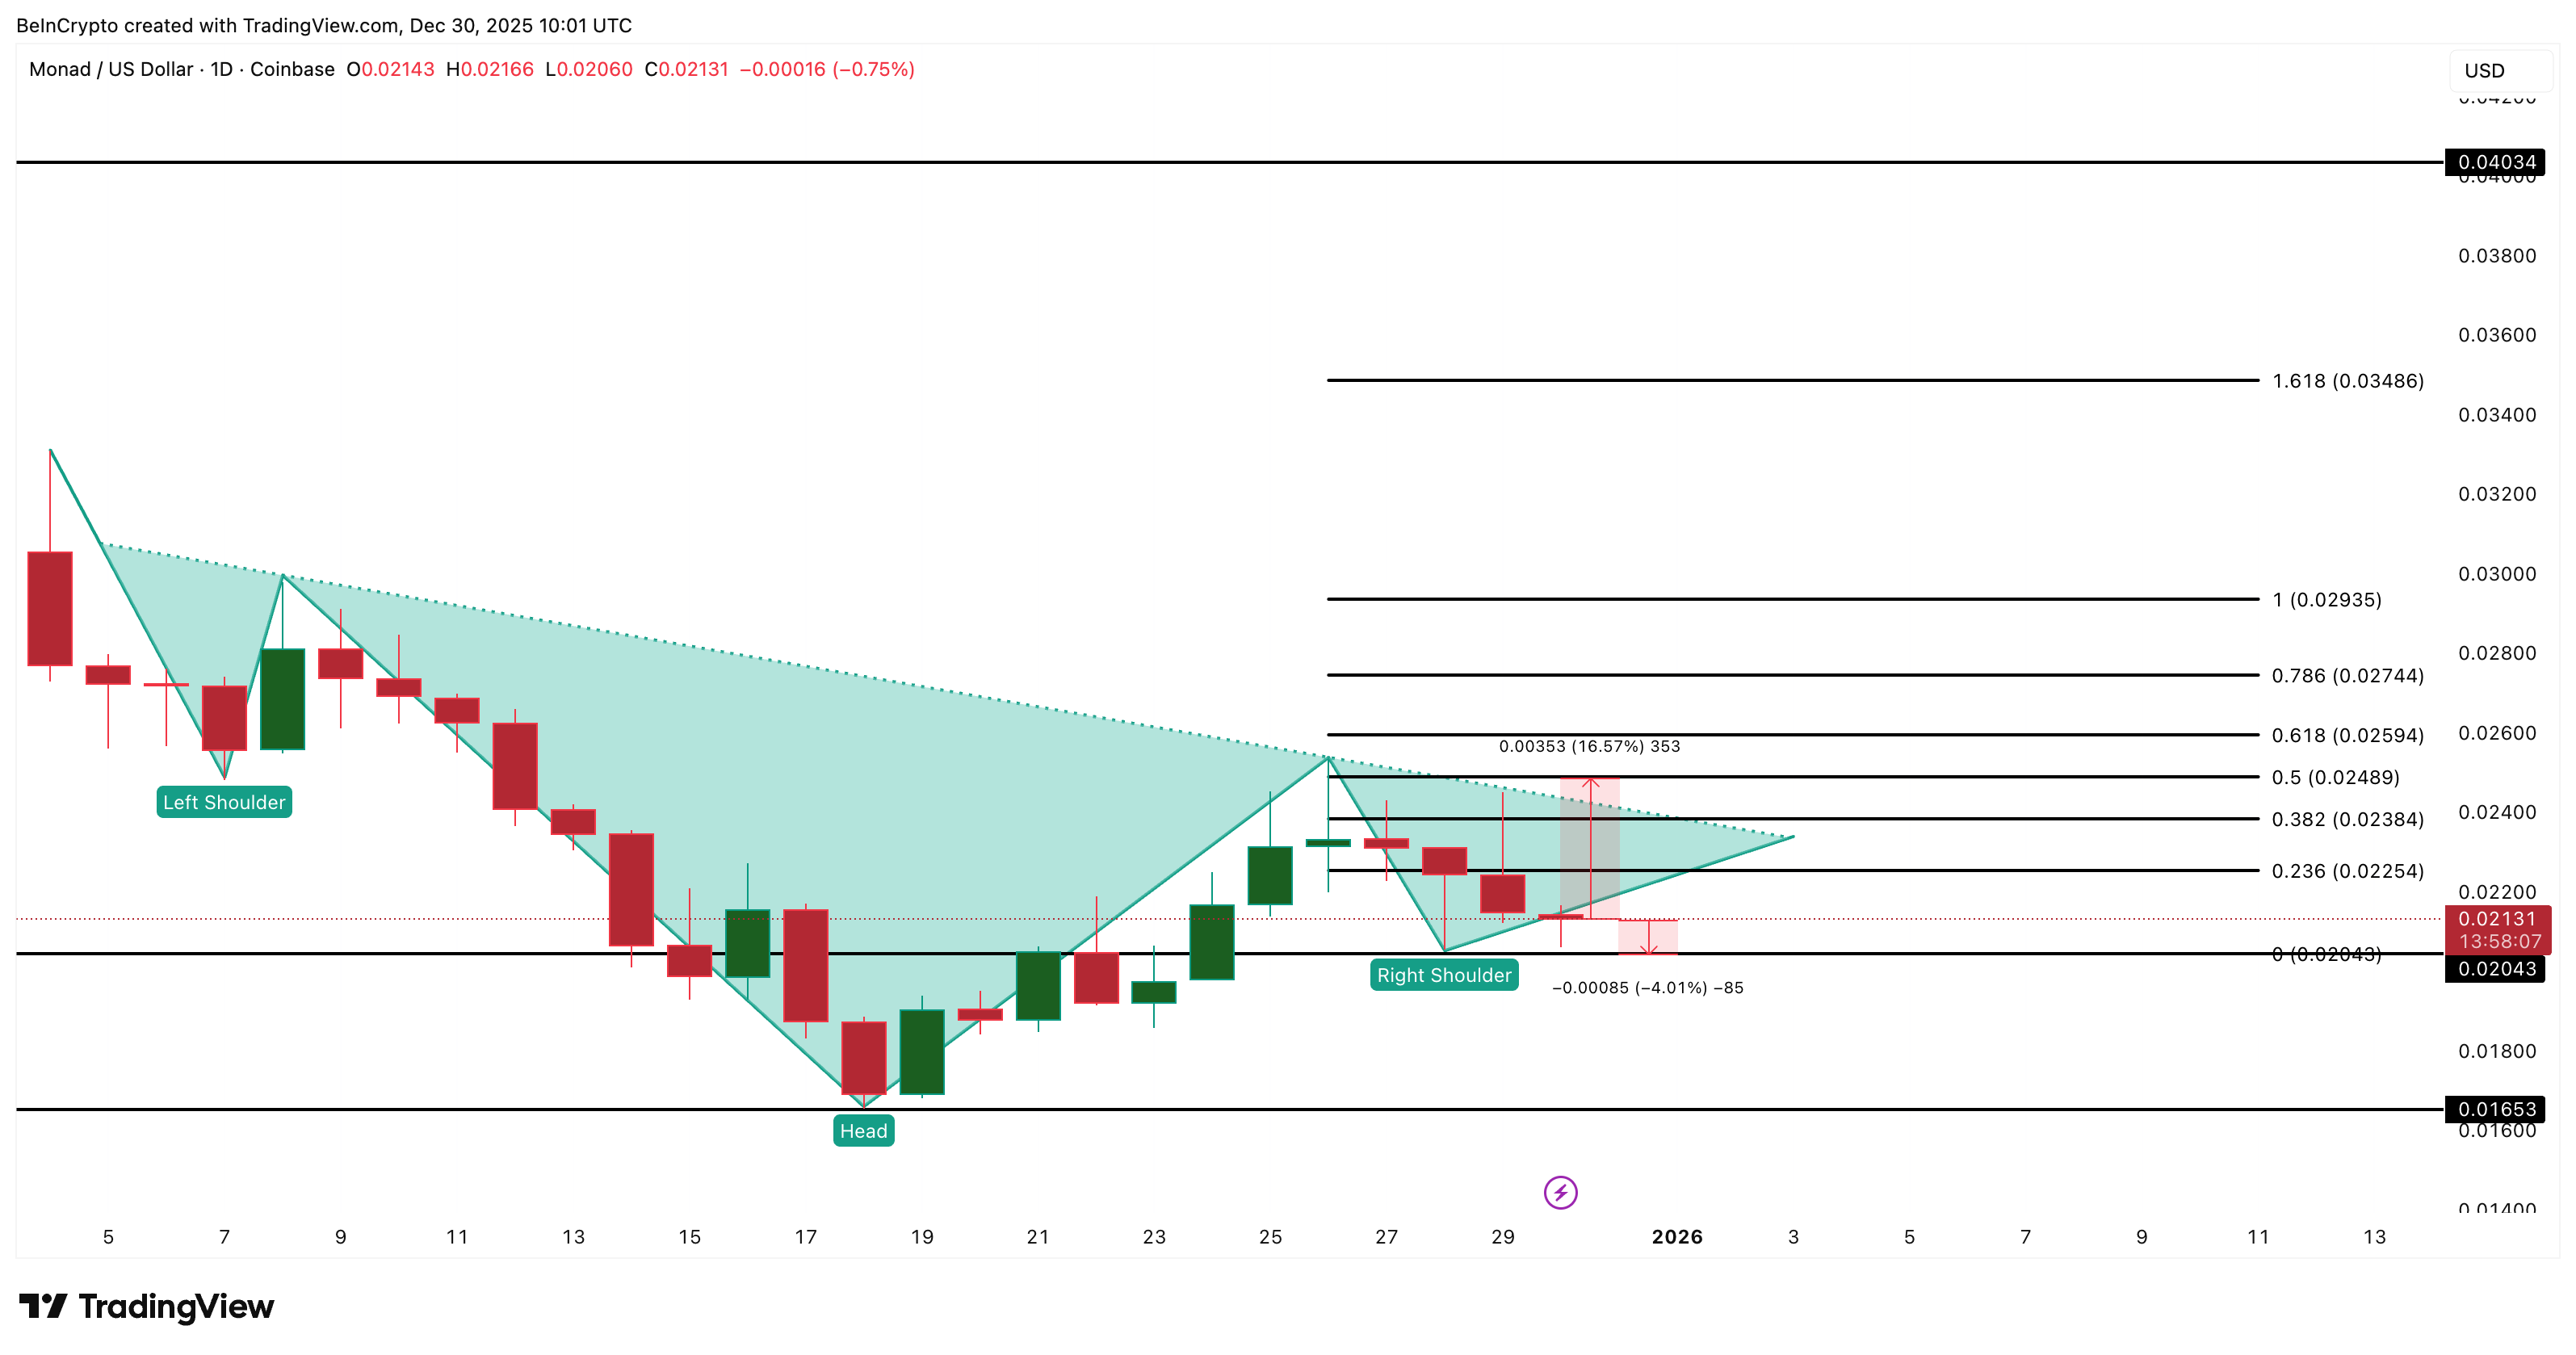
Monad (MON) trades near $0.021, down 7% in the past 24 hours but still up 4% over the week. Monad price is also 56% below its post-listing high of $0.048.
Even with that drop, the chart still leans bullish because an inverse head and shoulders pattern is holding the structure together. That pattern survives as long as bulls hold one key level. Yet, bearish risks do not look distant.
Inverse Head and Shoulders Pattern Holds as Dip Buyers Step In
Monad continues to respect an inverse head and shoulders setup. That pattern is known for a bullish reversal when the price clears the neckline. Support has formed at $0.020. The neckline sits near $0.024.
A daily close above $0.024 confirms the breakout. That breakout signals a measured 64% move toward $0.040. And while the Monad price has corrected over 7% in the last 24 hours, dip buying support keeps the breakout hopes alive.
Money Flow Index (MFI) tracks buying pressure with price and volume. Between December 26 and 29, the price trended lower while MFI made higher highs. That is a bullish divergence. It shows possible dip buying and retail support.
Want more token insights like this? Sign up for Editor Harsh Notariya’s Daily Crypto Newsletter here.
This behavior helps defend the pattern. If MFI drops under its recent swing low, the dip support weakens. If MFI clears recent highs, it strengthens the case for $0.024. Right now, retail buyers are doing just enough to keep $0.020 safe.
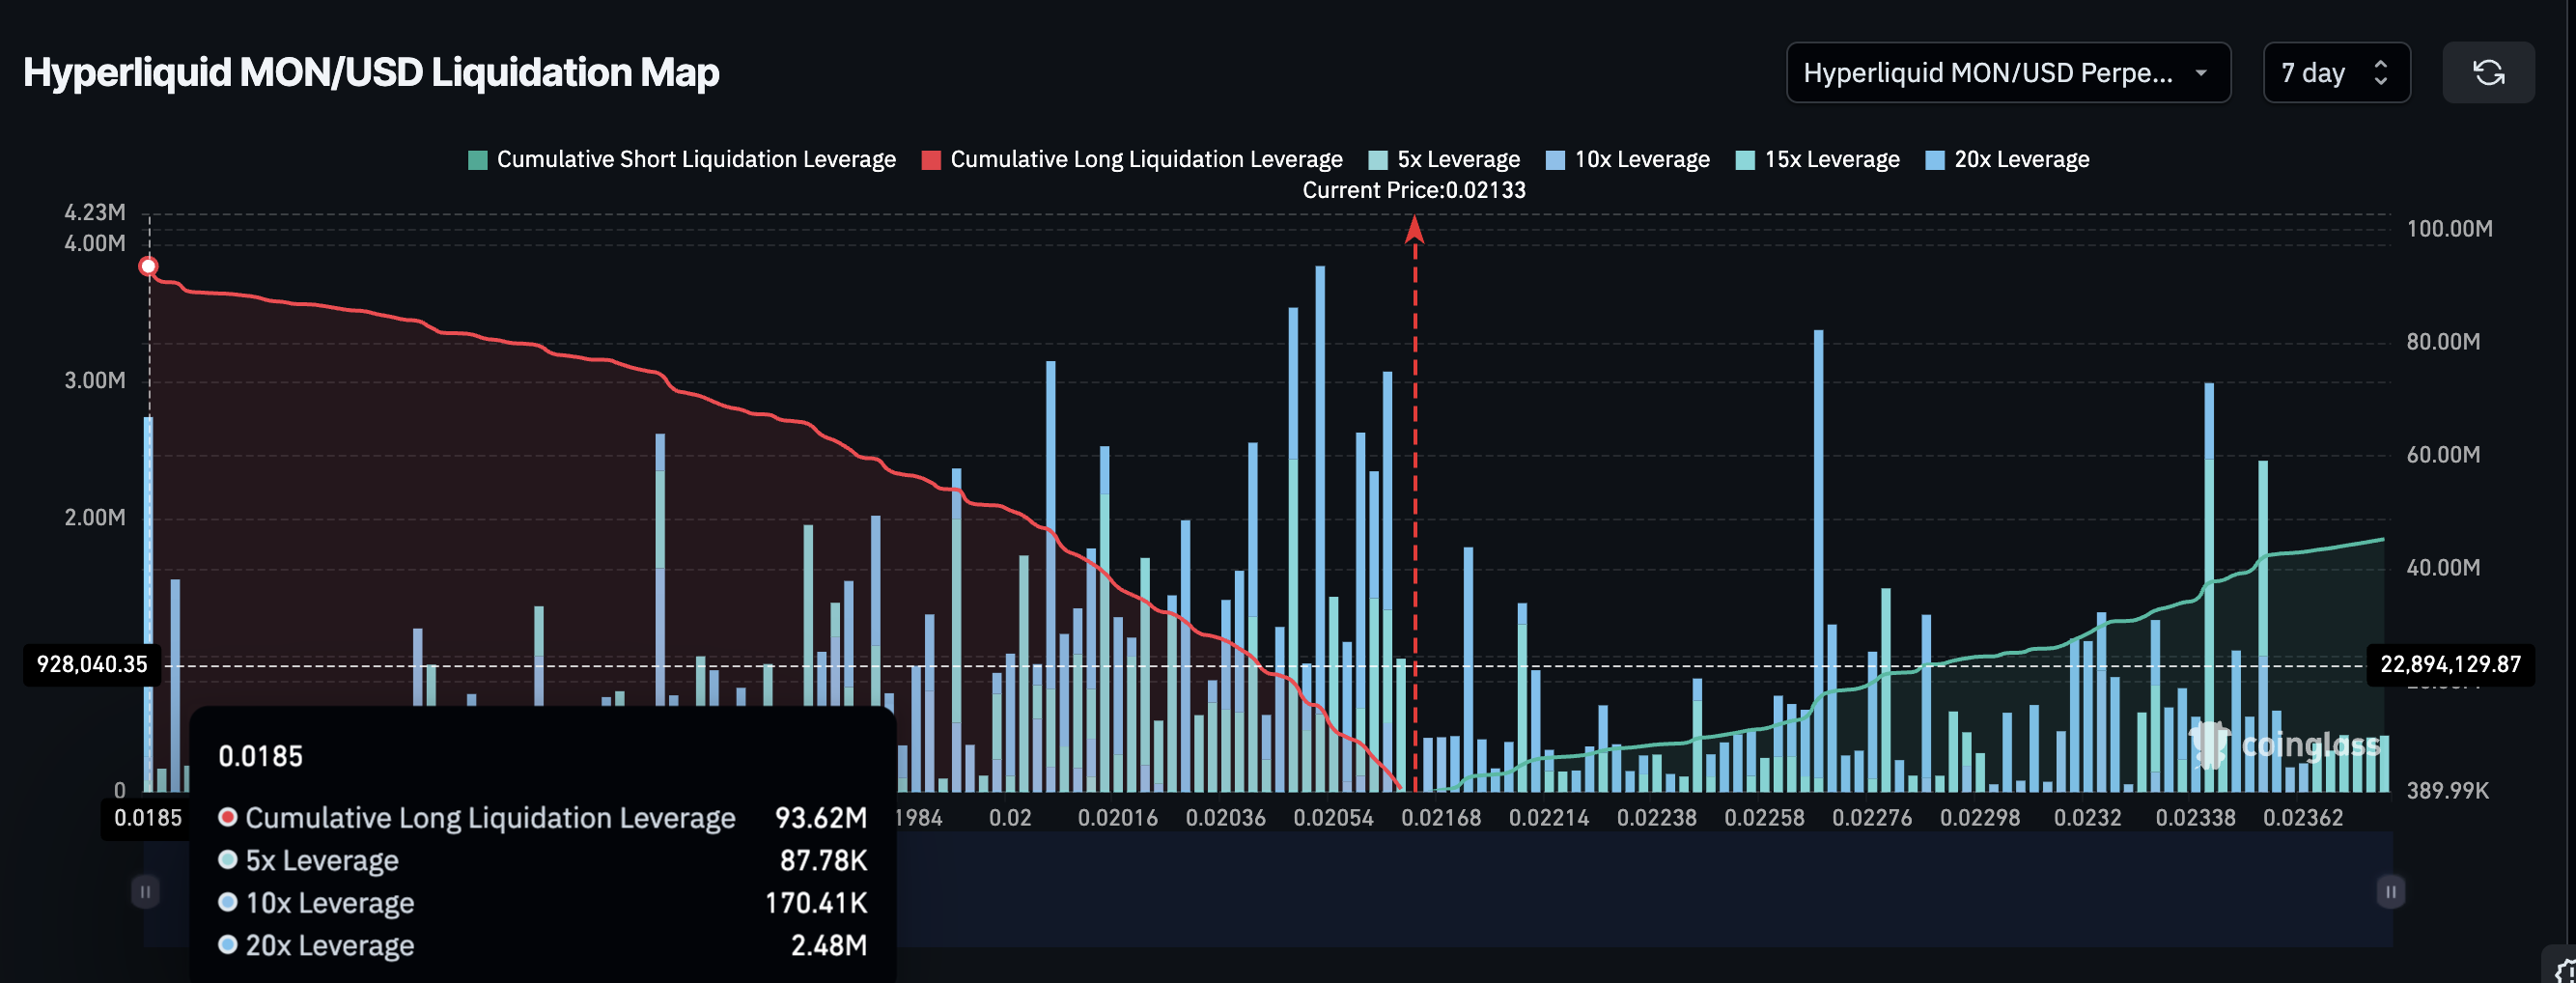
Derivatives Lean Long, But Squeeze Risk Builds Below $0.020
Derivative positioning shows why the setup feels unstable. On Hyperliquid’s 7-day MON-USD chart, liquidation clusters show a clear long bias. Long liquidations stack near $93.62 million. Short liquidations sit near $45.26 million.
Long liquidation pressure is more than 100% higher than short liquidation pressure. Traders are positioned for upside.
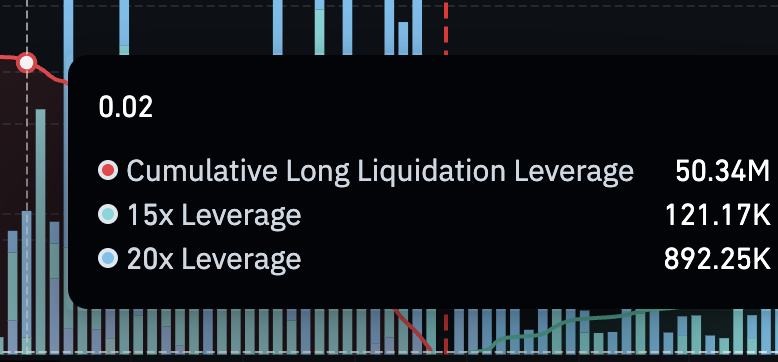
This creates risk. A close below $0.020 triggers a liquidation band where over 50% of the long cluster sits. That level includes $50.34 million in cumulative long leverage. A break could force a long squeeze and drag the price lower.
Sellers may be waiting for this trigger. If $0.020 fails, the liquidation loop accelerates the move.
On the flip side, a clear close above $0.024 liquidates most major Monad short clusters. That would confirm the breakout and open higher levels.
Key Monad Price Levels for Bulls and Bears
Monad trades between two levels that decide direction. Above $0.024, the breakout is active. The $0.029 area confirms momentum and could lead the move towards $0.040.
Below $0.020, the structure weakens. That exposes $0.016 and invalidates the pattern, breaking down the head of the inverse pattern. It turns the chart bearish again. Until then, the pattern leans bullish but barely.
Right now, the market is waiting for the neckline or the long squeeze trap. One breakout unlocks the 64% move. One bear-led breakdown triggers the squeeze and makes $0.016 attainable.
Welcome to the US Crypto News Morning Briefing—your essential rundown of the most important developments in crypto for the day ahead.
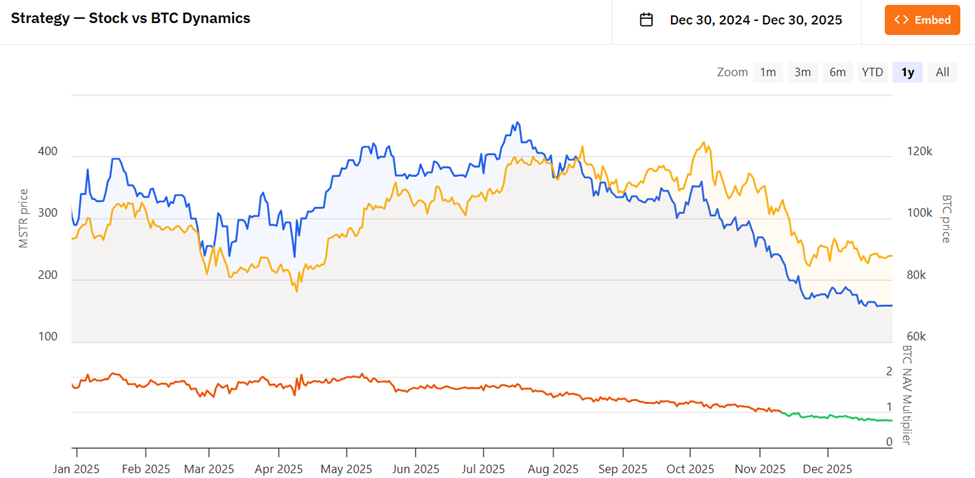
Grab a coffee, settle in, and think beyond the daily price swings of Bitcoin. What if the story isn’t about timing the market, but about how a company’s structure quietly compounds value over the years? That’s the argument Strive CIO Jeff Walton is making about MicroStrategy (MSTR), a stock that, on the surface, moves with crypto, but underneath, he says, operates like a machine steadily increasing Bitcoin exposure per share.
Crypto News of the Day: Strive CIO Jeff Walton on Why Buying MSTR at 2.5x mNAV Still Beats Spot Bitcoin
Reflecting on his own 2021 purchases, Walton argues the stock should not be viewed as a leveraged Bitcoin proxy. Rather, investors should view MSTR as a capital markets engine designed to increase Bitcoin exposure per share over time.
Walton revealed he began buying MSTR in June 2021 at roughly 2.5x mNAV, believing the stock was already down 50%.
“Little did I know, the stock would fall another 80% from my cost basis,” he wrote, as MSTR collapsed nearly 90% from its February 2021 peak.
By late 2022, the company was trading near 1.3x mNAV, holding 129,999 Bitcoin while its notional debt briefly exceeded asset value. Despite being “down bad on paper,” Walton said the underlying math never broke.
“The company had REAL hard money, debt covenants weren’t egregious, and structurally everything on the horizon for crypto was bullish,” he said, citing the halving cycle, ETFs, elections, and interest rate shifts.
By mid-2023, Walton said he went “all in,” convinced the capital structure, not price action, was the real thesis.
That conviction, he argues, is what allowed long-term holders to survive one of the harshest drawdowns in crypto equity history.
How Time and Structure Changed the Risk Equation for MicroStrategy
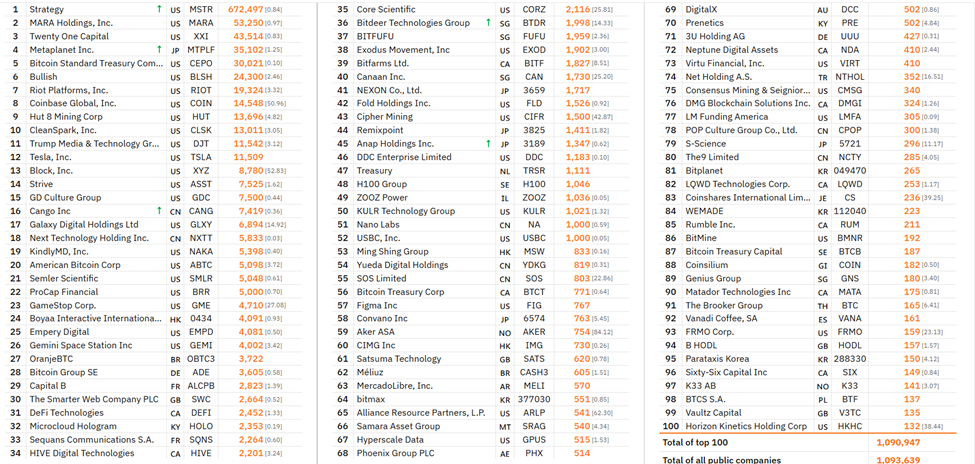
Fast forward to late 2025, Walton notes that MicroStrategy now holds 672,497 Bitcoin. Notably, this is more than 12 times the size of the next-largest publicly traded corporate holder.
More importantly, he says, the risk profile of his original shares has undergone a fundamental change.
“The 1x NAV per share price is 160% greater than the 2.5x mNAV shares I purchased back in June of 2021,” Walton wrote, adding that the rising NAV floor now sits above his original cost basis.
In his view, capital market activity steadily de-risked common equity while amplifying Bitcoin exposure per share.
From this point forward, Walton argues his 2021 shares can structurally outperform Bitcoin even if the company acquires zero additional BTC.
“There is materially more Bitcoin exposure in EACH share I purchased in 2021 than when I bought them,” he said, emphasizing that excess Bitcoin exposure has been accreted through dilution, preferred equity, and long-dated debt rather than price appreciation alone.
That framing drew support from market commentators, who argued investors were buying a system, not leverage.
“Bitcoin is a bearer asset. MicroStrategy is an operating system for acquiring Bitcoin using public-market incentives,” commented one analyst.
In Walton’s view, volatility itself became an input, effectively serving as fuel for accretion rather than a threat to the thesis.
But Is It A Structural Edge or a Cycle-Dependent Trade?
Strive CEO Matt Cole has echoed Walton’s view, recently stating that MSTR has outperformed Bitcoin and gold over five years. According to Cole, this could remain true even at $75,000 BTC or 1x mNAV.
The two most important words in investing are "Total Return" not "Average Cost".$MSTR has outperformed BTC and Gold over the last five years – and this will still be true at $75k BTC or at a 1x mNAV.
However, not everyone agrees that the structural edge is guaranteed going forward. Contrarian narratives argue that while five-year outperformance was real through mid-2025, MSTR materially underperformed Bitcoin during the second-half drawdown. Further, it has traded near or below 1x mNAV in recent weeks.
Elsewhere, Barchart indicates that MicroStrategy was the worst-performing Nasdaq-100 stock of 2025, down roughly 65% from its peak amid a broader crypto winter.
Critics like Peter Schiff dismissed the strategy entirely, arguing that Strategy’s average Bitcoin cost implies modest annual returns.
Others warned that sustained sub-1x mNAV conditions could theoretically prompt Bitcoin sales, a scenario CEO Phong Le has acknowledged would make “mathematical” sense, although management has stressed that it is unlikely.
Still, signs of institutional interest persist. According to industry commentary, large US banks are now exploring partnerships with Strategy, with Michael Saylor framing bank adoption, not price, as the defining Bitcoin narrative for 2026.
Phong Le says large U.S. banks want to partner with Strategy.
The same Wall Street that coordinated attacks on $MSTR now wants a seat at the table.
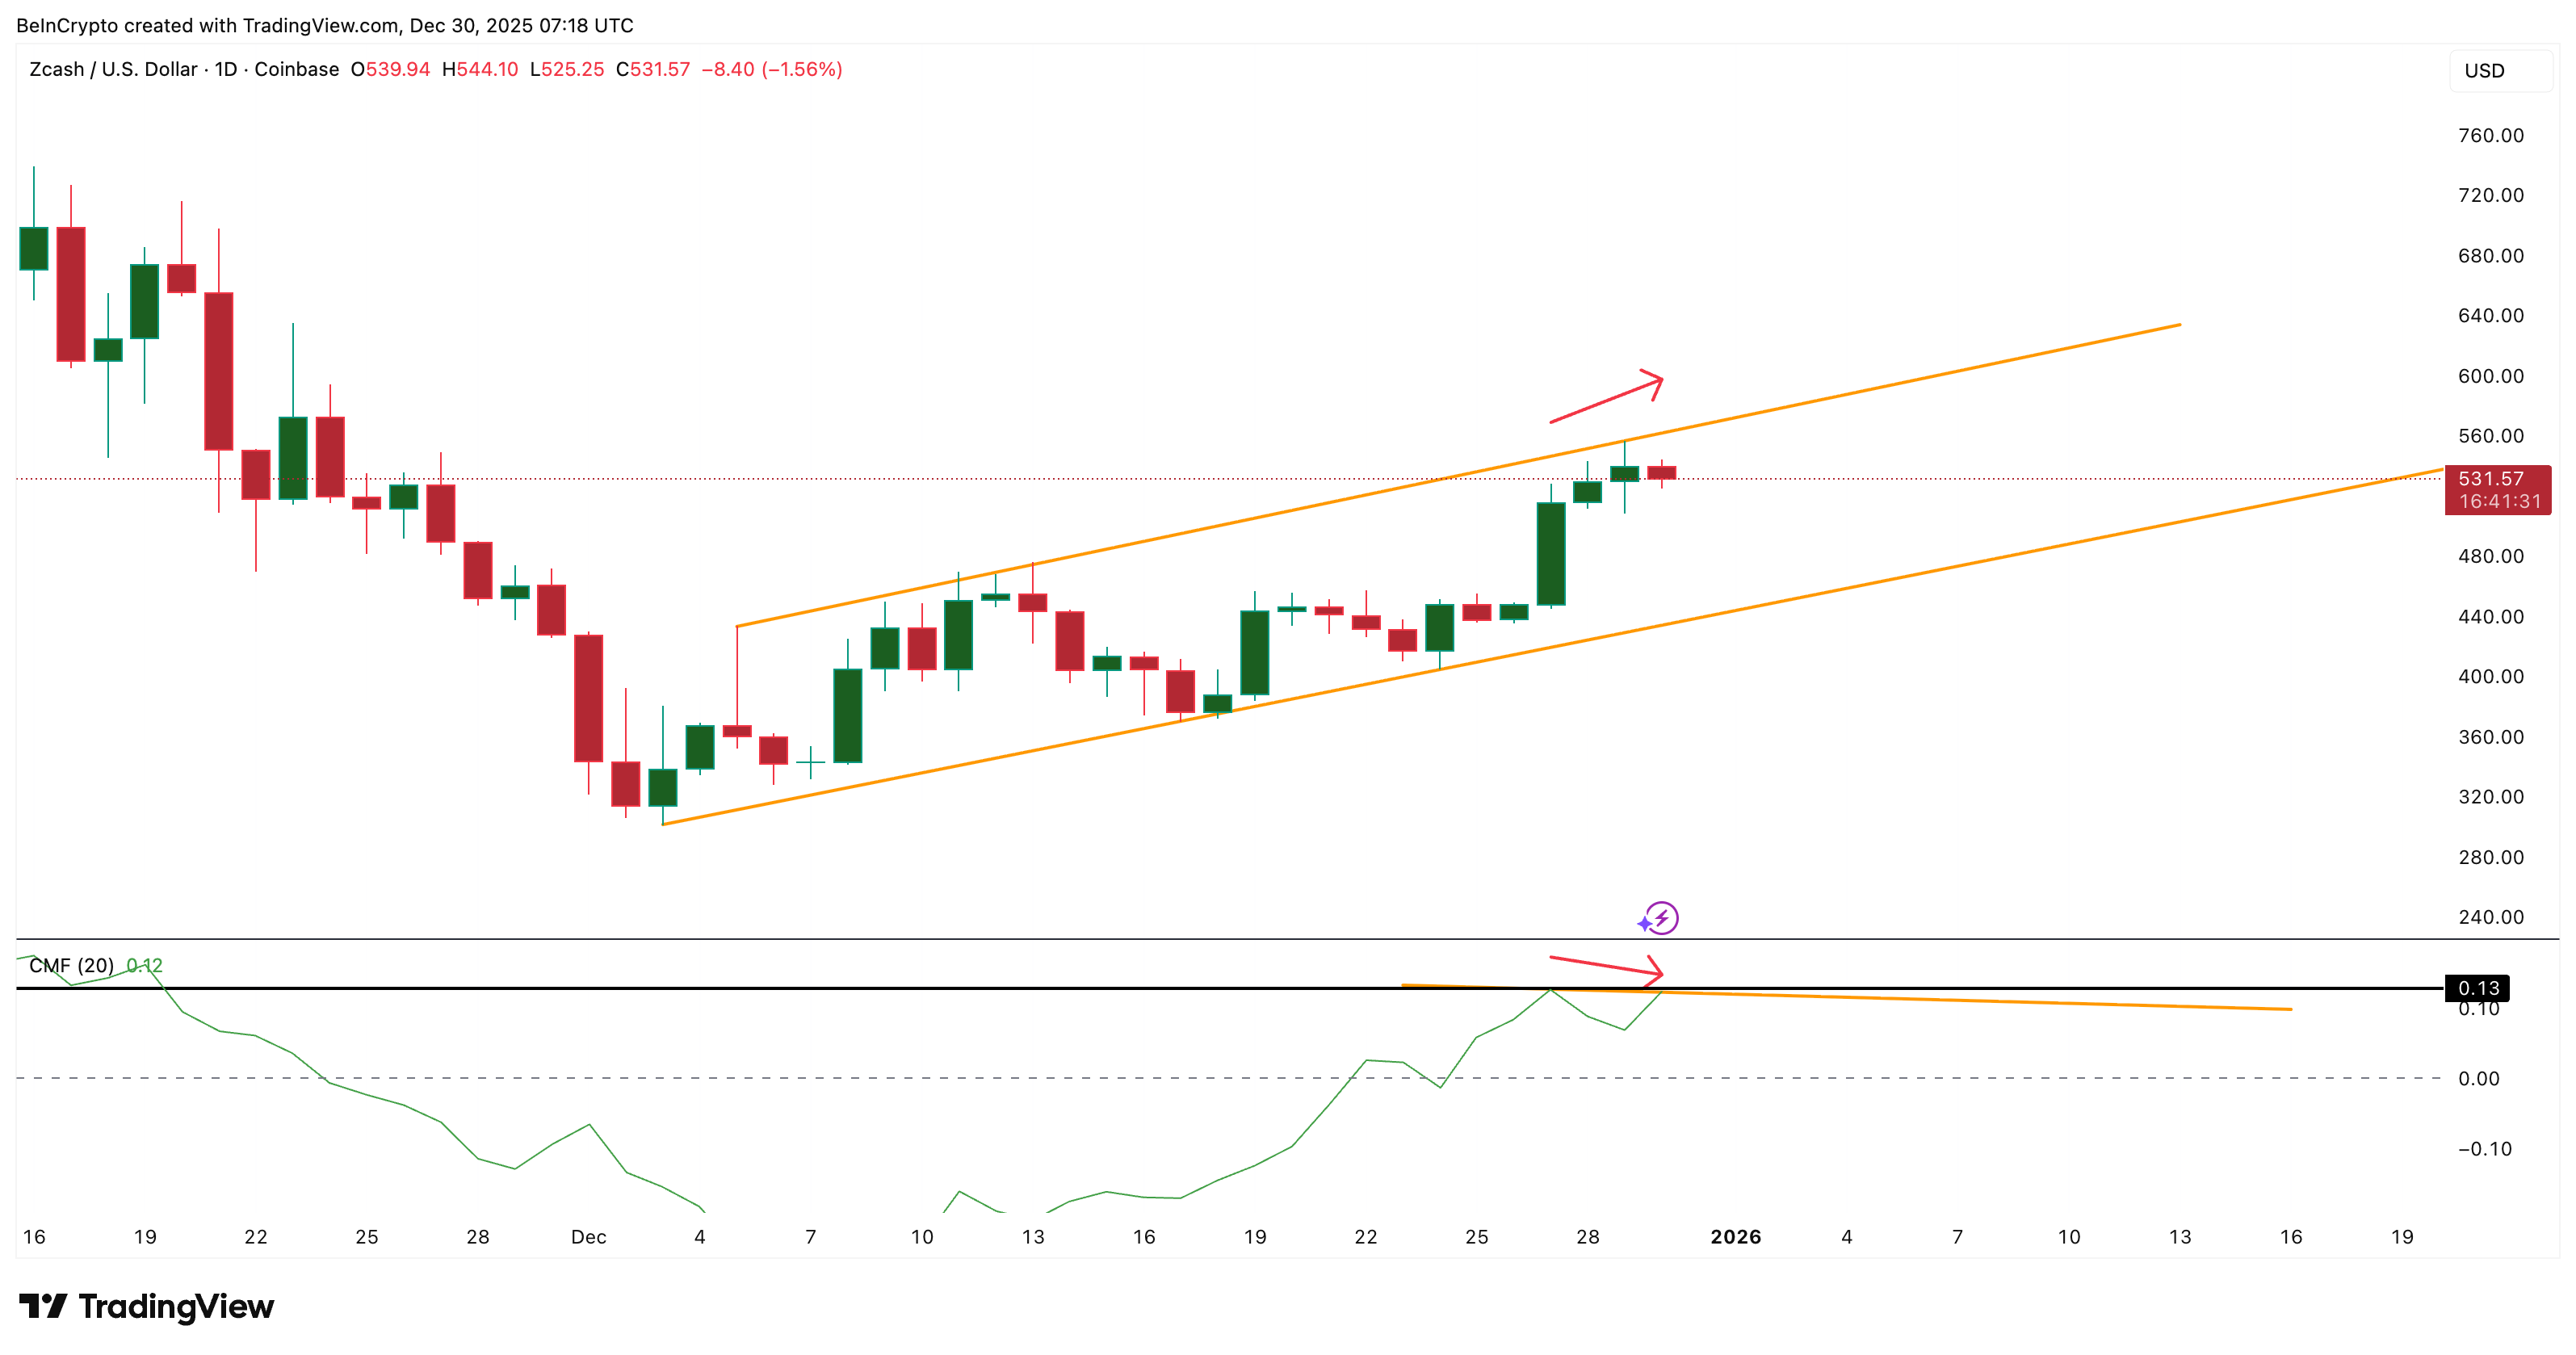
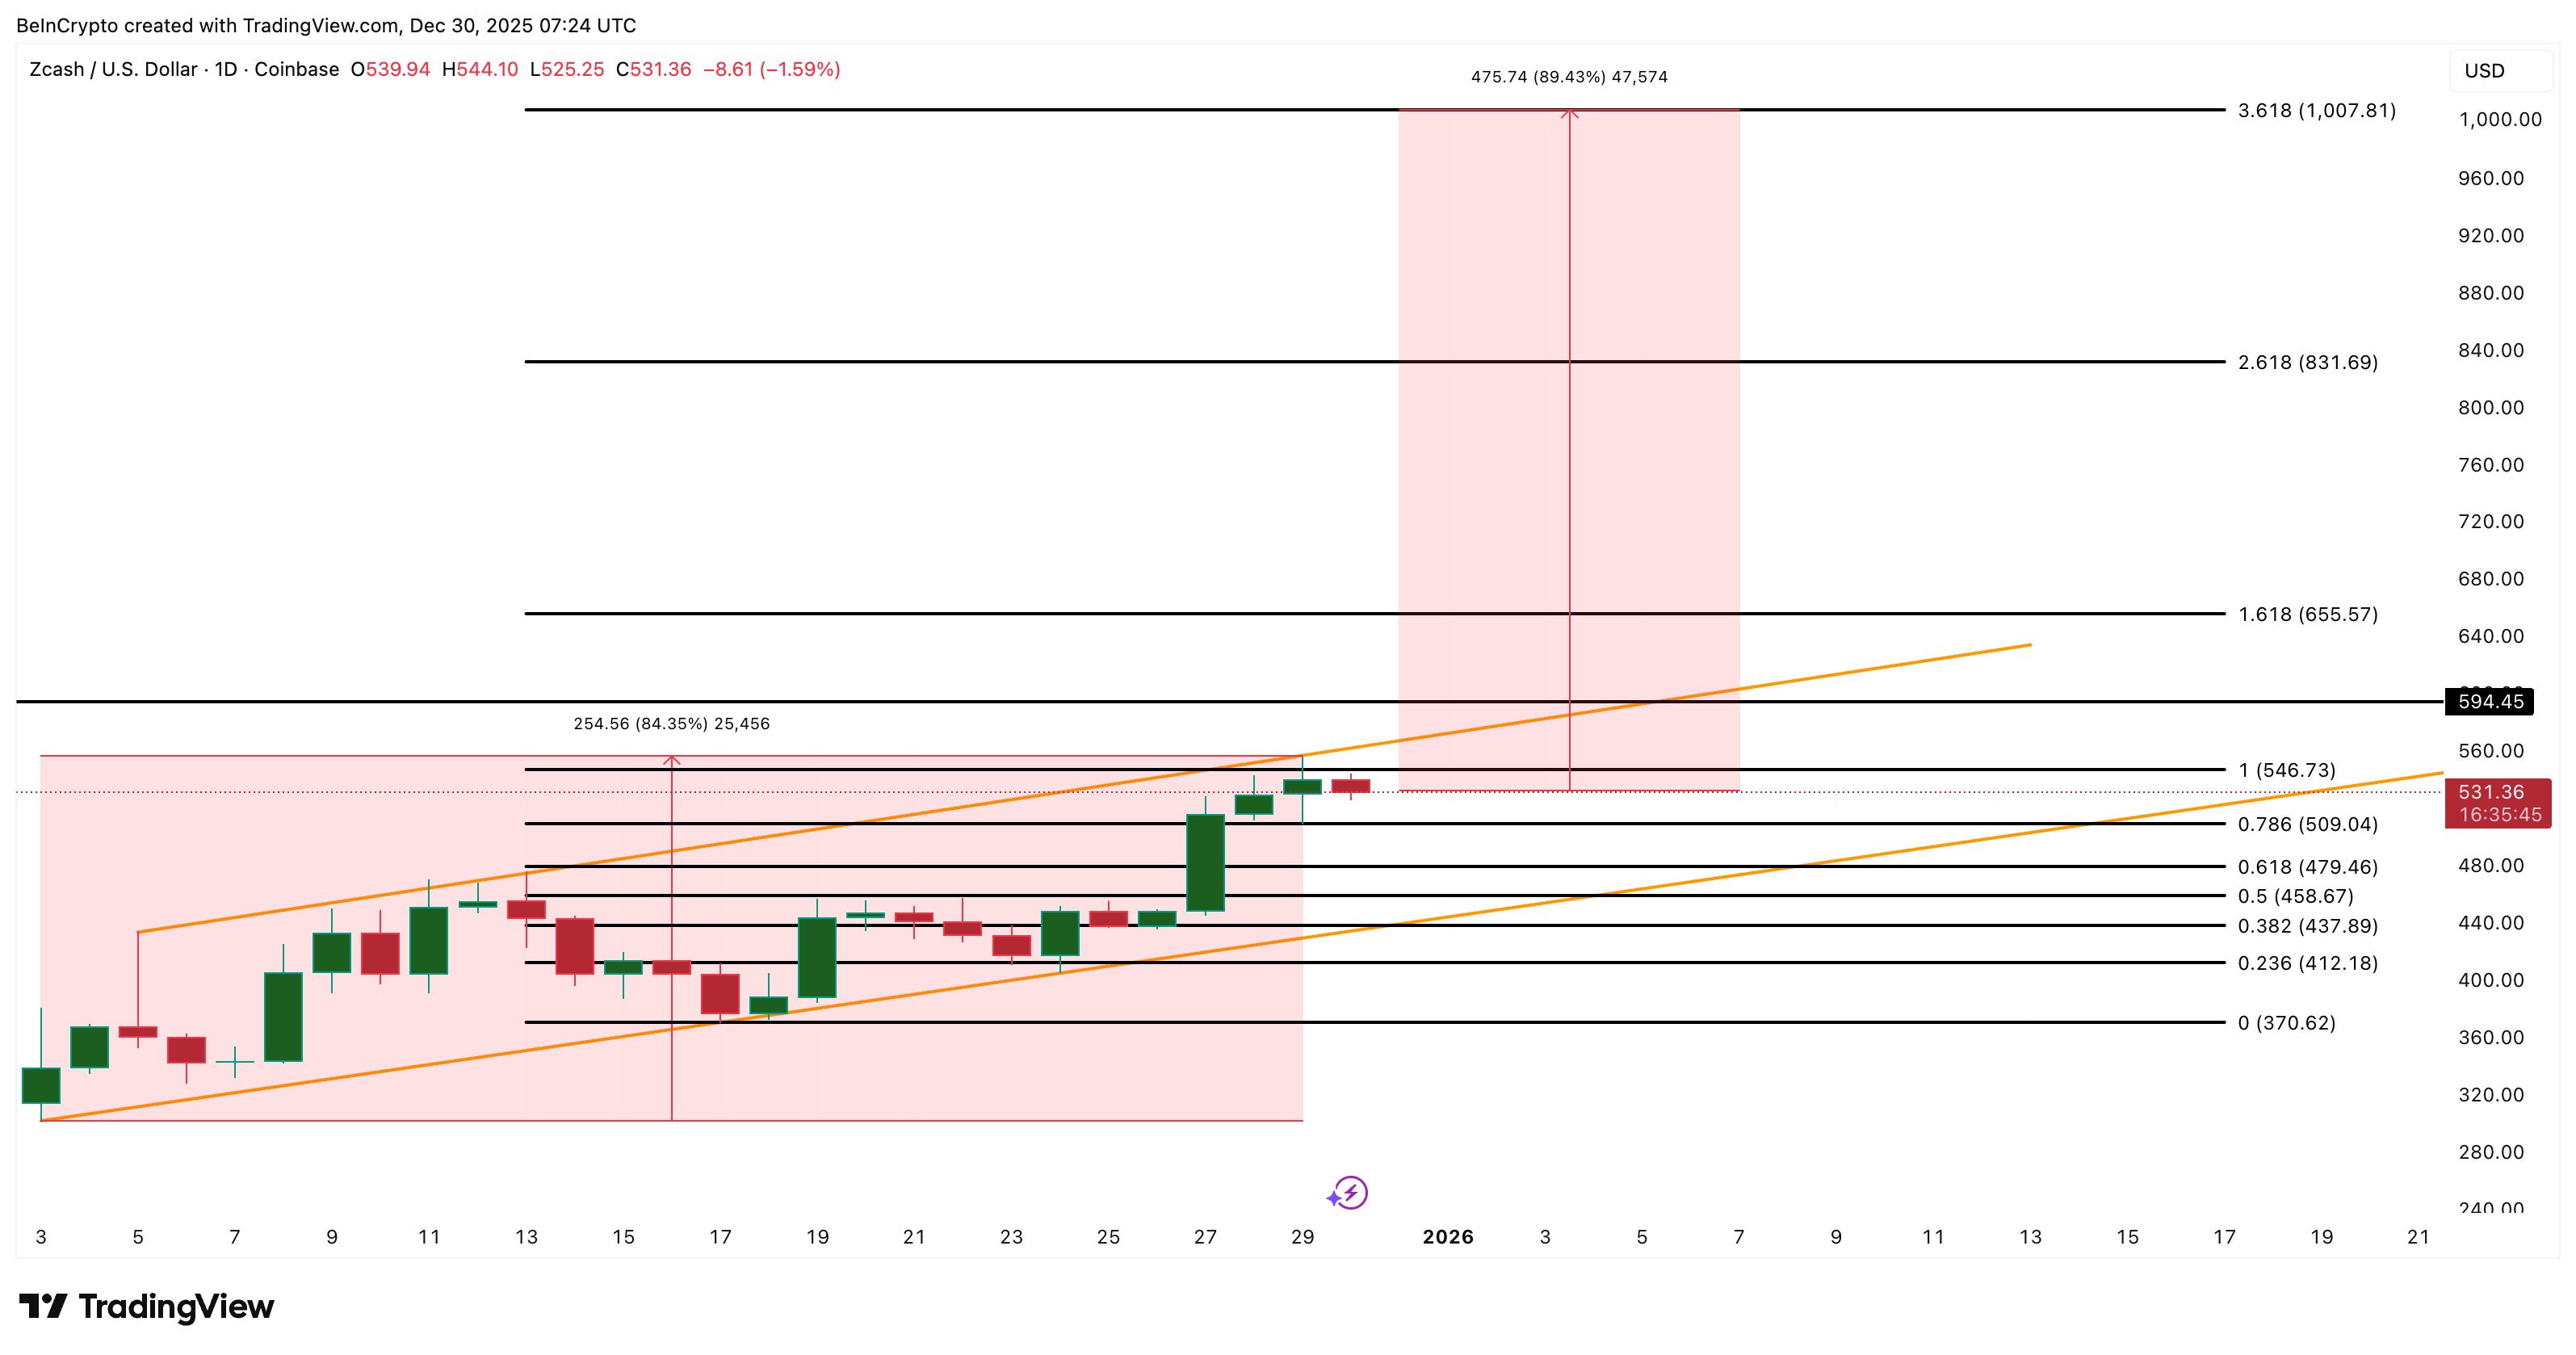
Zcash (ZEC) has been one of the few clean trend performers this year. The token is flat in the past 24 hours but still up almost 30% in seven days, extending its three-month move to nearly 570%. Now, the Zcash price sits against a bullish channel resistance that has capped every breakout attempt since early December.
One more push could be different. The structure is bullish, but one confirmation still stands between Zcash and its long-delayed attempt at $1,000.
Zcash Tests Bullish Channel — But One Confirmation Is Needed
Zcash is trading near the upper boundary of a rising channel. This channel has guided the uptrend since early December. Price has respected every retest, but buyers need a clean daily close above the upper trendline to open higher targets.
The main missing piece is capital flow confirmation.
Chaikin Money Flow (CMF), which tracks buying strength using price and volume, has trended slightly lower while price trended higher between December 27 and 31. That is a mild bearish divergence. It tells us capital inflow slowed down even as prices pushed higher, which delays conviction.
Want more token insights like this? Sign up for Editor Harsh Notariya’s Daily Crypto Newsletter here.
The CMF, which is still comfortably above the zero line, needs to break above its trendline and make a higher high above 0.13 to confirm strength. If that happens, the Zcash price could follow through. A return of big buyers would likely be the trigger for that CMF breakout. But the next metric shows that those buyers might already be returning.
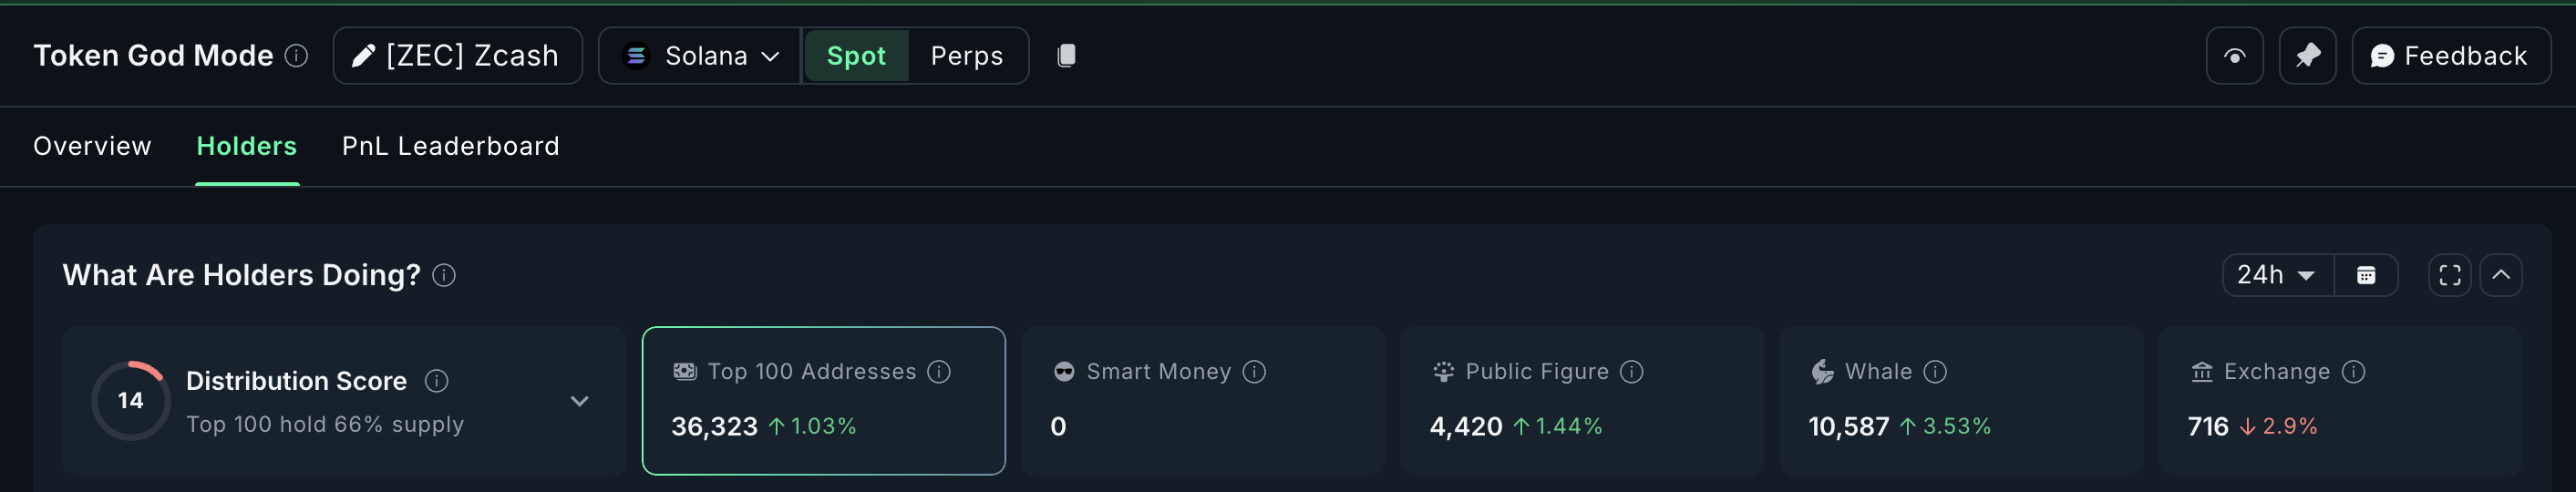
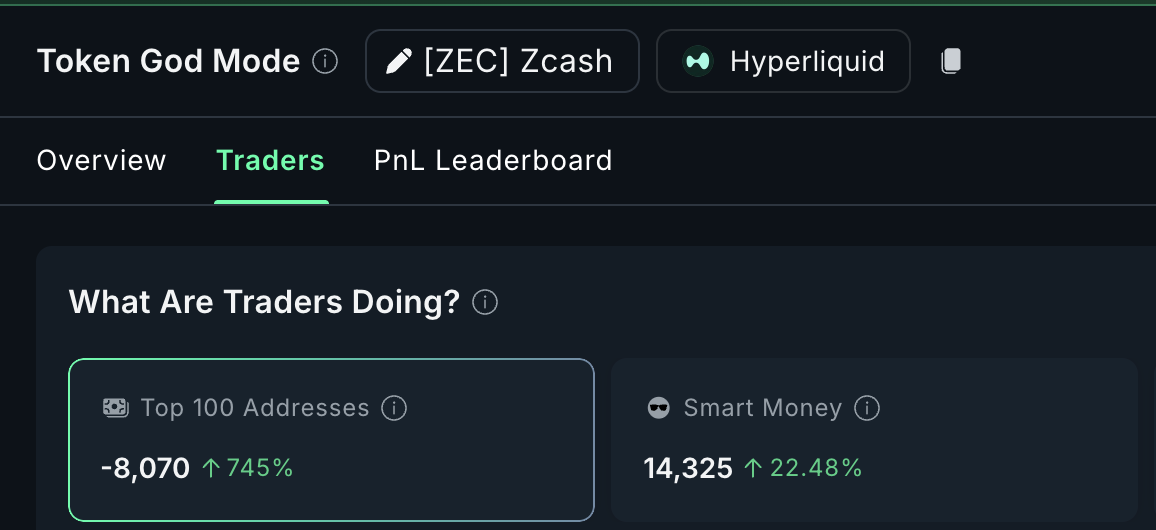
Whales Accumulate, Smart Money Adds Exposure
Spot behavior is showing the first hints of support.
On the Solana Chain, Zcash whales increased balances by 3.53% in 24 hours, lifting their total to 10,587 ZEC. That is an addition of roughly 361 ZEC, equal to about $191,000 at the spot price.
Mega whales (top 100 wallets) also added 1%, taking their stash to 36,323 ZEC. That is also around 360 ZEC added, equal to another $190,000. Whales are not buying aggressively yet, but they are no longer absent. This hints that accumulation is restarting.
Exchange balances support that view. ZEC supply on exchanges slipped slightly in the past day, signaling ongoing accumulation and reduced sell-side liquidity. It is small, but direction matters here.
The derivatives market agrees. Smart money positioning (non-retail accounts) shows a 22.48% increase in net long exposure. The biggest derivatives players remain net short overall, but their long positions increased faster than shorts (up 745%), which is rare this close to resistance unless a breakout is expected.
This matters because whales often drive CMF higher. If whale inflows continue, the CMF trendline could break, which would confirm the channel breakout.
Zcash Price Target Of $1,000 Still Possible?
ZEC trades below the first trigger at $546. A close above that opens the door to $594. That is the real battle for the Zcash price.
If $594 breaks with CMF confirmation, pattern projection from the rising channel gives an 84% upside target, placing Zcash near $831 and beyond. That is the springboard. From that point, a secondary Fibonacci extension path aligns with a move toward $1,007 as the next major target, approximately 89% from the current level.
Invalidation levels matter too. Losing $509 weakens momentum, whereas losing $479 flips the structure to neutral. If Zcash loses $437, it breaks the channel completely and cancels the bullish case.
As long as ZEC stays above $479, the channel remains valid. Above $594 with CMF support, the breakout is live.
Bitcoin is entering the final stretch of the year in a paradoxical position. Institutional adoption has never been stronger, yet price action remains hesitant, weighed down by thin liquidity, legacy holder distribution, and uneven global flows.
As markets look ahead to 2026, the question is less about whether Bitcoin’s monetary case still holds and more about when price catches up to it.
Thin Liquidity Driving Short-Term Volatility
Bitcoin is closing the year holding to familiar holiday dynamics rather than new fundamental catalysts.
“With holiday conditions continuing to suppress liquidity, pockets of elevated spot volatility are arising, but are also unsurprising,” QCP analysts said.
The elevated spot volatility has been fueled by discretionary buying rather than forced positioning resets, the analysts said. QCP added that demand appears to be coming from spot and perpetual markets operating in thin conditions.
Part of the buying pressure appears to have come from Strategy, which revealed in a Monday filing that it purchased 1,229 Bitcoin last week for $108.8 million at an average price of $88,568 per coin.
Options Markets Signal Fragile Upside
Following the major options expiry on Friday, Bitcoin perpetual funding on Deribit jumped from near-flat levels to above 30%, reflecting a potentially optimistic shift in dealer exposure.
QCP noted that traders who were previously long gamma ahead of expiry, helping keep prices range-bound, are now effectively short gamma to the upside. As prices rise, those participants are forced to buy spot Bitcoin or near-dated call options to hedge, reinforcing upside momentum.
Monday’s QCP Capital note points to aggressive buying in perpetuals and demand for Bitcoin call options. QCP said a sustained move above $94,000 could open the door to a more pronounced gamma-driven squeeze.
On the downside, near-term risk hedging has eased. Put skew has declined after traders chose not to roll a large December $85,000 put position.
In addition, roughly 50% of open interest was wiped out following Friday’s record expiry, leaving a significant amount of capital sidelined. According to the QCP Capital note, as positioning rebuilds, volatility is likely to return, but direction remains uncertain.
Asia Accumulates as the US Sells
That uncertainty is playing out unevenly across regions. Laser Digital described the past week as exhibiting the usual holiday lull.
However, what stood out was a clear divergence in time-zone performance. Bitcoin and Ethereum both fell more than 3% during US trading hours, only to recover during Asian sessions.
The Laser Digital investor note attributed the pattern largely to year-end tax harvesting in the US, noting that crypto has underperformed most global assets this year. The result has been steady American selling pressure offset by overseas accumulation.
Despite the lull in market activity, Messari analysts have highlighted how crypto is being integrated at the highest institutional levels. Stablecoin supply is at an all-time high, and regulators are openly discussing on-chain market infrastructure.
“Yet it has almost never felt worse,” Messari’s end-of-year analyst note said, pointing to a growing disconnect between sentiment and reality.
Why Bitcoin Lagged in 2025
Bitcoin’s underperformance relative to gold and equities in late 2025 has raised doubts about its “digital gold” narrative. Gold is up over 60% year-to-date, equities are at record highs, and Bitcoin remains slightly negative.
Messari argues the weakness is not structural, but supply-driven.
Older, large-balance holders have been net sellers throughout 2025, taking advantage of deeper institutional liquidity. Earlier this year, Galaxy Digital facilitated the sale of 80,000 BTC from a single Satoshi-era investor. On-chain data shows addresses holding between 1,000 and 100,000 BTC have distributed hundreds of thousands of coins year-to-date.
At the same time, two major demand engines slowed. Digital Asset Treasury inflows weakened in October, and spot Bitcoin ETFs, previously consistent buyers, have turned into net sellers.
The market has been forced to absorb rising supply just as steady inflows paused.
Messari does not see this as a permanent impairment. “When in doubt, zoom out,” the analysts said, emphasizing that Bitcoin has endured longer and deeper relative drawdowns in past cycles before reasserting itself.
The 2026 Bitcoin Price Framework
Looking ahead, Messari argues that Bitcoin should no longer be analyzed through a simple four-year cycle lens. As a macro asset, its performance will increasingly hinge on broader forces, monetary policy, institutional allocation, and sovereign balance sheet decisions.
Still, Messari analysts see clear price frameworks emerging in 2026:
$86,000–$90,000 remains a critical structural support zone, reinforced by spot buying and reduced downside hedging demand.
$94,000 is the key upside trigger. A sustained break above this level could activate gamma-driven buying and reprice 2026 call options higher.
$100,000–$110,000 represents the next major psychological and structural resistance zone, where profit-taking from legacy holders may re-emerge.
Beyond that, a renewed institutional inflow cycle, via ETFs, corporate treasuries, or sovereign accumulation, would be required to sustain a move toward new all-time highs in 2026.
Long-Term Conviction Remains
Despite short-term frustration, Messari analysts remain firm on Bitcoin’s trajectory.
“Bitcoin has firmly established itself apart from all other cryptoassets and is undoubtedly the leading form of cryptomoney,” analysts wrote.
Bitcoin continues to outperform nearly every major token over multi-year horizons, driven by sustained institutional demand. Spot ETFs, led by BlackRock’s IBIT, have reshaped market structure, while nearly 200 companies now hold Bitcoin on their balance sheets.
Looking into 2026, Messari’s confidence rests on first principles. In a world of rising government debt, financial repression, and declining real yields, Bitcoin’s predictable monetary policy, self-custody, and global portability remain unmatched.
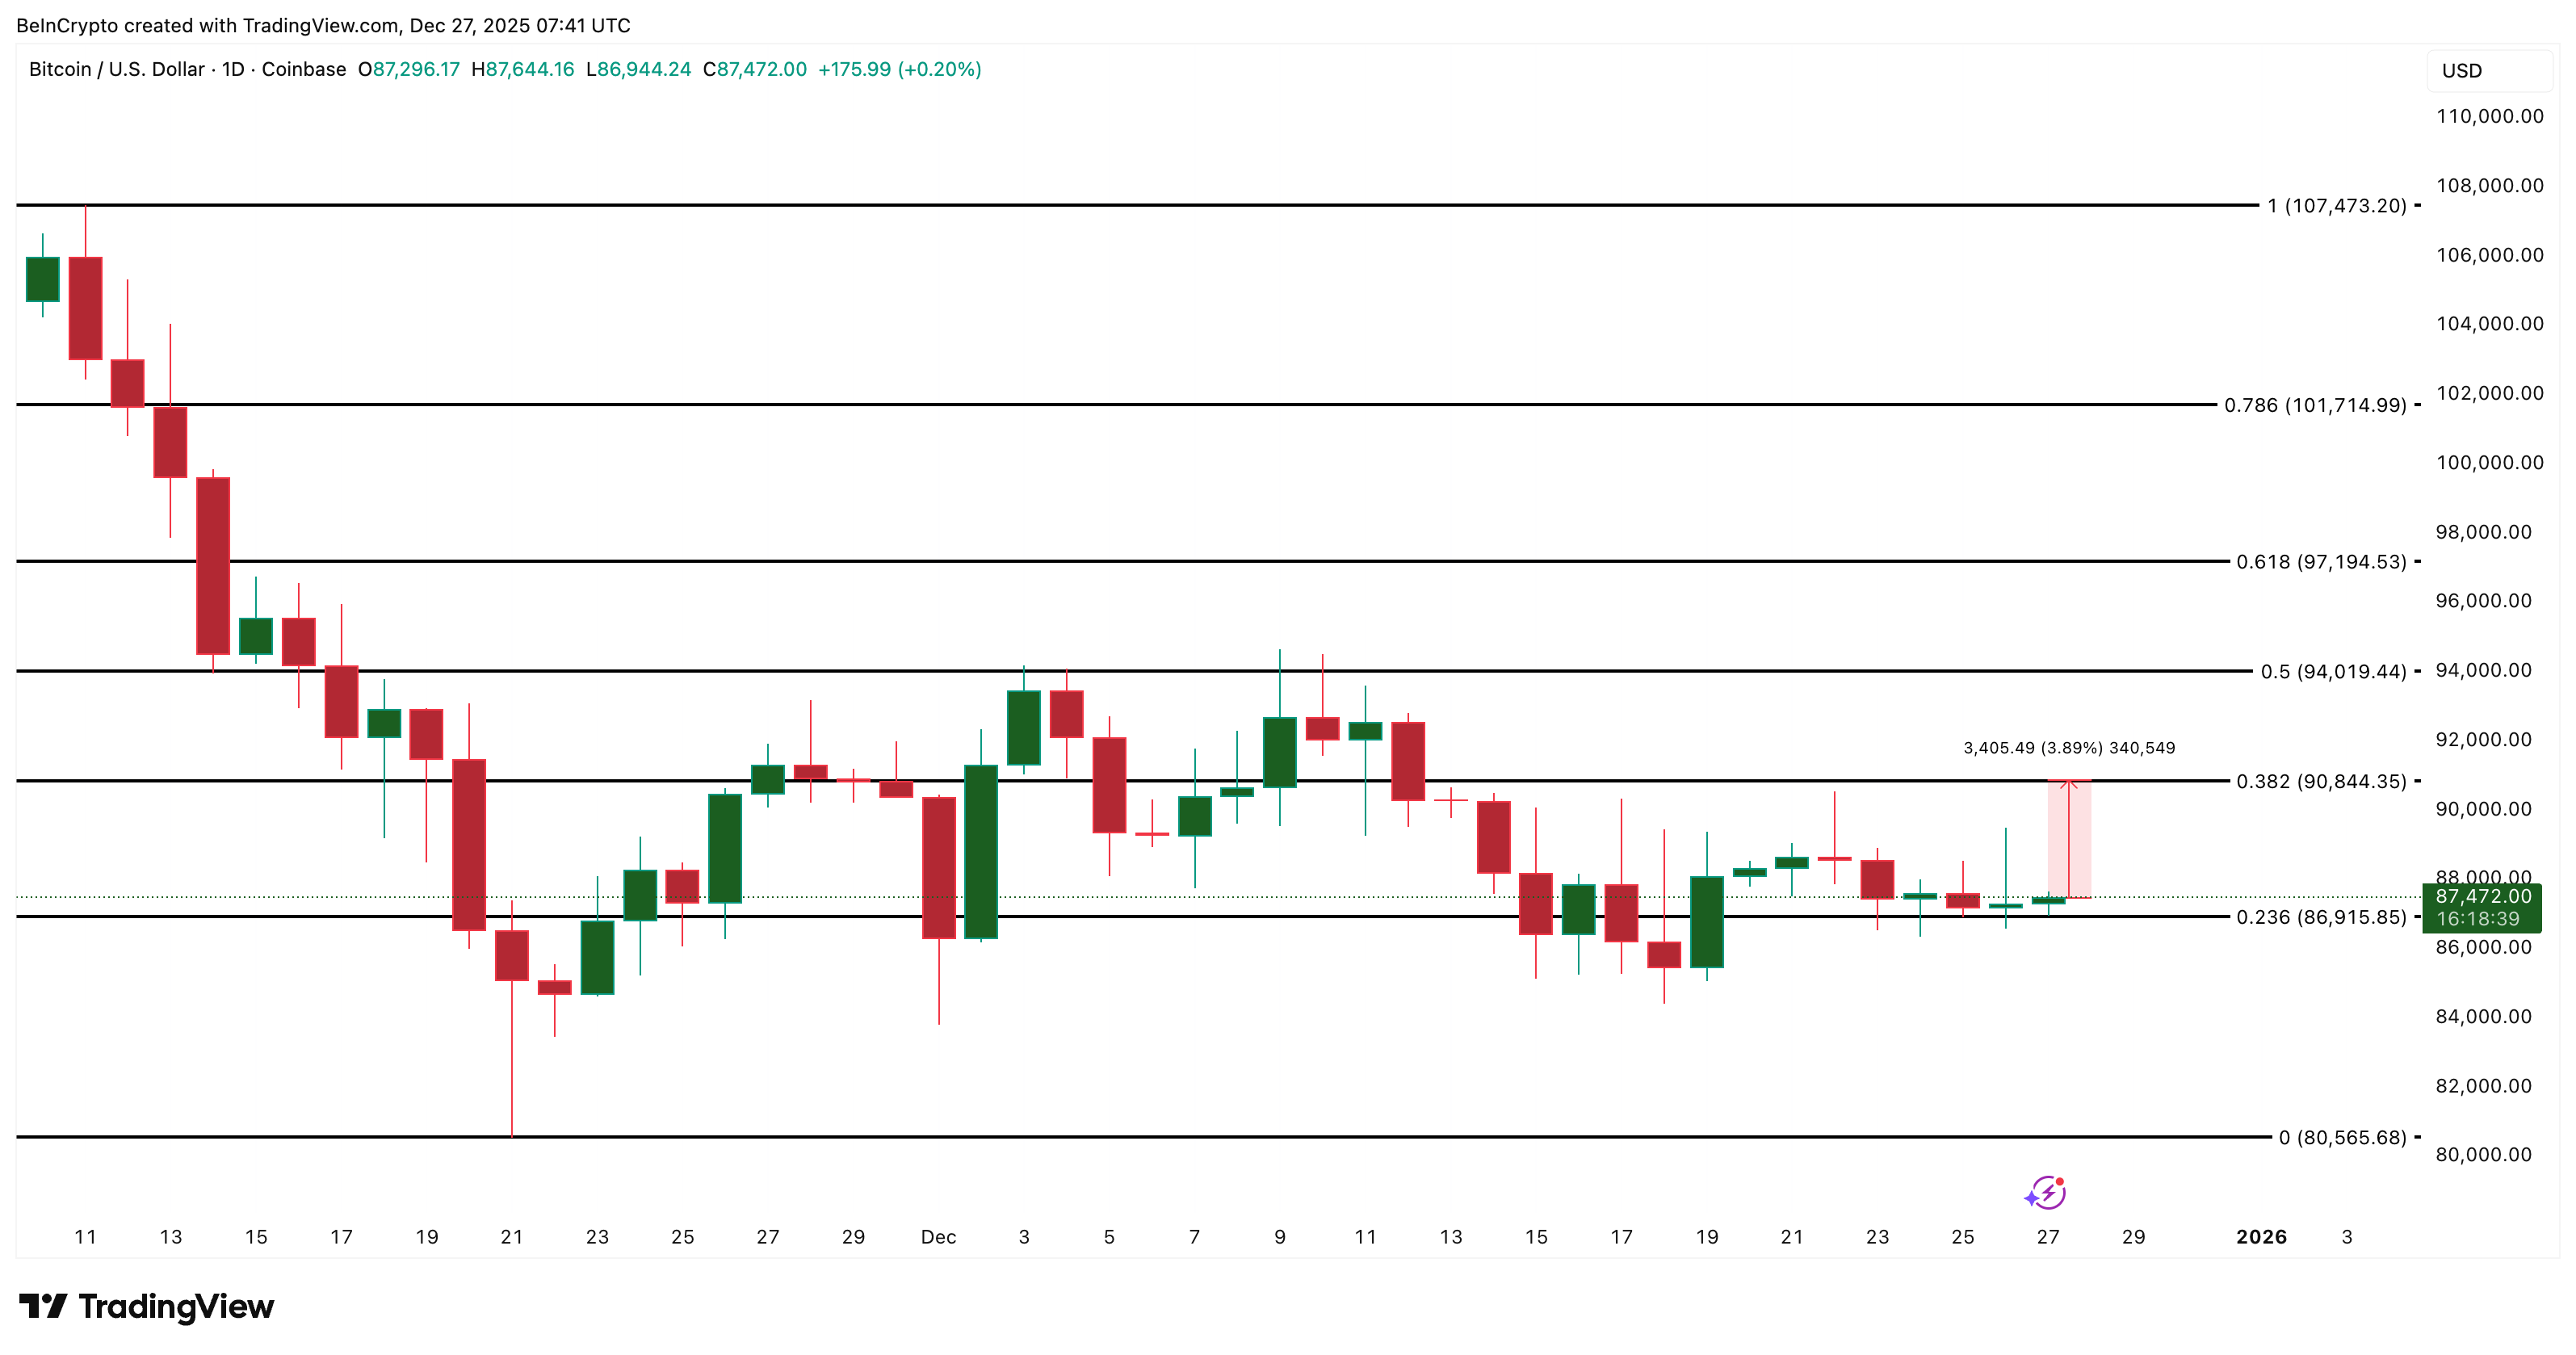
Since the start of 2025, Bitcoin has not closed a monthly candle below $80,000. This level has therefore provided critical and solid support so far.
However, signals from the Coinbase Premium Index are threatening this support. Analysts still see reasons for optimism even if the level breaks.
The Bitcoin Coinbase Premium Index Hits Its Lowest Level Since February
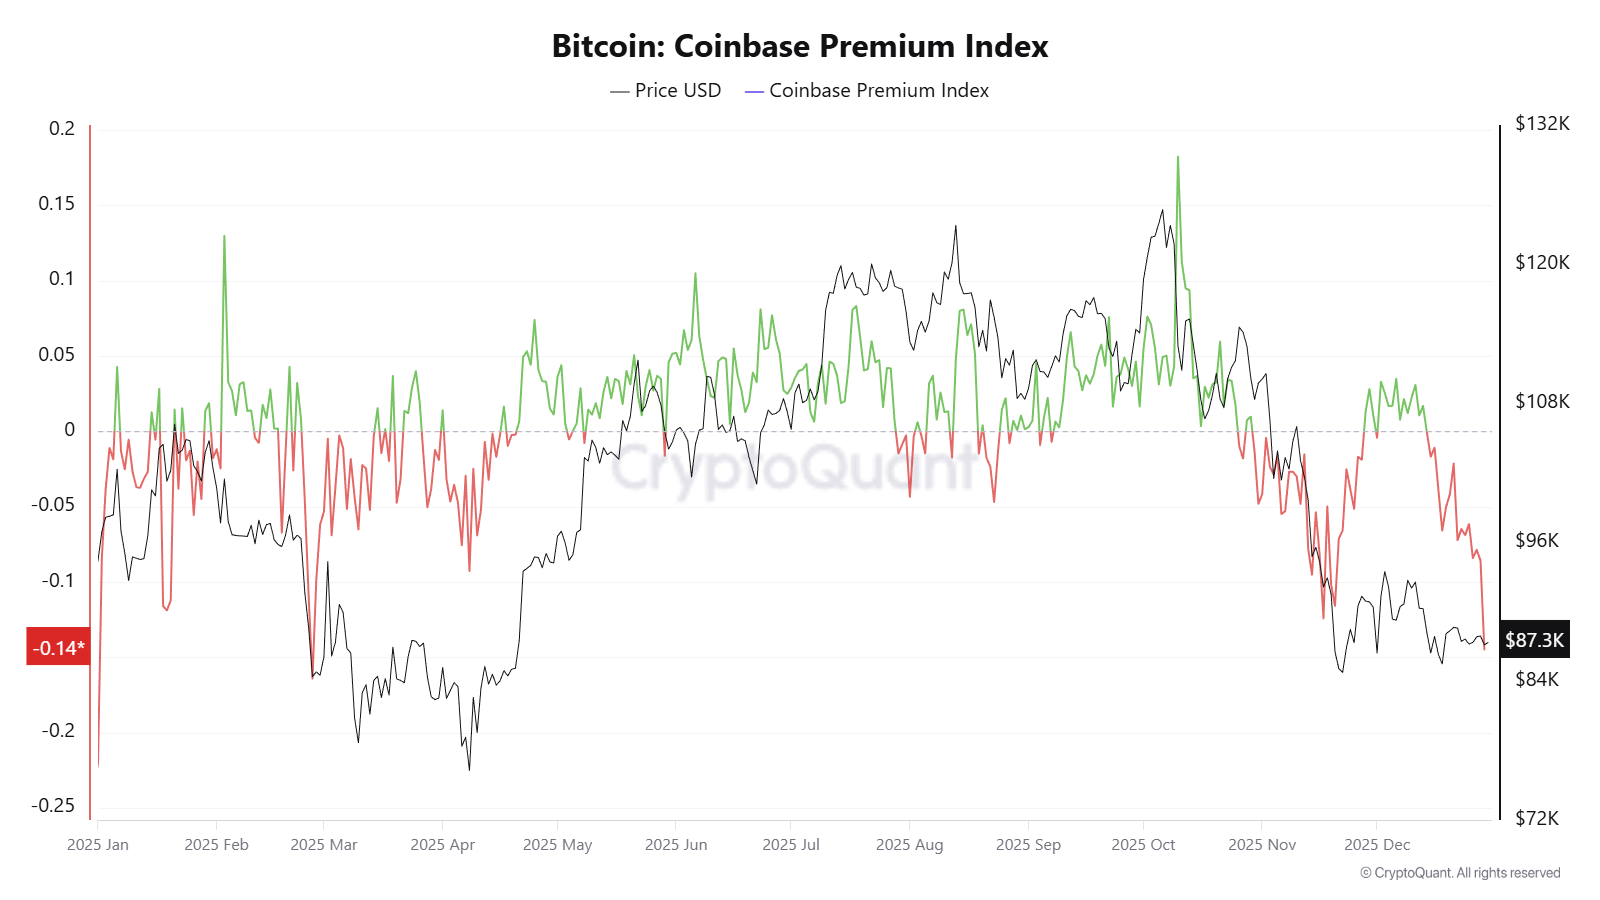
The Coinbase Premium Index measures the price difference of Bitcoin between Coinbase (US) and Binance (international). It often reflects buying demand from US institutional investors.
When the index turns negative, it signals stronger selling pressure from the US. This pressure contributes significantly to BTC price declines.
CryptoQuant data indicates that as of December 30, the index stood at -0.14. This marks the lowest level since February.
The index stayed negative for 16 consecutive days in December. During this period, Bitcoin failed to close a weekly candle above $90,000.
As a result, analysts believe that Bitcoin may not have yet formed a bottom. Selling pressure from US investors shows no clear sign of stopping.
“The biggest indicator of a local bottom will be when the Coinbase premium returns,” investor Johnny said.
A similarly sharp drop in February caused Bitcoin to break the $80,000 support level. The price rebounded quickly afterward.
Therefore, the current deep negative reading may point to a similar scenario.
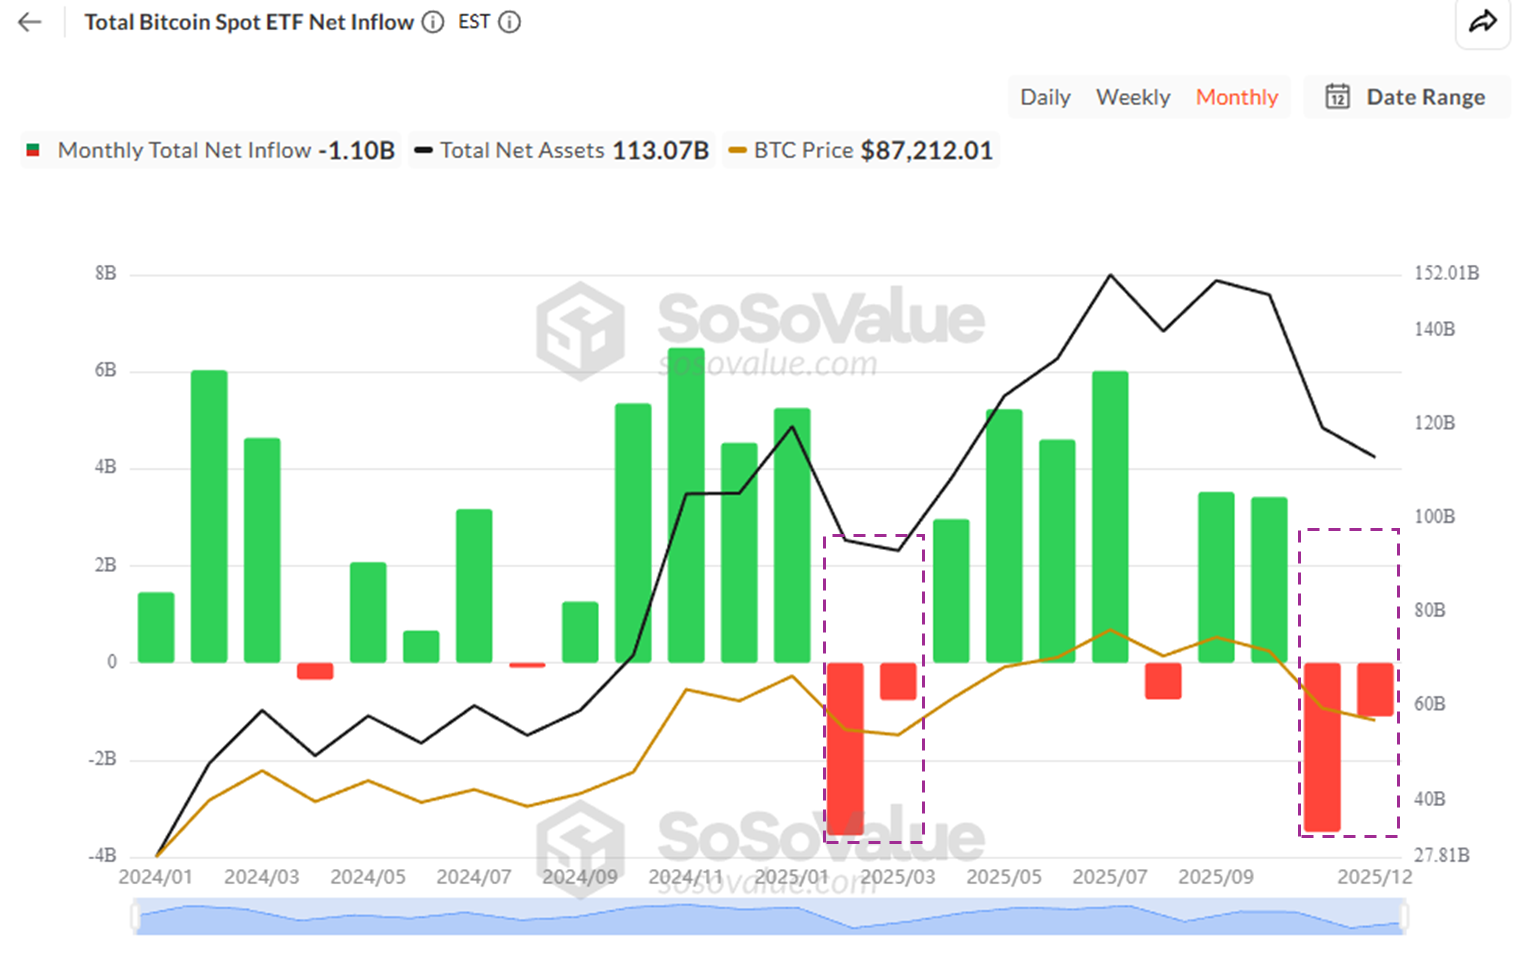
Additionally, December saw negative ETF flows for the second consecutive month. However, ETF outflows in December declined significantly compared with the previous month.
Patterns from February and early March 2025 show a similar phenomenon. This may reflect continued selling by US investors, but at a weaker pace than before.
This situation creates conditions for Bitcoin to recover. A rebound could occur even if the price temporarily breaks below $80,000.
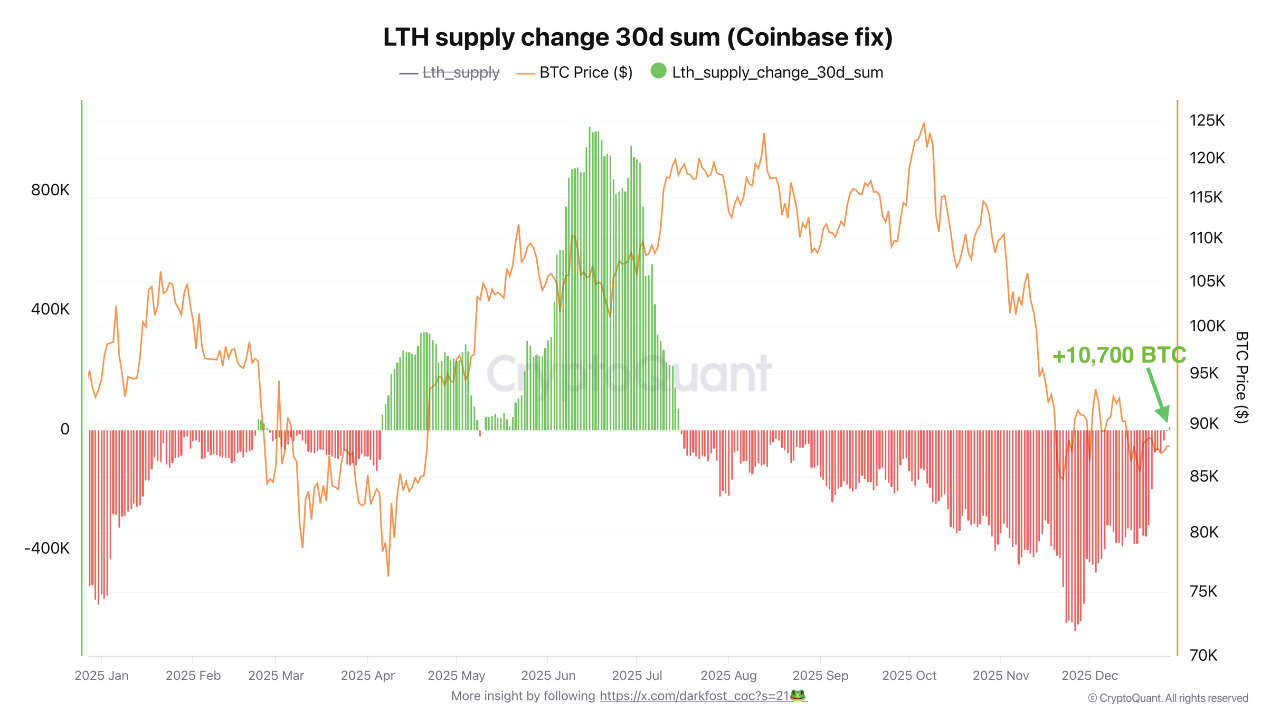
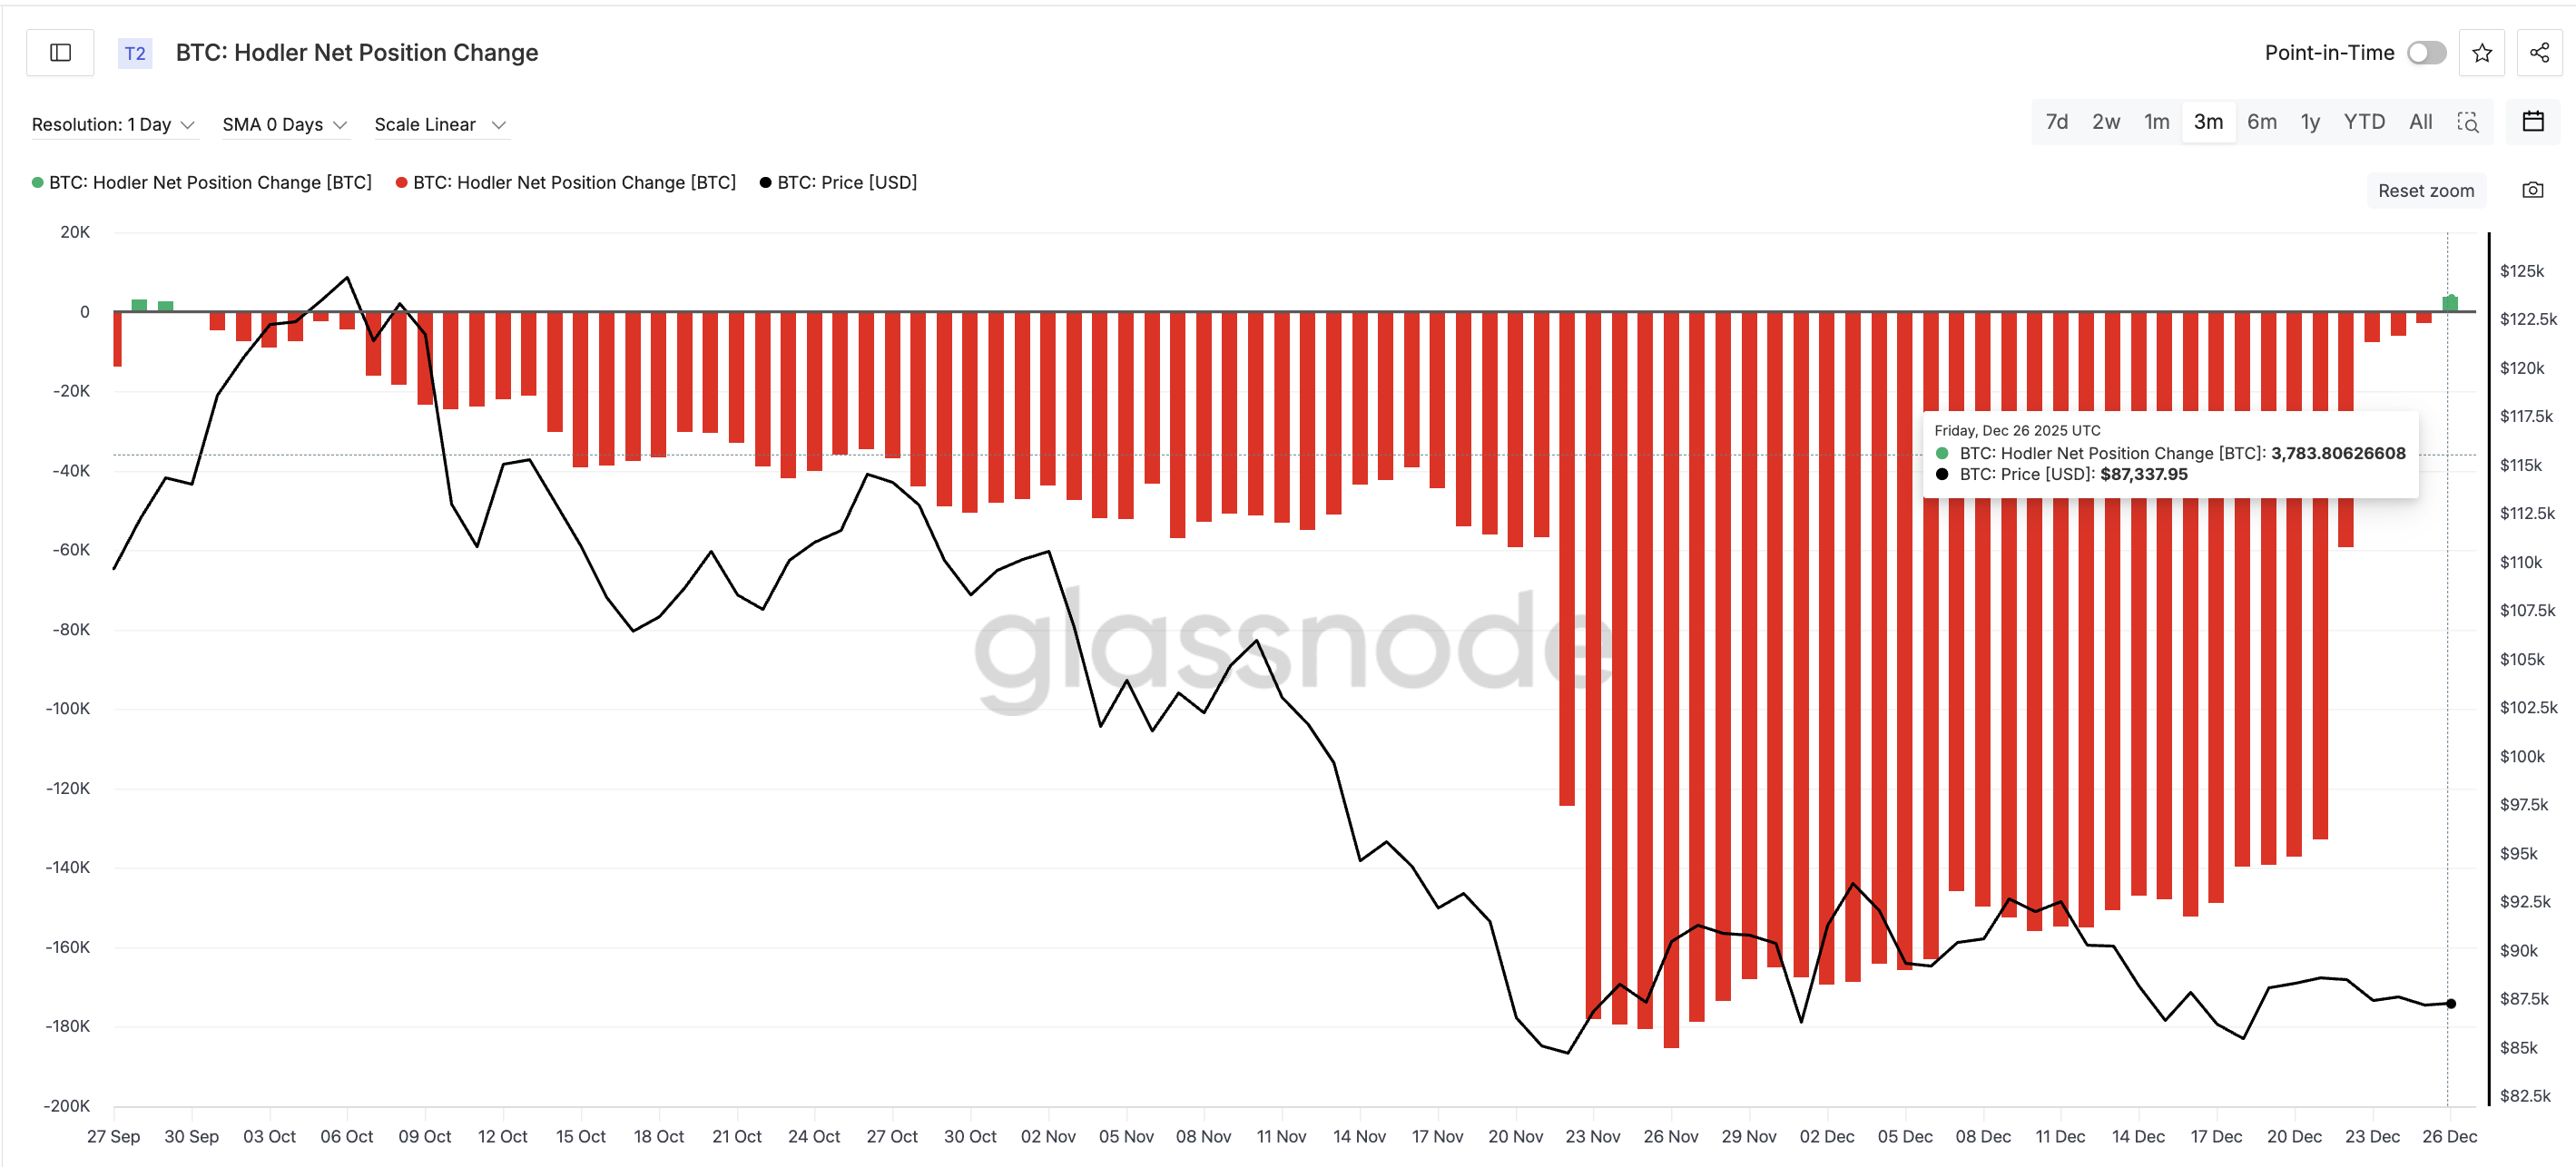
Meanwhile, long-term holders (LTHs) have reduced selling pressure. Their supply has started to increase again.
CryptoQuant data shows that LTH supply shifted from distribution to accumulation in late December. Around 10,700 BTC moved into long-term holding status. This marks the first positive signal from LTHs since they stopped selling in July.
“For now, this remains a very modest change, but it is not insignificant…Historically, such shifts often precede consolidation phases or even bullish recoveries, depending on broader trends.” analyst Darkfost commented.
In summary, the Coinbase Premium Index remains at record lows, and ETF outflows persist. However, signals from long-term holders provide some hope. BTC could break below $80,000 if selling pressure continues. Still, a rebound could emerge at any moment.
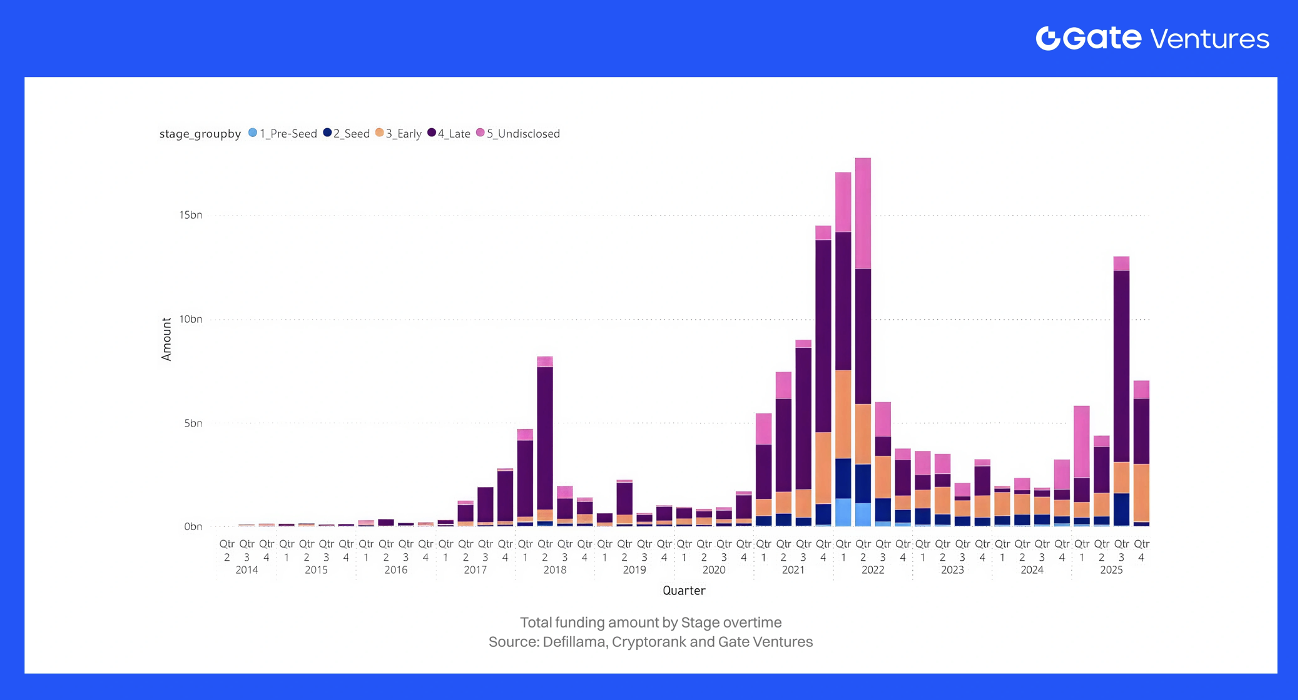
2025 wasn’t a “bull-market reset”—it was a quality-driven recapitalization. Funding surged to $30B+ YTD by Q4(with ~$13B in Q3) after the 2024 trough (~$9B), but deal count didn’t expand meaningfully, implying larger, more selective checks and a fat-tail headline.
Investors crowded into compliance-ready rails—payments/stablecoins/RWA, infrastructure, regulated trading, and info markets—while consumer narratives stayed lighter. Geography is turning multipolar, with clearer licensing hubs pulling weight outside the U.S. What matters next: where the new “default” institutional stack is forming—and who controls distribution in 2026
1. Total Capital Invested and Deal Count
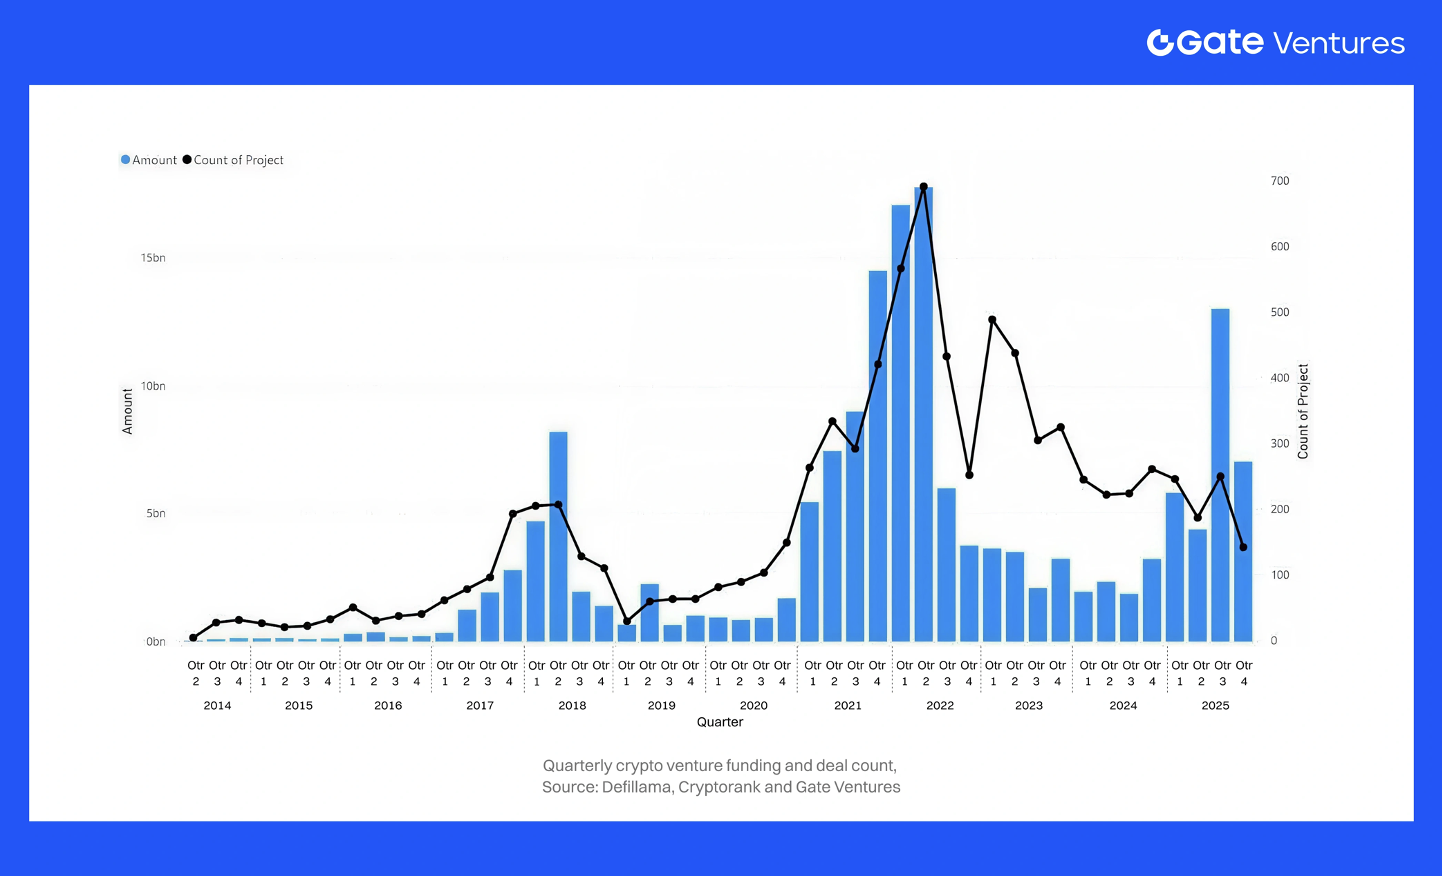
Crypto venture funding hit a cyclical low in 2023 and then rebounded strongly in 2024–2025.
In 2023, venture investors deployed roughly $12B into crypto startups – a –72% drop from 2022’s total as the frothy valuations of 2021–2022 gave way to bear-market caution. About 1,500+ deals were closed in 2023. In 2024, the market entered a clear trough. Total crypto VC investment fell to $9B in 2024 (-28% YoY decrease from 2023), and deal count fell slightly to ~952 deals for the year. Funding accelerated particularly in H2 2024 – for example, Q4 2024 saw $3.2B across 261 deals, a 46% jump in capital from Q3 despite a 13% drop in deal count as investors focused on larger bets.
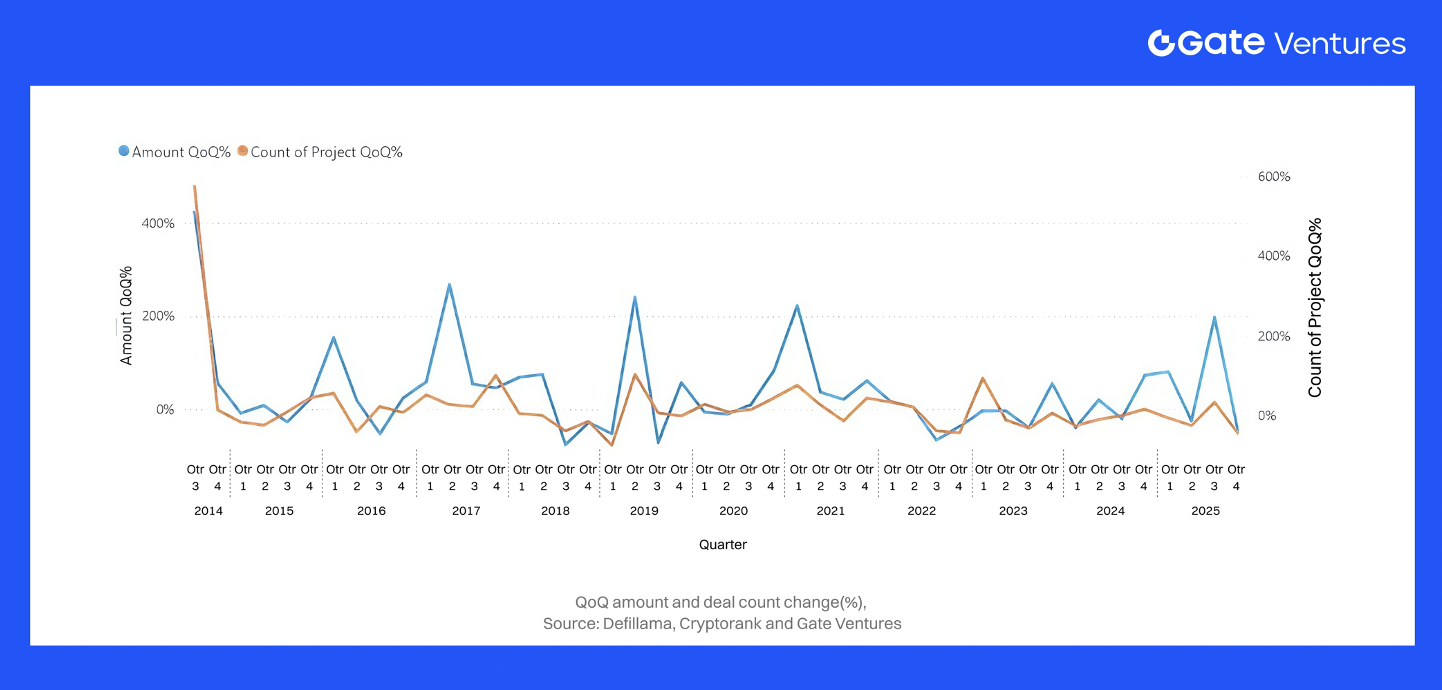
2025 has been marked by a huge resurgence in capital deployment. By Q4 2025, year-to-date funding exceeded $30B, already surpassing 2024’s total by $21B. Quarterly investment hit multi-year highs – e.g.Q3 2025 alone saw ~$13B raised (the biggest quarter since Q1 2022). This was partly driven by a small number of mega-deals, which skewed aggregate averages but did not alter the underlying upward trend. Even so, the underlying trend is positive: excluding outliers, Q1–Q3 2025 funding was still roughly double the same period in 2024. In contrast, deal counts in 2025 have not grown commensurately – in fact, some data suggests deal volumes may have stagnated or declined relative to 2024. For instance, there are ~800+ startup VC deals in 2025 YTD, down ~13%. The average deal size jumped as a result. In short, 2025’s increase in capital was driven by bigger checks rather than more startups funded.
Quarterly momentum: This momentum accelerated into H1 2025:Q1 2025 reached ~$4.8B (highest since Q3 2022), and although Q2 dipped to ~$2.0B (after the Binance boost in Q1), Q3 2025 rebounded ~+47% QoQ to $13B. In other words, by mid-2025 the quarterly run-rate of crypto venture investment was back on par with early-2022 levels.
Mega-deals & skew on averages:
Mega-deals meaningfully distorted headline fundraising figures in 2025, creating a pronounced divergence between mean and median deal sizes. Binance’s $2B round in Q1 — the largest VC transaction in crypto history — accounted for ~34% of the quarter’s $5.8B total.
Late 2025 showed a similar pattern. Polymarket’s $2B raise and Kalshi’s $1B round (at an $11B valuation) will meaningfully inflate Q4 totals. The year also featured $300M for XY Miners, multiple $200M+ rounds across privacy, security, and infrastructure, and numerous $50M–$150M raises spanning L1s, L2s, and fintech. Additional outliers — including Ripple’s $500M strategic round and Bullish’s $1.11B IPO — contributed to a pronounced fat-tail distribution.
These mega-deals lifted average deal size, increased late-stage share, and widened the gap between mean and median. While highlighted for completeness, analysis of medians and ex-mega-deal trends is essential to reveal the underlying market: most deals remain small, even as a handful of ultra-large financings dominate aggregate capital.
Big-picture: Relative to the last cycle’s peak (2021–early 2022), current funding levels remain moderate. At the 2021 peak, crypto startups raised over $36B in a year (2021), fueled by a frenzy of seed deals and lofty valuations. 2022 saw over $44B (front-loaded before the market crash). In contrast, 2023’s ~$12B and 2024’s ~$9B indicate a reset to more sustainable levels.
The 2025 revival – on track to $30B+ – signals that the crypto venture market is climbing out of the winter, but with a very different character: more late-stage focus, more due diligence, and an emphasis on quality over quantity of deals. As we detail below, investors in 2025 gravitated toward certain sectors and stages, backing fewer but stronger projects, and positioning for what many expect to be a next growth cycle in 2026 and beyond.
2. Deal Size Distribution
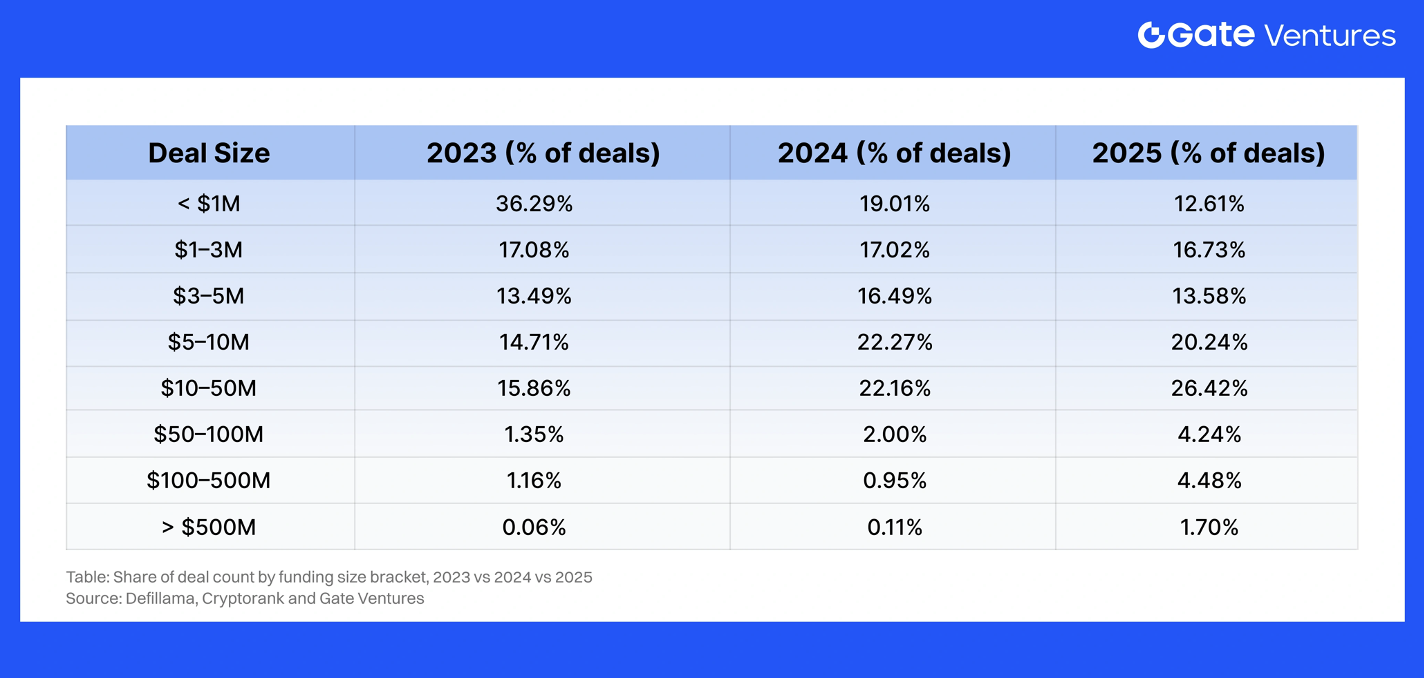
The deal size distribution in 2023–2025 reflects a clear shift toward larger rounds. In 2024, deals under $10M accounted for over 75% of all activity, with the $5–10M bracket alone contributing ~76%. By contrast, in 2025 the < $10M share fell to ~61%, while most growth occurred in the $10–50M and $50M+ segments, producing a more pronounced barbell structure: early-stage activity concentrated in sub-$5M rounds, a thinner $1–5M middle, and a notable rise in large tickets at the upper end.
Several dynamics drove this shift:
Stage correlation: Late-stage rounds accounted for ~45% of total capital (or deal count, specify, while early-stage rounds (Seed–Series A) remained mostly under $10M. By Q3 2025, ~10% of all deals exceeded $50M (vs. ~8% in 2024), signaling the return of large-check deployment.
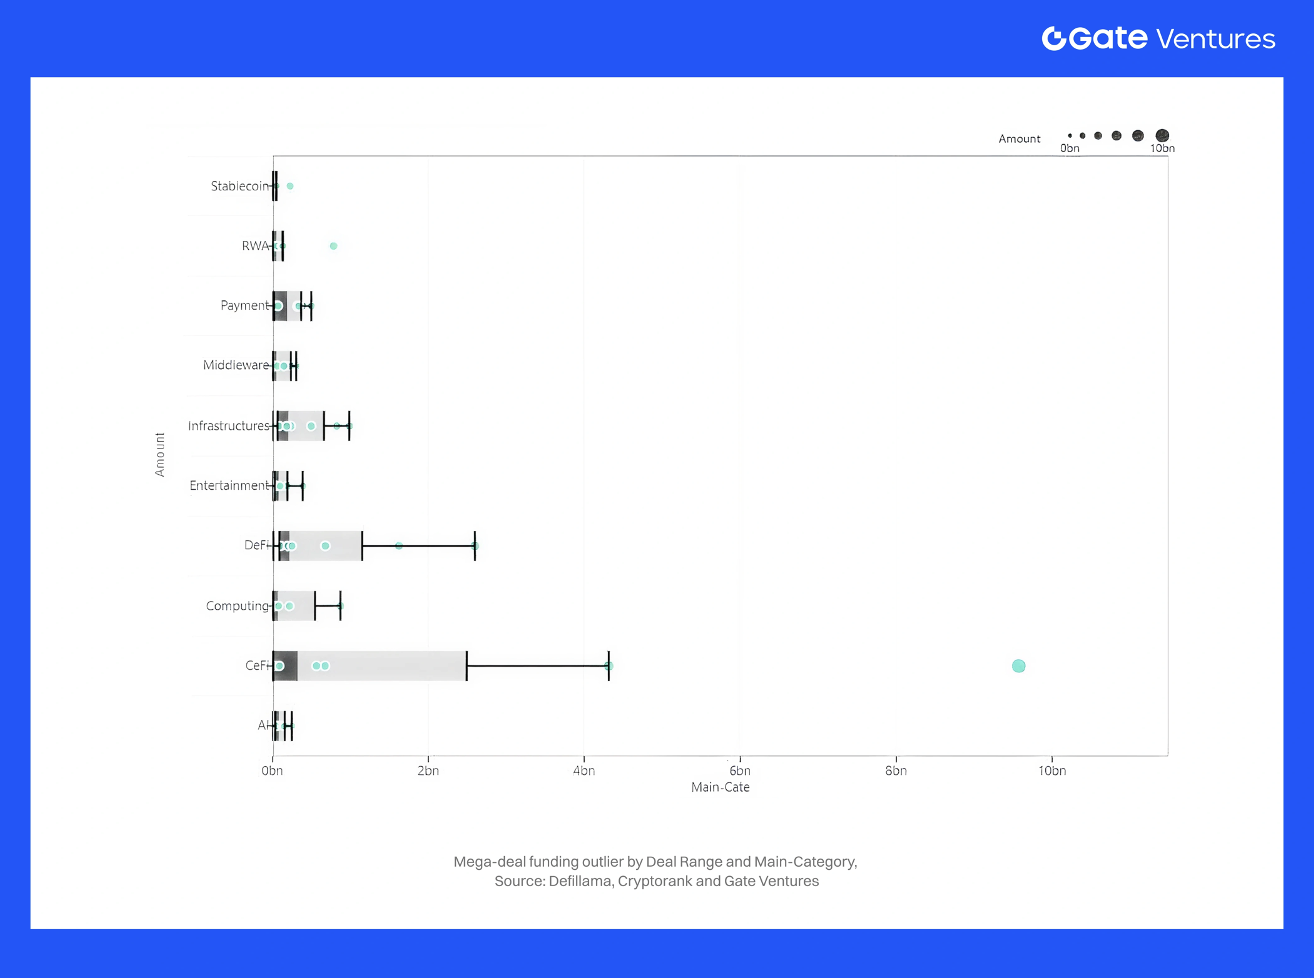
Category correlation: Mega-rounds clustered around CeFi and infrastructure — exchanges, brokers, and core blockchain systems frequently raised $100M+. Meanwhile, Entertainment and gaming/NFT projects remained in the lower brackets, typically sub-$5M.
Investor correlation: Sub-$1M micro-rounds came primarily from angels and niche crypto funds, with fewer accelerator-led deals in 2025. Mega-rounds, in contrast, were led by large TradFi institutions and corporate VCs.
Overall, the market has bifurcated: most deals remain under $10M, but a small set of $50M+ and $100M+ rounds captures a disproportionate share of total capital, shaping the aggregate statistics despite representing a minority of transactions.
This comparison underscores the growing polarization in deal sizes – 2025 had relatively fewer mid-sized rounds and proportionally more very large rounds than prior years. For venture investors and startup founders, this means the fundraising market has become “go big or stay small”: substantial capital is available for top-performing later-stage projects, while early-stage teams face more competition for smaller checks.
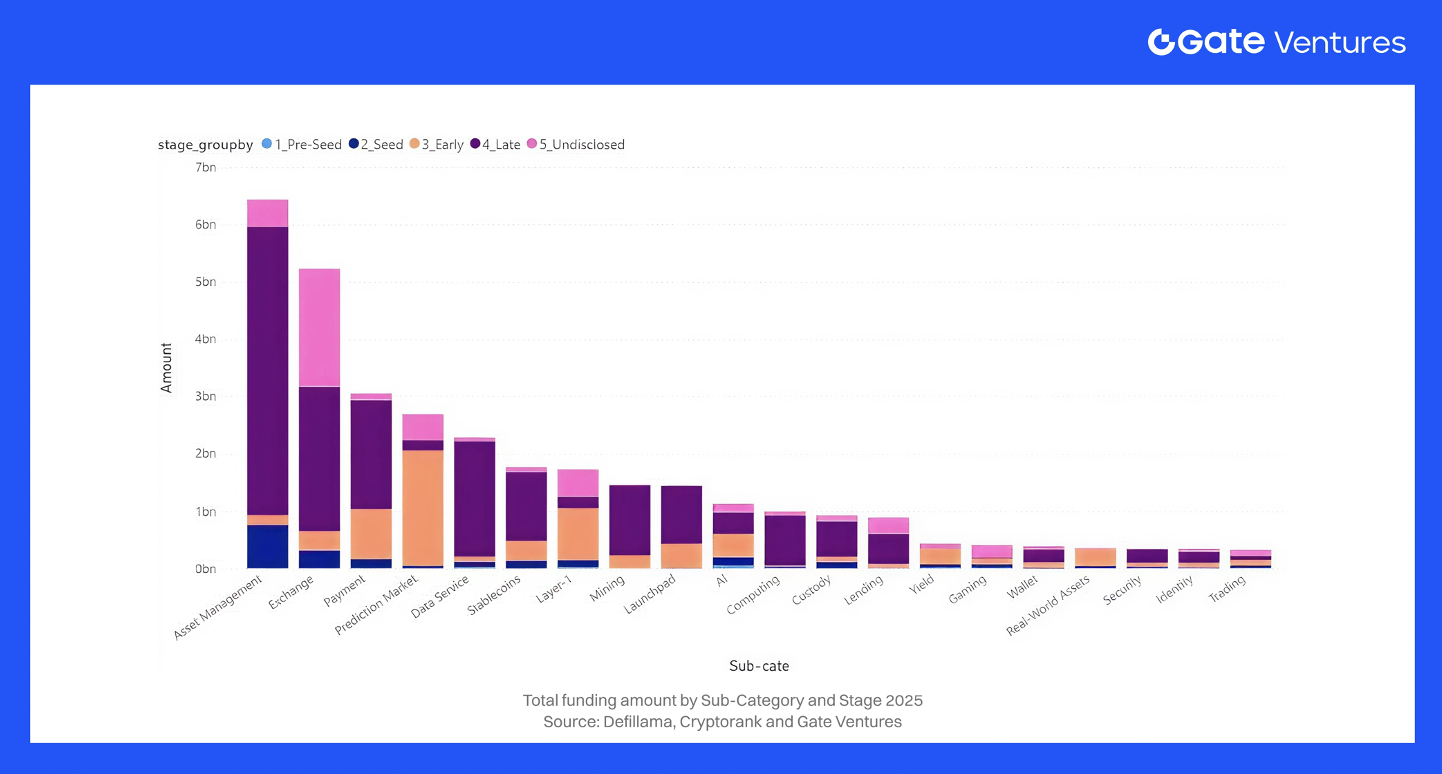
3. Fundraising by Stage (Pre-Seed, Seed, Early-Stage, Late Stage, Undisclosed)
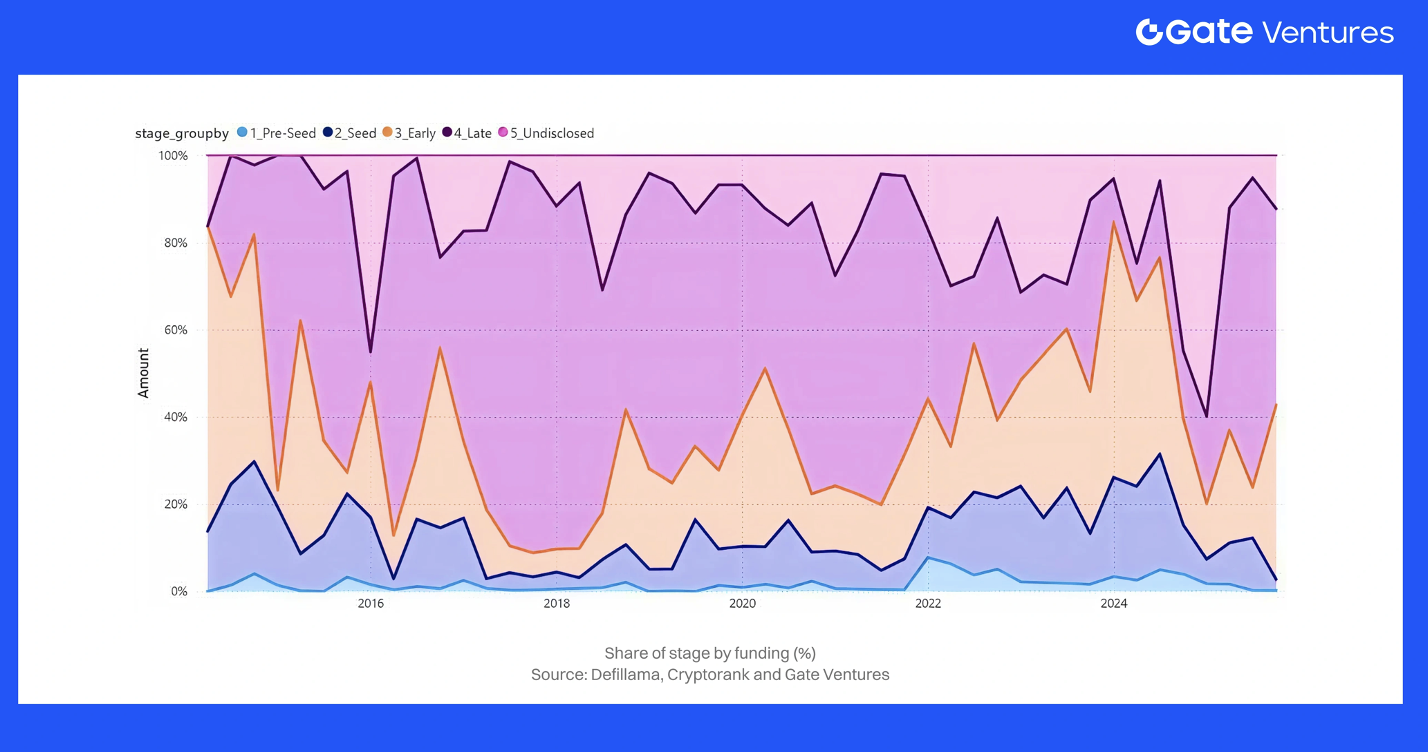
Crypto funding stages shifted sharply from 2023 to 2025. In the 2022–23 downturn, late-stage rounds nearly vanished, leaving 2023 dominated by Pre-Seed, Seed, and occasional Series A deals. By mid-2025, the landscape reversed: Series B+ rounds captured the majority of total capital, while early-stage activity remained the core driver of deal count. As confidence returned, undisclosed-stage raises declined.
Pre-Seed
Pre-Seed deal share stayed surprisingly high in 2023–2024, even rising slightly in 2024—evidence of steady founder activity despite market stress. These rounds were very small in dollar terms, contributing only a few percent of total capital, often involving DAO grants or accelerator-style raises. Crypto-native funds continued backing pre-seed teams for low-cost optionality, keeping this pipeline consistently active.
Seed
Seed activity remained steady across 2023–2025 but with smaller checks than the 2021 cycle. Roughly 65% of 2023–2024 deals were under $5M, reflecting Seed/Seed+ norms. Median seed size gradually improved (~$2.5M → ~$3M), showing modest appetite recovery even as seed’s share of total capital fell with the return of larger rounds. In 2025, seed raises became somewhat easier but required stronger traction or technical proof, replacing the idea-stage momentum of 2021.
Early-stage (Strategic – Series A)
Early-stage was constrained in 2023, as few 2021–22 projects were healthy enough to raise full rounds. Conditions improved in 2024, with median early-stage rising ~26% to ~$4.8M and most rounds falling in the $10–50M range. By 2025, early-stage accelerated as bear-market builders matured. Many early-stage rounds—especially in infrastructure and DeFi—moved into the $10–50M range. Early-stage still dominated deal volume (>24% of all deals), but its share of total capital dropped to ~48%, overtaken by late-stage deployment.
Late Stage (Series B+)
Late-stage funding nearly vanished in 2022–2023, when post-unicorn failures pushed growth investors to the sidelines. Late-stage accounted for only ~10–15% of 2023 capital. Momentum returned in 2024: by Q4, Series B+ represented ~40% of quarterly capital. The full rebound arrived in 2025—over half of H1 2025 capital flowed into late-stage, though highly concentrated: a dozen to two dozen deals formed most of this 52% share. Early-stage remained high in volume, but late-stage rounds dominated dollars.
Undisclosed / Unknown Stage
In 2023, many companies avoided stage labels to mask down-rounds or bridge financings, creating a large “Undisclosed” category. As sentiment improved in 2024–2025, founders returned to standard labeling, reducing opacity. Strategic rounds—especially from exchanges—still appeared but were classified as late-stage due to size. Overall, 2025 featured far fewer undisclosed rounds, reflecting a healthier and more transparent market.
Stage Skew & Rationales
The stage rotation from 2023 to 2025 reflected clear market dynamics. In 2023, investors avoided late-stage risk, concentrating on early-stage rounds where valuations were low and bridge extensions could be raised discreetly. Late-stage funding fell to ~10–15% of total capital, and Series A/B compressed into small “extension” rounds.
As sentiment improved in 2024–2025, growth rounds reopened. By Q2 2025, 52% of capital flowed into later-stage deals, supported by regulatory clarity and stronger business fundamentals. Average late-stage check sizes remained stable ($6.4M → $6.3M from 2023 to 2024), while early-stage averages rose to $4.8M, signaling renewed confidence—before 2025’s mega-rounds pushed overall averages sharply higher.
Crucially, early-stage didn’t weaken. Crypto-native funds maintained pre-seed and seed activity through 2023–2024 and shifted to a barbell strategy in 2025: active pre-seed pipelines paired with concentrated late-stage deployment. Series A/B, thin in 2023, expanded again in 2025 as maturing bear-market builders returned to market.
In essence: 2023 = early-stage survival, 2024 = first late-stage rebound, 2025 = full late-stage comeback, with 2026 likely more balanced if macro conditions allow.
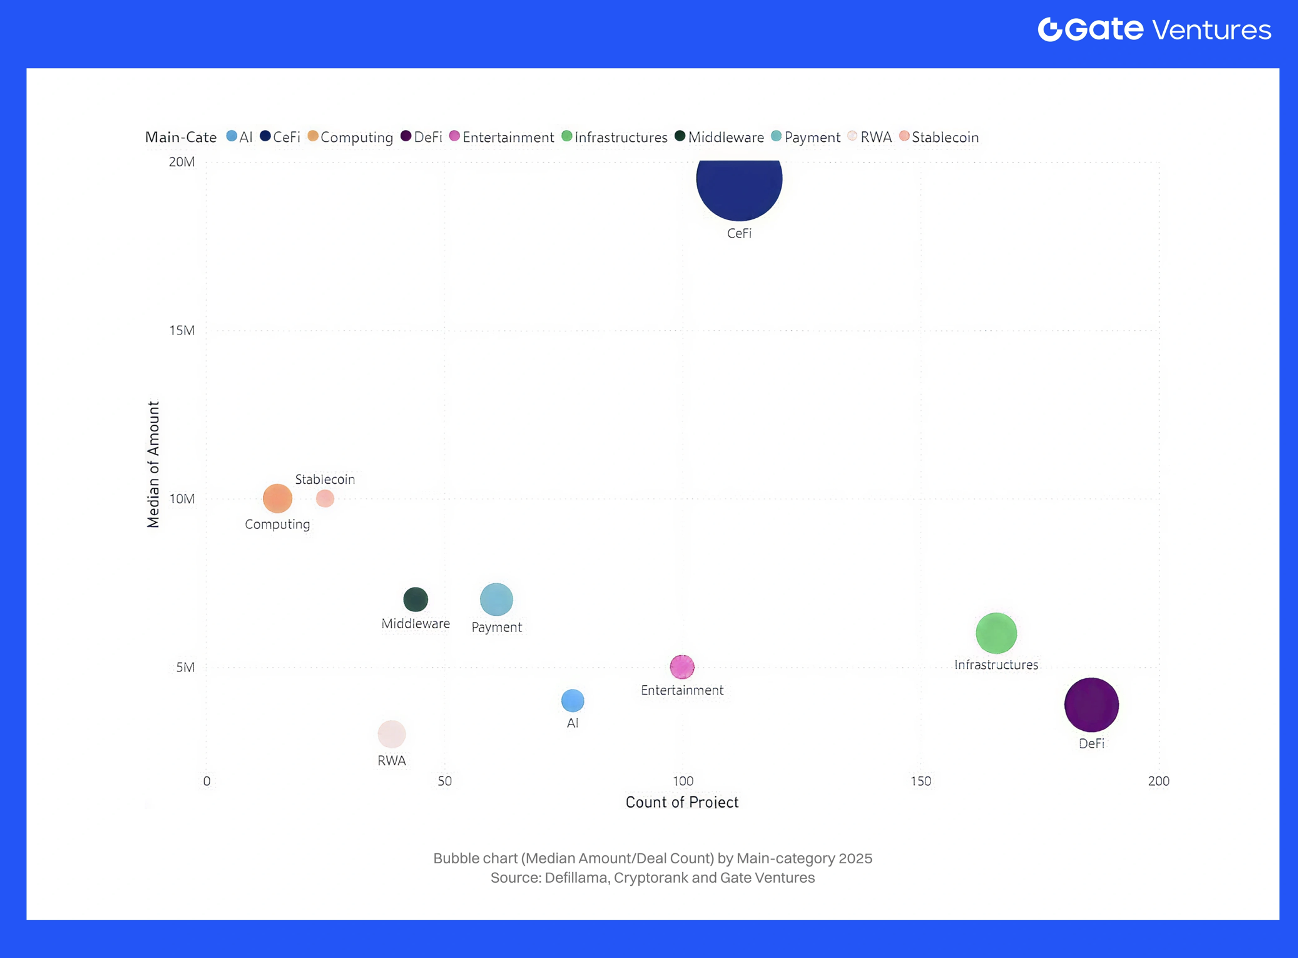
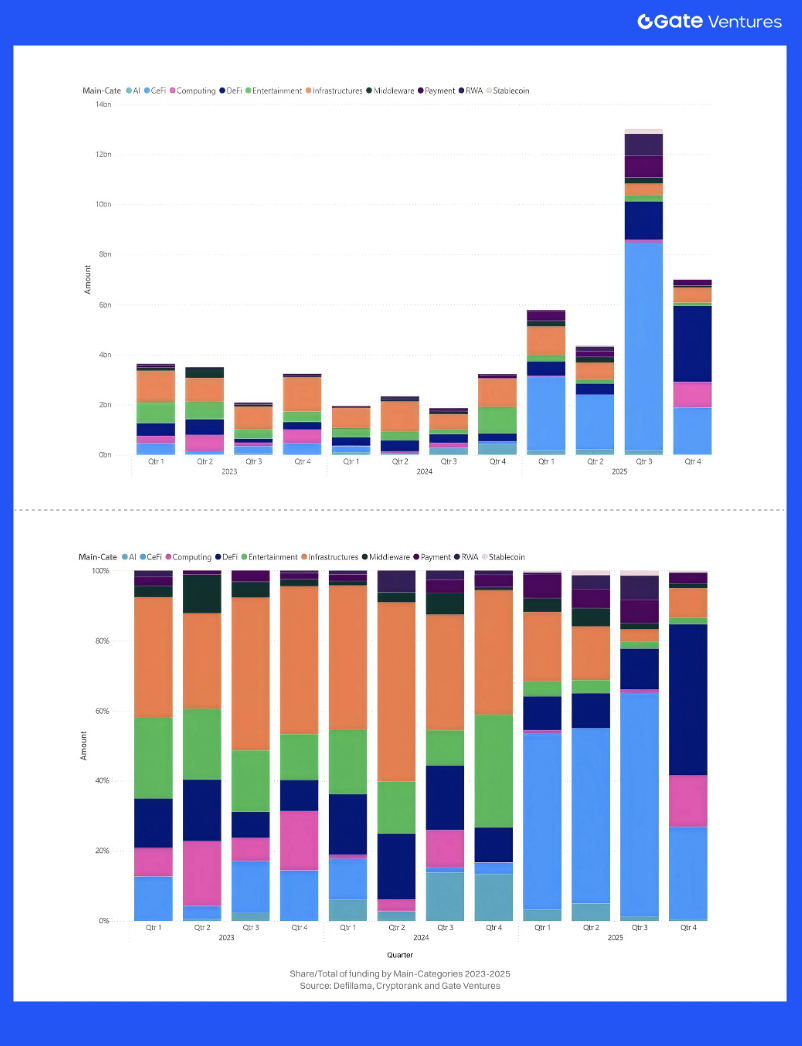
4. Fundraising by Categories (Main-Categories) & Sector (Sub-Categories)
4.1.Main Categories:
Over the past three years, investor sector preferences have rotated significantly, mirroring the changing narratives in crypto. In the 2021 bull, hot areas were DeFi protocols, NFTs/Gaming, and Web3 consumer apps, while by 2023–24 many of those fell out of favor, replaced by focus on core infrastructure, financial plumbing (stablecoins, custody), and new themes like real-world assets (RWA) or AI+crypto. The data shows clear shifts in which main categories (broad sectors) attracted the most capital in 2023 vs 2024 vs 2025:
CeFi
CeFi hit its post-FTX low point in 2023: most raises were distressed, sector share collapsed, and CeFi fell from 2021’s top-funded vertical to the bottom. A mild recovery began in 2024, led by regulated exchanges in Asia/Middle East and improving U.S. sentiment after the late-2024 pro-crypto Congress. In 2025, CeFi re-entered the market with a few headline rounds, most notably Binance’s $2B raise, which significantly inflated H1 totals. Excluding this outlier, CeFi remained smaller than DeFi but clearly rebounding, with capital concentrating in compliance-aligned, institutional exchanges. Examples include EDX’s $85M raise (2023)during a weak market. Overall, CeFi bottomed in 2023 and began a gradual, regulation-driven recovery through 2024–2025.
DeFi
After the 2020–21 boom, DeFi cooled in 2022–23 as token prices fell, but remained a core category. 2023 funding centered on infrastructure-like DeFi (DEX aggregators, liquidity providers, risk tools) while speculative tokens faded. Narratives shifted in 2024 toward real yield and TradFi integration, pushing DeFi/financial infrastructure to the top-funded category in several market reports. Momentum accelerated in 2025: DeFi-related startups led all categories with $6.2B in H1, driven by stablecoin issuers, institutional DeFi, and financial infrastructure. Round sizes increased as institutional demand for compliance, revenue-generating protocols grew (derivatives, KYC pools). DeFi dominated deal count in 2023–24 with small rounds; larger checks only returned in 2025—partly on the back of major stablecoin deals. Funds like Pantera, Dragonfly, and Multicoin remain bullish heading into 2026.
Infrastructure
Infrastructure was a top-funded category across 2023–2025. With application hype fading in 2023, capital rotated into L1s, L2 scaling, interoperability, dev tooling. Strength carried into 2024, where infra/Web3 saw +33.5% QoQ in Q4 2024, reaching $592M (16% of capital) across 53 deals, ranking #2 by capital and deal count. H1 2025 accelerated further: L1/L2 ecosystems raised ~$3.3B, making infrastructure the second-largest category after DeFi. Mining returned as a sub-sector: a $300M mining deal in Q2 2025 made “Mining” the top category that quarter, amplified by AI-driven compute demand. Themes evolved each year — 2023: scalability/zk-rollups; 2024: modular/app-chains; 2025: identity, compliance, real-world integrations. Infrastructure consistently captured large round sizes, high valuations, and remained foundational heading into 2026.
Payments & Stablecoins
Payments and stablecoins became a standout category from 2023–2025 as real-world utility took center stage. After the 2022 fallout, stablecoins proved the most scalable use case: by Q4 2024, stablecoin businesses captured 17.5% of total funding, boosted by Tether’s major raise. Capital then expanded toward asset-backed stablecoins, payment rails, cross-border infra (e.g., Circle’s Elements acquisition, Ripple’s ecosystem investments). In H1 2025, stablecoin/payment networks pulled in ~$1.5B, reflecting rising adoption and yield-driven demand. VCs backed wallets with embedded payments, merchant integration, compliant processors, and emerging-market issuers.
AI x Crypto
AI–crypto convergence emerged as a real narrative from 2023–2025. Early rounds in 2023 were small (Fetch.ai, SingularityNET, a handful of seed-stage entrants). By 2024, AI+blockchain gained traction but remained minor. Small checks went to ChainGPT, AI marketplaces, and decentralized compute. The category broke out in early 2025 with ~$0.7B raised, its first meaningful capital cycle. Notable deals included Gensyn’s $43M (decentralized compute) and multiple AI-driven trading/security platforms. While retail chased 2024’s meme-AI tokens, VC capital focused on compute, automation, agentic systems, and early infrastructure for decentralized AI. By 2025, AI+crypto grew from near-zero (2022) to a credible niche (~$700M), positioned for stronger expansion in 2026.
RWA (Real-World Assets) & Tokenization
RWA tokenization became a top cross-sector narrative by 2024–2025. 2023 activity was early: Maple Finance pivoted to RWA lending; several pilot programs emerged. Momentum grew in 2024, with projects raising to tokenize bonds, treasuries, ETFs (Ondo’s $10M, Matrixdock, Backed Finance). By 2025, RWA became a core venture theme and a major driver within DeFi/financial infra. Much of H1 2025’s $6.2B DeFi/Infra funding came from RWA-aligned startups: stablecoin issuers, tokenized funds, compliant lending pools, and yield products backed by real collateral. Though datasets rarely separate RWA as a standalone category, it became one of the fastest-growing, institution-ready verticals entering 2026.
Middleware & Others
Middleware (developer APIs, indexers, compliance tools) remained smaller but steady from 2023–2025. Security/compliance startups attracted ~$1.2B in H1 2025, driven by enterprise demand and regulatory requirements. Developer infra (compute/storage: Filecoin ecosystem, Akash, etc.) saw moderate traction. Social/Web3 Social had isolated wins (Farcaster’s $30M, friend.tech clones) but lacked broad PMF, keeping deal share limited.
Entertainment (Web3 Social, NFTs, Gaming)
Once leading categories in 2021, NFTs/gaming collapsed in 2023 as hype evaporated. Throughout 2023–24, most VCs avoided the sector; reports noted gaming/metaverse/NFTs “failed to capture significant attention.” However, Q4 2024 showed a misleading spike: Web3/NFT/Gaming became #1 by deal count (22%) and reached ~$771M (21% of capital) almost entirely due to Praxis’s $525M mega-round. In H1 2025, the sector returned to baseline with ~$0.6B (~5% of total)—mostly early-stage. Many teams pursued token raises instead of equity, further reducing VC visibility. By 2025, interest ticked up slightly (better-quality games, stronger NFT infra), but mainstream VCs remained cautious. High deal count, low capital share: a classic “prove-it” phase.
Category trends show a clear rotation across cycles:
2023: Infrastructure and middleware dominated the sparse funding landscape as investors avoided consumer apps.
2024: Stablecoins and financial infrastructure surged, Infrastructure and Web3 held secondary positions, while entertainment sectors remained quiet.
2025: “Serious” verticals—DeFi (particularly RWA/stablecoin) and Infrastructure (L1/L2)—captured nearly 75% of all H1 2025 funding, while Entertainment (NFTs/Gaming) slid to <5%. AI, RWA, and Security/Compliance became meaningful contributors.
Despite capital concentration in a few power categories, the investable universe broadened. More segments—privacy, identity, AI, decentralized physical networks—attracted funding compared to 2019–20, showing a maturing, more diversified crypto VC landscape.
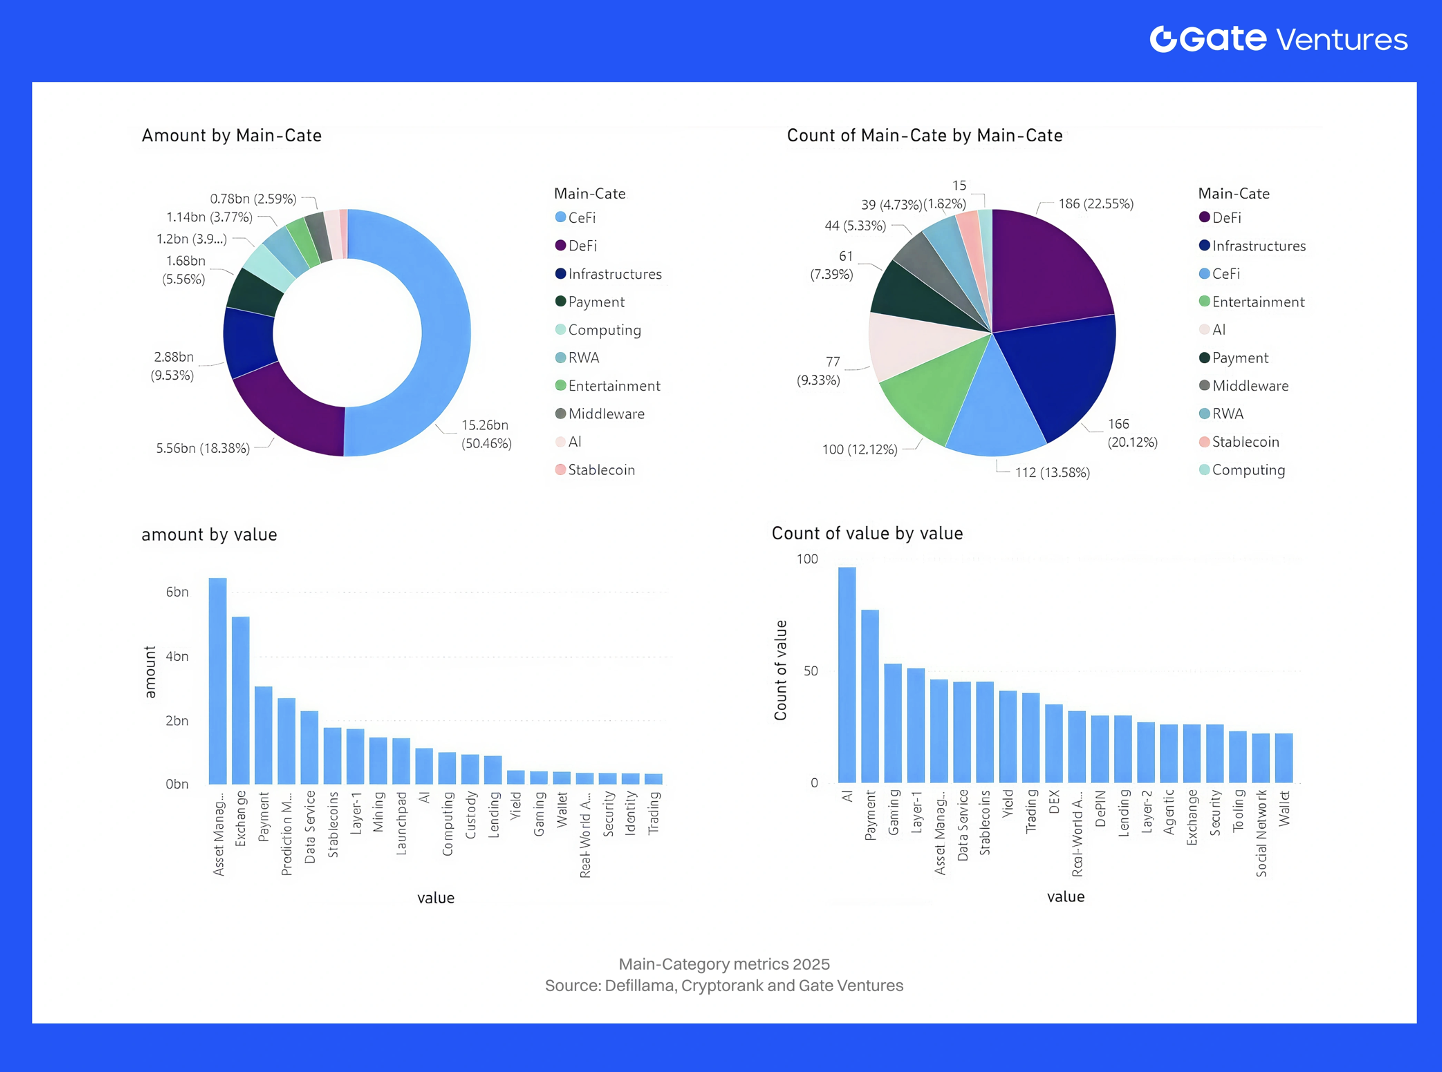
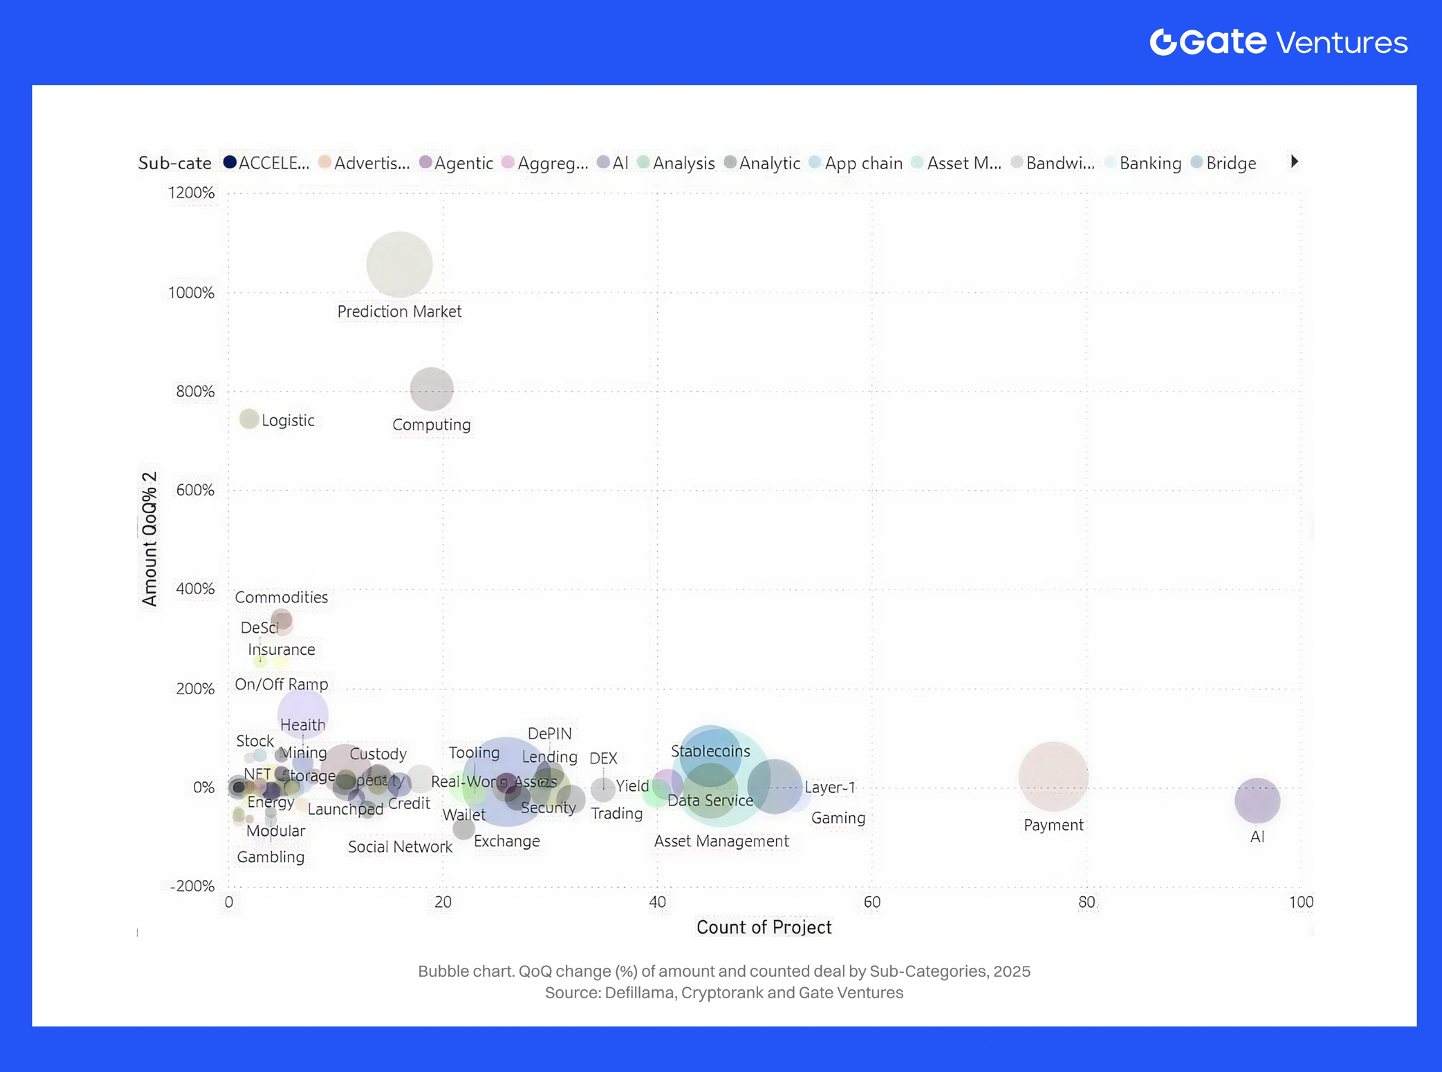
4.2. Sub-Categories and Emerging Narratives
Sub-sector flows from 2023–2025 show capital clustering around a handful of dominant narratives rather than evenly across the market. Across the 20 largest verticals, roughly $33.5B was raised from 2023–2025, with just five categories—Exchanges, Asset Management, Payments, Layer-1, and Prediction Markets—absorbing ~53%. Funding fell from ~$6.1B (2023) to $3.6B (2024) before surging to $20B in 2025 as late-stage and mega-rounds returned.
Exchanges, Launchpads & Trading
Exchange funding vanished in 2023–24 post-FTX, with almost no fresh capital until 2025. The reversal was dramatic: Exchanges raised ~$5.1B in 2025 alone, ~87% in late or undisclosed rounds. Launchpads and trading venues added another ~$2.0B across 2023–25, with $1.5B+ in 2025, mostly late-stage ($50–100M+). Together, the broader trading stack (Exchange + Launchpad + Trading + Data) grew from $0.6B (2023) and $0.4B (2024) to ~$7.8B in 2025, driven by recapitalization of licensed CEXs, token-launch infra, and market-data providers. By 2025, investors were again funding centralized liquidity hubs—only when paired with licensing and compliance.
Asset Management, Custody, Yield & RWA
Asset Management was the #2 sub-category, raising ~$4.35B in 2023–25, with ~$3.8B in 2025 alone. About 60% of this was late-stage, reflecting scaled managers building CeDeFi/RWA portfolios; another 20% remained Seed-stage, showing continued creation of new managers.
Custody added ~$0.48B, Yield protocols ~$0.27B, and RWA platforms ~$0.62B with a balanced Early/Late mix. This cluster raised ~$1.3B (2023) → $0.5B (2024) → ~$4.6B (2025) as tokenized treasuries, credit funds, and yield-bearing stablecoins moved from pilot testing to distribution. Investors increasingly view asset managers + custody + RWA rails as a single structural bet on institutional on-chain portfolios.
Security, Custody, Lending & Credit
Security/compliance middleware remained essential, raising ~$0.49B (2023–25), with ~47% Late-stage and ~23% Early, re-accelerating in 2025 (~$0.25B) amid rising hacks and AML demands. Custody (as above) skewed heavily Late-stage (~70%), reflecting consolidation around institutional-grade providers.
Lending/credit raised ~$0.73B: $0.24B (2023) → $0.16B (2024) → $0.33B (2025). Stage mix was unusual—~13% Late, ~35% Early, ~37% Undisclosed—consistent with the sector rebuilding after 2022 CeFi failures and focusing on RWA-backed or under-collateralized credit experiments over large growth rounds.
Payments, Stablecoins & Data Services
These became core infrastructure categories. Payments raised ~$3.0B across 2023–25, with $2.3B in 2025, ~63% Late-stage—appropriate given regulatory + liquidity requirements. Stablecoin platforms added ~$1.9B, rising from near-zero (2023) to ~$1.65B (2025), again Late-stage heavy.
Data Services raised ~$1.7B, >65% Late-stage, with $1.2B in 2025, underscoring how analytics, oracles, and risk engines now underpin payments, credit, and RWA issuance.
Together, Payments + Stablecoins + Data grew from ~$0.7B (2023) to ~$5.2B (2025)—clear evidence that the market is now funding value-transfer + information-transfer rails, not just trading venues.
Prediction Markets & InfoFi
A breakout story of 2025. Prediction markets raised ~$2.68B across 2023–25—all of it in 2025. About 75% of volume was Early-stage, with the rest Late/Undisclosed, reflecting one or two ultra-mega rounds (>$500M) into regulated Kalshi-style exchanges plus a long tail of early InfoFi (markets for signals, labels, research).
Prediction markets evolved from niche betting to information infrastructure underpinning pricing for macro, credit, and governance risk—hence renewed VC conviction.
Layer-1, Mining, Computing & Infrastructure
Layer-1 chains raised ~$2.71B (2023–25): $0.65B (2023) → $0.75B (2024) → ~$1.3B (2025). Nearly 48% of L1 capital was Early-stage; ~25% was Late/Undisclosed. Investors still back new execution environments but expect faster ecosystem delivery.
Mining/compute infra raised ~$2.38B: $1.1B (2023) → ~0 (2024) → ~$1.28B (2025). About 74% of mining capital was Late-stage, reflecting industrial-scale BTC mining, energy, and sovereign/infrastructure investors.
Pure “Computing/DePIN GPU networks” remained small (~$50M), mostly Seed/Early, indicating an emerging but not yet scaled storyline.
AI, Gaming, Wallets & Consumer UX
AI was the most active sub-category by deal count: 30+ deals (2023) → 40+ (2024) → ~70 (2025), totaling ~$2.0B. Stage mix: 20% Seed, 33% Early, 25% Late, 20% Undisclosed—a full pipeline from agentic infra to later-stage platforms.
Gaming raised ~$1.54B (2023–25), declining from $0.74B (2023) to $0.42B (2024) and $0.38B (2025)—mostly Seed/Early with high Undisclosed share. Wallets raised ~$0.94B, front-loaded in 2023 with dips in 2024 and modest rebound in 2025. Identity tooling brought ~$0.45B, spread across stages.
Consumer UX no longer drives the cycle; instead, identity, key management, and AI copilots are quietly gaining traction. Privacy funding remained steady (e.g., Aztec’s $100M plus multiple early ZK infra raises). Combined custody/security/compliance reached $1.2B by 2025, reflecting surging institutional demand for compliance rails.
4.3. Conclusion
The sub-category view reinforces the core shape of the 2025 cycle: capital concentrated heavily in regulated exchanges, asset managers, payments and stablecoin rails, prediction markets, and heavy infrastructure (L1, mining, data). These sectors absorbed most late-stage and mega-deal volume, while AI, identity, and InfoFi remained early- and mid-stage bets on a more automated, data-driven financial stack. Consumer categories—gaming, NFTs, SocialFi—persisted but no longer defined the cap table.
The market has clearly bifurcated. High-conviction, revenue-anchored verticals—stablecoins/RWA, L1/L2 infra, exchange infra, compliance/security—pulled the largest checks, while speculative narratives from the 2021 cycle attracted only selective funding. Capital has shifted from hype to functional, regulated, and institution-ready infrastructure.
As 2026 approaches, the test is whether these newly funded rails—payments, stablecoins, RWA platforms, prediction markets, compliant CEX/CeDeFi venues—convert into sustained transaction volume and fee revenue. Investors increasingly expect deeper real-world integration, continued scaling of core infra, and more mature AI convergence, with certain ecosystems (e.g., Solana) well-positioned to benefit. The narrative has moved decisively toward utilitarian, foundational crypto infrastructure.
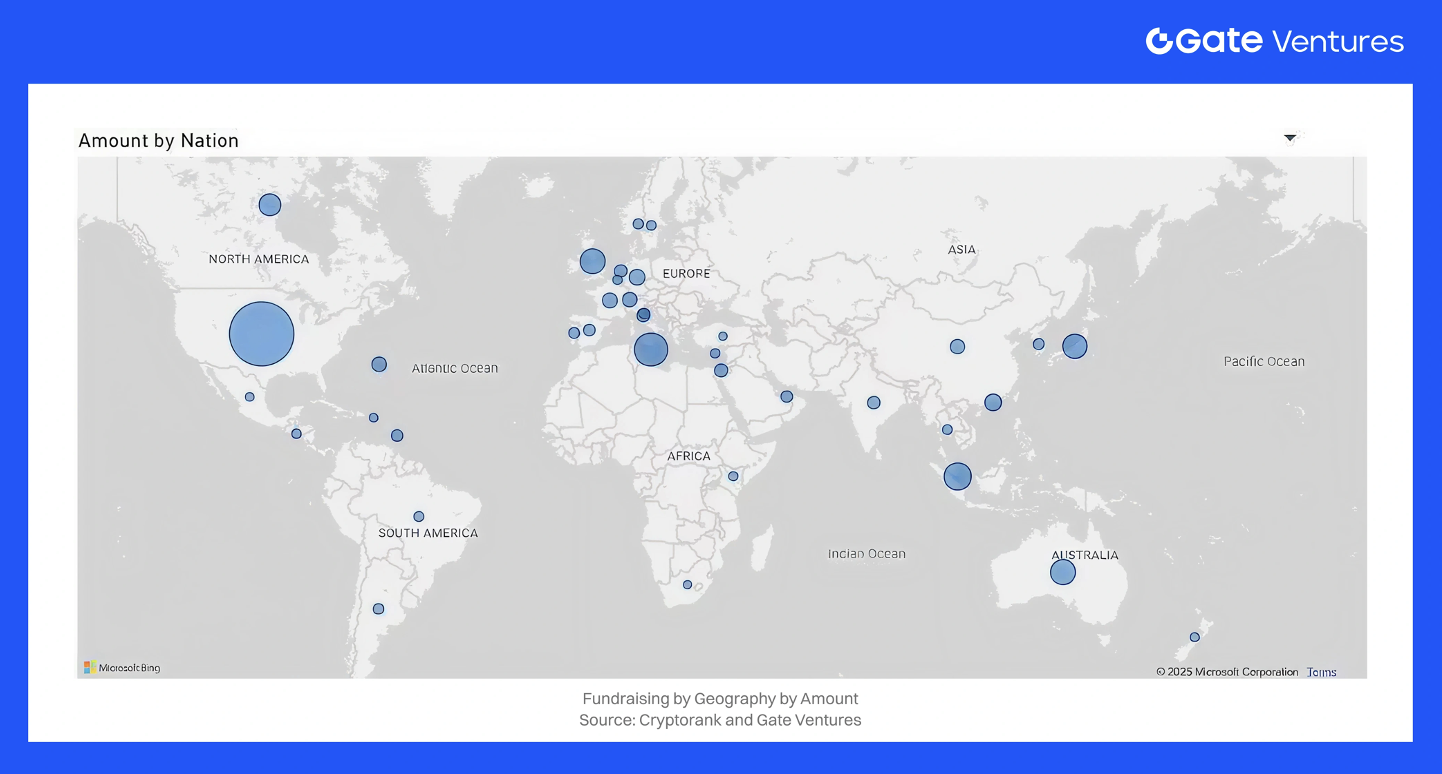
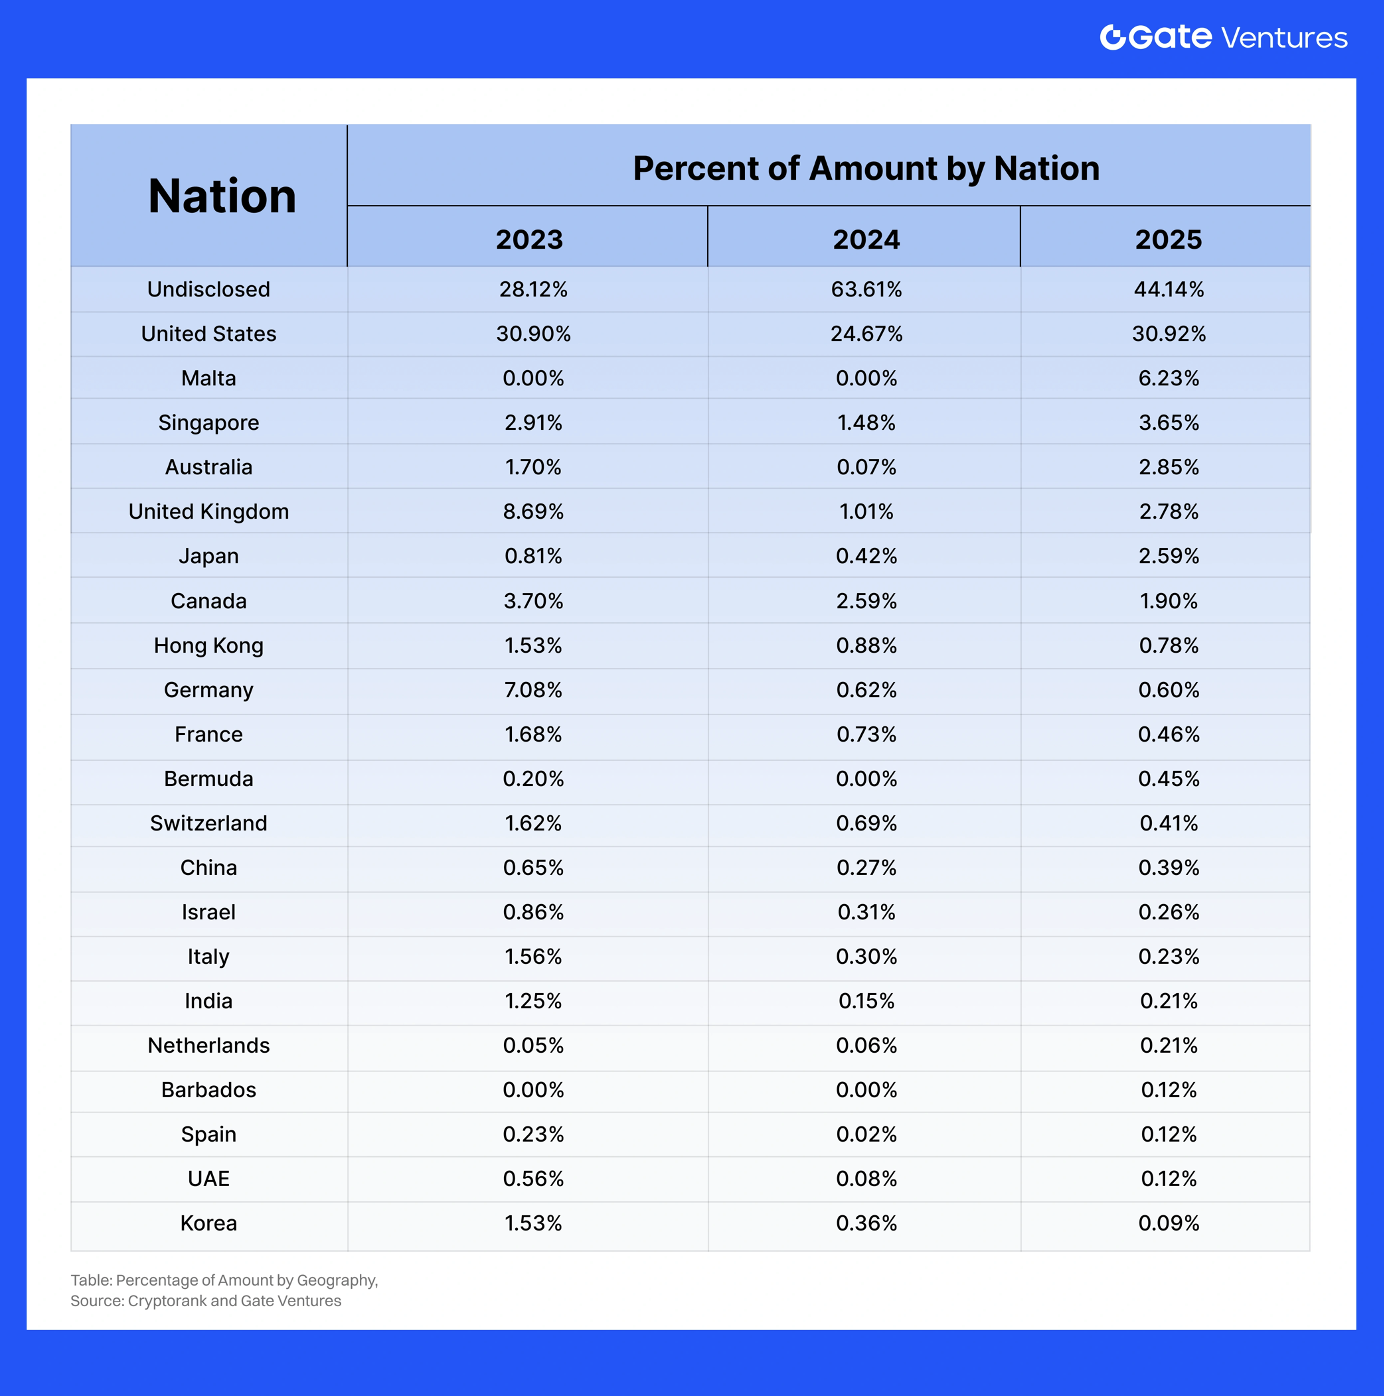
5. Fundraising by Geography
The geographic distribution of crypto venture funding became more diverse from 2023 to 2025, although the United States remains the single biggest locus of investment. We observe a slight decentralization of deal activity away from the US, driven by regulatory uncertainty there and proactive crypto initiatives in other countries. Key regional trends include:
United States
The US remains the largest crypto-VC hub, though its dominance is gradually easing. Despite regulatory pressure, US startups captured 30%+ of global activity in 2023, ~24% of deals. In 2024, and ~25% of capital and ~36% of deals Q4 2024.
In 2025, the US accounted for 31% of capital and 41% of deal count. A temporary dip in Q1 2025 occurred only because Binance’s $2B Malta-based raise skewed global totals. Going forward, the US should remain the largest market in absolute terms—supported by ETF inflows and clearer laws—but its share is likely to drift slowly downward as Asia and Europe accelerate.
Asia (Singapore, Hong Kong, Japan, Korea)
Asia’s footprint expanded sharply from 2023–2025:
Singapore: consistently top-3 by deal count (~9% in Q4 2024, 6.4% in Q2 2025) with stable capital share (~3–4%).
Hong Kong: surged after launching its licensing regime, capturing 17% of global capital in Q4 2024—second only to the US; despite small deal count (~2–3%), reflecting large outlier rounds such as HashKey’s $500M.
Japan: ranked #3 globally by capital (~4.3% in Q2 2025) driven by major corporate blockchain initiatives.
South Korea: highly active in gaming/consumer crypto.
By 2025, Asia collectively represents ~20–30% of global crypto VC funding—up from ~10–15% just a few years earlier—driven by rising CeFi hubs, gaming ecosystems, and funds such as Fenbushi, HashKey, and Yzi Labs.
Europe (UK, EU)
Europe gained strong momentum after MiCA, offering rare regulatory clarity.
The UK captured 22.9% of global capital in Q2 2025, second only to the US, and ranked #2 by deal count (~8%), supported by London’s push to become a crypto hub.
Across the EU, multiple hubs strengthened:
France (Binance EU HQ, Ledger’s $100M raise)
Switzerland (~3.7% of Q2 2025 deals; foundation base for major L1s)
Germany (regulated crypto financial products)
Portugal (founder-friendly)
Europe now claims a meaningful and rising share of global VC flows, hosting major DeFi teams (e.g., Aave) and frequent Series A/B raises. With MiCA fully active from 2024 onward, the region is positioned for continued growth.
Middle East & Other Regions
The Middle East is emerging quickly as a crypto-friendly capital hub. The UAE continues attracting exchanges and Web3 teams, supported by sovereign wealth funds. A notable example: Abu Dhabi led a $250M round for Rain in 2023. Regional share remains <5%, but is rising.
Latin America and Africa show strong retail adoption but smaller VC volumes; ongoing seed rounds focus on remittances and fintech (Ripple, Bitso, YellowCard). Some teams operate in “Global/Remote-first” mode, reducing geographic attribution.
Undisclosed Geography
A subset of rounds remains geographically unspecified—DAOs, remote teams, or stealth projects. As regulations tightened across 2023–2025, fewer teams stayed jurisdiction-less; many adopted hubs like Singapore, BVI, UAE for clarity.
Conclusion
By 2025, crypto VC allocation is clearly becoming multipolar.
The US remains the largest hub, but slowly declining in global share.
Asia (Singapore/HK/Japan) and Europe (UK/Switzerland/EU) have significantly increased both deal count and capital.
Geographic concentration is easing, reflecting the global nature of the ecosystem.
If current trends hold, 2026 could show a more balanced distribution hypothetically: US ~40%, Asia ~30%, Europe ~20%, Others ~10%, as increasingly geography-agnostic investors fund teams worldwide.
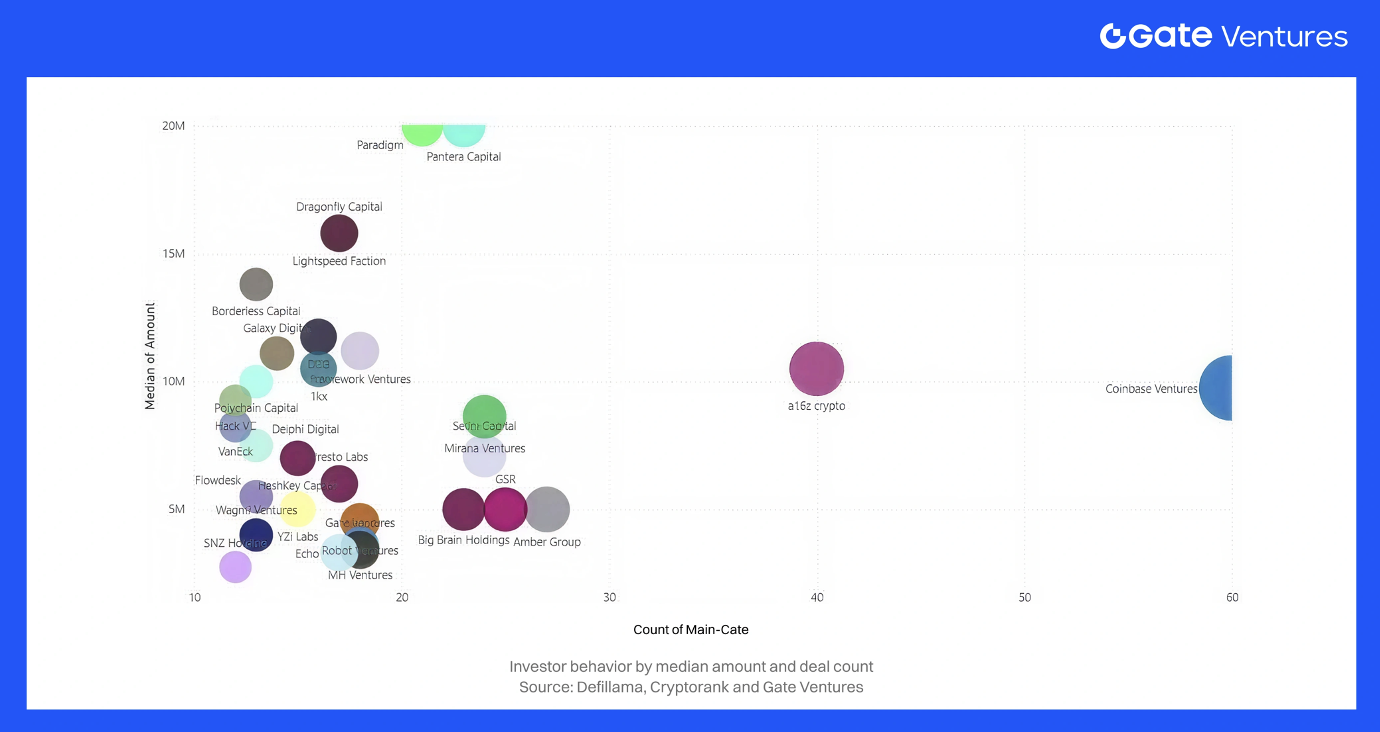
6. Investor Behavior and Top Investors (2023–2025)
Investor Behavior (2023–2025): Who Is Actually Deploying Capital?
Market Structure: Fewer Funds, More Concentrated Investment
Between 2021 and 2024, the number of active US venture firms fell by more than 25% (from ~8,300 to ~6,200), as limited partners concentrated commitments into a handful of large franchises. Financial Times, Crypto VC followed the same pattern: overall funding volumes recovered from the 2022–2023 trough, but with capital increasingly concentrated in a small core of repeat crypto-native and crossover investors.
Inside that tighter market, the top investors in Q3 2025, capturing ~32% of all 2025 YTD transactions. Coinbase Ventures led with ~60 deals in 9 months of 2025, cementing its position as the most active fund. Meanwhile, the 2021-era “tourist investors” have vanished — 2025 belongs to specialized, multi-cycle crypto VCs with real conviction.
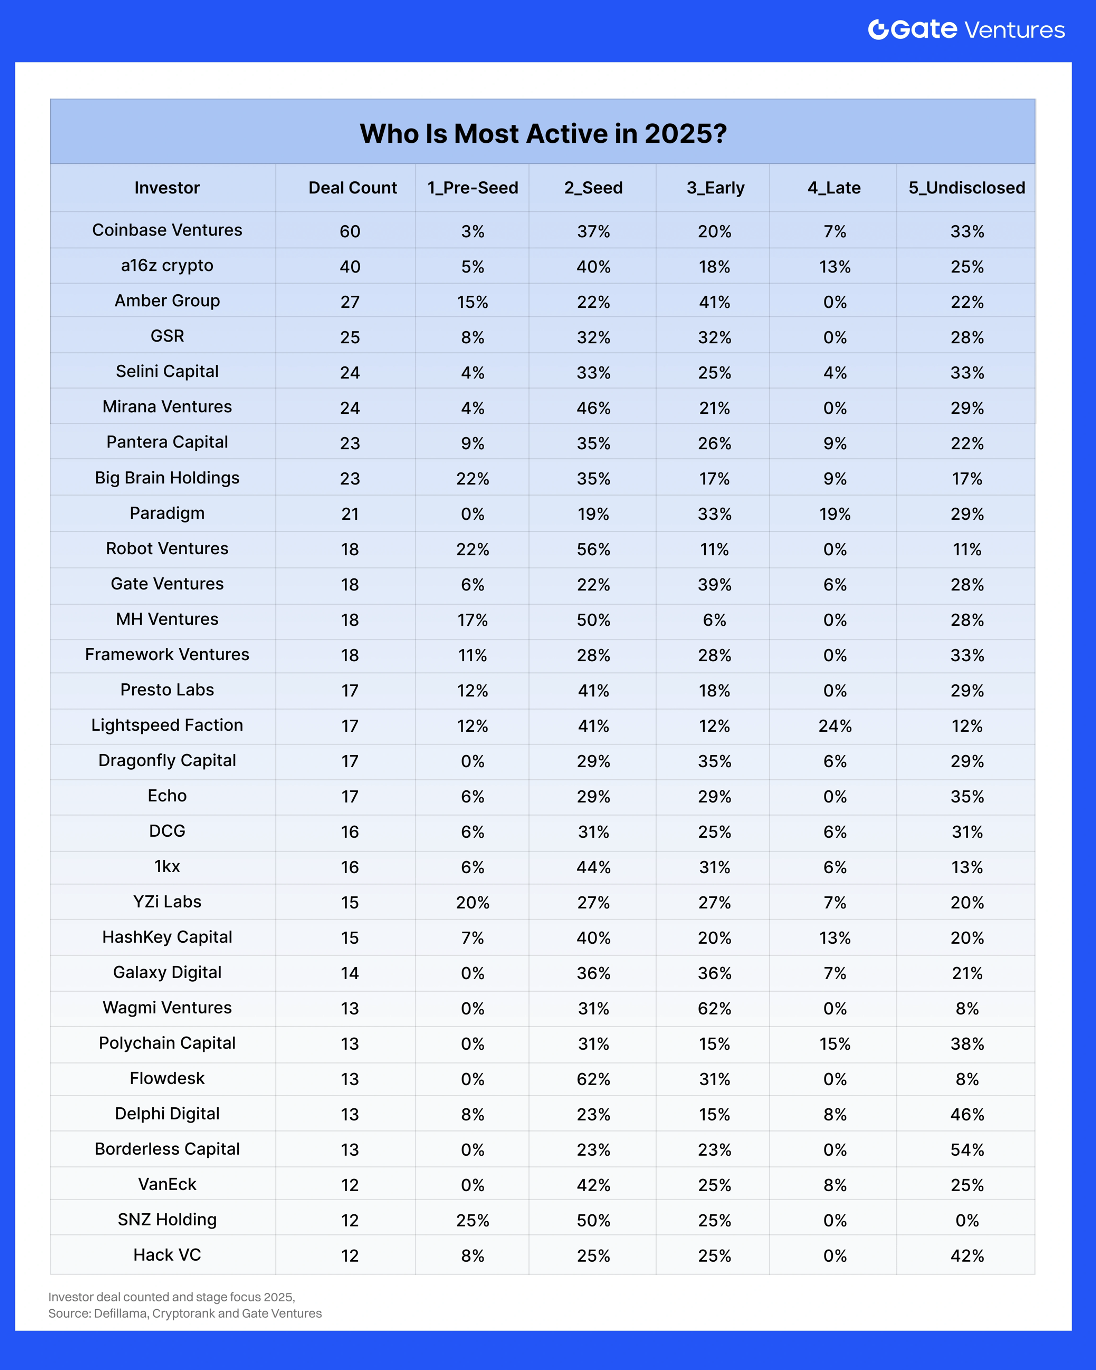
Who Is Most Active in 2025?
This table highlights three key facts relevant for 2025:
Coinbase Ventures, Big Brain Holdings, and Yzi Labs (Binance Labs) are extremely active in volume, particularly at early stage.
Pantera, Polychain, Paradigm, Dragonfly, Multicoin, Framework form the “heavyweight” belt: multi-fund platforms with a long track record and high lead ratio, able to write larger checks at Series A+ and growth.
Putting dataset and public rankings together, 2025’s most active investor cohort is effectively:
Early-stage ecosystem amplifiers: Coinbase Ventures, Big Brain Holdings, 1kx, YZi Labs, plus chain-ecosystem funds (Solana Ventures, Polygon, etc.).
Strategic corporate/TradFi entrants: bank-backed or corporate vehicles (Standard Chartered/JV, payment companies, fintechs) selectively joining later-stage or strategically important deals.
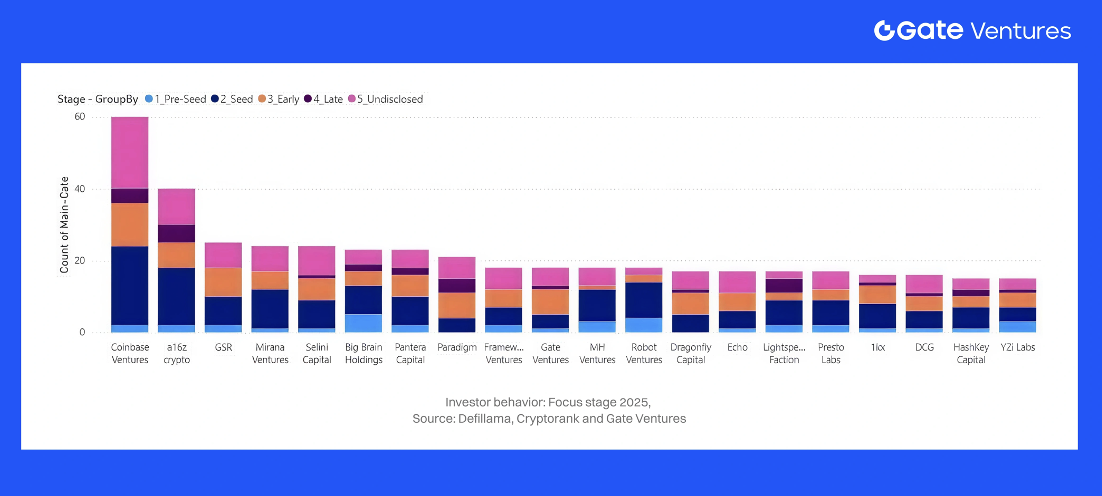
Stage Behavior: From Early-Stage Dominance to a Barbell Market
By 2025, the pattern reversed. Funding reached $4.59B across 414 deals, with late-stage capturing ~56% of capital and early-stage ~44%. Q2 2025 alone recorded 31 rounds over $50M, while sub-$1M checks declined—signaling bigger tickets and a more selective, mature market.
The Stage Shift
2023–2024:
Seed/A dominated
Many tiny rounds (<$1M)
Minimal growth capital
2025: A clear barbell pattern:
Top early-stage funds (Coinbase Ventures, Big Brain, 1kx, YZi Labs, Framework, Pantera) continued backing pre-seed/seed
Growth capital returned aggressively to CeFi, RWA, trading infra, and L1/L2 with $50–$500M+ rounds
Dataset reflects the same structure: in 9 months of 2025, early-stage still accounts for 60%+ of deal count, but late-stage captures ~37–40% of capital (up from mid-teens in 2023–24). Q3 was further boosted by mega-deals in exchanges, mining/AI compute, and regulated prediction markets—often involving TradFi and sovereign funds.
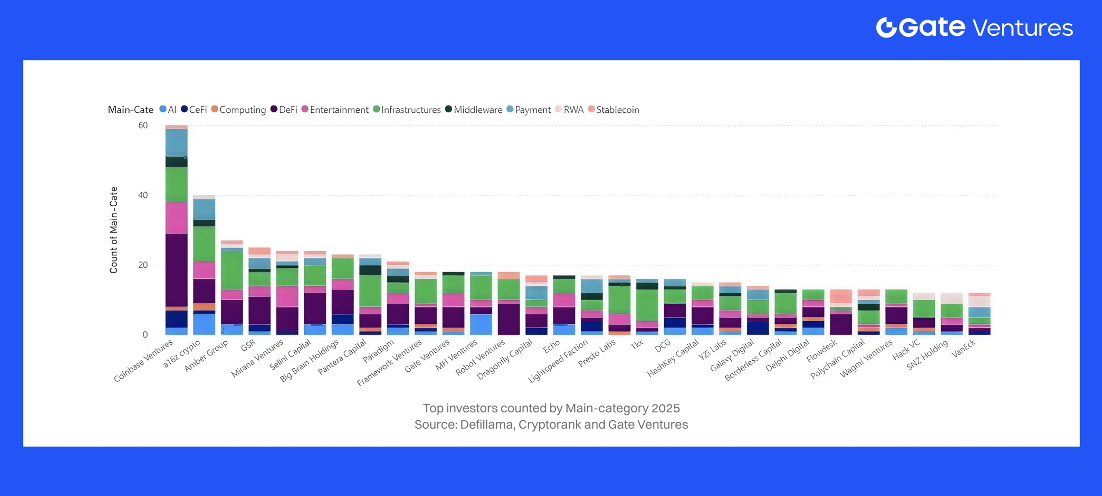
Sector & Thesis Biases: Who Backs What?
Across 2023–2025, sector preferences of leading investors converged around a few structural narratives:
Trading, CeFi & CeDeFi
Trading and CeFi/CeDeFi remained dominant, pulling in ~$2.1B of the $4.59B raised in the reference quarter. Mega-rounds included Binance’s $2B, Revolut’s $1B, and Kraken’s $500M, backed by multi-cycle giants such as Pantera, Paradigm, Polychain, and Dragonfly, alongside corporate and sovereign co-investors.
Gate’s dataset shows similar patterns: CeFi/trading is a core focus for Binance, YZi Labs, Coinbase Ventures, and OKX Ventures, who deploy strategically to strengthen exchange ecosystems and liquidity networks.
DeFi, On-Chain Credit & Structured Yield
Top crypto-native funds — 1kx, Framework, Polychain, Dragonfly, Pantera, Multicoin — remained deeply committed to DeFi: perps, restaking, RWAs, and credit. These investors not only provide early capital but often help shape token and governance architecture, effectively designing the emerging on-chain financial system.
Infrastructure, ZK & Interoperability
Paradigm, a16z crypto, Polychain, Gate Ventures, and Dragonfly continued to anchor L1/L2, ZK, data availability, and interop investments. After quieter deployment in 2023–2024, they returned in 2025 with high-conviction infra bets — advanced ZK systems, AI-driven protocols, interoperability layers, and regulated synthetic/prediction markets — sectors where technical and regulatory complexity create strong moats.
RWA, CeDeFi & Tokenized Yield
Pantera, Framework, 1kx, Polychain, Dragonfly, and bank-adjacent strategics increasingly targeted RWA issuers, CeDeFi managers, tokenized T-bills, credit funds, and yield-bearing stablecoins. These verticals accelerated from 2024 into 2025, reflecting institutional appetite for compliant, yield-generating on-chain products that bridge Web2 and Web3.
AI x Crypto, Consumer, Gaming
Coinbase Ventures, Big Brain Holdings, and similar early-stage specialists anchored the consumer/gaming/AI lane, especially across Solana. Their focus blends consumer UX, agentic AI systems, Web3 tooling, and early InfoFi/prediction use cases — areas with high experimentation but comparatively smaller tickets than infra or CeFi.
2025 vs 2023–2024: How Has Investor Behavior Actually Shifted?
Concentration vs dispersion: 2021–22 saw hundreds of generalist funds flooding crypto. By 2023–24, funding recovered modestly ($10.1B → $13.6B), but most generalists exited. In 2025, H1 alone surpasses $16B, the market consolidating around ~30–50 crypto-native funds (Coinbase Ventures, YZi Labs, Big Brain, 1kx, Polychain, Pantera, Dragonfly, Multicoin, Gate Ventures, Framework) controlling a large share of deal flow.
Stage mix: In 2023–24, early-stage dominated: 85% of capital in early rounds and just 15% in late-stage. In 2025, late-stage returns aggressively shows 56% of capital going to later-stage rounds, driving mega-deals in trading, CeFi, mining/AI infra, and regulated markets.
Sector tilt:
2023: Infra, DeFi, L2s lead as the ecosystem rebuilds post-FTX.
2024: RWA, restaking, infra remain strong; early on-chain credit + AI x crypto show up in seed portfolios
2025: Allocations shift to trading/CeFi, CeDeFi managers, RWA, on-chain credit, stablecoin/FX rails, ZK + interop infra, DePIN, and InfoFi/prediction markets, with clear specialization by fund.
Net takeaway
Across 2023–2025, crypto VC behavior matured significantly. The 2021-style FOMO cycle has ended; investors now prioritize fundamentals: revenue traction, unit economics, regulatory-ready architectures (KYC, custody), and cash-flow–aligned token design. The market is led by a small, disciplined core of crypto-native funds — Coinbase Ventures, YZi Labs, Gate Ventures, Big Brain Holdings, 1kx, Polychain, Pantera, Paradigm, Dragonfly, Multicoin, Framework — alongside a handful of returning institutional players in late-stage rounds.
Deployment has become high-conviction and selective: more capital into fewer but stronger teams, with clearer thematic alignment across CeDeFi, RWA, stablecoins/FX, DeFi infrastructure, and AI-adjacent systems. Early-stage syndicates continue to seed foundational protocols, while late-stage mega-deals are increasingly reserved for regulated exchanges, prediction markets, and institutional asset managers.
The chaotic “spray-and-pray” era is over. The funds that survived the 2022–2023 downturn now set the tone for the industry, and their synchronized theses with TradFi capital will heavily shape allocation patterns heading into 2026.
7. Structural Drivers & Narrative Outlook for 2025–2026
What drove the fundraising trends in 2025, and what narratives are investors betting on for the future?
A confluence of structural forces – regulatory developments, macroeconomic shifts, technological breakthroughs, and evolving user demand – underpinned the patterns we’ve discussed. These factors also inform the market narratives that VCs are coalescing around as we approach 2026. Below, we outline the key drivers and emerging narratives:
Macro & Regulation → Capital Rotation
The 2025 funding pattern reflected a clear alignment of regulation, macro conditions, and product readiness. As jurisdictions clarified rules (Singapore, HK, EU; later the U.S. via ETFs and policy shifts), capital rotated into compliance-heavy sectors—custody, CeDeFi, payments, RWA—and reopened the door for institutional-sized late-stage rounds.
With rates peaking and liquidity stabilizing, investors moved out the risk curve, producing fewer deals but larger tickets, concentrated in verticals where policy clarity + macro carry + institutional distribution intersected.
Infrastructure Maturity → Capital Moves Up the Stack
By 2025, Ethereum L2s, new L1s/appchains, modular stacks, and production-grade middleware removed the bottlenecks of earlier cycles. Infra deals split into:
Scale-out infra (late-stage L1/L2, mining, compute, data)
Frontier infra (ZK, On/Offchain, interop)
As infra became “good enough,” capital shifted upward into exchanges, asset managers, payments, RWA, and prediction markets—the layers that convert scalability into real users and revenue. These five sub-sectors absorbed ~50% of all capital raised 2023–25.
Product-Market Fit: Stablecoins, RWA & Info Markets Lead
By 2025, PMF was decisive. • Stablecoins & payments: strongest global PMF; multi-billion late-stage rounds. • RWA & structured yield: tokenized T-bills, credit, commodities moved from pilot → distribution. • Prediction markets/InfoFi: treated as core market infrastructure, not speculation. Meanwhile, low-PMF sectors (metaverse, forks, token-first social) saw capital vanish; gaming/NFT funding shifted to studios and infra. The funding bar heading into 2026: real users, real revenue, real retention.
Institutionalization & the CeDeFi Convergence
The 2025 capital stack became institutional. Large crypto-native funds, banks, sovereign wealth, and corporates wrote the biggest checks—mainly into regulated exchanges, asset managers, custody, payments, mining, and prediction markets.
They preferred equity-like structures, compliance rails, and RWA/CeDeFi products aligned with existing financial distribution. IPOs and M&A re-emerged, pushing late-stage capital toward CeDeFi, where licensed entities combine CeFi scale with on-chain settlement.
By 2026, late-stage activity will cluster around CeDeFi, RWA, stablecoins/payments, and regulated information markets, while early-stage funding continues seeding AI, ZK, DePIN, and next-gen infra.
Outlook: A Higher-Quality, Narrative-Driven Growth Phase
Pulling these drivers together, the 2026 outlook is cautiously optimistic but clearly quality-biased. If 2023–24 was about survival and balance-sheet repair, and 2025 was about rebuilding confidence and recapitalizing the core rails, then 2026 is set up as a pragmatic growth year:
Total funding can plausibly exceed 2025’s levels, but with continued concentration in fewer, larger, institutionally-owned deals.
The marginal dollar is more likely to go into CeDeFi, RWA, Yield optimization, Payment/FX rails, regulated exchanges, prediction markets, compliance/identity infra than into speculative consumer apps or unsustainable tokenomics.
Narratives around AI agents, BTC ecosystem expansion, DePIN, and decentralized social will drive early-stage experimentation, but capital will reward those that clearly connect to the core financial stack rather than purely to hype.
For funds and LPs, this environment rewards clear thematic maps and disciplined underwriting: understanding where each sub-category sits in the regulatory, macro, and infra stack; sizing exposure accordingly; and treating narratives as capital allocation frameworks, not just marketing. If regulation and macro stay broadly constructive, the bets placed in 2023–25 on the rails – stablecoins, CeDeFi, RWA, prediction markets, and compliant infra – are likely to form the spine of the next expansion phase in crypto venture.
Reference
The analysis above is supported by data and insights from Gate Ventures’ internal funding dataset (2023–2025 deals), augmented by industry reports, data providers and news
– Capital raised: ⬆️ 47% QoQ to $8.21B – Deal count: ⬇️ 16% to 480 – 80 M&A deals, top 5 totaling $882M – New funds: capital raised up 48% QoQ to $2.28B
Gate Ventures, the venture capital arm of Gate.com, is focused on investments in decentralized infrastructure, middleware, and applications that will reshape the world in the Web 3.0 age. Working with industry leaders across the globe, Gate Ventures helps promising teams and startups that possess the ideas and capabilities needed to redefine social and financial interactions. Website | Twitter | Medium | LinkedIn
Disclaimer:
The content herein does not constitute any offer, solicitation, or recommendation. You should always seek independent professional advice before making any investment decisions. Please note that Gate Ventures may restrict or prohibit the use of all or a portion of the services from restricted locations. For more information, please read its applicable user agreement.
XRP trades near $1.86, down about 2% in the past 24 hours and almost 15% in a month. The XRP price is still trapped inside a bearish channel that carries a 41% breakdown risk if key levels fail.
What makes this setup unusual is that multiple buyer groups are finally stepping in. Long-term holders are buying again, short-term holders are adding, yet one group isn’t convinced. That clash explains why the chart still leans bearish.
Long-Term Holders Return While the Bearish Channel Remains
The XRP price has been trading inside a descending channel since early October. Every bounce has failed near the upper trendline. The pattern projects a potential 41% drop from the breakdown point. And while XRP now trades closer to the upper trendline, some on-chain support seems to be showing up.
Want more token insights like this? Sign up for Editor Harsh Notariya’s Daily Crypto Newsletter here.
Long-term holders have finally changed their behavior, as seen via the Hodler net position change metric.
After almost three straight weeks of net selling, December flipped the trend. Between December 3 and December 26, the XRP hodler metric saw a negative net position change every single day. That shifted on December 27, when long-term holders added 9.03 million XRP. The next jump came on December 29, when acquisitions reached 15.90 million XRP. Buying has surged almost 76% in 48 hours.
That level of buying has helped XRP remain near the upper trendline of the falling channel, but it has not broken the channel to the upside.
Short-Term Buyers Join In — But Whales Start Selling Again
Short-term holders (1–3 months) have expanded from 9.58% of supply on November 29 to 12.32% on December 29, as seen via the HODL Waves metric. HODL Waves metric typically segregates cohorts by age.
This group typically drives rapid upside moves, but it is also the first to exit amid volatility. Their buying is a double-edged sword: it helps limit breakdowns, but it also creates exit pressure if rallies stay weak.
Whales are moving the other way, probably after seeing a sizable pickup by the short-term holders amid a weakening price pattern.
The 100 million –1 billion XRP cohort dropped holdings from 8.23 billion to 8.13 billion on December 28, a reduction of 100 million XRP, almost $186 million sold.
The 1million –10 million XRP cohort fell from 3.58 billion to 3.55 billion, a reduction of 30 million XRP, equivalent to approximately $55 million in sell-side pressure.
Whale exits against two layers of holder inflows create friction. It blocks every attempt at a clean breakout and explains why the price keeps returning to the mid-range instead of challenging resistance. If short-term holders sell into any bounce, whales trimming positions can accelerate the downside.
XRP Price Levels That Decide The Next Leg
The market sits at a crossroads. The XRP price remains within the channel. It needs to hold above $1.79 to avoid an early breakdown. Sustaining above that level while long-term holders continue to buy could send the price toward $1.98. A daily close above $1.98 would neutralize the bearish structure and open a path back to $2.28, where bullish momentum returns.
If $1.79 fails, the next XRP price supports are $1.64 and $1.48. Losing $1.48 breaks the channel and exposes the 41% risk toward $1.27 and even lower.
Right now, broad holder buying has not flipped the structure. It has only slowed the breakdown. For the narrative to change, whales need to return. Until then, every bounce inside the channel carries exit pressure.
XRP is down about 1.6% over the past 24 hours. On the weekly chart, it remains one of the weaker large-cap movers, sitting roughly 16% lower than last month’s levels. Most of the price action is happening near the bottom of a descending triangle pattern, a structure that often leads to continuation moves.
This does not confirm a breakdown yet, but three market signals are lining up in a way that should make traders cautious heading into the final days of 2025.
Retail And Long-Term Holders Are Moving The Same Way
XRP is still stuck inside a descending triangle, trading flat near the lower trendline. Price trended higher between December 18 and December 27, but the Money Flow Index (MFI) moved the opposite way during that same period.
MFI tracks money entering or exiting the asset. A lower low in MFI while price rises suggests retail is selling into every bounce instead of accumulating.
That pressure keeps the XRP price pinned at the lower boundary of the pattern instead of testing the upper line.
Want more token insights like this? Sign up for Editor Harsh Notariya’s Daily Crypto Newsletter here.
The concern grows when we zoom out to long-term holders.
According to HODL Waves, which visualizes how much supply is held by each age group, wallets holding XRP for 2–3 years dropped from 14.26% of supply on November 26 to about 5.66% on December 26.
These are long-term conviction holders, and their selling removes a layer of market support. Retail weakness is normal. Long-term weakness at the same time is not.
This creates a setup where both short-term and long-term behavior are leaning in the same direction: out of XRP.
Capital Flow Shows Fading Demand
If retail and long-term conviction are weakening, the next check is capital flow, the third key sign.
The Chaikin Money Flow (CMF) is not providing relief either. CMF tracks buying and selling pressure based on volume and price movement. The large money flow indicator remains negative for XRP and is sliding along a descending support trendline.
In simpler terms, even if the price is flat, big capital entering the asset is thinning out, and the market is leaning toward supply overpowering demand. With no pickup yet in CMF, the market loses another potential safety net.
This is why the XRP price has remained flat rather than rebounding.
XRP Price Levels Decide If The Breakdown Actually Happens
For now, XRP is trapped between $1.90 and $1.81. It lost the $1.90 level on December 22 and hasn’t reclaimed it since. Reclaiming $1.90 and then pushing for $1.99 would be the first sign of strength.
That would also mark a move above the triangle’s upper boundary and give bulls something to work with.
However, the bearish case is clearer than the bullish one at present.
If $1.81 breaks, XRP may fall out of the descending triangle pattern, which would constitute a confirmed breakdown. That loss could open room toward $1.68, where the structure fully fails, and even $1.52 if selling accelerates.
This isn’t a given yet, but the market has not shown a counter-signal yet. As long as retail selling, long-term distribution, and weakening capital inflow remain aligned, the XRP price must fight to hold the range.
Charles Hoskinson is pitching his latest venture, Midnight Protocol, as more than a sidechain for Cardano.
Instead, the Cardano founder is positioning the privacy-focused platform as a shared infrastructure layer that could extend programmable privacy to rival blockchain networks, including Bitcoin and the XRP Ledger.
Hoskinson Moves Beyond Cardano With a Cross-Chain Privacy Play
In a December 27 post on X, Hoskinson argued that Midnight’s zero-knowledge proof architecture could enhance the capabilities of competing ecosystems rather than displace them.
He said that integrating Midnight with the XRP Ledger would allow the network to challenge legacy banking systems by enabling private, compliant decentralized finance. He extended the argument to Bitcoin, saying Midnight offers programmable privacy features that Bitcoin currently lacks.
Hoskinson also framed Midnight as a catalyst for Cardano itself. He suggested that the protocol could help lift Cardano’s monthly active users and total value locked by broadening the ecosystem’s utility beyond its native chain.
“Midnight makes what it touches better. Adding Midnight to XRP DeFi is going to blow the legacy banks out of the water. Adding Midnight to Bitcoin gives the world Satoshi imagined possible. Adding Midnight to Cardano supercharges our DeFi ecosystem and will 10x the MAUs, Transactions, and TVL as we are first to market with private DeFi at scale,” he claimed.
Beyond interoperability, Hoskinson pointed to the scale of the opportunity in real-world asset tokenization. He said the estimated $10 trillion market for Real-World Assets would benefit significantly from Midnight’s privacy-preserving design.
In that context, he criticized traditional finance firms for continuing to partner with the Canton Network, a permissioned blockchain, arguing that partial solutions fall short of what institutional adoption requires.
“There are no half measures or half technologies. You need an end-to-end strategy, great partners, and great communities,” Hoskinson said.
This strategy marks a shift for Hoskinson, who has historically focused on building within the Cardano ecosystem.
By promoting Midnight as a privacy layer that enhances other Layer-1 blockchains, Hoskinson is seeking to access liquidity and user bases beyond Cardano’s existing network.
That pivot has coincided with growing speculative interest in Midnight’s native token, NIGHT.
Data from CoinGecko showed that the asset recently surpassed Bitcoin and Ethereum in search volume on the platform’s trending list.
However, the token has traded with high volatility since its launch earlier this month. According to BeInCrypto data, the token’s price has dropped by more than 80% to $0.08 as of press time.
Year-end usually brings position cuts across crypto. Big wallets and smart money often reduce exposure to secure profits, sit on cash, and wait for lower-liquidity conditions to finish. That’s normal for December. Even with that backdrop, a few assets are seeing the opposite. Crypto whales are adding again across multiple time frames.
One shows steady 30-day accumulation, another gets 7-day whale support, and a third just saw fresh 24-hour inflows.
Chainlink (LINK)
The first token on the list that crypto whales are buying is Chainlink. Whale wallets have raised their holdings by 57.79% over the last 30 days. This means whales added about 680,000 LINK in that period.
At the current LINK price, that is close to $8.5 million in accumulation.
Want more token insights like this? Sign up for Editor Harsh Notariya’s Daily Crypto Newsletter here.
This buildup occurs while Chainlink has corrected by about 7.5% over the same period. Smart money wallets have reduced exposure by 5.2%, suggesting whales are positioning early rather than expecting an immediate move.
This whale has further withdrawn 366,364 $LINK, worth $4.5M, from #Binance.
Now, the whale holds 695,783 $LINK, worth $8.52M, from #Binance in the past 2 days.
On the chart, the Bull Bear Power (BBP) indicator shows that red bars have been shrinking since December 24. BBP measures the distance between price and a moving average to highlight whether bulls or bears control momentum. When the red bars shrink, bearish pressure is fading.
At the same time, LINK is trying to reclaim a key short-term barrier near $12.50. A daily close above that level would put the token back inside the short-term breakout conversation. Above $12.50, the more critical levels sit near $12.98 and $13.75, and a move past $15.00 would return LINK to a clear bullish zone.
Smart money exiting while whales continue to add hints at a slower setup. The structure suggests whales are accumulating into weakness for a potential move in early 2026, not an immediate breakout. Until $12.50 is reclaimed, LINK may stay range-bound. Also, a dip under $11.72 can invalidate the whales’ bullish theory for now.
Lido DAO (LDO)
Crypto whales have also turned to Lido over the past 7 days. Their balances are up 30.34%, bringing the cohort’s stash to 17.49 million LDO. At the current price , whales added roughly 4.07 million LDO, worth about $2.28 million in a week.
This comes while the token has gained 4.2% during the same period, which suggests whales are buying into strength.
Not all big buyers are anonymous. One of the most notable additions came from Arthur Hayes, who accumulated 1.85 million LDO worth around $1.03 million. It also explains why the “Public Figure” cohort has climbed alongside whale activity.
Smart money, however, shows a different stance. Their balances are down 7.75%. Exchange balances are also down 1.49%, hinting that retail may be removing tokens from exchanges rather than selling. This disconnect means the whale thesis might take time to play out and could stretch into early 2026 instead of an immediate move.
On the chart, Lido trades inside a clear range between $0.59 and $0.49. The On-Balance Volume (OBV) indicator, which measures whether volume flows in or out, broke its downtrend on December 23.
That happened at the same time whale inflows picked up, so the signal is worth watching.
A daily close above $0.59 is needed to confirm strength. That level broke on December 14 and hasn’t been reclaimed since. If buyers clear it with conviction, the next zones to watch are $0.76 (0.618 Fibonacci) and then $0.92, where momentum could flip from corrective to bullish.
Until then, range-bound trading remains the base case. A loss of $0.49 would invalidate the current LDO price setup, especially if smart money keeps reducing exposure during year-end volatility.
Aster (ASTER)
The third token on the list is Aster. This one has seen whale interest on the 24-hour window rather than a longer accumulation trend. Over the past day, whales added 2.37% to their existing stash.
Following this rise, whale holdings now stand at approximately 19.23 million ASTER. At a price of about $0.71, that means whales added roughly 455,000 ASTER, worth a little over $320,000.
The addition is not massive. It stands out because ASTER has dropped more than 30% in a month, and this pickup might hint that sentiment is slowly shifting from heavy selling to cautious positioning.
Price action supports this reading. ASTER fell sharply from about $1.40 on November 19 and found support near $0.65, which has held as a floor through December. Selling pressure also looks weaker now. On the Wyckoff Volume indicator, red and yellow bars (seller control) have been fading since December 15. The recent shift toward lighter red/yellow bars suggests sellers are losing dominance.
If whales are right, the recovery attempt begins with a push to $0.83, which requires approximately a 16% move from current prices. Breaking above $0.83 opens room toward $1.03, and then $1.24 if market conditions improve.
BitMine, the largest corporate holder of Ethereum, has begun staking part of its $12 billion ETH treasury.
On December 27, on-chain analyst Ember CN reported that the firm deposited approximately 74,880 ETH, valued at about $219 million, into Ethereum staking contracts.
If the company were to stake its entire treasury at the current estimated annual percentage yield (APY) of 3.12%, it would generate approximately 126,800 ETH annually. At current prices, this equates to $371 million in yearly revenue.
Such a structure would effectively recast BitMine as a yield-bearing vehicle tied to Ethereum’s consensus layer. This means its valuation would no longer hinge primarily on the asset’s directional price movements.
ETH Staking Goals and Risks
However, the strategy introduces new financial and operational risks for the company.
Unlike Bitcoin held in cold storage, which can be liquidated immediately in stressed market conditions, staked Ether is constrained by protocol-level withdrawal mechanics.
Validators exiting the network must pass through an exit queue, which can delay access to capital during periods of heightened volatility.
In a liquidity crunch, that delay could leave BitMine exposed to price swings that a non-staking treasury might otherwise avoid.
This tradeoff underscores a structural difference between holding Ethereum as a passive asset and deploying it as productive capital within the network.
To support that vision, the firm is developing a proprietary staking platform, the Made in America Validator Network (MAVAN), scheduled for deployment in early 2026.
“We continue to make progress on our staking solution known as The Made in America Validator Network (MAVAN). This will be the ‘best-in-class’ solution offering secure staking infrastructure and will be deployed in early calendar 2026,” BitMine chair Thomas Lee said.
Meanwhile, critics argue that consolidating such a large share of Ether under a single US-domiciled validator framework introduces centralization risks. They say the structure could undermine a network designed to be neutral and globally distributed.
The Ethereum price is down by under 1% in the last 24 hours. At first glance, the chart looks quiet. Also, the minor price drop links to weak retail demand. But something else is happening under the surface.
New on-chain data shows whales adding again, while one key indicator flashes a rare trend shift, favoring one of the two groups mentioned in this piece.
Retail Slows Down While Whales Move In
Ethereum is approaching completion of an inverse head-and-shoulders pattern. This is a bullish structure that signals a trend reversal if the price breaks above $3,390. The problem appears before that breakout level. Retail momentum weakened this week.
Between December 18 and December 24, the price trended higher. Normally, that is a positive sign. The Money Flow Index (MFI), which tracks money entering and exiting an asset, did not follow. It made a lower low. That shows that possibly retail traders did not support the higher low with real buying.
Want more token insights like this? Sign up for Editor Harsh Notariya’s Daily Crypto Newsletter here.
MFI now needs to move above 37 to form a higher high and show stronger demand.
While retail slowed down, the whales reacted the opposite way. Since December 26, wallets holding large amounts moved from 100.48 million ETH to 100.6 million ETH.
At the current price, this amounts to approximately $350 million injected over the past 24 hours. Whales do not buy for short-term flips. They usually buy because they think a setup exists.
This type of divergence supports reversal patterns such as the inverse head-and-shoulders. It does not guarantee the breakout. It gives the breakout attempt a higher chance of working if the price reaches the trigger zone. And that is exactly why Ethereum whales are adding now.
Ethereum Price Zones Decide The Next Leg
The Ethereum price must reclaim $3,050 first. This is a psychological barrier and short-term resistance.
If price clears it with strength, the next test is the neckline breakout zone at $3,390.
A breakout above $3,390 could activate an inverse head and shoulders target near $4,400. That comes from adding the height of the head to the breakout point.
On the downside, losing $2,800 weakens bullish momentum. If selling increases and whales stop adding, the Ethereum price can slide to $2,620. A drop below that level invalidates the bullish reversal structure.
Coinbase CEO Brian Armstrong predicts US banks will reverse their stance on stablecoin regulation and eventually lobby Congress to permit interest payments on these digital assets.
Armstrong’s forecast, posted December 27 on X, contradicts the banking sector’s current efforts to strip yield-generating features from the GENIUS Act.
Armstrong Predicts Banks Will Reverse Course on Stablecoin Interest Bans
He argued that lenders are currently protecting low-cost deposits but will be forced to adopt the technology to compete for capital.
“My prediction is the banks will actually flip and be lobbying FOR the ability to pay interest and yield on stablecoins in a few years,” Armstrong wrote.
The prediction reframes the current legislative battle over the GENIUS Act as more than a regulatory dispute. It presents the fight as a collision between legacy profit protection and inevitable market evolution.
The GENIUS Act, signed in July 2025, prohibits stablecoin issuers such as Circle and Tether from paying interest directly to holders.
However, it permits intermediaries—such as exchanges—to pass yield from the underlying Treasury reserves to users.
They argue that non-bank platforms can now offer near risk-free Treasury yields of roughly 4% to 5% on liquid cash equivalents. In that environment, commercial banks struggle to compete without raising deposit rates and compressing their net interest margins.
However, Armstrong characterized attempts to amend enacted law as a “red line” for the crypto industry.
Exactly – I’m actually impressed the banks can lobby for this with a straight face and not get kicked out of senator’s offices. It takes some serious mental gymnastics.
We won’t let anyone reopen GENIUS. Red line issue for us. And will keep advocating for our customers and the… https://t.co/6EfF2oBn5A
He criticized the banking lobby’s approach as “mental gymnastics.” He pointed to the contradiction of citing safety concerns while defending a business model built on paying depositors below-market rates.
The Coinbase CEO also described the current lobbying spend by banking trade groups as “100% wasted effort.”
Notably, a coalition of 125 crypto companies, including Coinbase, recently submitted a letter to the Senate Banking Committee opposing any revisions. The group argued that reopening the bill would undermine regulatory certainty.
Armstrong’s position implies that banks will eventually lose the ability to hold deposits at near-zero rates. Instead, they would issue their own tokenized dollars to capture the yield spread directly.
Until that pivot occurs, Coinbase and its peers intend to defend the existing framework that allows them to serve as the high-yield interface for dollar holders.
The Bitcoin price has decreased by almost 2% over the last 24 hours and is down nearly 3% from yesterday’s peak. At first glance, nothing about the price appears exciting.
However, something beneath the chart, especially on-chain, has changed for the first time in almost three months, and something else changed this week. These two shifts do not confirm a rally as 2026 approaches, but they might be the first building blocks of one.
A Momentum Shift Begins, but Needs Proof
Two signals have appeared simultaneously. They are separate, but the timing matters.
The first is the On-Balance Volume (OBV). OBV measures buying and selling pressure through volume. Between December 21 and December 26, Bitcoin’s price trended higher. OBV did not follow. It made lower highs. That is a bearish OBV divergence. It explains why the price failed to break through (long wick on December 26), as volume didn’t accompany the minor price rise.
Want more token insights like this? Sign up for Editor Harsh Notariya’s Daily Crypto Newsletter here.
This week, OBV broke above the trend line that connected those lower highs. That breakout suggests stronger buying pressure is forming. The signal is not confirmed until OBV makes a higher high above 1.58 million. If that happens, the Bitcoin price could finally react. That has not happened yet.
The second signal comes from the Hodler net position change metric. This tracks wallets that hold for longer than 155 days. They are the slowest movers in the market.
On December 26, this metric flipped positive for the first time since late September. Long-term holders added 3,783.8 BTC. They do not buy for short-term moves. They buy for conviction. And this is the first time in almost three months that conviction has shown up.
Bitcoin has failed to reclaim $90,840 for almost two weeks. That level rejected the price on December 12 and has blocked every attempt since. Until price clears that level, every bounce feels temporary.
Above $90,840, the first real relief rally checkpoint sits near $97,190. The BTC price fell below that level on November 14.
If the rally extends, $101,710 and $107,470 are the next zones.
On the downside, support sits at $86,915. It has held since December 19. Losing it opens room to $80,560. Low year-end liquidity increases that risk. For now, based on how long-term investors are positioning, the Bitcoin price can attempt a relief rally toward $90,840 and even beyond if the support at $86,910 holds.
Ripple Labs is doubling down on its presence in Japan, drawing on longstanding relationships with the country’s traditional financial institutions. The strategy is aimed at increasing adoption and interest in the XRP Ledger (XRPL).
This week, Asia Web3 Alliance Japan and Web3 Salon launched the Japan Financial Infrastructure Innovation Program. The initiative is designed to support Japanese startups developing next-generation, compliant digital financial solutions on the XRP Ledger.
Ripple’s Japan Strategy Tests Whether Institutions Can Lift XRP
The program opened applications on December 19 and is offering a $10,000 grant per startup. It is narrowly focused on three high-value verticals, including stablecoins, real-world asset tokenization, and credit infrastructure.
“Japan offers an overwhelming opportunity for blockchain innovation, supported by a forward-thinking regulatory framework and deep talent pool. This program represents Ripple’s commitment to fostering a vibrant ecosystem where startups can leverage the speed, low cost, and reliability of the XRP Ledger to create real-world benefits and transform financial infrastructure,” Christina Chan, Senior Director of Developer Growth at RippleX, said.
Analysts view it as a low-cost funnel for identifying candidates for Ripple’s significantly larger capital pool, including the 1 billion XRP fund dedicated to developers in Japan and Korea.
The program has secured backing from a formidable roster of establishment players, including Mizuho Bank, SMBC Nikko Securities, and Securitize Japan.
@AWAJ_official and @Web3Salon, with support from #JETRO and @RippleXrpie, are proud to announce the Japan Financial Infrastructure Innovation Program (JFIIP) 🇯🇵 during the Japan Fintech Week
— Asia Web3 Alliance Japan (AWAJ) (@AWAJ_official) December 24, 2025
Despite the initiative’s high-profile corporate backing, it comes at a precarious moment for the network. While Ripple touts institutional adoption, the underlying usage of the XRPL tells a conflicting story of contraction.
According to data from DefiLlama, the Total Value Locked (TVL) on the XRPL has plummeted in recent months. The TVL has fallen from a July high of $120 million to roughly $62 million as of press time.
This nearly 50% drawdown suggests that capital is exiting the network’s DeFi protocols even as corporate partnerships expand.
Meanwhile, the broader crypto market downturn likely contributed to the drawdown, as Bitcoin has fallen 30% from its October high of more than $126,000.
Furthermore, the push into asset tokenization faces stiff competition. According to Rwa.xyz, XRPL currently ranks ninth globally in tokenized assets, with approximately $213 million in assets.
While substantial, this lags significantly behind networks like Ethereum and newer competitors that have captured the lion’s share of the RWA market.
Considering this, the JFIIP program is more than a startup accelerator. By entrenching itself in Japan’s banking infrastructure, Ripple hopes to create a sticky ecosystem that is immune to the speculative volatility of the broader crypto market.