Reading view

Cooling Inflation, Weak Confidence: What the Michigan Consumer Data Means for Bitcoin

Fresh US economic data is sending a clear but nuanced signal to markets. Inflation pressures are easing, but consumers remain under strain. 

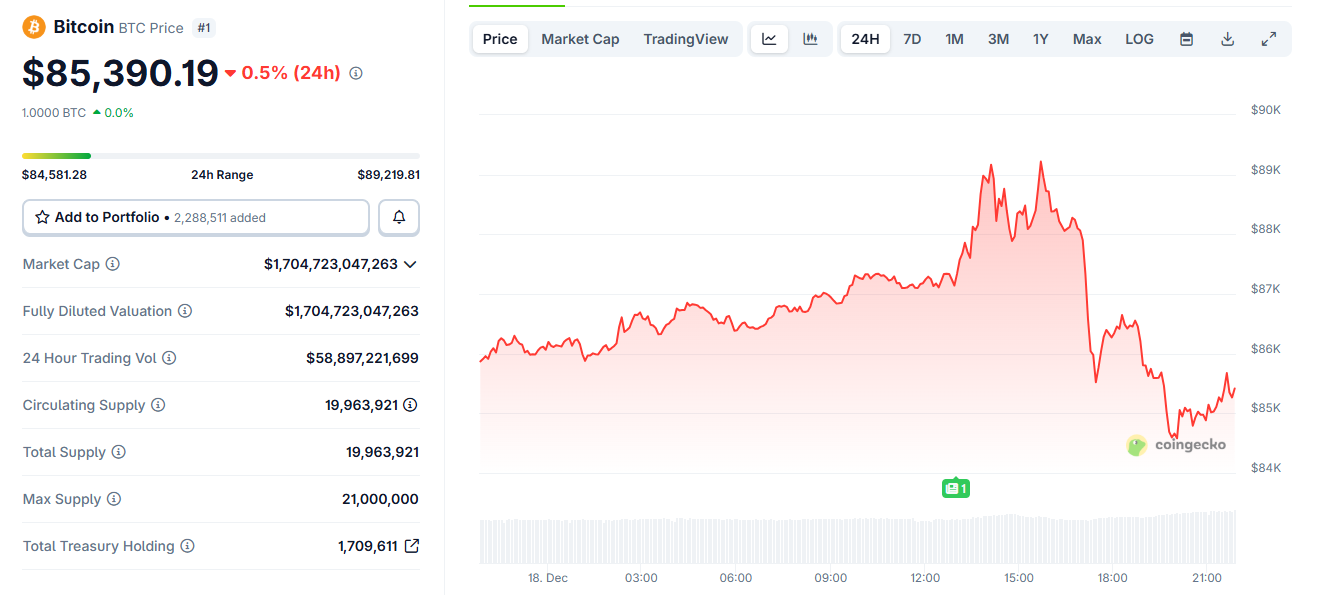
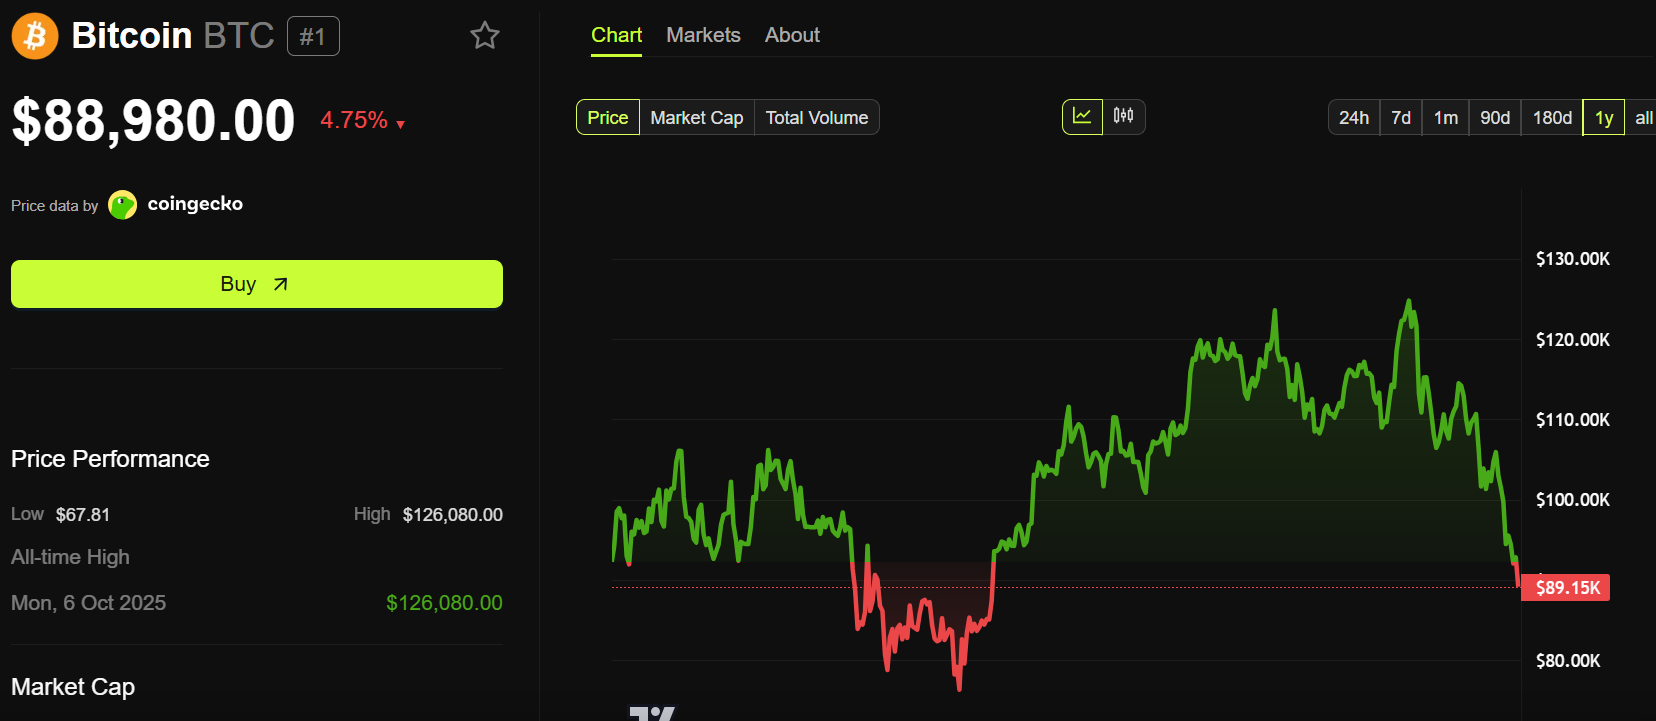
For Bitcoin and the broader crypto market, that mix points to improving macro conditions, tempered by near-term volatility.

Why Inflation Expectations Matter More Than Sentiment

US consumer sentiment edged up to 52.9 in December, slightly higher than November but still nearly 30% lower than a year ago, according to the University of Michigan. 

At the same time, inflation expectations continued to fall. Short-term expectations dropped to 4.2%, while long-term expectations eased to 3.2%.

The University of Michigan consumer sentiment index came in worse than expected at 52.9 in December. pic.twitter.com/yQ79MOBt5R

— Yahoo Finance (@YahooFinance) December 19, 2025

For markets, those inflation expectations matter more than confidence levels.

Consumer sentiment measures how people feel about their finances and the economy. Inflation expectations measure what they think prices will do next. Central banks care far more about the latter.

Falling short- and long-term inflation expectations suggest households believe price pressures are easing and will stay contained. 

That supports the Federal Reserve’s goal of cooling inflation without keeping policy restrictive for too long.

This data follows November’s CPI report, which showed inflation cooling faster than expected. Together, the two reports reinforce the same message: inflation is losing momentum.

Who do you believe:

A. University of Michigan consumer confidence below COVID April 2020 and Lehman September 2008 levels.

B. CPI inflation data, skewed by bogus OER? pic.twitter.com/FFEWj0I7OE

— Lawrence McDonald (@Convertbond) December 19, 2025

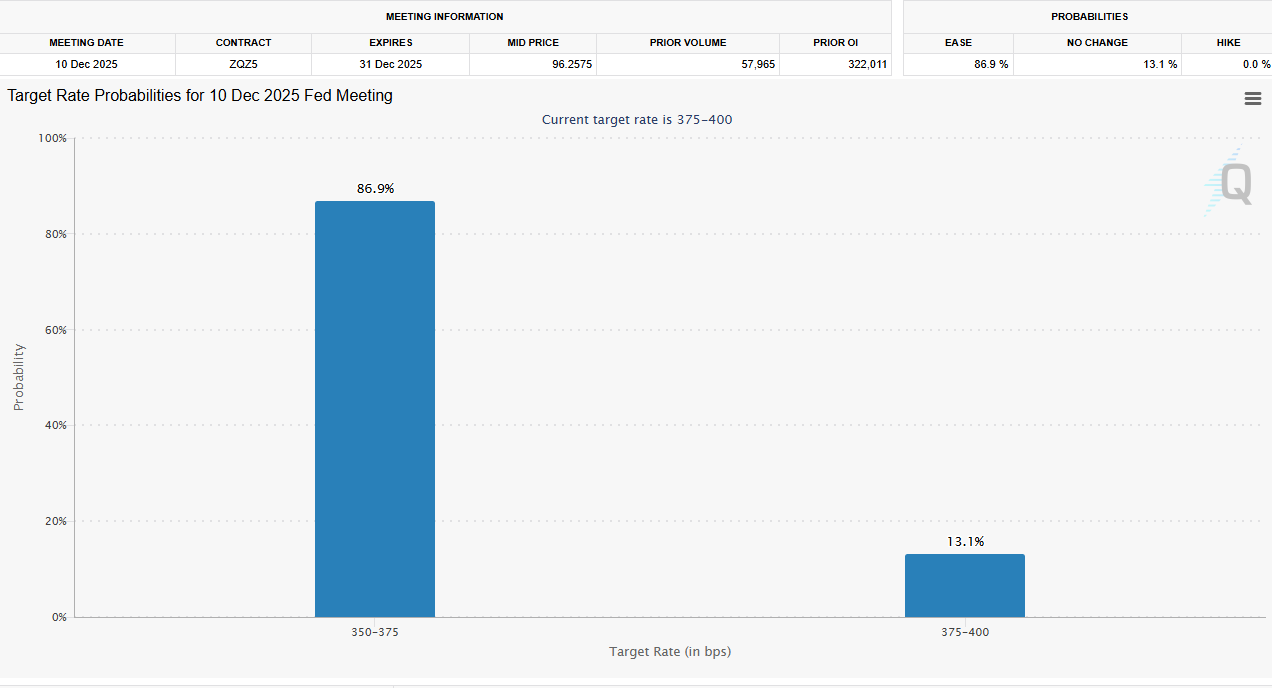
What This Means for Interest Rates and Liquidity

Lower inflation expectations reduce the need for high interest rates. Markets tend to respond by pricing in earlier or deeper rate cuts, even if economic growth remains slow.

For risk assets, including crypto, this matters because:

  • Lower rates reduce returns on cash and bonds
  • Real yields tend to fall
  • Financial conditions gradually loosen

Bitcoin has historically responded more to liquidity conditions than to consumer confidence or economic growth.

Why Weak Confidence Does Not Hurt Crypto as Much

Low consumer confidence reflects cost-of-living pressures, not collapsing demand. People still feel stretched, but they are less worried about prices rising sharply from here.

Crypto markets do not rely on consumer spending in the same way equities do. Instead, they react to:

  • Interest rate expectations
  • Dollar strength
  • Global liquidity

That makes falling inflation expectations supportive for Bitcoin, even when confidence remains weak.

Why Volatility Is Likely to Continue

This environment favors risk assets over time, but not in a straight line.

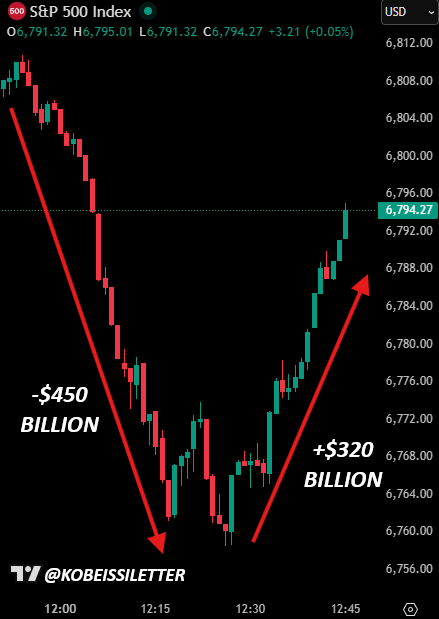
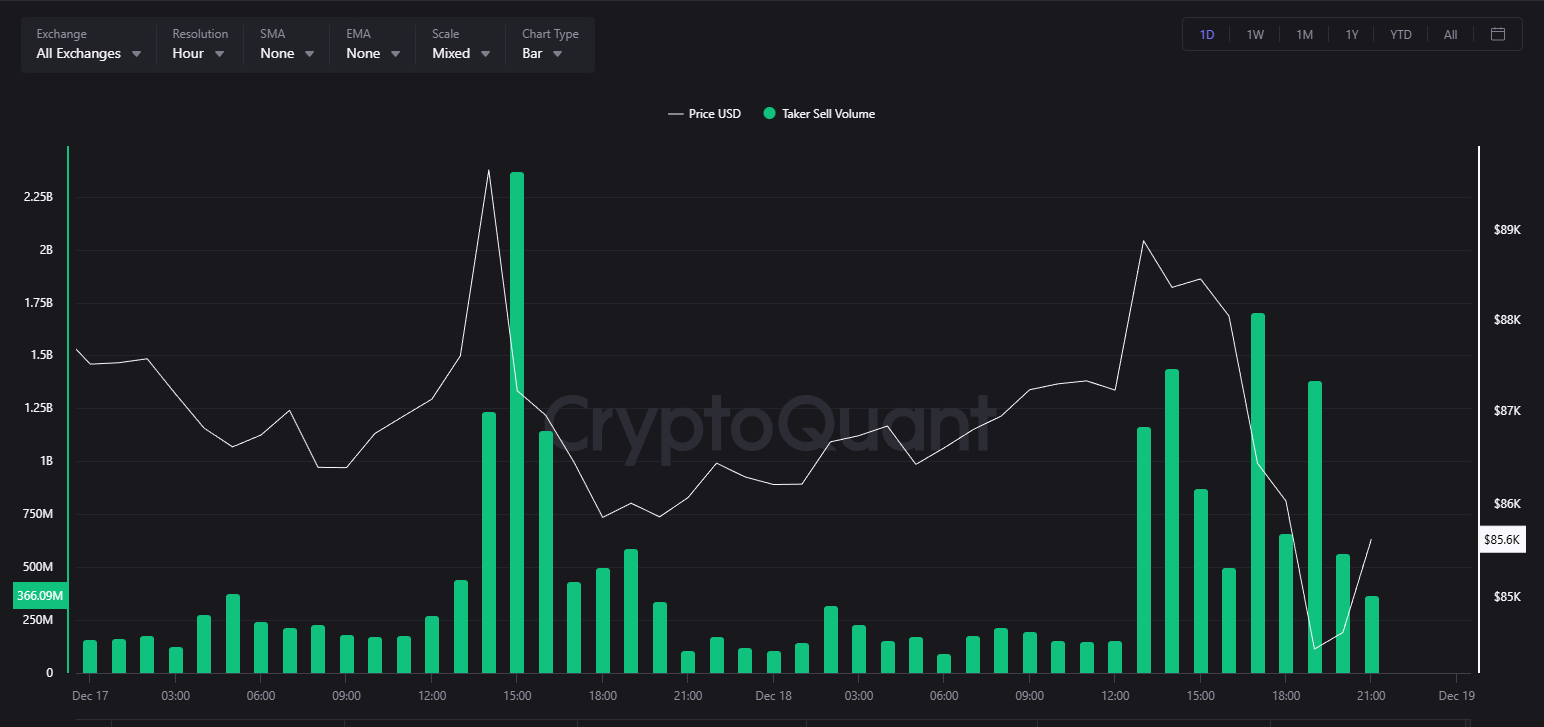
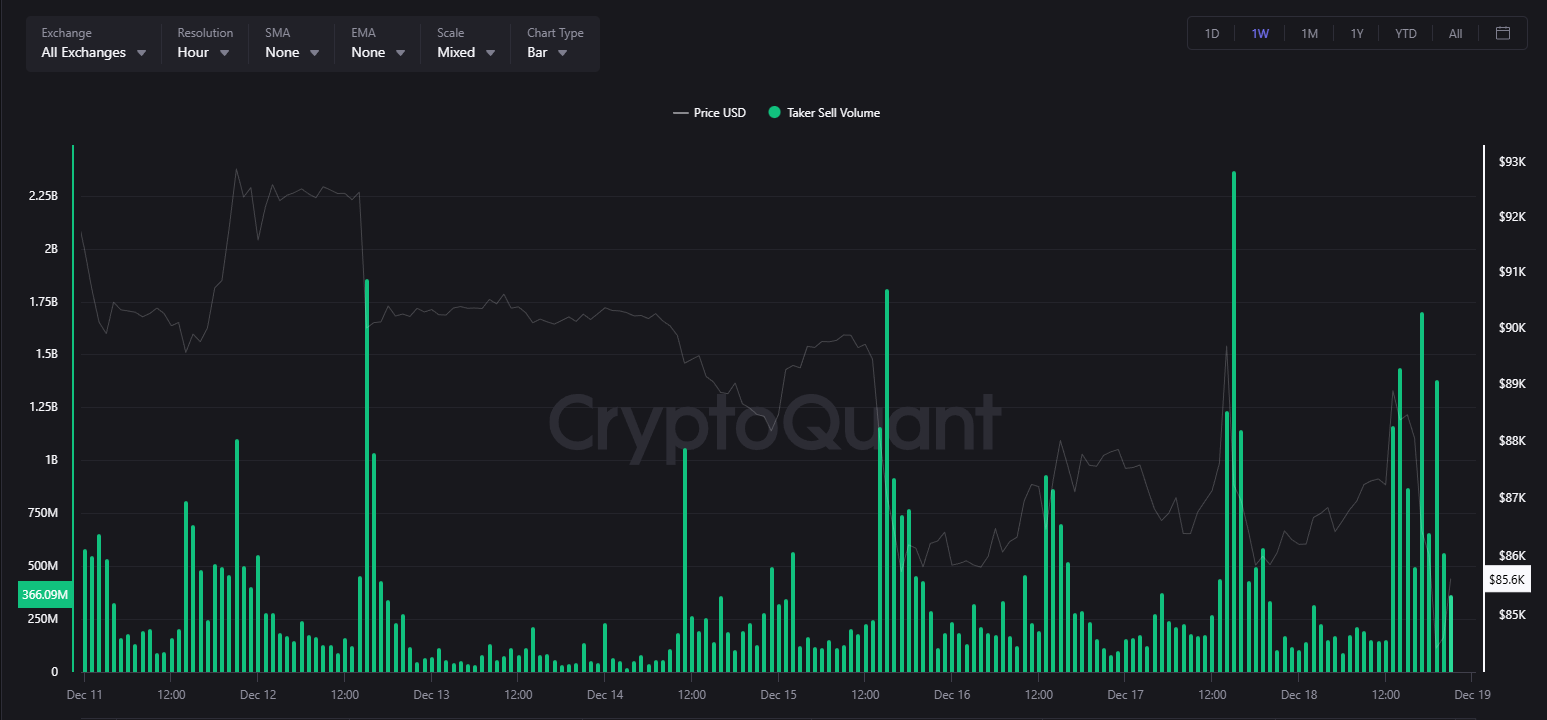
Weak confidence means growth remains fragile. That keeps markets sensitive to data releases, positioning, and short-term flows. As seen after the CPI report, even bullish macro data can trigger sharp reversals when leverage is high.

For Bitcoin, that typically results in:

  • Strong reactions to macro news
  • Choppy price action
  • Rallies driven by liquidity rather than conviction

Looking Ahead to January 2026

Taken together, the data points to a constructive macro backdrop for crypto heading into early 2026. Inflation pressures are easing, policy constraints are loosening, and liquidity conditions are improving.

At the same time, weak confidence explains why markets remain volatile and prone to sudden selloffs.

The key takeaway is simple: macro conditions are improving for Bitcoin, but price action will continue to be shaped by flows, leverage, and timing rather than optimism alone.

The post Cooling Inflation, Weak Confidence: What the Michigan Consumer Data Means for Bitcoin appeared first on BeInCrypto.

  •  

US Inflation Cooled, So Why Did Bitcoin and Stocks Sell Off?

US inflation delivered its biggest downside surprise in months. Yet instead of a sustained rally, both Bitcoin and US equities sold off sharply during US trading hours. 

The price action puzzled many traders, but the charts point to a familiar explanation rooted in market structure, positioning, and liquidity rather than macro fundamentals.

What Happened After the US CPI Release

Headline CPI slowed to 2.7% year over year in November, well below the 3.1% forecast. Core CPI also undershot expectations at 2.6%. 

On paper, this was one of the most risk-positive inflation prints of 2025. Markets initially reacted as expected. Bitcoin jumped toward the $89,000 area, while the S&P 500 spiked higher shortly after the data hit.

That rally did not last.

Bitcoin Price Briefly Rallies and Dumps After US CPI Data. Source: CoinGecko

Within roughly 30 minutes of the CPI print, Bitcoin reversed sharply. After tagging intraday highs near $89,200, BTC sold off aggressively, sliding toward the $85,000 area. 

The S&P 500 followed a similar path, with sharp intraday swings that erased much of the initial CPI-driven gains before stabilizing.

S&P 500 Sharply Drops and then Spikes After US CPI. Source: X/Kobeissi Letter

This synchronized reversal across crypto and equities matters. It signals that the move was not asset-specific or sentiment-driven. It was structural.

Bitcoin Taker Sell Volume Tells the Story

The clearest clue comes from Bitcoin’s taker sell volume data.

On the intraday chart, large spikes in taker sell volume appeared precisely as Bitcoin broke lower. Taker sells reflect market orders hitting the bid — aggressive selling, not passive profit-taking. 

These spikes clustered during US market hours and coincided with the fastest part of the decline.

Bitcoin Taker Volume Across All Exchanges On December 18. Source: CryptoQuant

The weekly view reinforces this pattern. Similar sell-side bursts appeared multiple times over the past week, often during high-liquidity windows, suggesting repeated episodes of forced or systematic selling rather than isolated retail exits.

This behavior is consistent with liquidation cascades, volatility-targeting strategies, and algorithmic de-risking — all of which accelerate once price starts moving against leveraged positions.

Bitcoin Taker Volume Across All Exchanges Over the Past Week. Source: CryptoQuant

Why ‘Good News’ Became the Trigger

The CPI report did not cause the selloff because it was bad. It caused volatility because it was good.

Softer inflation briefly increased liquidity and tightened spreads. That environment allows large players to execute size efficiently. 

Bitcoin’s initial spike likely ran into a dense zone of resting orders, stop losses, and short-term leverage. Once upside momentum stalled, price reversed, triggering long liquidations and stop-outs.

As liquidations hit, forced market selling amplified the move. This is why the decline accelerated rather than unfolded gradually.

The S&P 500’s intraday whipsaw shows a similar dynamic. Rapid downside and recovery patterns during macro releases often reflect dealer hedging, options gamma effects, and systematic flows adjusting risk in real time.

🚨 This is insane level of manipulation.

8:30 a.m.

CPI came in lower than expected.

– On the bullish CPI news, Bitcoin pumped $2217, from $87,260 to $89,477 in just 60 minutes.
– $70B added to the crypto market.
– $94 million worth of shorts liquidated.

10:00 a.m.

The… pic.twitter.com/FmJqLDKbBw

— Bull Theory (@BullTheoryio) December 18, 2025

Does This Look Like Manipulation?

The charts do not prove manipulation. But they show patterns commonly associated with stop-runs and liquidity extraction:

  • Fast moves into obvious technical levels
  • Reversals immediately after liquidity improves
  • Large bursts of aggressive selling during breakdowns
  • Tight alignment with US trading hours

These behaviors are typical in highly leveraged markets. The most likely drivers are not individuals, but large funds, market makers, and systematic strategies operating across futures, options, and spot markets. Their goal is not narrative control, but execution efficiency and risk management.

In crypto, where leverage remains high and liquidity thins quickly outside key windows, these flows can look extreme.

🚨 THEY ARE MANIPULATING BITCOIN AGAIN AND I HAVE EVIDENCE!!!

Bitcoin dumped $4000 in minutes…

and almost no one actually understands what just took place.

It’s the same group of players manipulating the price… AGAIN.

Stop looking at charts, YOU NEED TO CHECK THE OUTFLOWS.… pic.twitter.com/ymU4kXdWvb

— NoLimit (@NoLimitGains) December 18, 2025

What This Means Going Forward

The selloff does not invalidate the CPI signal. Inflation genuinely cooled, and that remains supportive for risk assets over time. What the market experienced was a short-term positioning reset, not a macro reversal.

In the near term, traders will watch whether Bitcoin can stabilize above recent support and whether sell-side pressure fades as liquidations clear. 

If taker sell volume subsides and price holds, the CPI data may still assert itself over the coming sessions.

The post US Inflation Cooled, So Why Did Bitcoin and Stocks Sell Off? appeared first on BeInCrypto.

  •  

US Inflation Cools Sharply in November, CPI Misses Forecasts

US inflation slowed more than expected in November, delivering a clear downside surprise that could reshape near-term market and Federal Reserve expectations. According to fresh data released on December 18, the headline Consumer Price Index (CPI) rose 2.7% year over year, well below market expectations of 3.1%.

Meanwhile, core CPI, which excludes food and energy, increased 2.6% year over year, also missing forecasts of 3.0%. The data marks a notable deceleration in price pressures and signals that disinflation momentum has strengthened heading into the end of 2025.

Is This Bullish For Crypto Markets?

The softer-than-expected print reinforces the view that inflation is cooling faster than policymakers and markets anticipated just weeks ago. Core inflation, closely watched by the Federal Reserve, now sits well below 3%—a level last seen before inflation reaccelerated earlier this year.

This print weakens the case for prolonged restrictive monetary policy and strengthens expectations that the Fed may turn more accommodative sooner than previously priced in.

Markets are likely to interpret the data as rate-cut supportive, particularly for early 2026. Lower inflation reduces pressure on real yields and the US dollar—two key headwinds for risk assets in recent months.

Risk markets, including equities and crypto, were already positioned cautiously ahead of the release, suggesting room for sharp repricing as traders digest the data.

Bitcoin and the broader crypto market entered the CPI release in consolidation mode, with traders bracing for volatility. A downside inflation surprise typically acts as a macro tailwind for crypto, as easing inflation expectations improve liquidity conditions and risk appetite.

Short-term price action will now depend on how quickly markets reprice Fed policy expectations and whether follow-through buying emerges after the initial reaction.

What comes next? Attention will shift to:

  • Updated Fed rate-cut probabilities
  • US Treasury yield reactions
  • Dollar strength or weakness
  • Risk-asset follow-through into year-end

For now, November’s CPI report delivers a clear message: inflation cooled faster than expected, and markets will need to adjust quickly.

The post US Inflation Cools Sharply in November, CPI Misses Forecasts appeared first on BeInCrypto.

  •  

US Job Market Crisis Raises Stakes for Crypto Prices in December and January

The weakening US labour market is emerging as a major risk variable for crypto heading into December and early 2026. Rising layoffs, slowing hiring, and deteriorating consumer confidence have intensified expectations of a Federal Reserve rate cut. 

The shift could influence Bitcoin and Ethereum more sharply than equities due to fragile liquidity conditions across digital assets.

Labour-Market Stress Increases Pressure on the Fed

Layoff announcements surged in October to their highest level since 2003. Several large employers cut jobs or froze hiring, reflecting tariff costs, AI restructuring, and post-shutdown uncertainty. 

Consumer confidence also fell in November as job insecurity increased.

Alternative data shows US layoffs are surging:

Job cuts tracked by MacroEdge jumped +70,609 MoM in October, to 154,559, the highest in at least 2 years.

Monthly job cuts have now exceeded 100,000 for the 5th time this year.

At the same time, layoff announcements compiled by… pic.twitter.com/zLRiMebfi5

— The Kobeissi Letter (@KobeissiLetter) November 28, 2025

Despite these pressures, weekly jobless claims remain low. Markets interpret this mixed picture as a sign that the economy is softening but not collapsing. 

As a result, traders now expect a 25-basis-point rate cut at the December meeting. Futures markets price a significant easing for 2026.

A December cut would mark a sharp pivot from the Fed’s earlier “higher for longer” stance. It would also signal that the central bank is responding to labour-market weakness before broader damage spreads.

Fed Rate Cut Probability For December. Source: CME FedWatch

Crypto Markets Are Highly Sensitive to Liquidity Signals

Bitcoin and Ethereum still operate in thin liquidity after the October 10 liquidation shock. Market makers reduced risk inventories, leaving order books with less depth. 

Tom Lee described the market as “limping” for six weeks due to damaged liquidity capacity.

These conditions increase the impact of macro shifts. When liquidity is thin, changes in interest-rate expectations typically move crypto faster than equities

This dynamic was clear during November, when ETF outflows and selling pressure pushed Bitcoin down nearly 30% from its October peak.

On-chain metrics now show signs of stabilisation. The 90-day Taker CVD has moved from persistent selling to neutral, indicating seller exhaustion. 

At the same time, users are borrowing against Bitcoin rather than selling it, which reduces immediate supply pressure but increases latent liquidation risk.

December Rally Is Possible, but Not Guaranteed

A December rate cut would reduce real yields and inject liquidity into risk assets. Bitcoin historically rallies during such conditions, especially after deep drawdowns. 

Several metrics already point to improving momentum. Fear and Greed Index readings lifted from 11 to 22. Average crypto RSI rose toward 60 after touching oversold levels earlier in the month. MACD also turned positive.

🔴Record layoffs in the US

US companies cut 153,000 jobs in October, 175% more than a year ago. That makes October the worst in 20 years and the rate the highest for the fourth quarter since 2008🗓

For the crypto market, this creates a double effect: on the one hand, a… pic.twitter.com/LcAcbjwhFk

— Vlados0707 (@Vladislav77001) November 9, 2025

However, ETF flow data remains uncertain. November saw heavy outflows, though recent days show tentative inflows. 

If ETF demand returns, thin liquidity could amplify upside moves. If outflows resume, the market could revisit recent lows.

Macro signals will therefore dominate crypto into year-end. A dovish Fed stance may trigger a rally similar to 2023. 

A hawkish tone could undermine the current recovery and reinforce the bearish trend seen in November.

Binance Bitcoin & Ethereum Exchange Inflow Value Is Structurally Elevated

“This often aligns with phases of rotation rather than pure accumulation. Large players move size onto the exchange, giving the market more room for distribution.” – By @TeddyVision pic.twitter.com/wnpOWkyhPL

— CryptoQuant.com (@cryptoquant_com) November 28, 2025

January 2026 Carries Added Volatility Risk

Even if crypto rallies in December, January remains uncertain. The combined October–November employment report arrives on December 16. The release may confirm deeper labour stress not yet captured in weekly data.

If layoffs accelerate into January, risk assets may weaken. Markets could interpret labour deterioration as a sign of recession. 

In that scenario, rate cuts may not offset broad risk aversion. Bitcoin often reacts first in such conditions due to its liquidity profile.

Alternatively, if the report shows moderate softness with stable wage growth, markets may price a controlled slowdown. 

This would support a continuation of any December rally into early 2026. In both cases, liquidity conditions will govern the scale of price swings.

With momentum improving and liquidity still thin, the market remains primed for a significant move. The direction will be set by how the Federal Reserve responds to growing labour-market pressure and how investors interpret the broader economic signal in the weeks ahead.

The post US Job Market Crisis Raises Stakes for Crypto Prices in December and January appeared first on BeInCrypto.

  •  

RBNZ Expected To Cut Interest Rates To 2.25% In November

The Reserve Bank of New Zealand (RBNZ) is expected to cut the Official Cash Rate (OCR) to 2.25% from 2.5%, following the conclusion of the November monetary policy meeting on Wednesday. 

The decision will be announced at 01:00 GMT, accompanied by the Monetary Policy Statement (MPS) and followed by RBNZ Governor Christian Hawkesby’s press conference at 02:00 GMT. The New Zealand Dollar (NZD) will likely experience a big reaction to the central bank’s policy announcements.  

What to expect from the RBNZ interest rate decision?

Following a standard 25-basis-point (bps) rate cut in August and a surprise 50-bps move in October, the RBNZ is expected to deliver a hat-trick, with a 25-bps reduction fully baked in for the November monetary policy meeting.  

The central bank decided to opt for a big rate cut in its last policy decision in the face of a slowing economy and confidence that inflation was under control

In its October Monetary Policy Review (MPR), the RBNZ noted that the “committee remains open to further reductions in the OCR as required for inflation to settle sustainably near the 2 percent target midpoint in the medium term.” 

Therefore, another rate cut on Wednesday would come as no surprise. 

Hence, all eyes will be on the discussions among the policymakers on further monetary policy easing heading into 2026. 

The revisions to the OCR projection in the first half of next year will also be closely scrutinized to gauge the bank’s path forward on rates. 

NZ Inflation Continues to Accelerate

Since the October 8 meeting, New Zealand’s annual Consumer Price Index (CPI) inflation accelerated in the third quarter (Q3), coming in at 3.0%, in line with the forecasts and at the top end of the central bank’s 1% to 3% target range. 

However, the RBNZ made it clear in October that inflation was ticking higher, but noted that spare capacity in the economy should bring it back to 2% by mid-2026, suggesting that policymakers don’t expect inflation to be persistent. 

On top of that, the annual non-tradeable inflation decreased to 3.5% in Q3, compared with 3.7% in the second quarter. 

Additionally, the RBNZ’s monetary conditions survey showed on November 11 that two-year inflation expectations, seen as the time frame when the central bank policy action will filter through to prices, steadied at 2.28% in Q4 2025. 

Meanwhile, New Zealand’s Unemployment Rate rose to 5.3% in Q3 from 5.2% in the second quarter, according to the official data released by Statistics New Zealand on November 4. The figure aligned with the market consensus. 

Amidst expectations that underlying inflation is largely slowing, another rate cut by the RBNZ is justified. 

Economists at Westpac NZ said: “We expect a 25bp cut in the OCR to 2.25%. 

We see a downward revision in the projected OCR track of around 30-35bp, with a low point in the projection of around 2.20% in the first half of 2026. The implication is a mild and data-dependent easing bias for next year.” 

How will the RBNZ interest rate decision impact the New Zealand Dollar? 

The NZD/USD pair is miring in seven-month lows as the RBNZ event risk looms. Heightened expectations of a November rate cut have weighed heavily on the NZD since the end of October. 

If the central bank downgrades its inflation and/or OCR forecasts while retaining the easing bias, the Kiwi Dollar could extend the current downside. 

On the contrary, the NZD could witness a big relief rally should the RBNZ signal the end of the rate-cutting cycle amid an improving economic outlook and receding US tariff fears. 

Dhwani Mehta, Asian Session Lead Analyst at FXStreet, offers a brief technical outlook for NZD/USD and explains:

“From a near-term technical perspective, bearish potential remains intact for the Kiwi pair as the 14-day Relative Strength Index (RSI) remains vulnerable well beneath the midline.” 

“If sellers flex their muscles on a dovish RBNZ cut, the NZD/USD pair could drop further toward the falling trendline support at 0.5550. Further south, the 0.5500 round level and the April low of 0.5486 could be tested. On the flip side, the pair needs to scale the 21-day Simple Moving Average (SMA) at 0.5663 on a sustained basis for any meaningful recovery. The next relevant topside targets align at the 50-day SMA at 0.5735 and the 0.5800 threshold,” Dhwani adds.

The post RBNZ Expected To Cut Interest Rates To 2.25% In November appeared first on BeInCrypto.

  •  

Fed Minutes Reveal December Rate Cut on a Knife’s Edge, Bitcoin Slips Below $89,000

The Federal Reserve’s newly released minutes from the October 28–29 meeting have thrown fresh uncertainty into the December policy outlook, sharpening market volatility across equities, bonds, and Bitcoin.

While the minutes reflect economic data only available at the time of the meeting, the language shift inside the document has become the latest flashpoint for analysts dissecting the Fed’s next move.

Fed Minutes Expose a Narrow Majority Against a December Rate Cut

The Fed described “many” officials as seeing a December rate cut as “likely not appropriate,” while “several” said a cut “could well be appropriate.”

In Fed-watcher parlance, the hierarchy matters. “some” > “several”, and “many” outweighs both. This indicates that a narrow majority opposed cutting rates in December at the time of the meeting.

💥BREAKING:

FOMC MINUTES:

– MANY SAW DECEMBER RATE CUT AS LIKELY NOT APPROPRIATE

– SEVERAL SAID DECEMBER CUT 'COULD WELL BE' APPROPRIATE pic.twitter.com/nAVD0RFUEc

— Crypto Rover (@cryptorover) November 19, 2025

The minutes also indicated emerging stress points in money markets:

  • Repo volatility,
  • Declining ON RRP usage, and
  • Reserves drifting toward scarcity.

This combination historically preceded the end of quantitative tightening (QT). Sentiment, therefore, is that the Fed may be closer than expected to ending balance-sheet runoff.

Ahead of this release, markets had already de-risked, with the Bitcoin price slipping below $89,000 to a 7-month low. The sentiment spread across crypto stocks and TradFi indices.

Bitcoin (BTC) Price Performance
Bitcoin (BTC) Price Performance. Source: BeInCrypto

Macro traders say the real story is the razor-thin nature of the Fed divide. The minutes indicate no firm consensus, suggesting December is shaping up to be one of the tightest policy calls since the Fed began its inflation fight.

Some officials emphasized still-elevated inflation risks; others pointed to cooling labor conditions and fading demand. With both sides arming themselves with recent post-meeting data, including softer CPI, stable jobless claims, and cooling retail activity, December could swing on the next two data prints.

For now, the market is recalibrating to a scenario where liquidity is tightening, policy uncertainty is rising, and Bitcoin sits in a structurally vulnerable zone until buyers regain initiative.

If the Fed chooses to hold in December, markets may need to brace for a longer-than-expected plateau and more volatility ahead.

The post Fed Minutes Reveal December Rate Cut on a Knife’s Edge, Bitcoin Slips Below $89,000 appeared first on BeInCrypto.

  •