Reading view

XRP Selling Pressure Collapses 39%, But This Price Level Still Controls the Outcome

XRP price is nearing a critical decision point as 2025 approaches its final stretch. Price remains weak on higher timeframes, almost 16% down month-on-month. But cracks are starting to appear in selling pressure. Momentum indicators and on-chain data now suggest that sellers are losing control, even though price has not yet confirmed a reversal.

The setup is no longer about guessing a rally. It is about whether fading sell pressure is enough to push the XRP price through a known supply wall. And that wall still matters.

Sellers Are Losing Control?

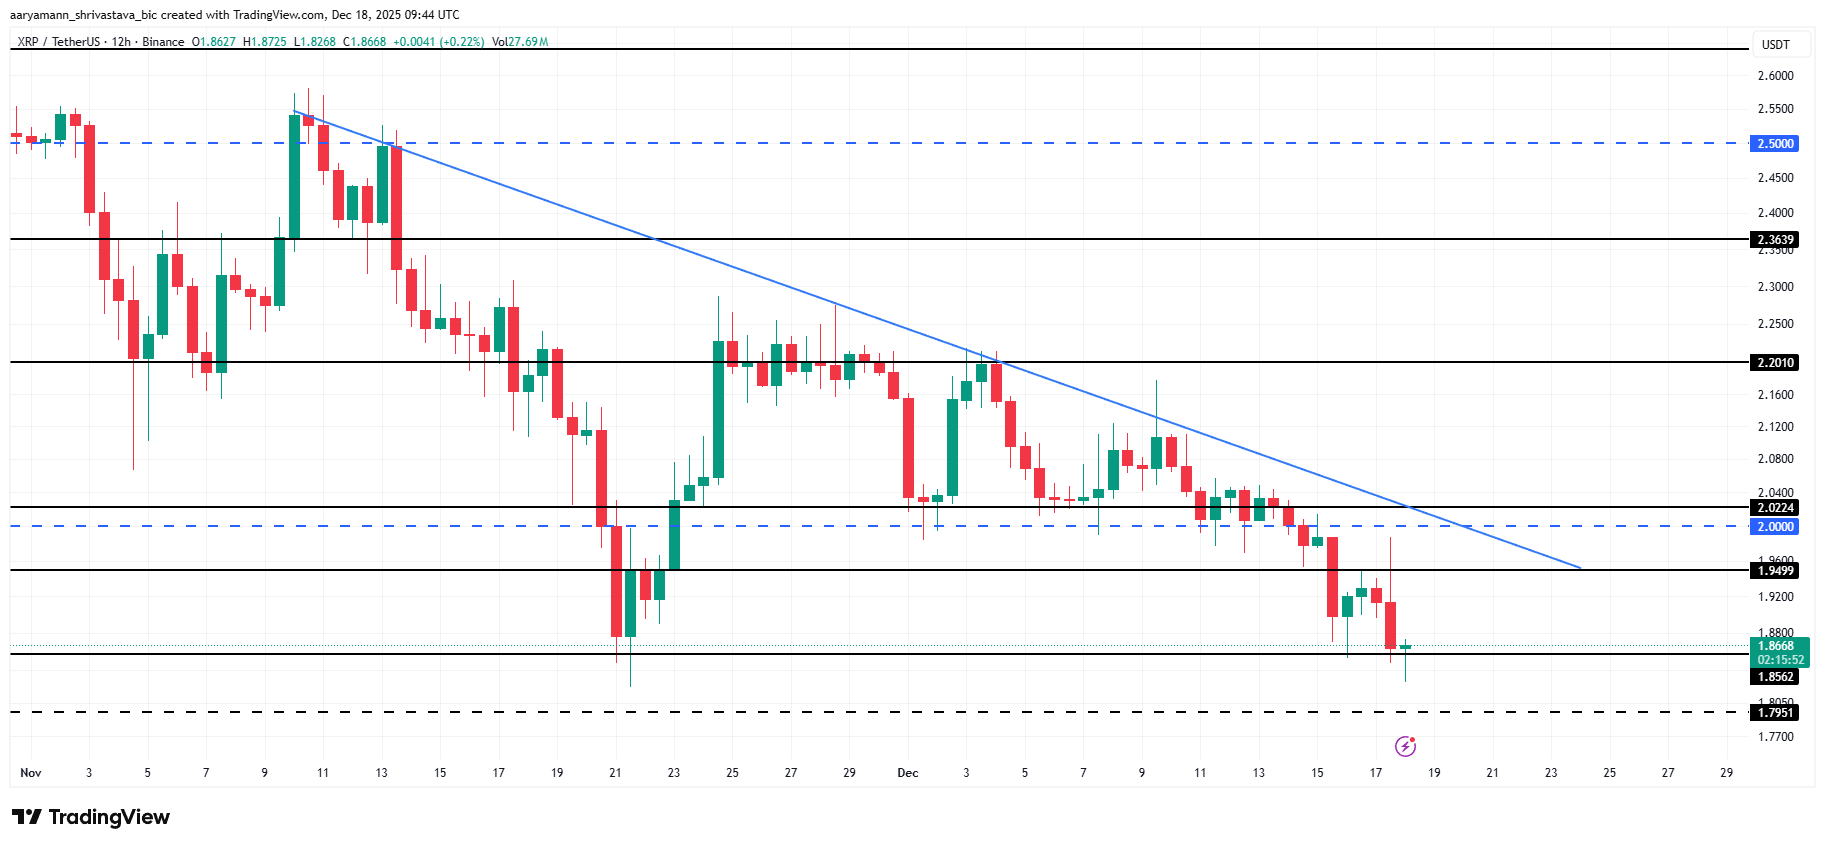
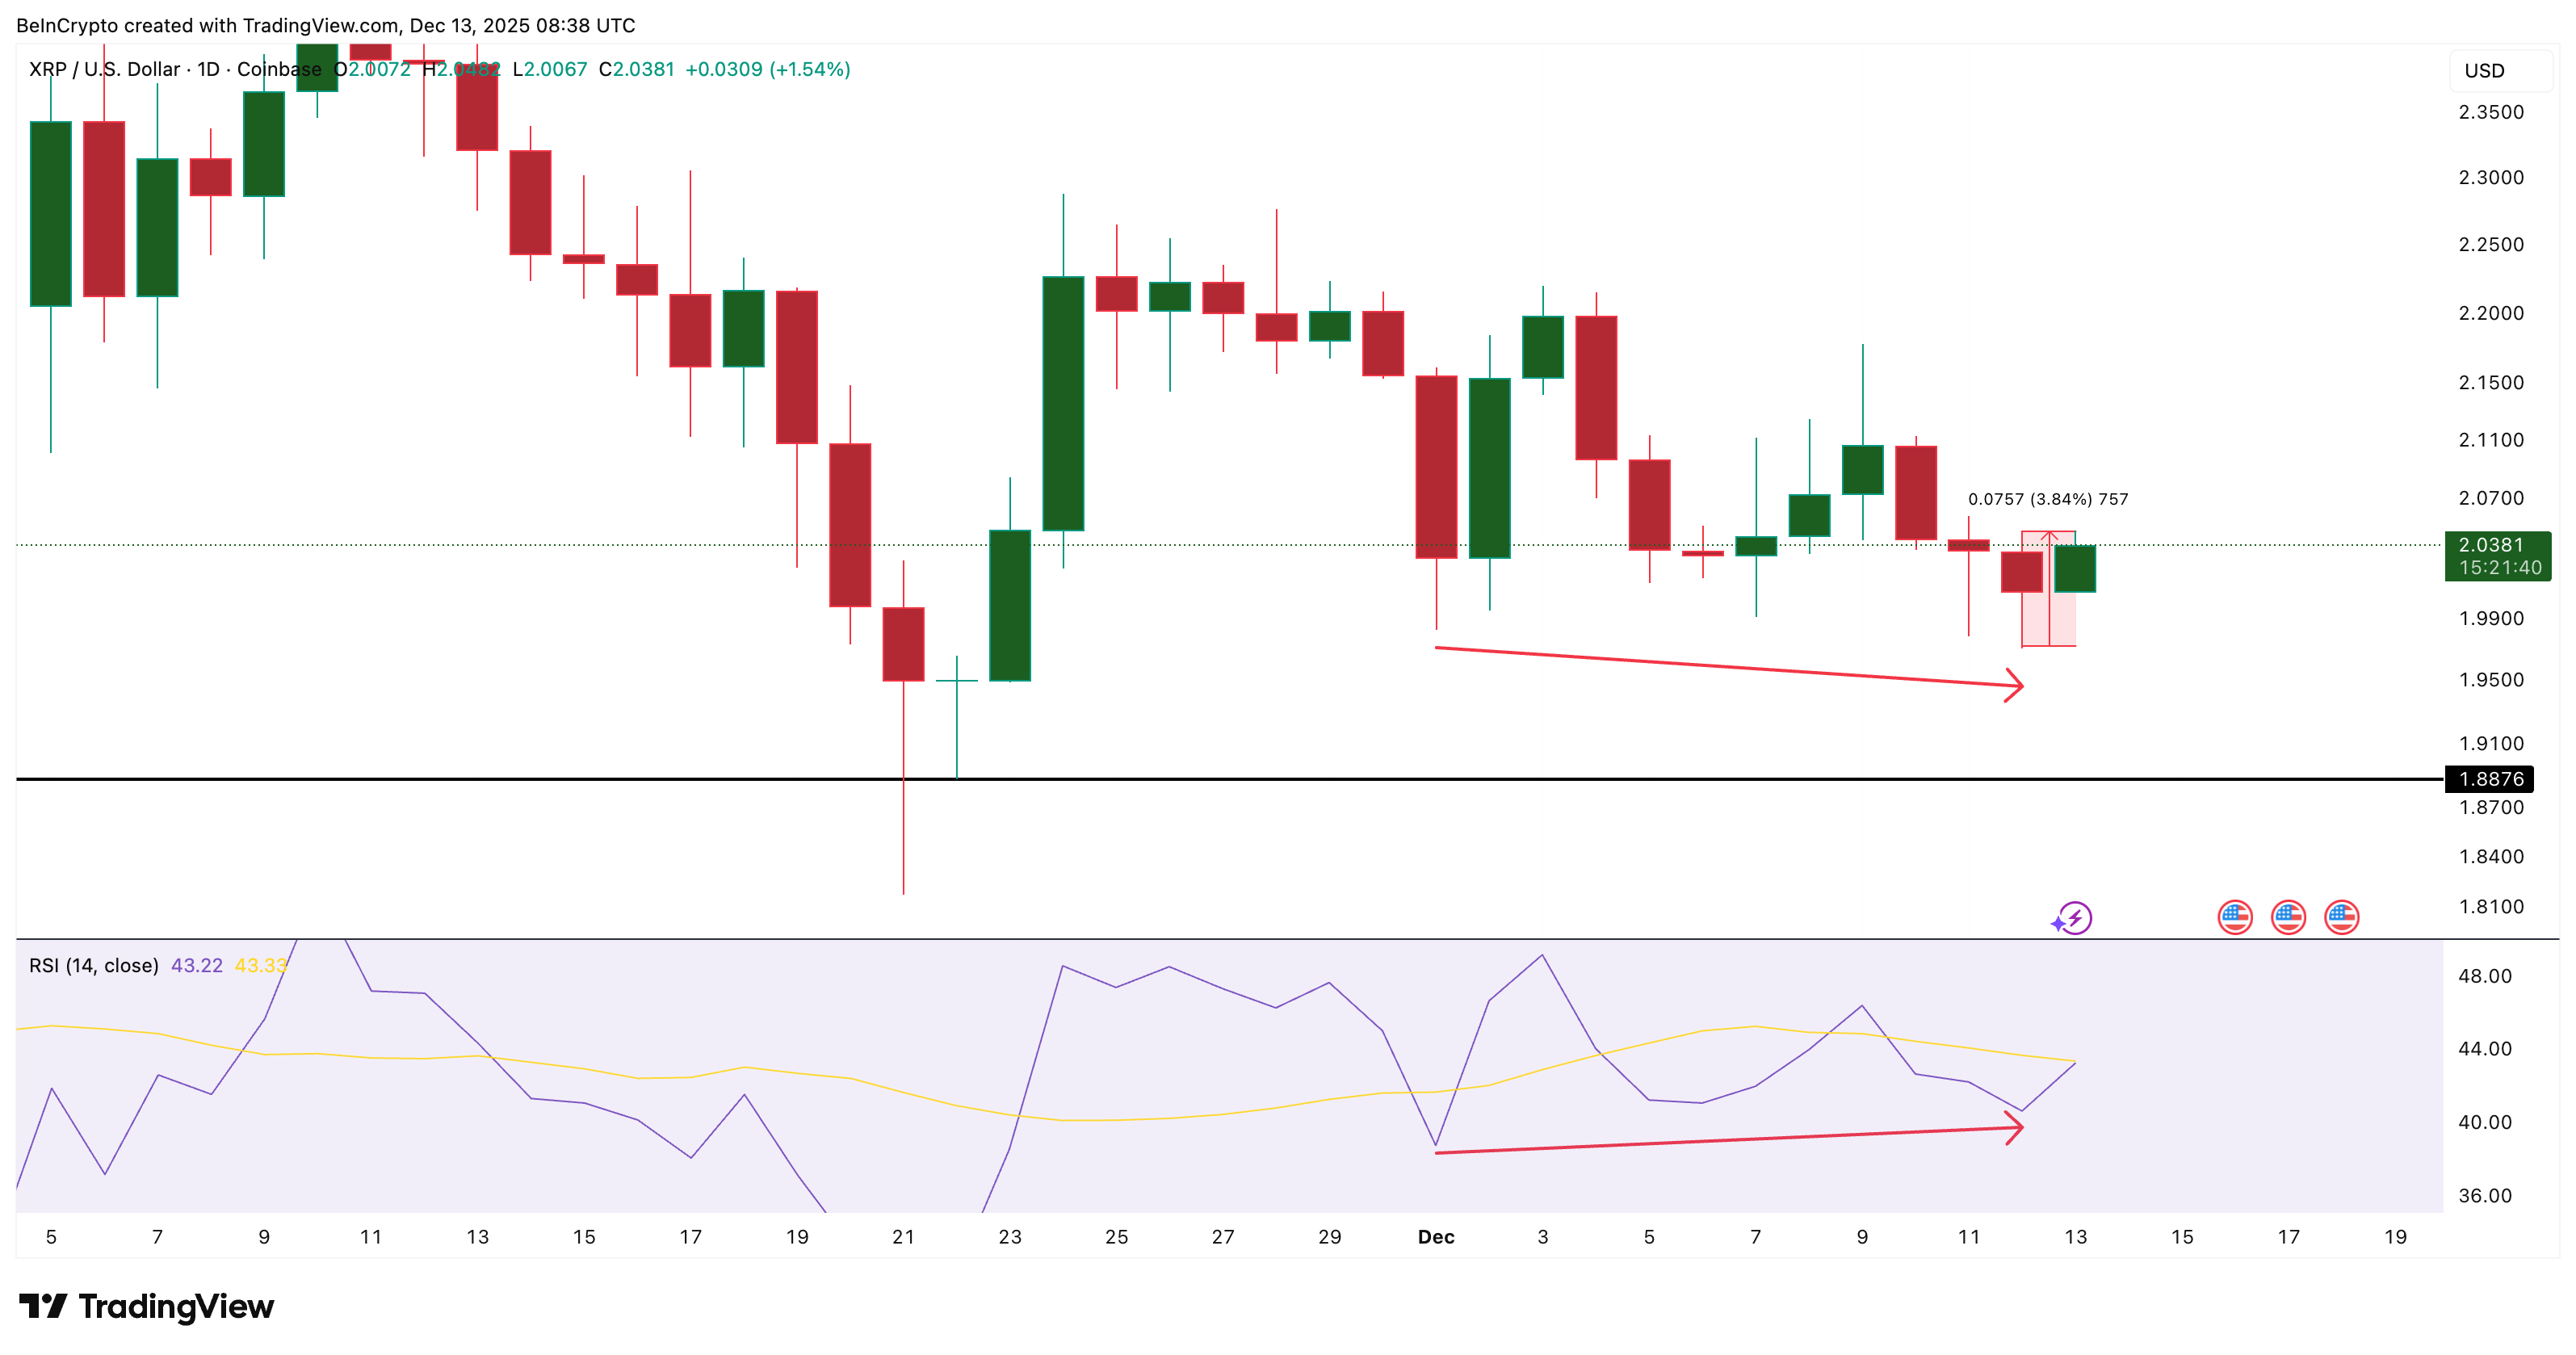
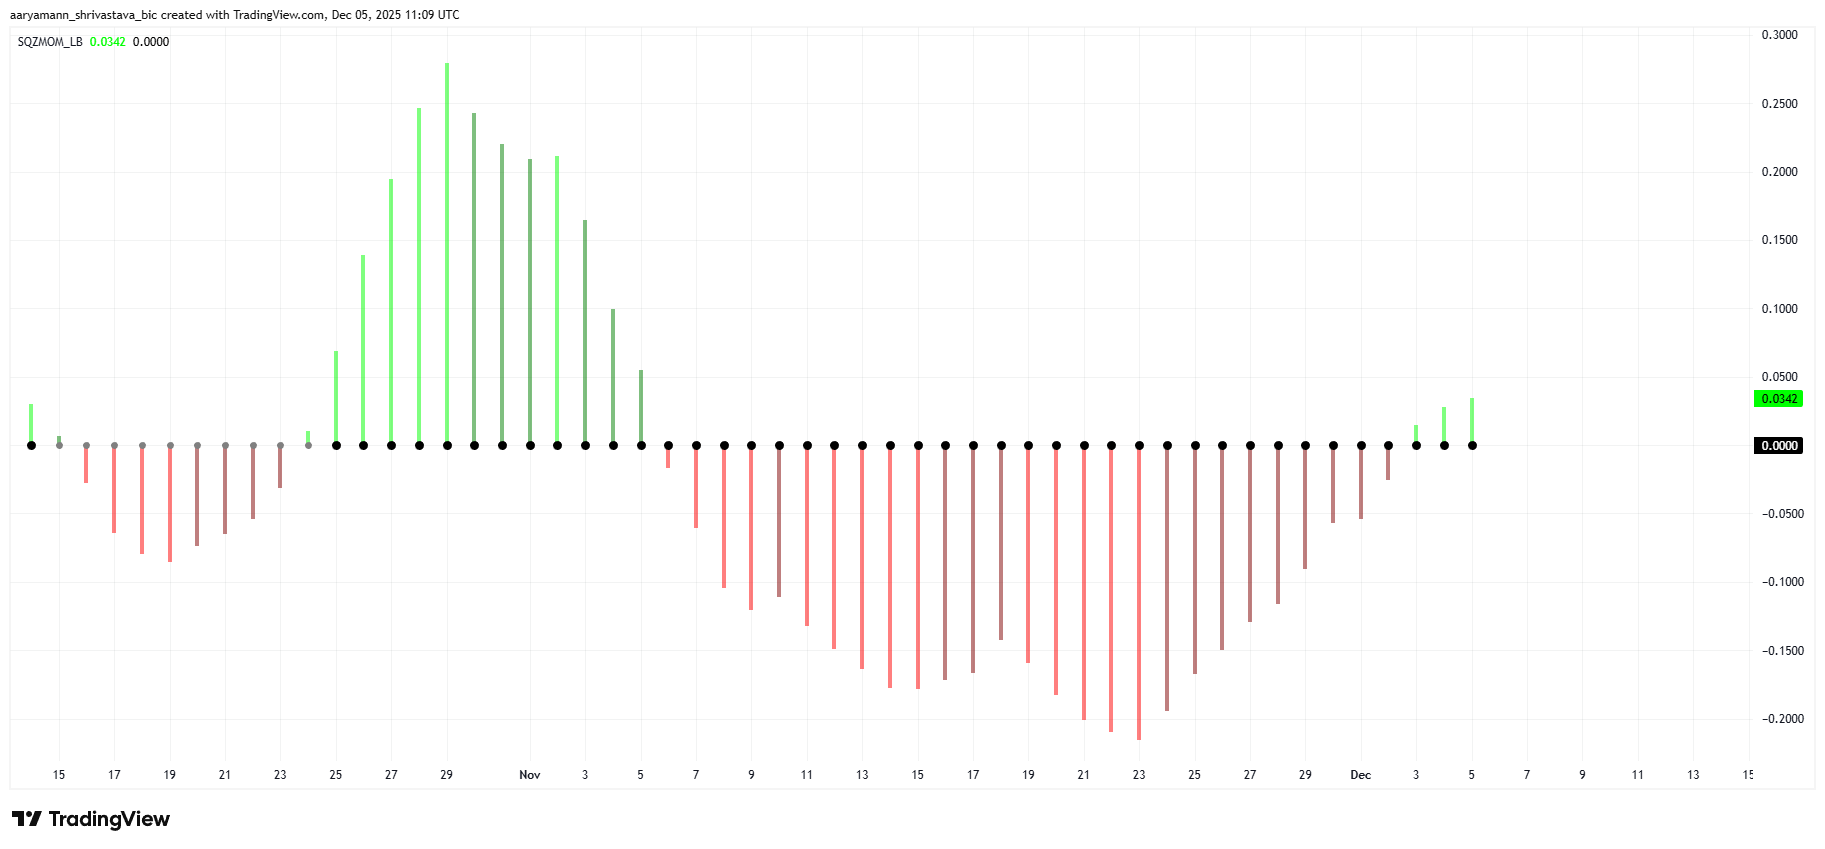
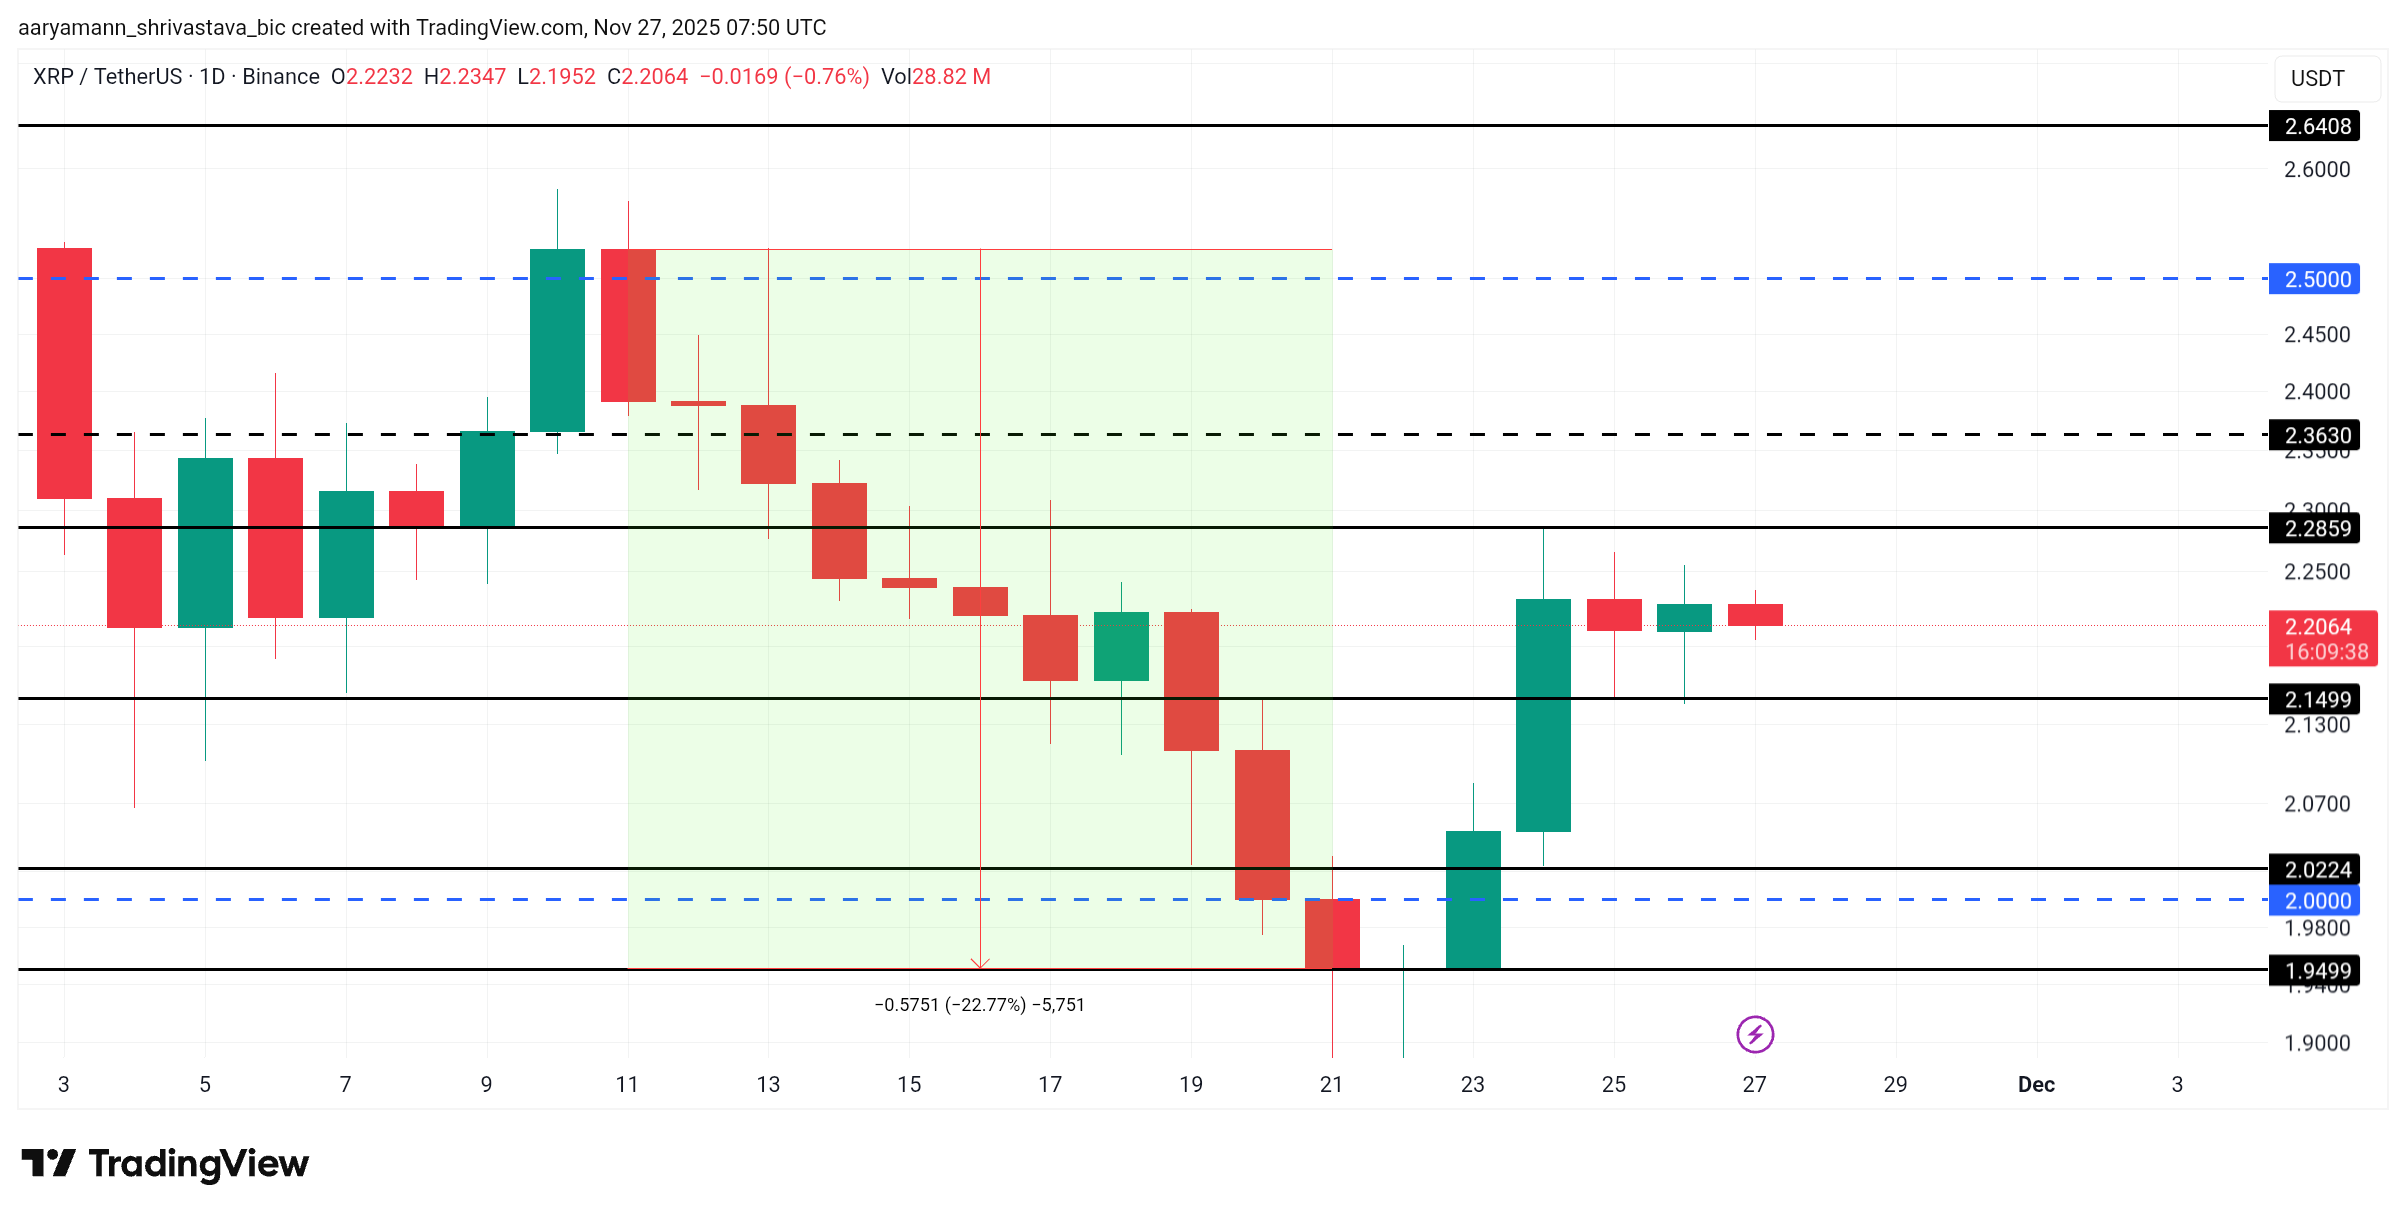
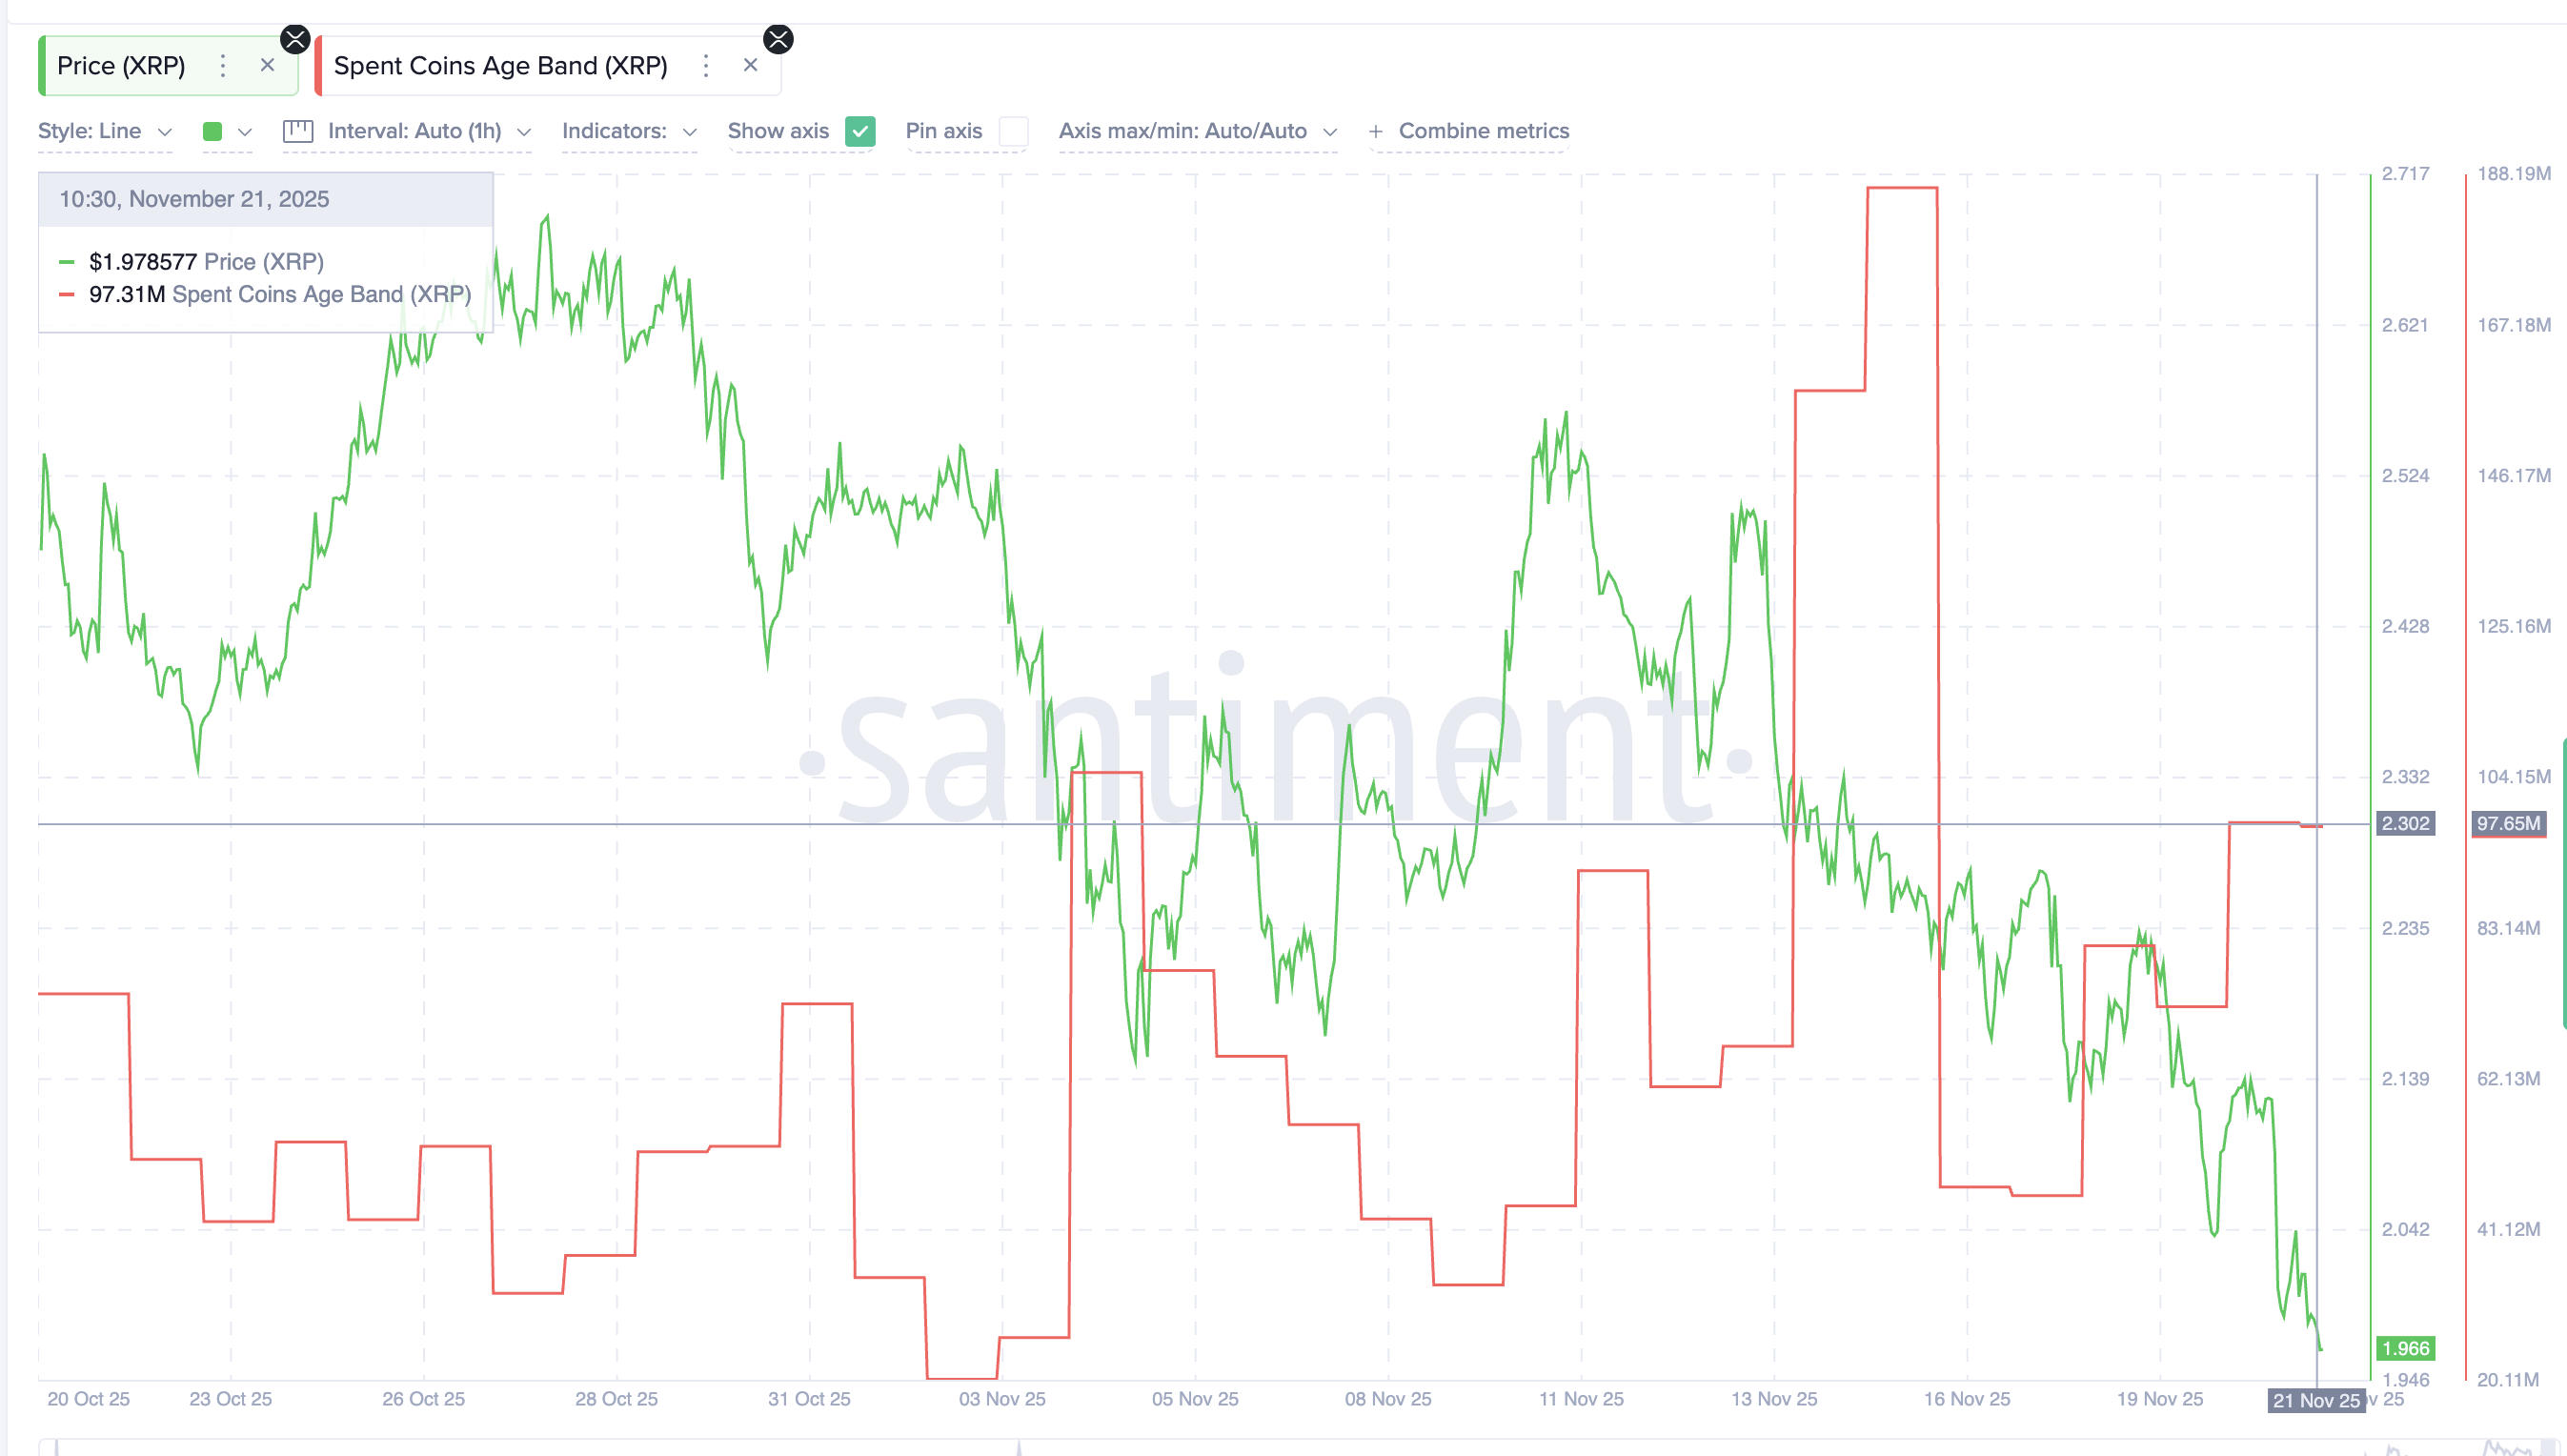
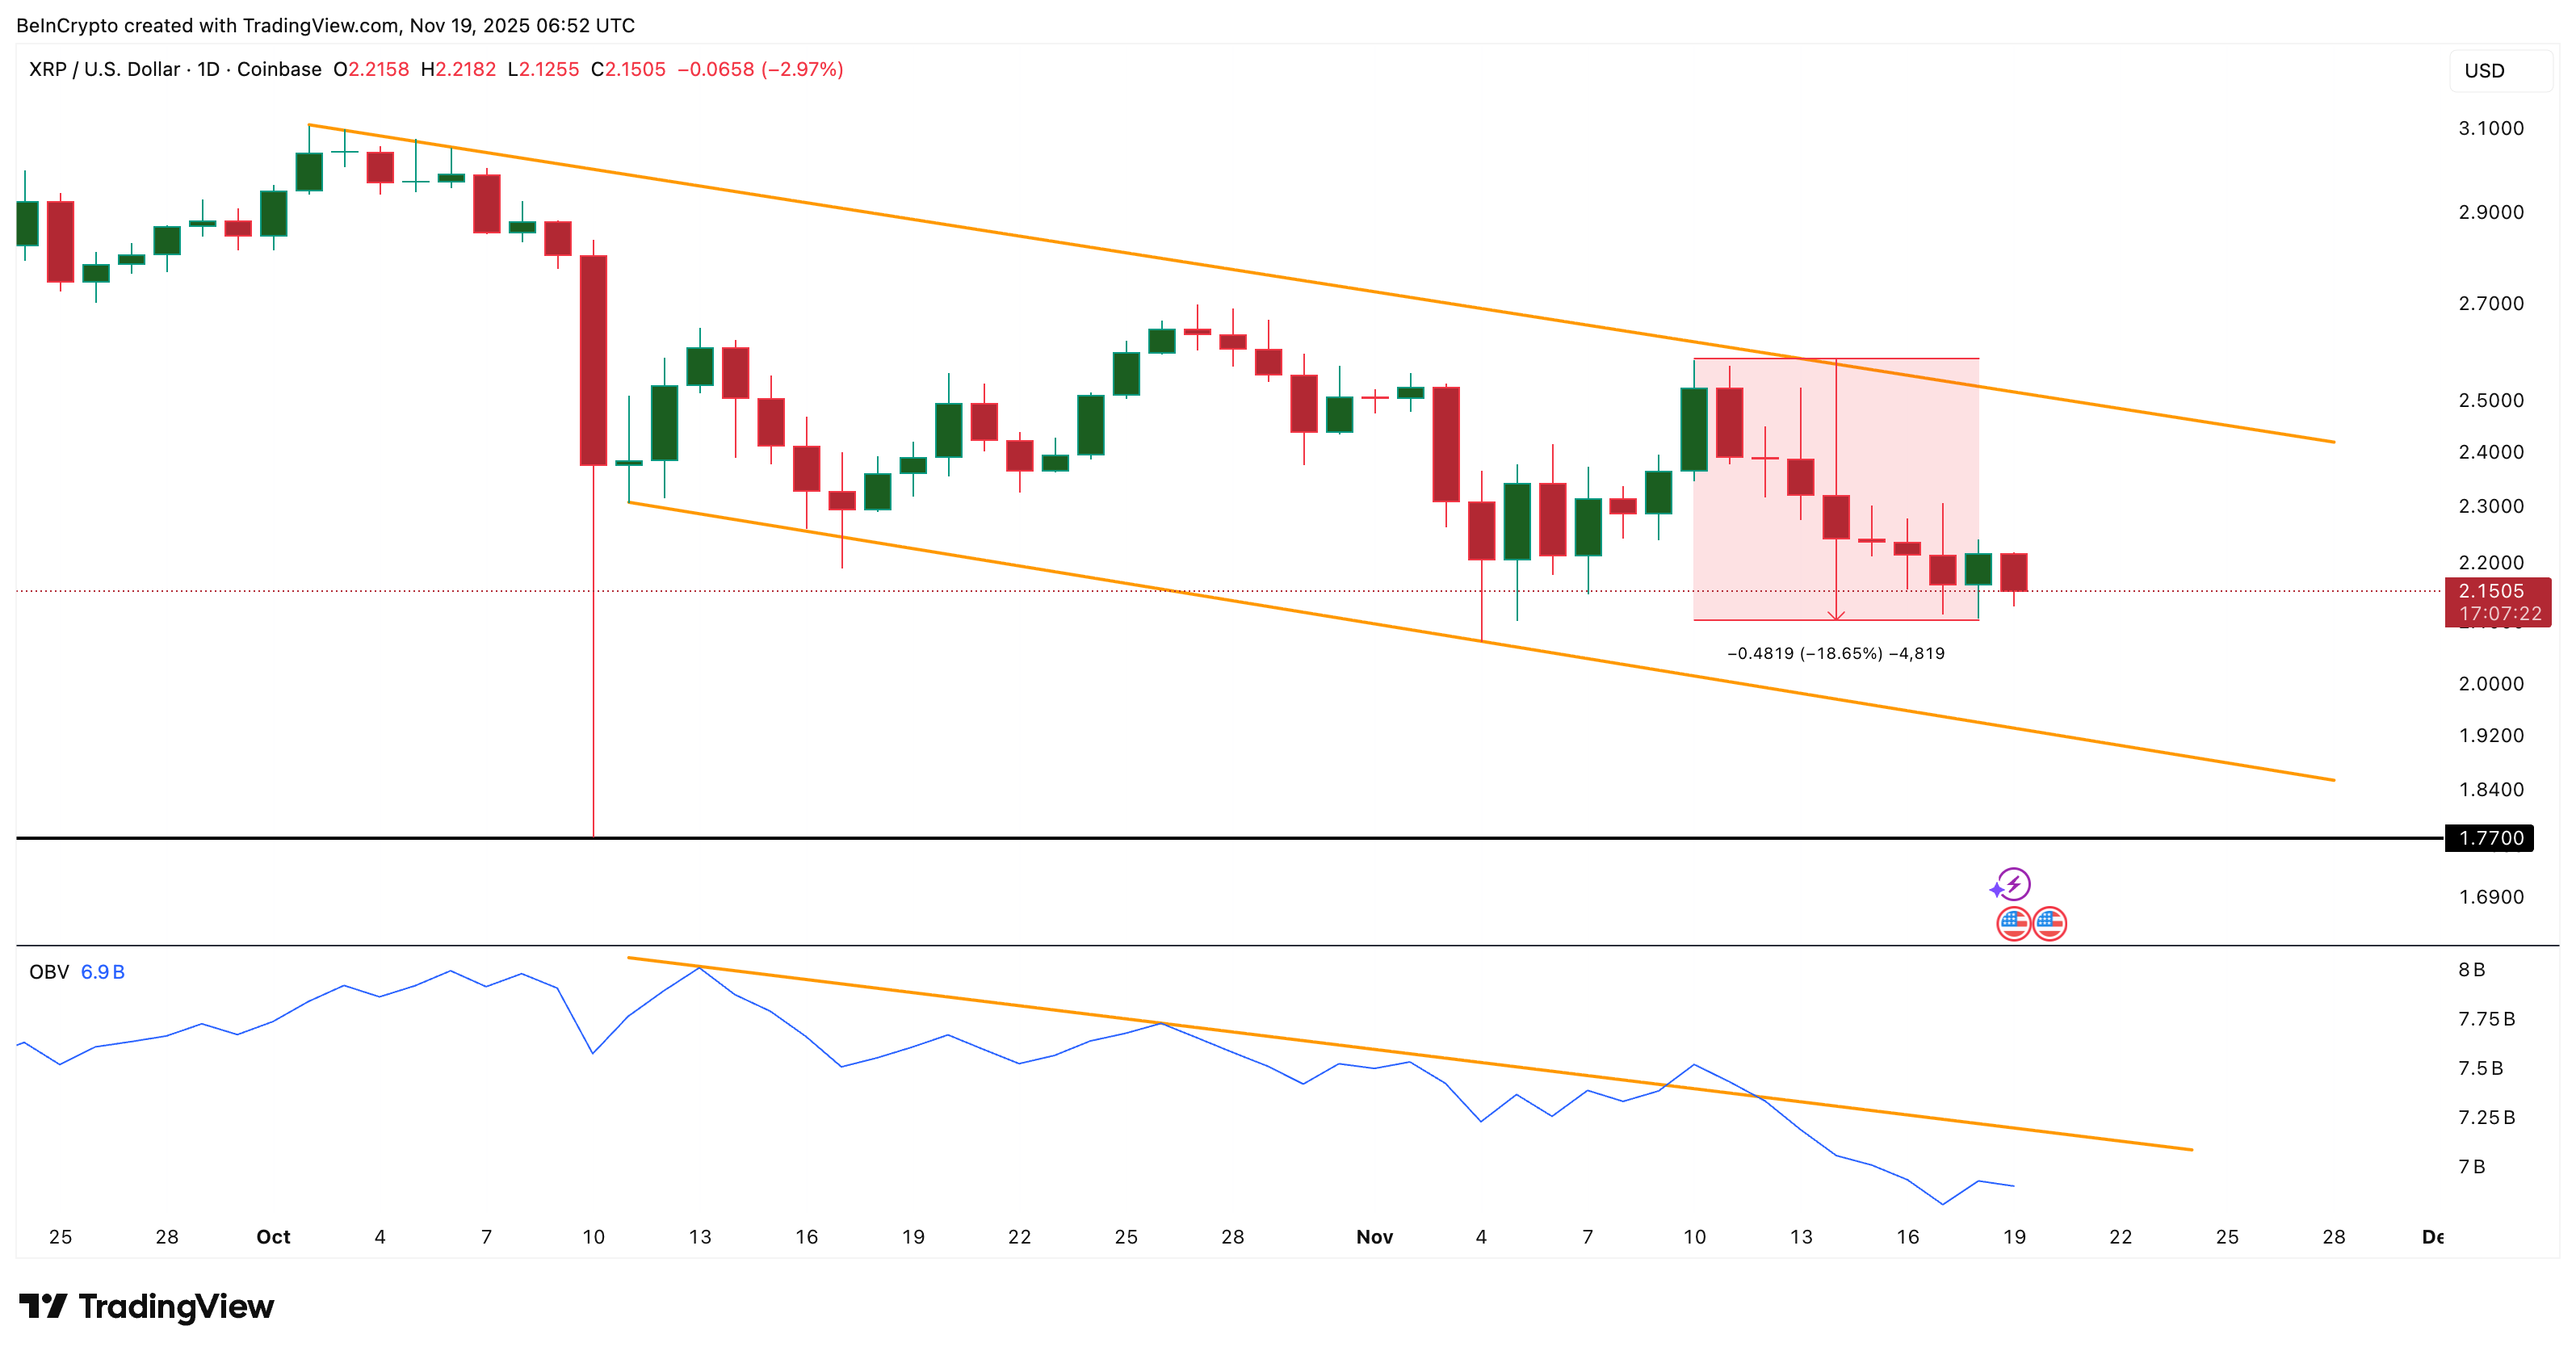
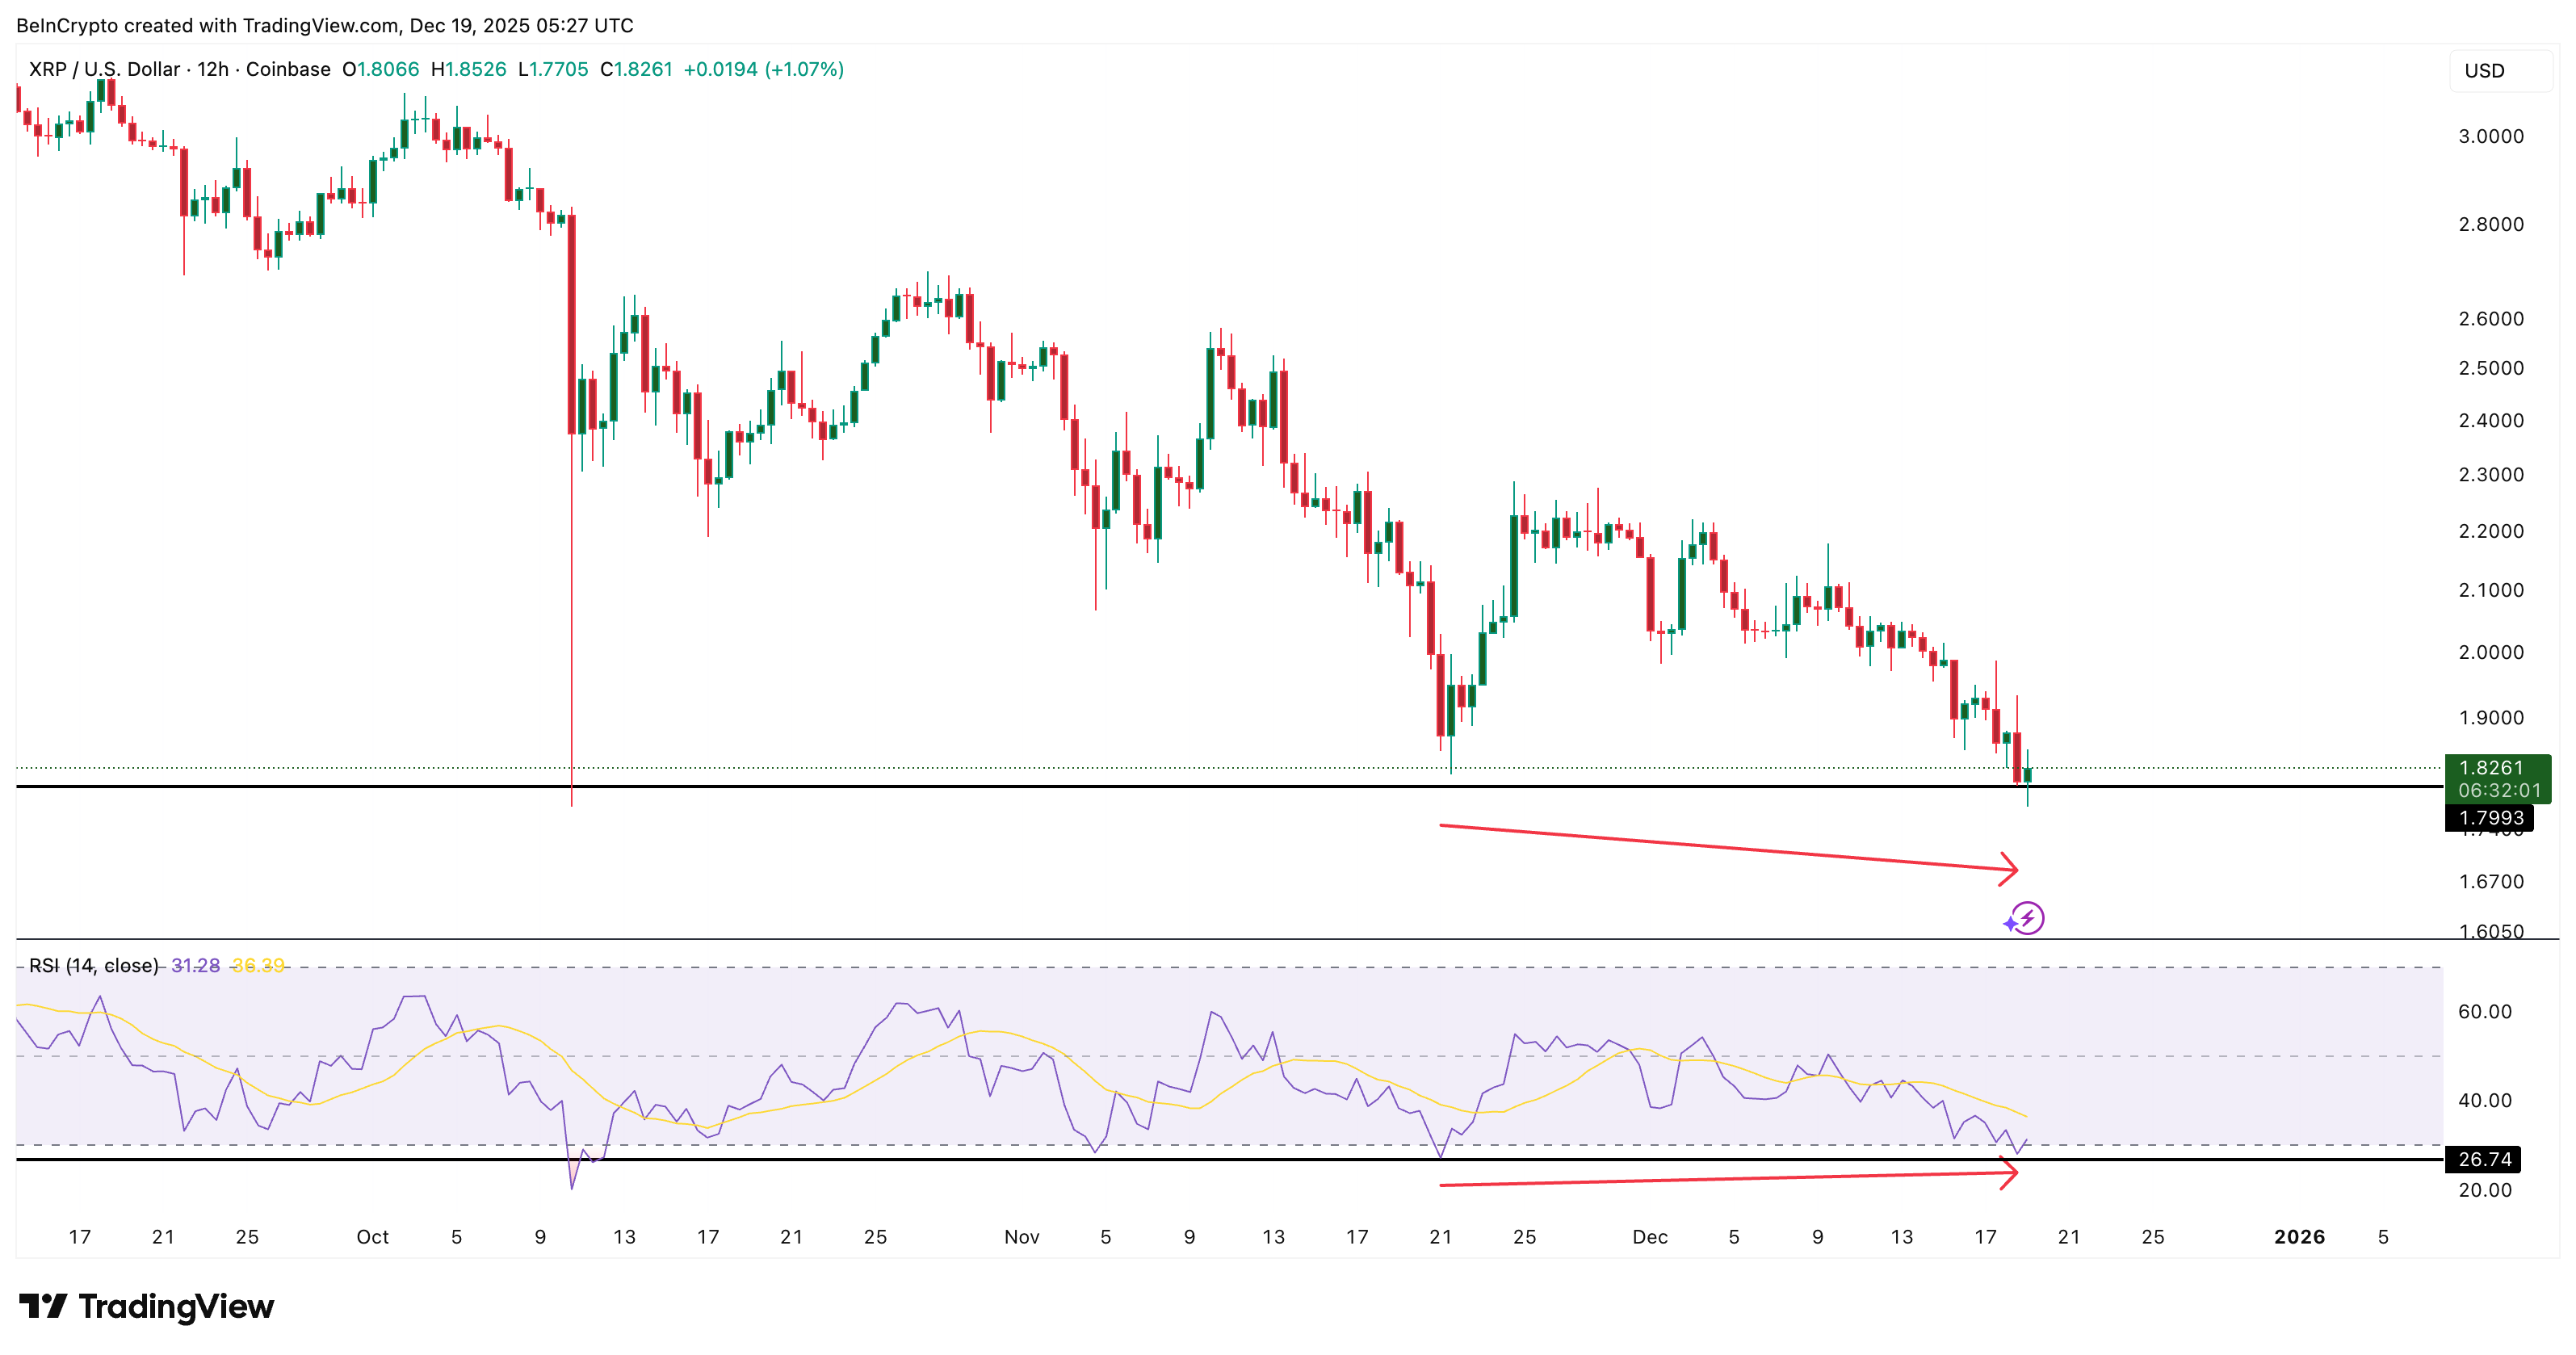
Early signs of a rebound are showing up on the 12-hour chart, where trend shifts often appear first.

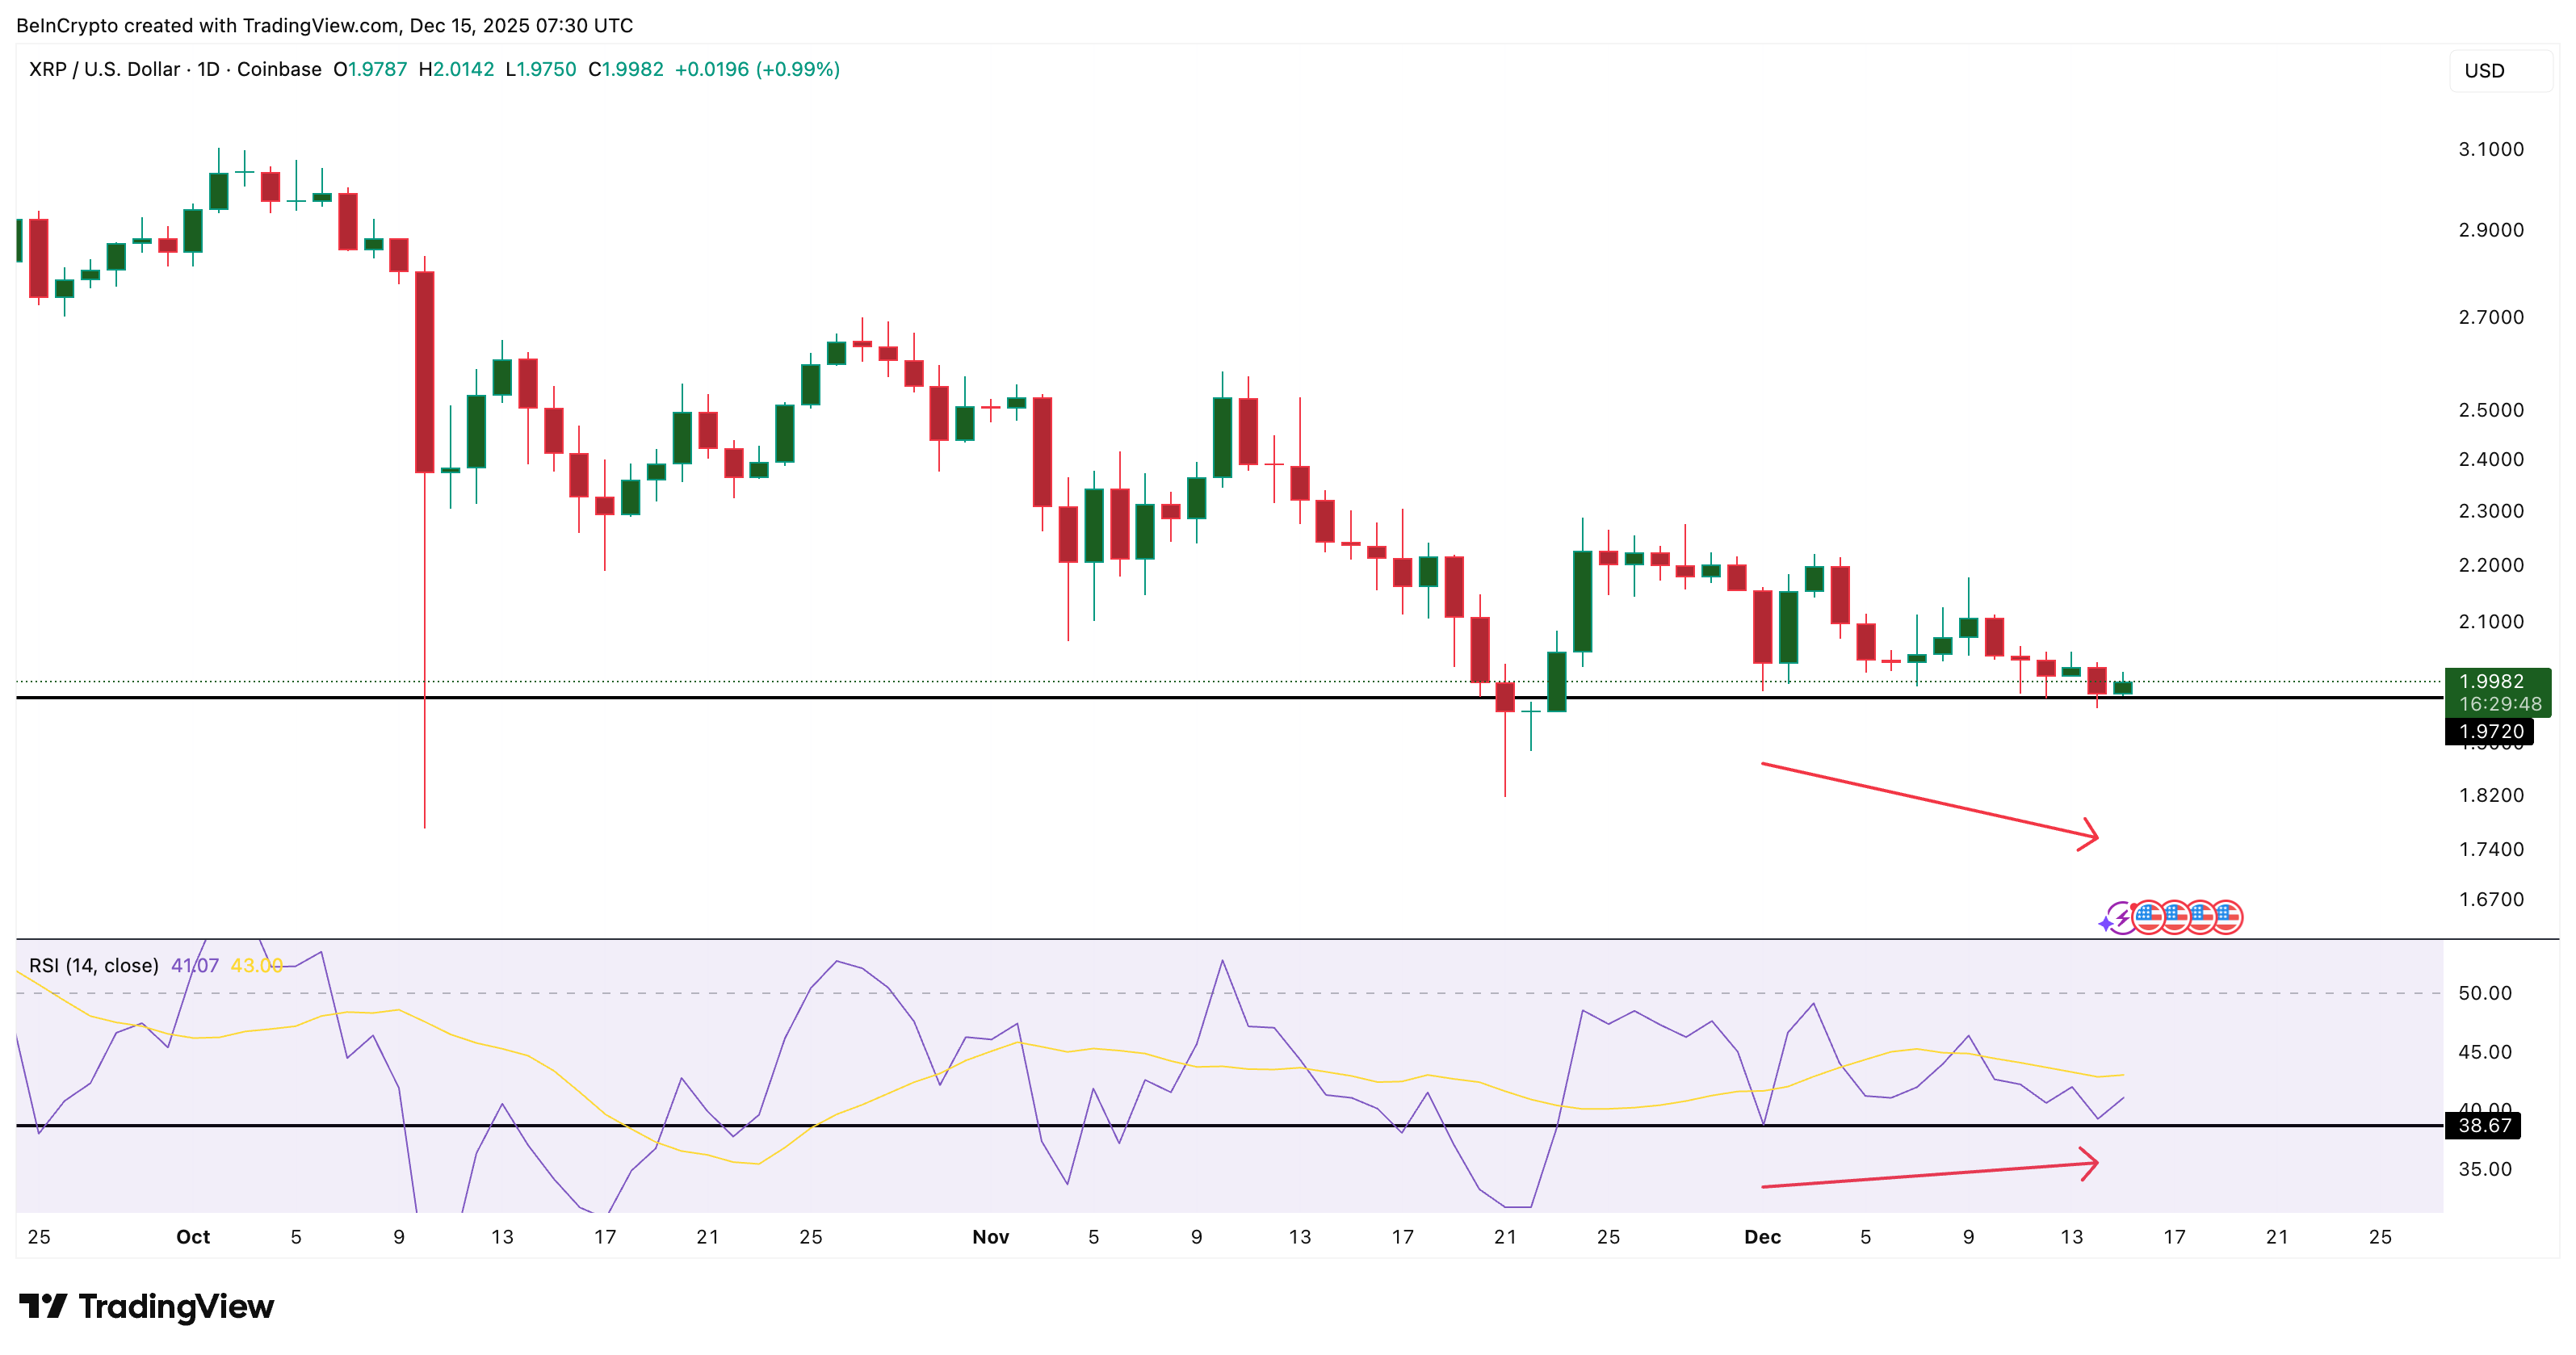
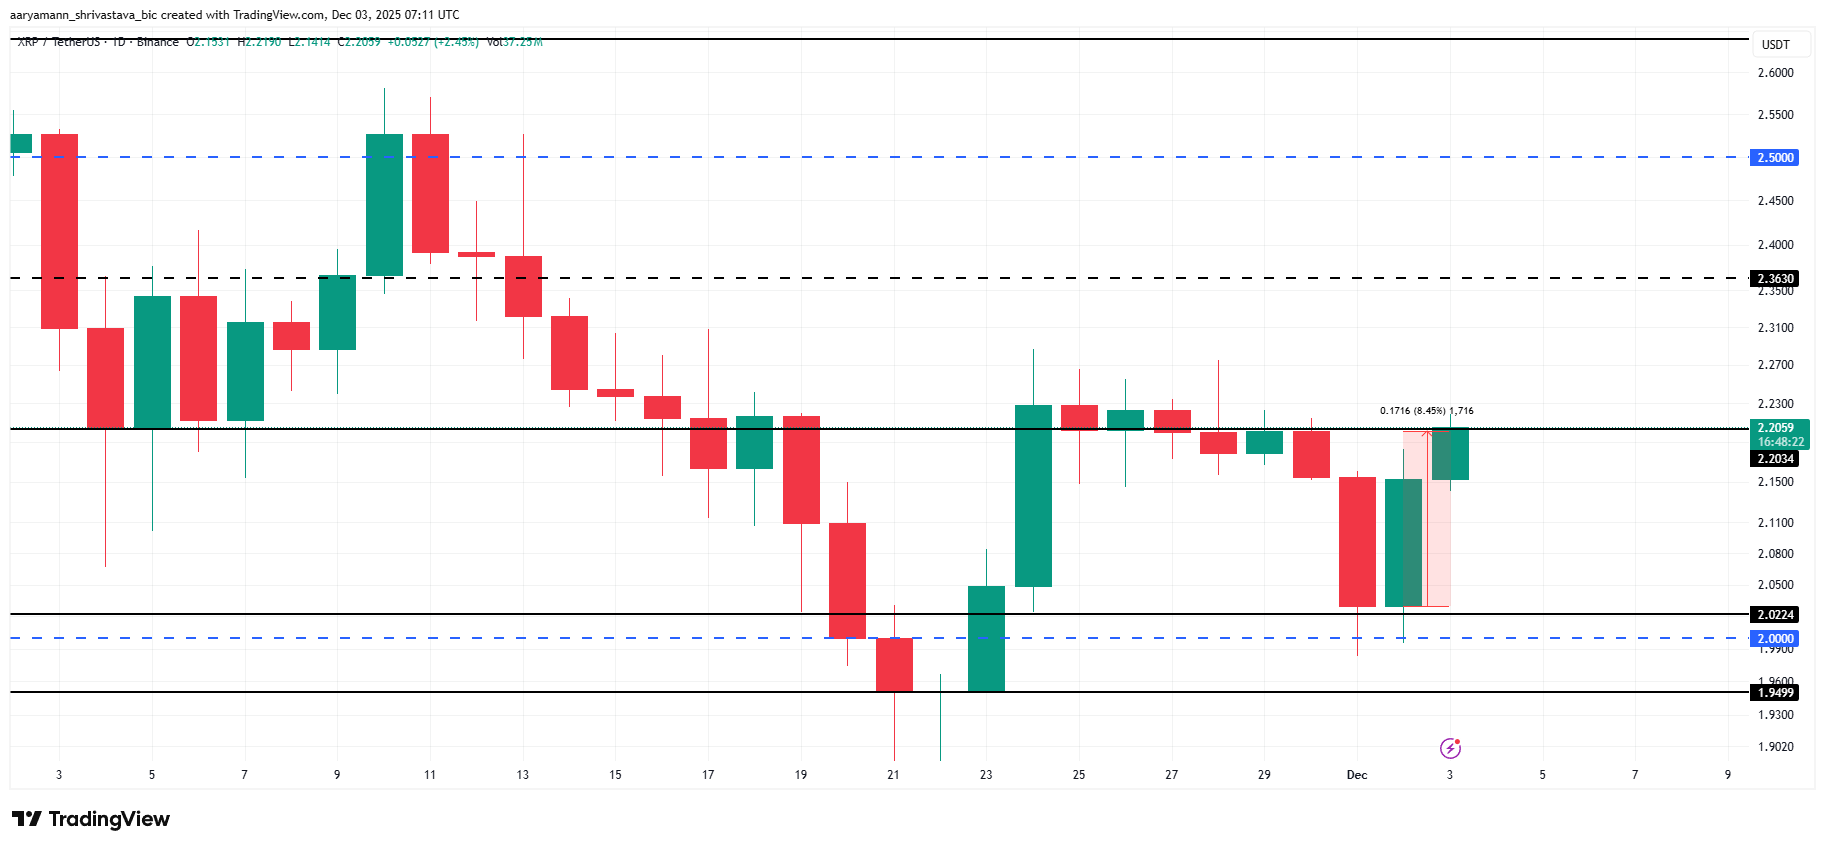
Between November 21 and December 18, the XRP price made a lower low. During the same period, the RSI made a higher low. RSI (Relative Strength Index) measures momentum. When price falls, but RSI improves, it signals bullish divergence.

Bullish Divergence
Bullish Divergence: TradingView

Want more token insights like this? Sign up for Editor Harsh Notariya’s Daily Crypto Newsletter here.

This pattern suggests that, although the XRP price continued to decline, the selling momentum weakened. Sellers were still active, but they were no longer able to push momentum lower with the same force.

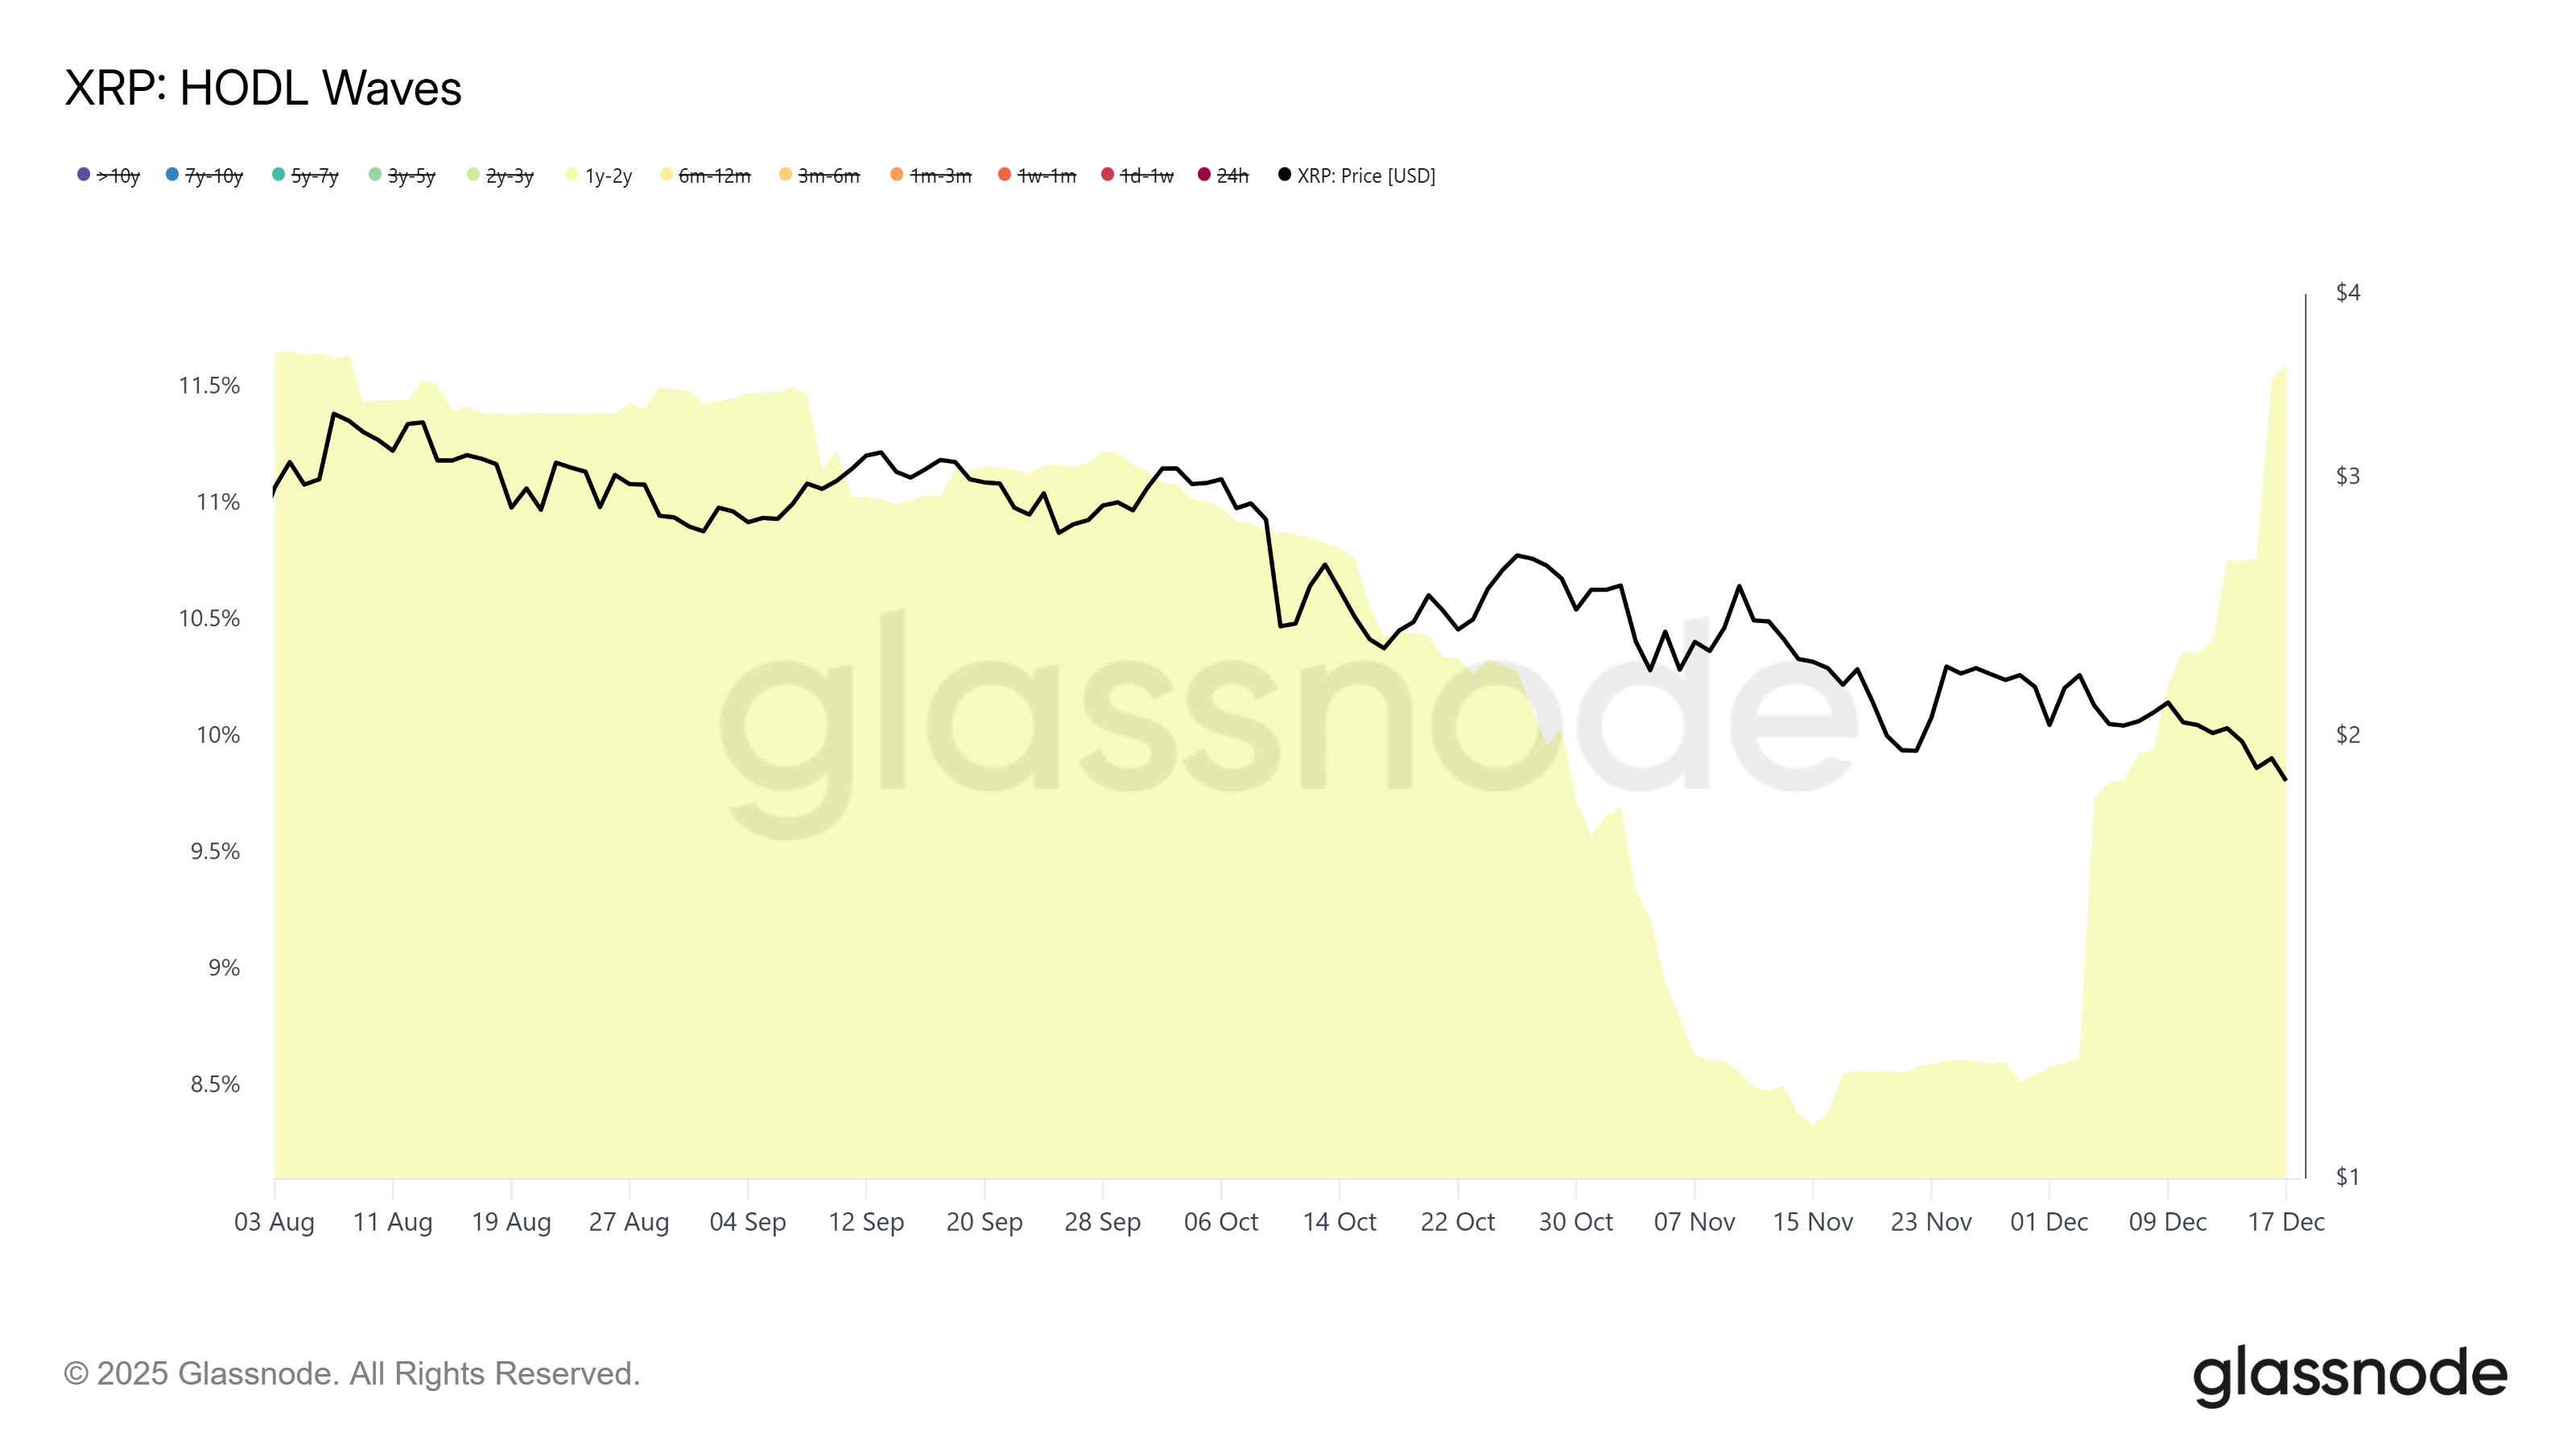
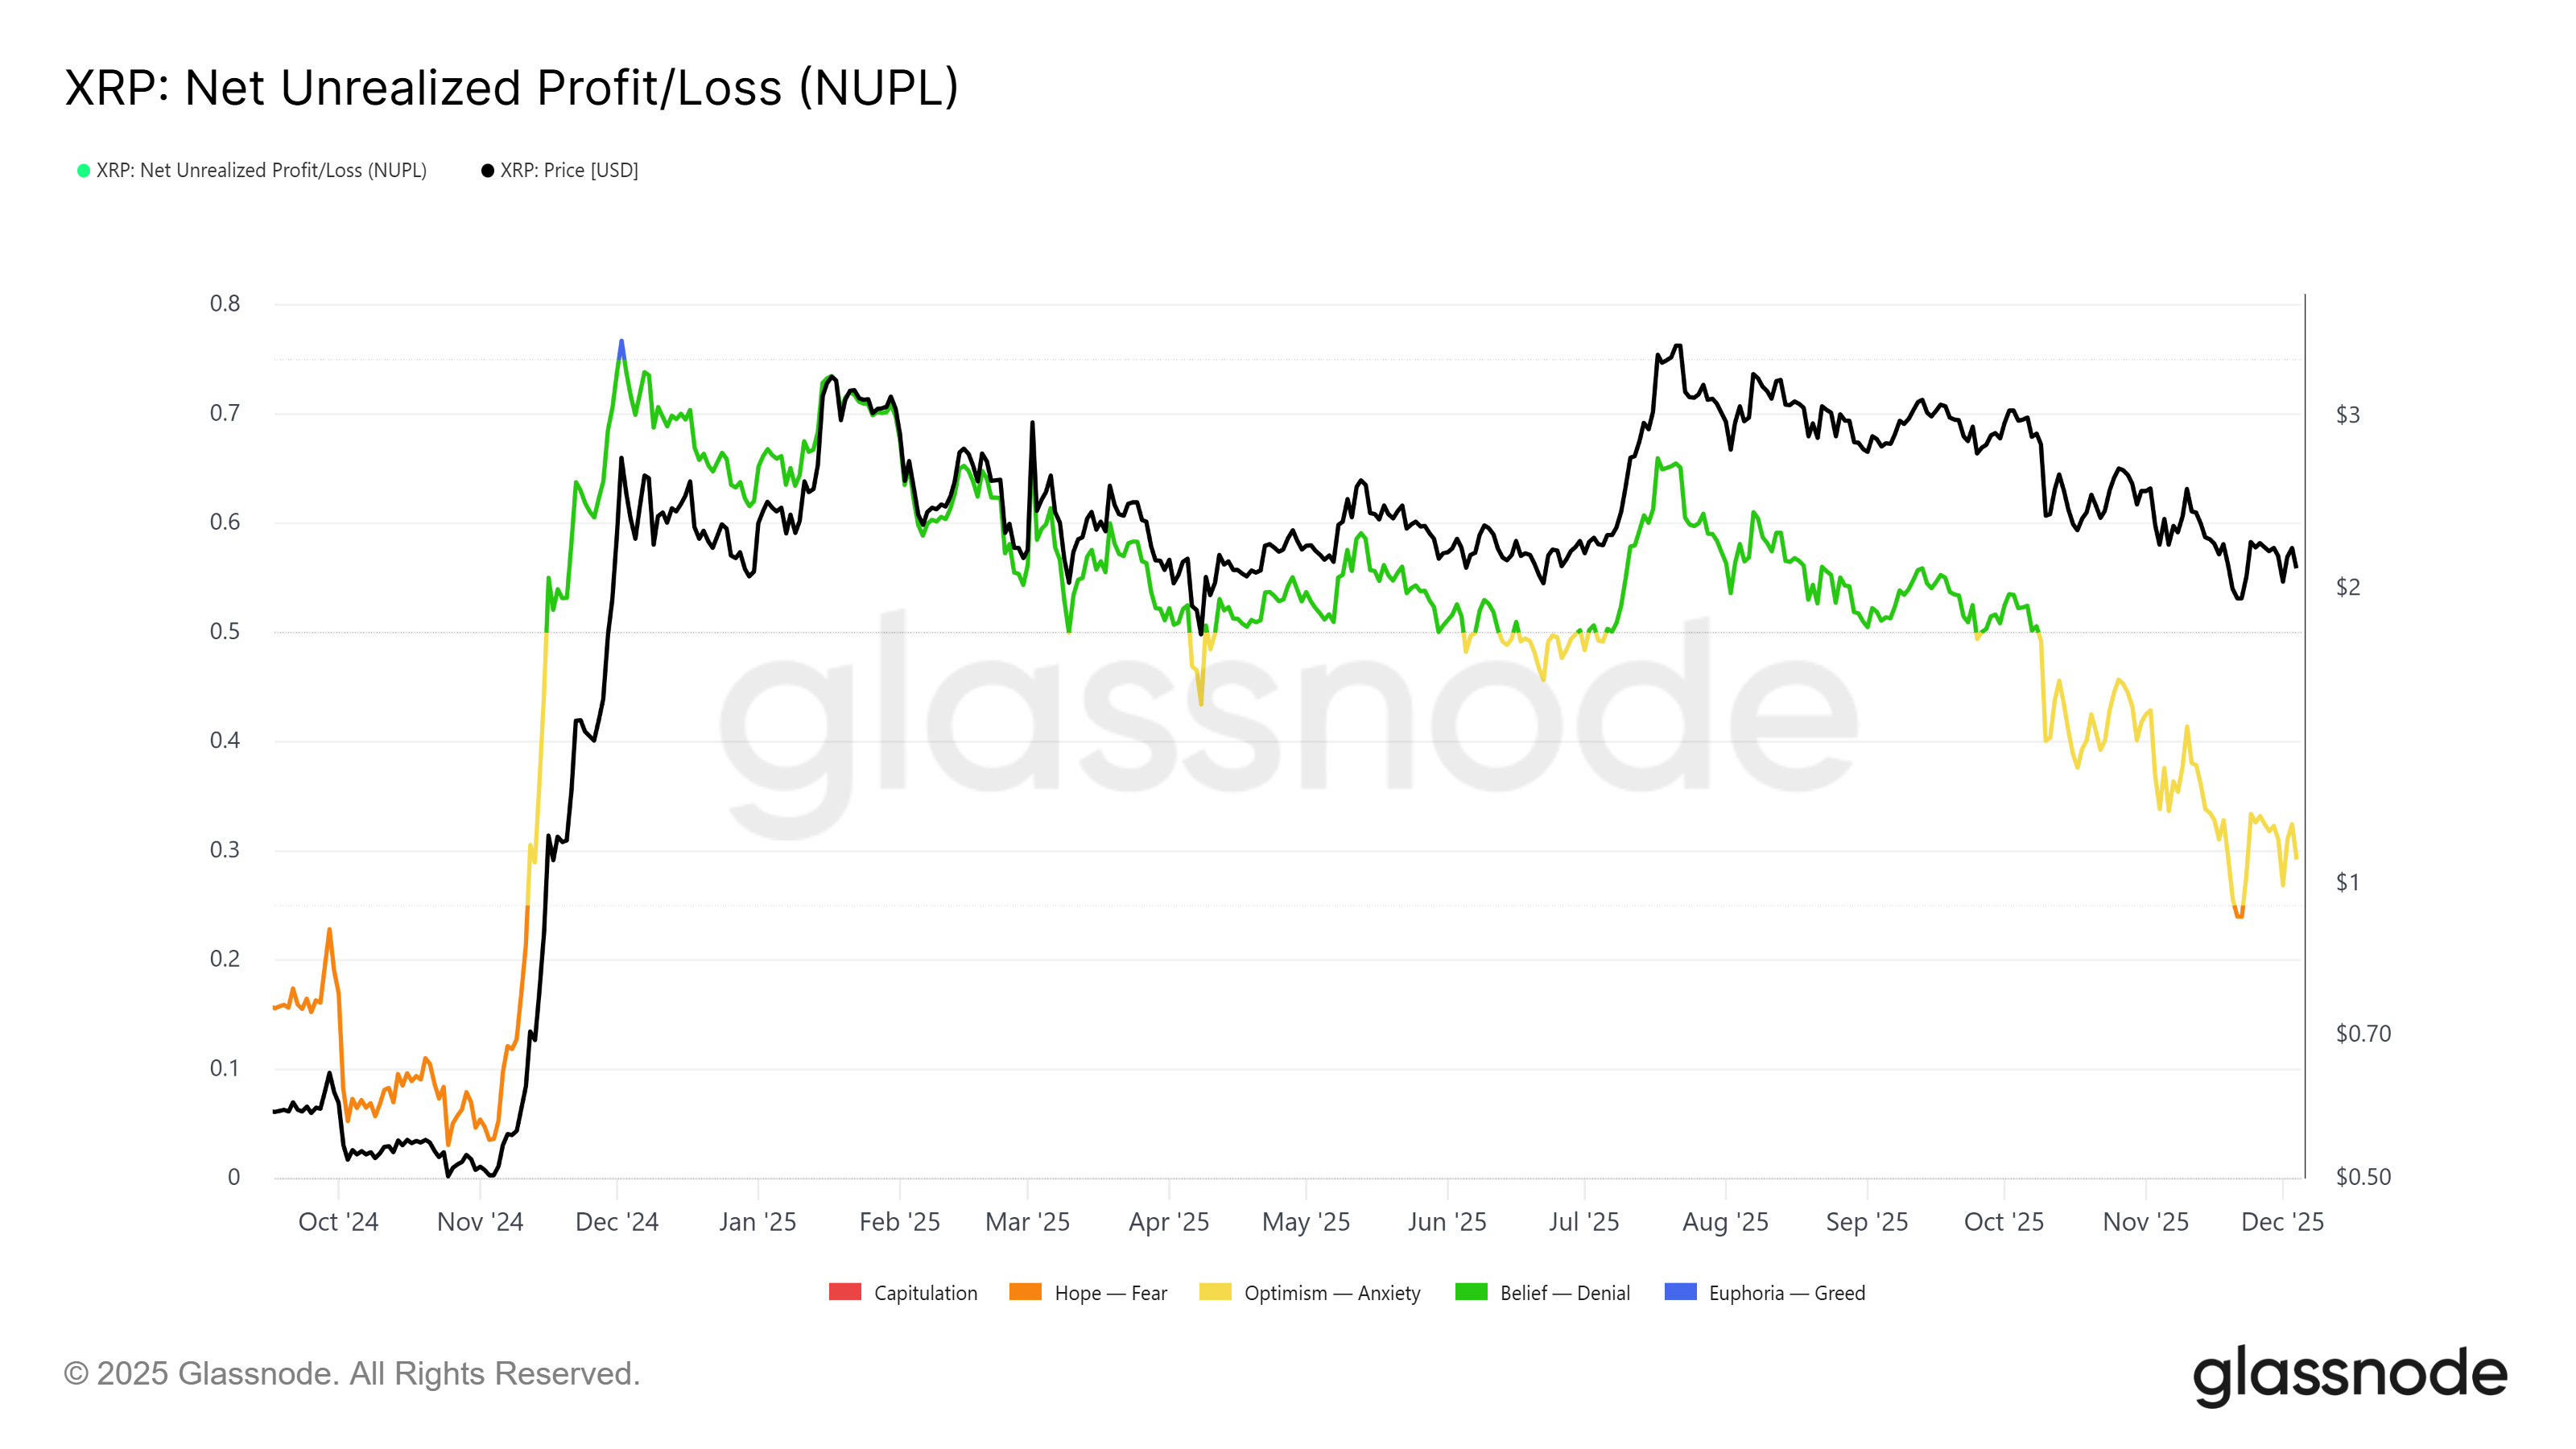
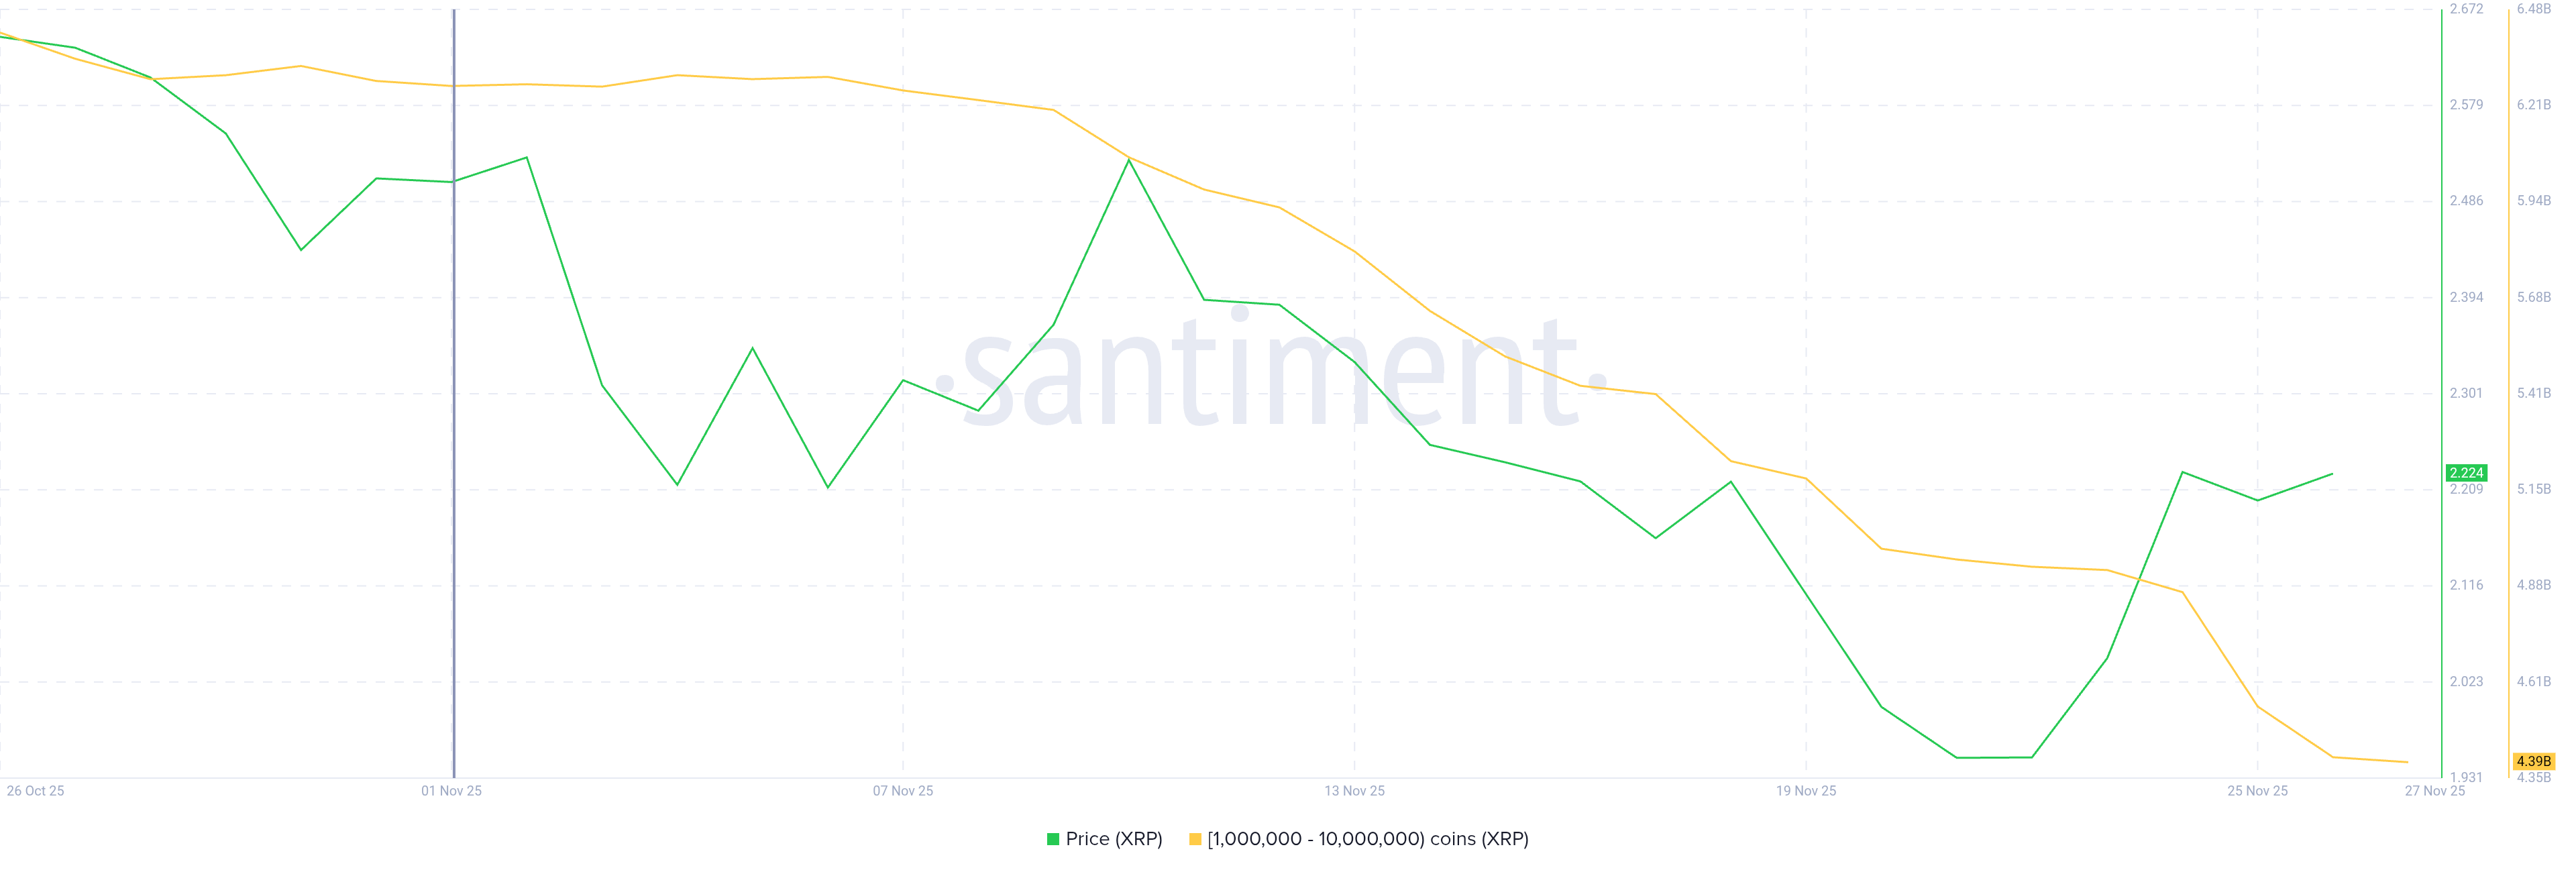
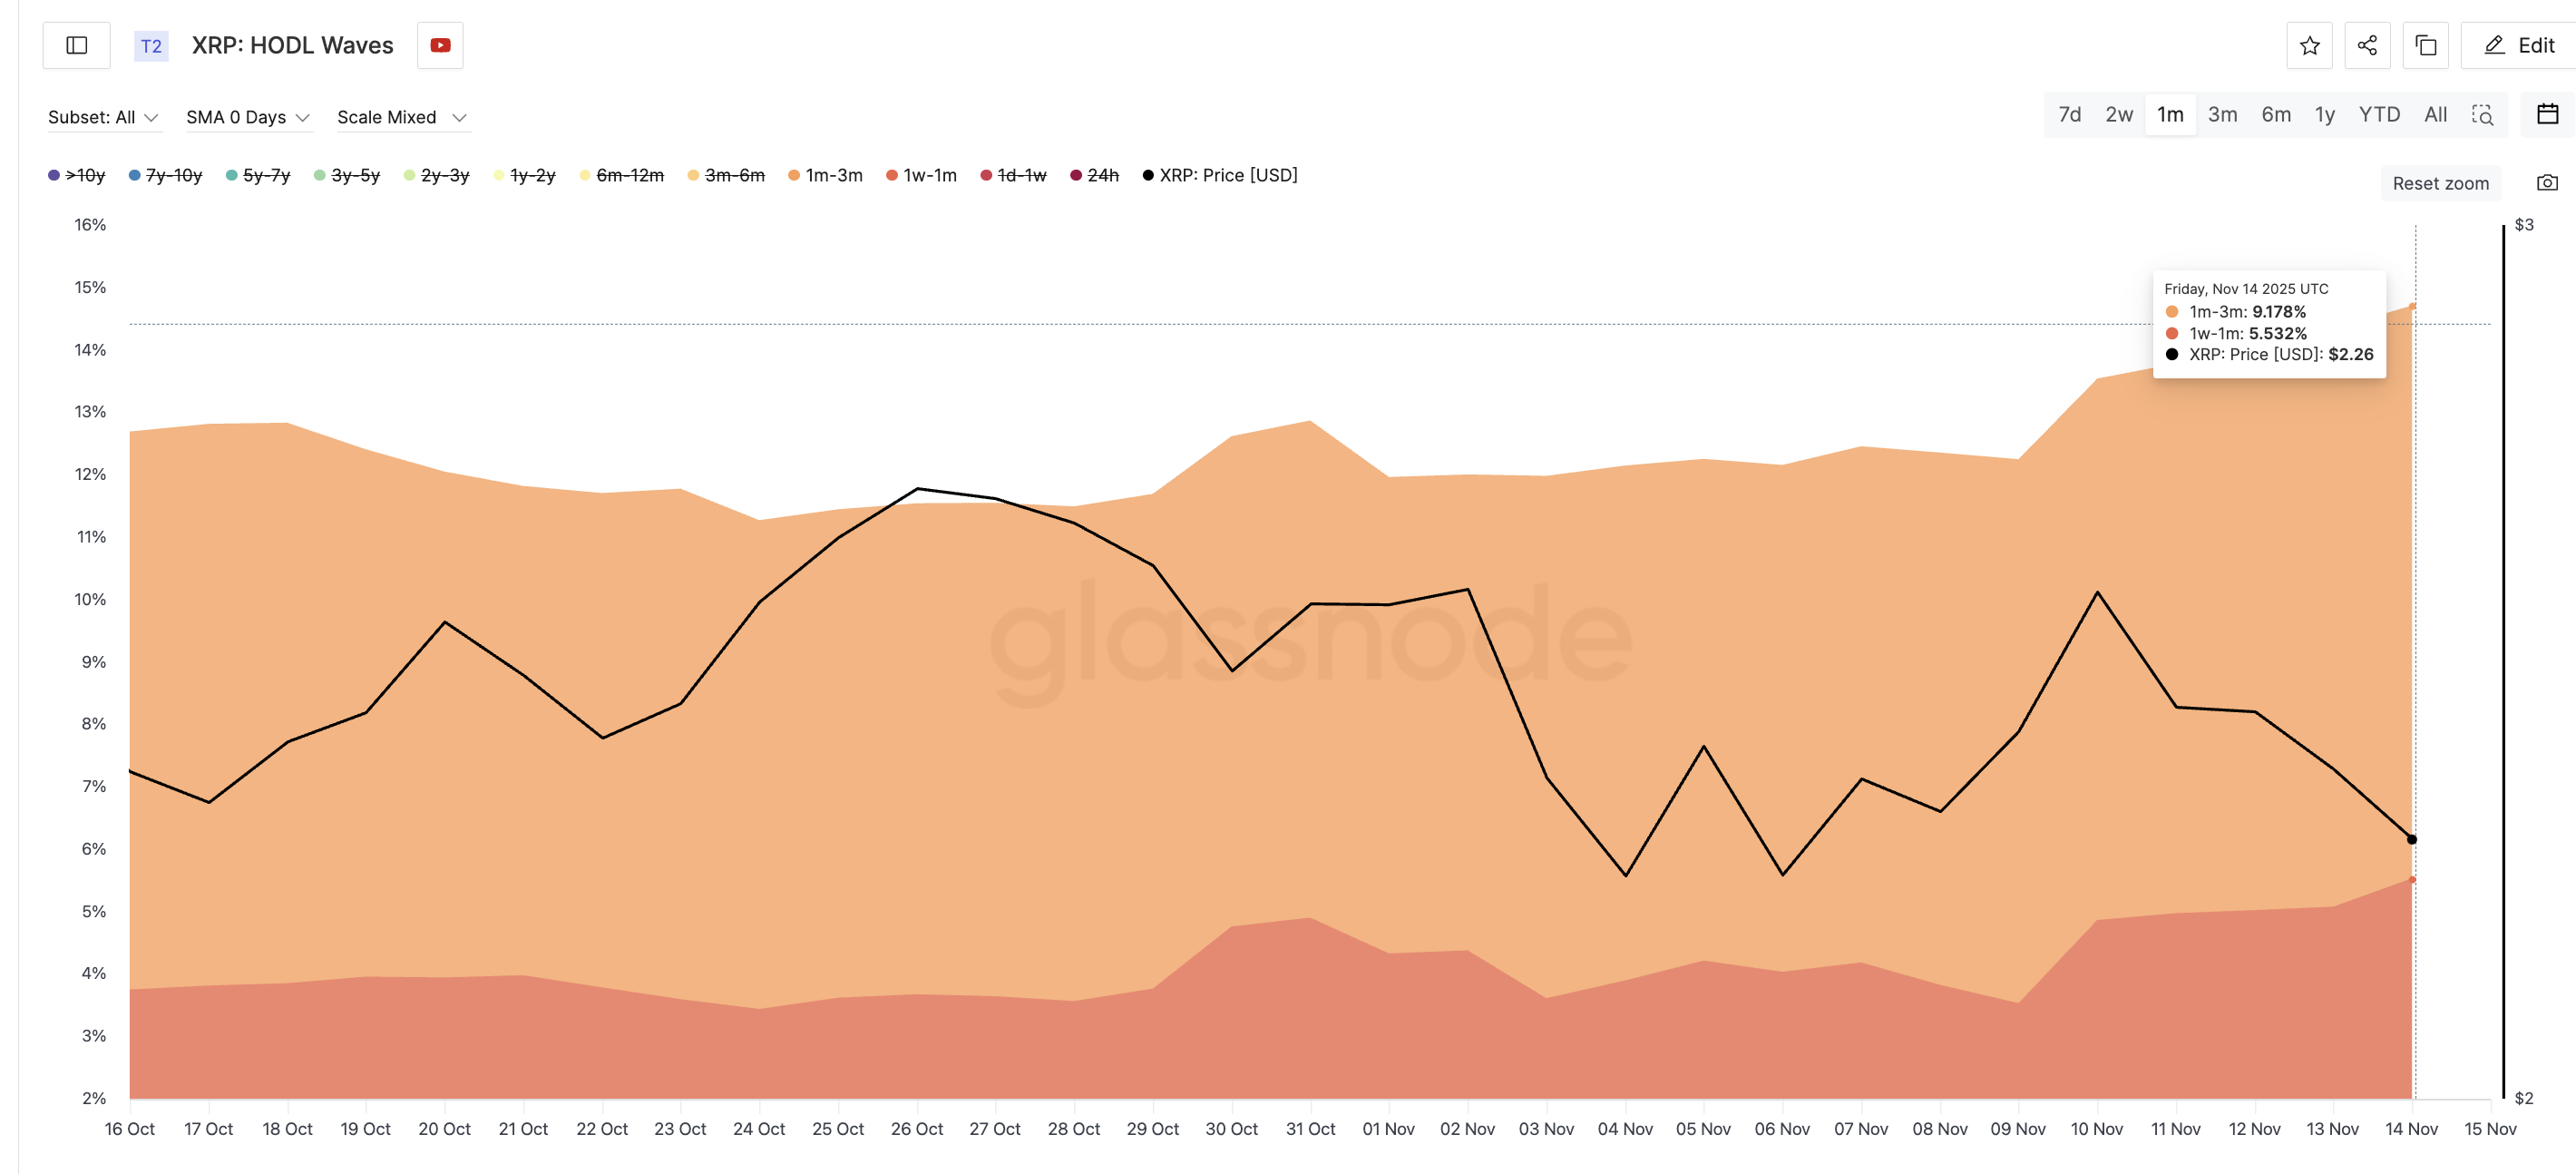
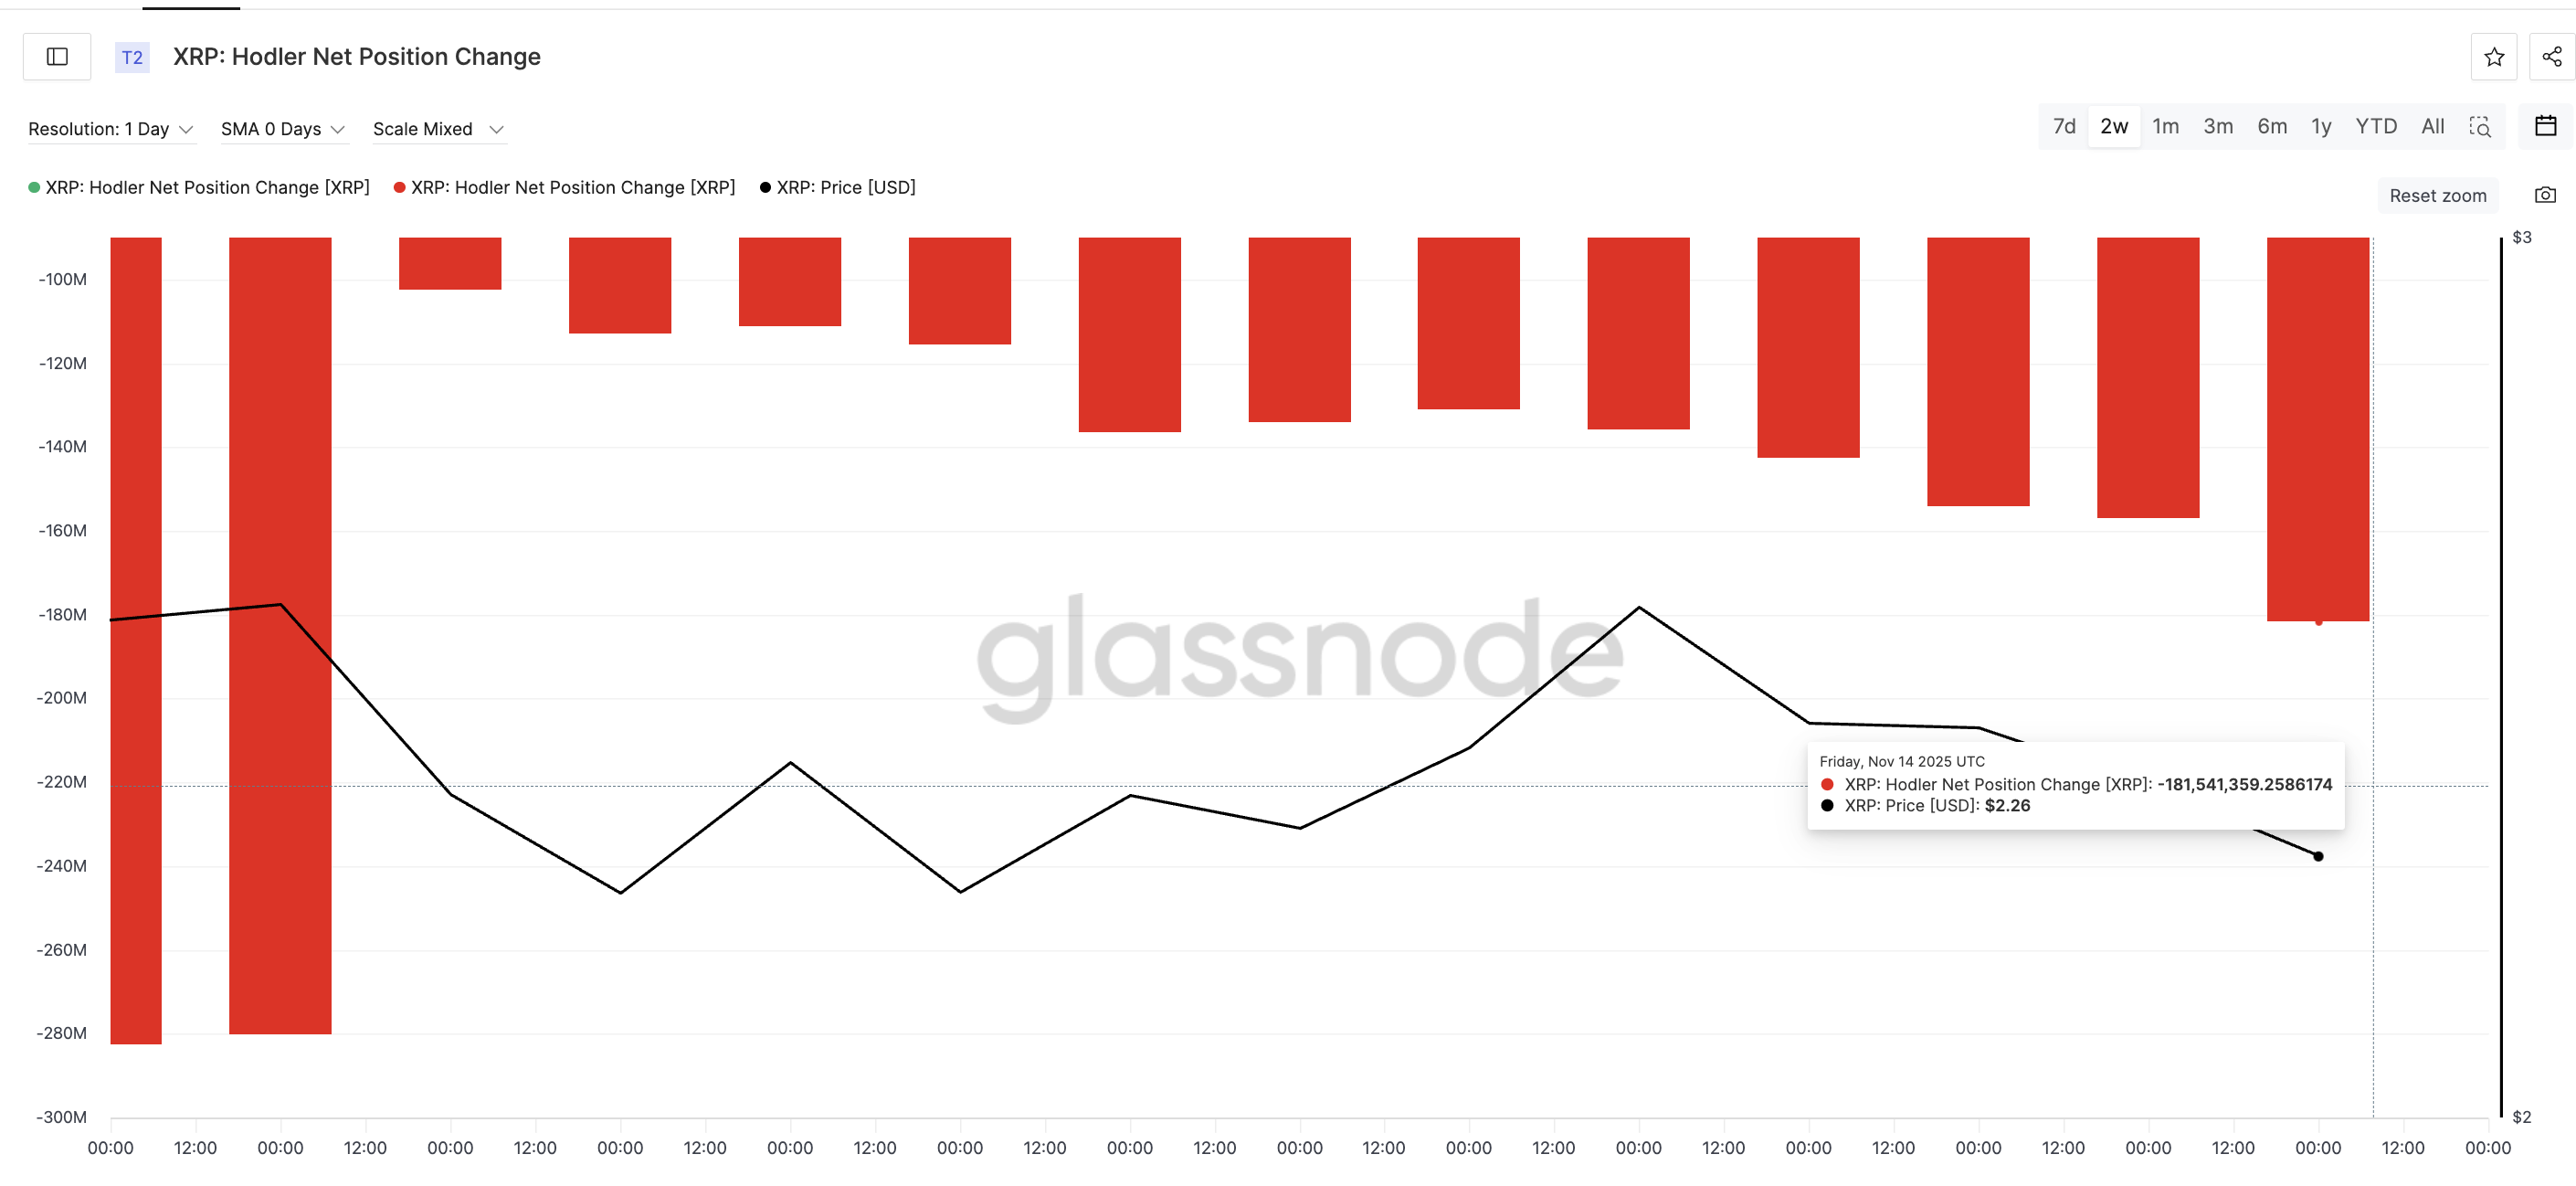
On-chain data supports this shift.

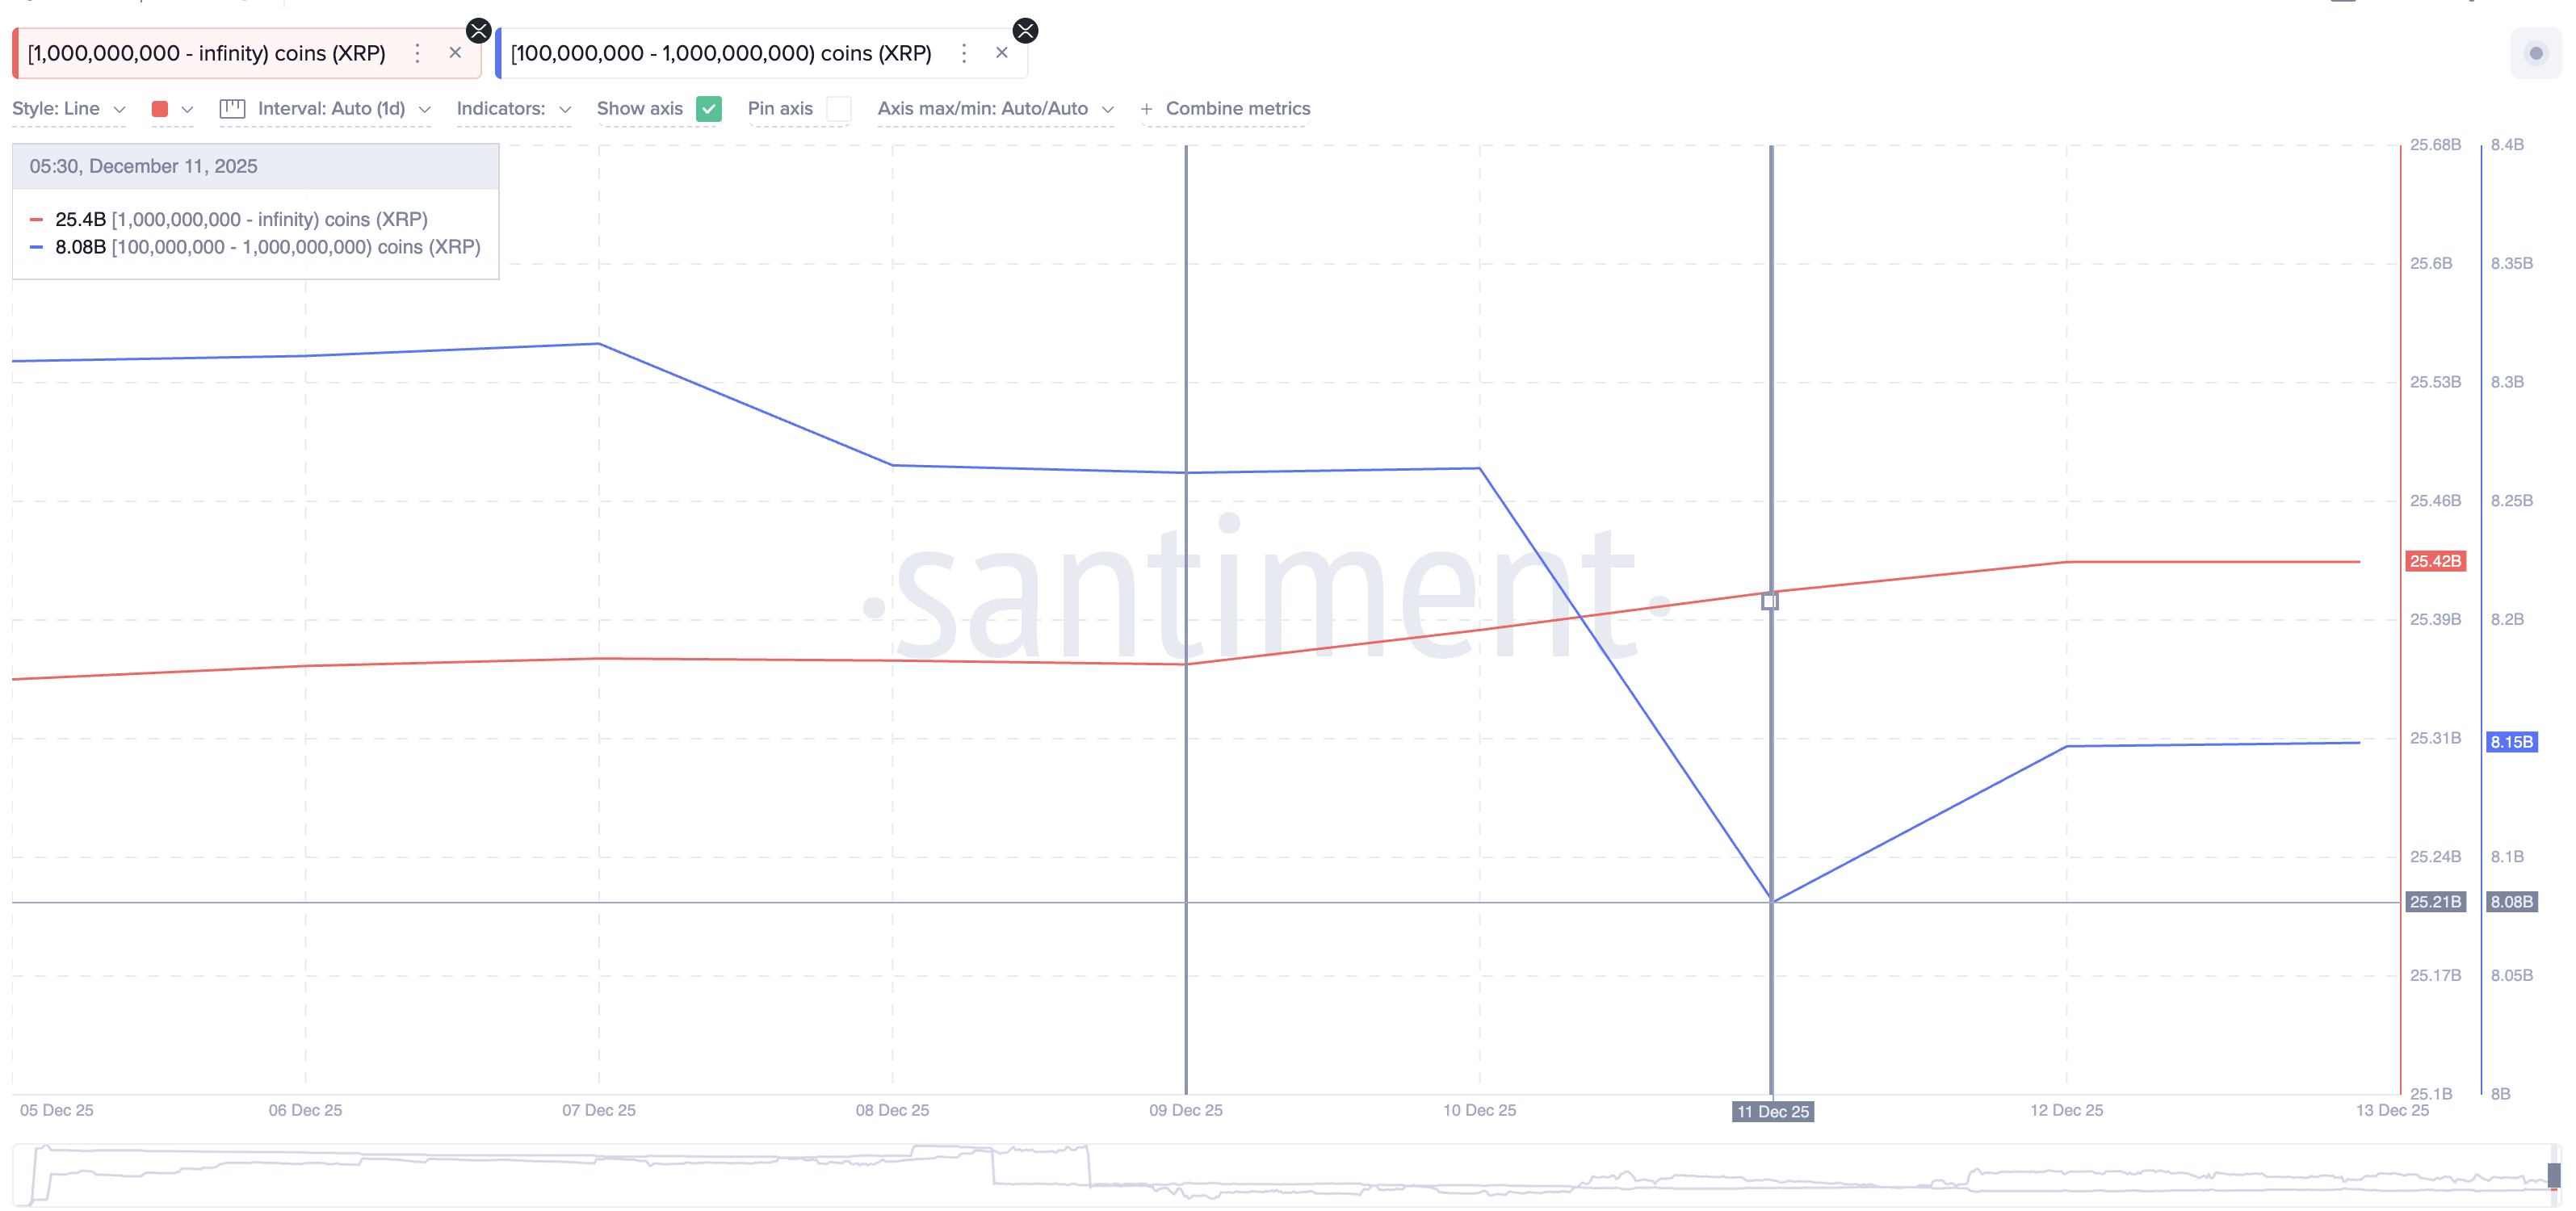
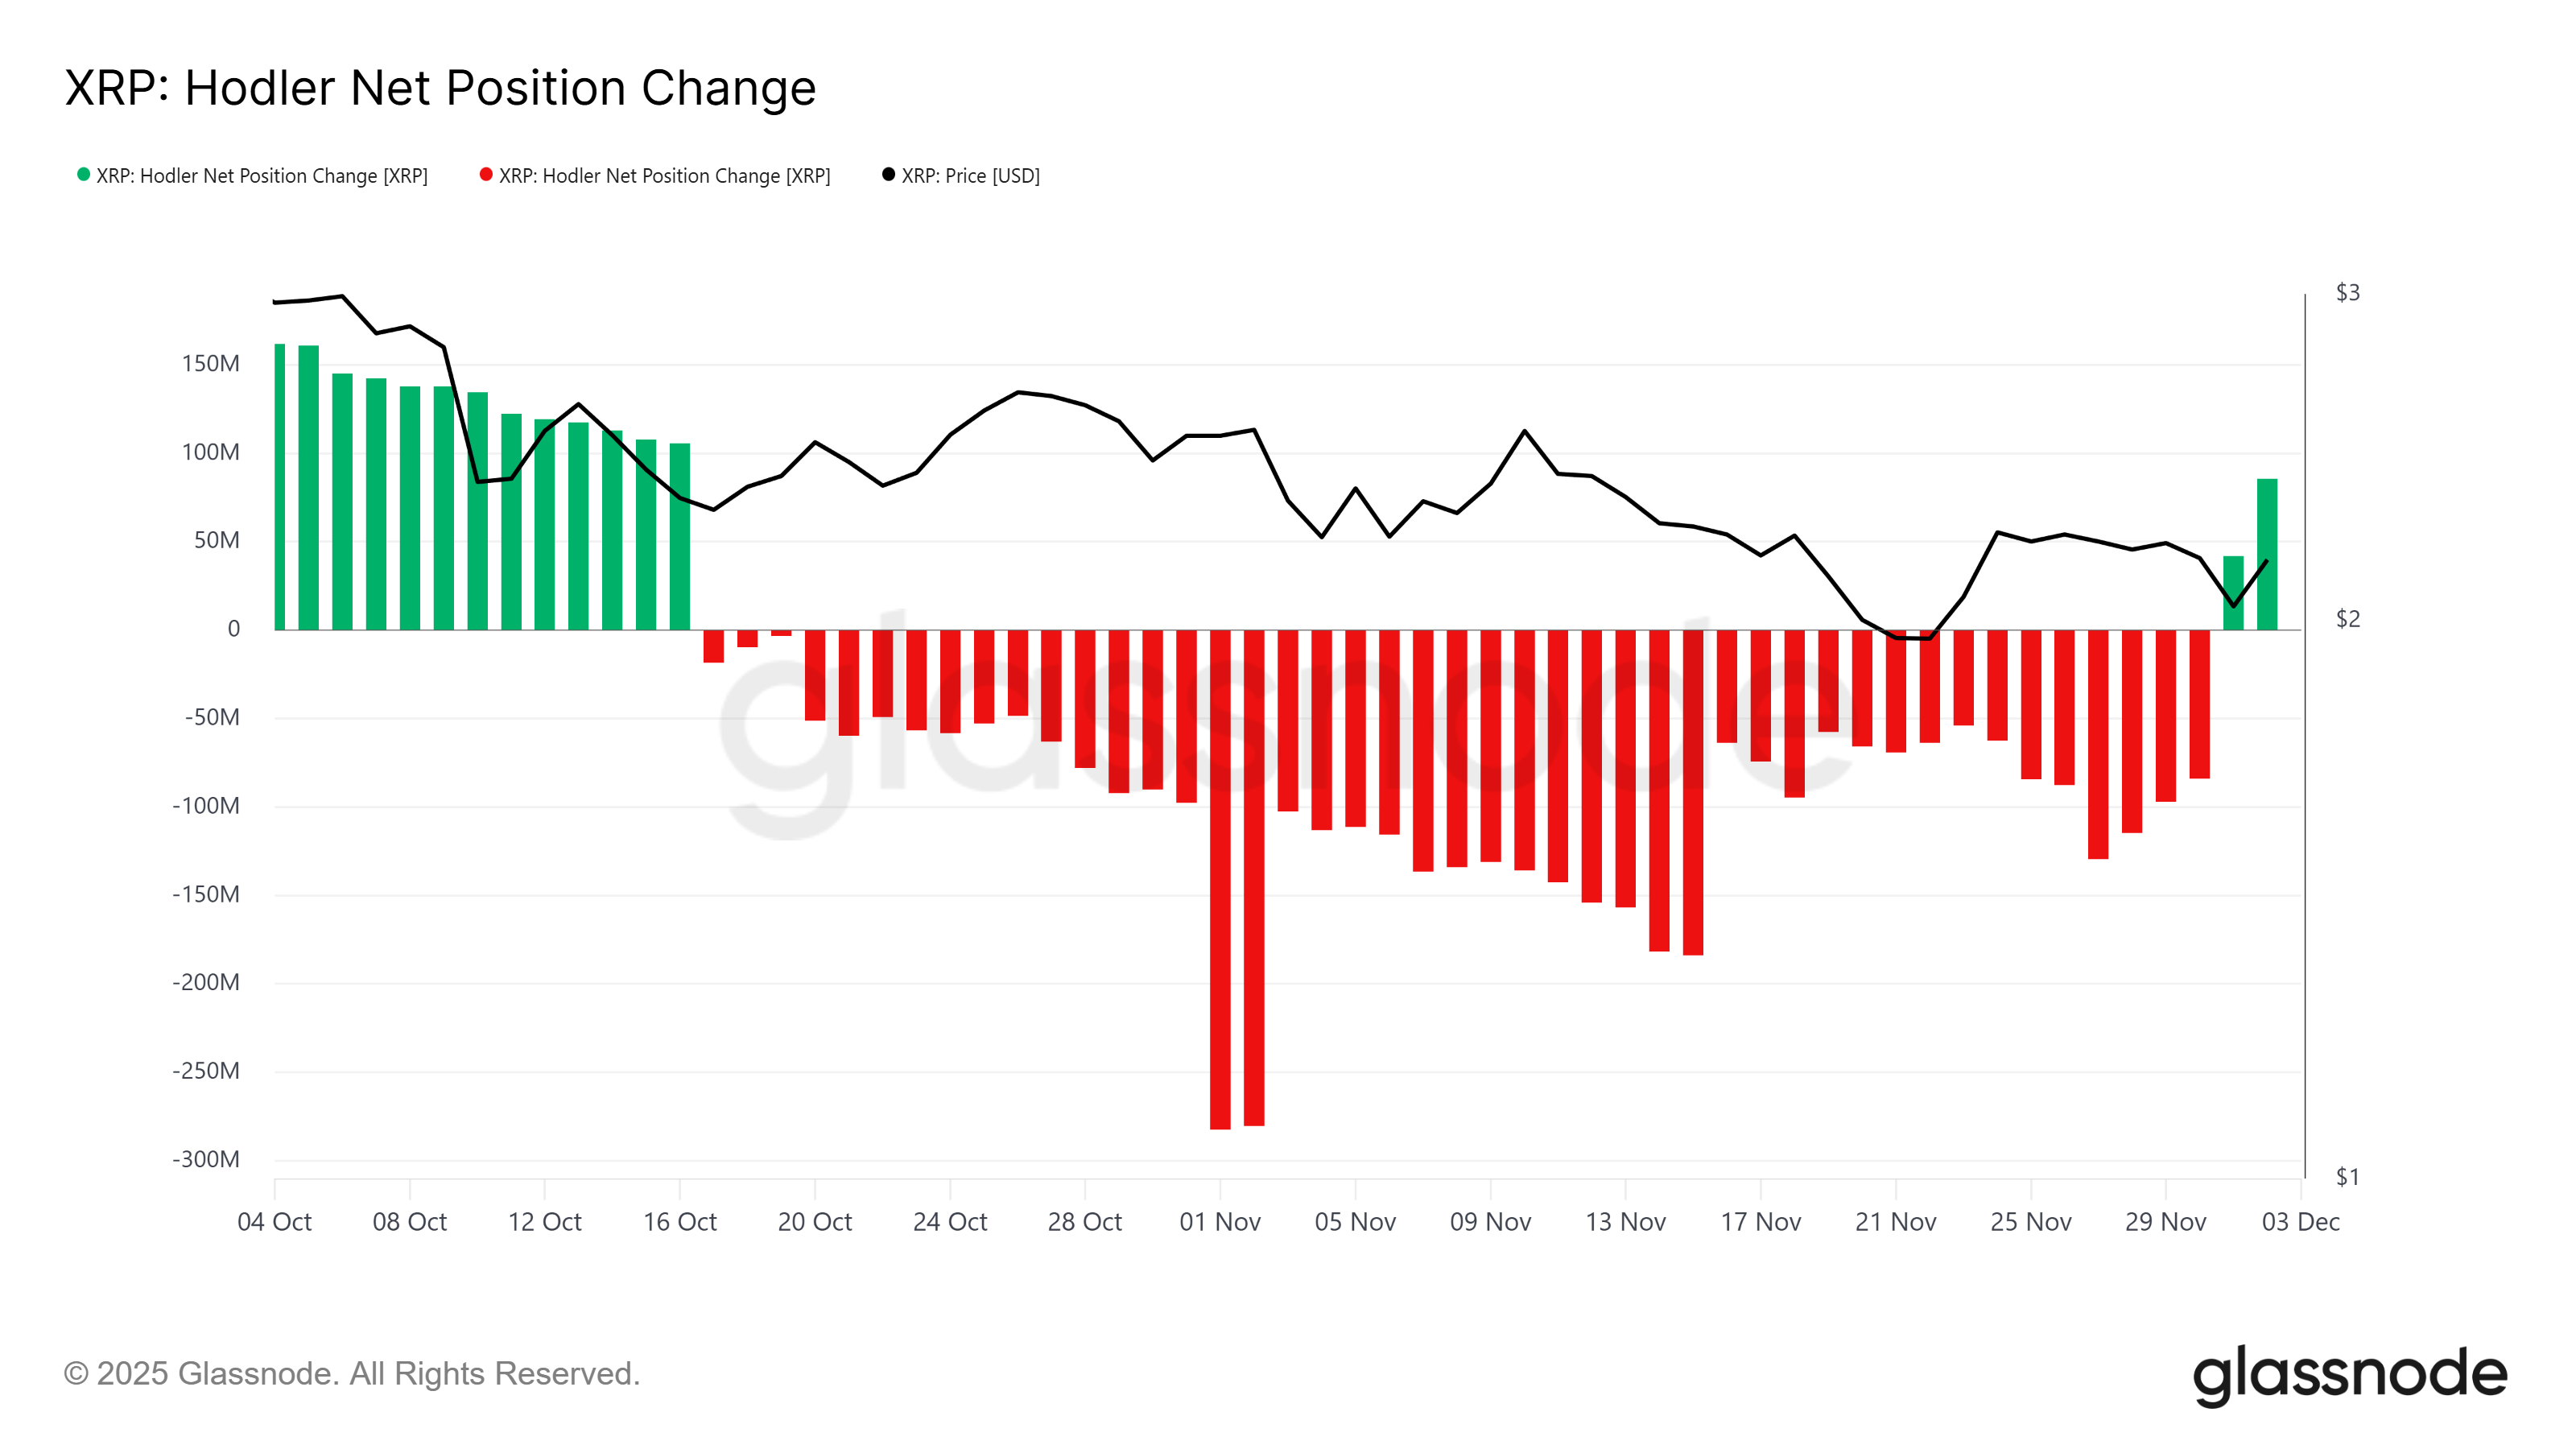
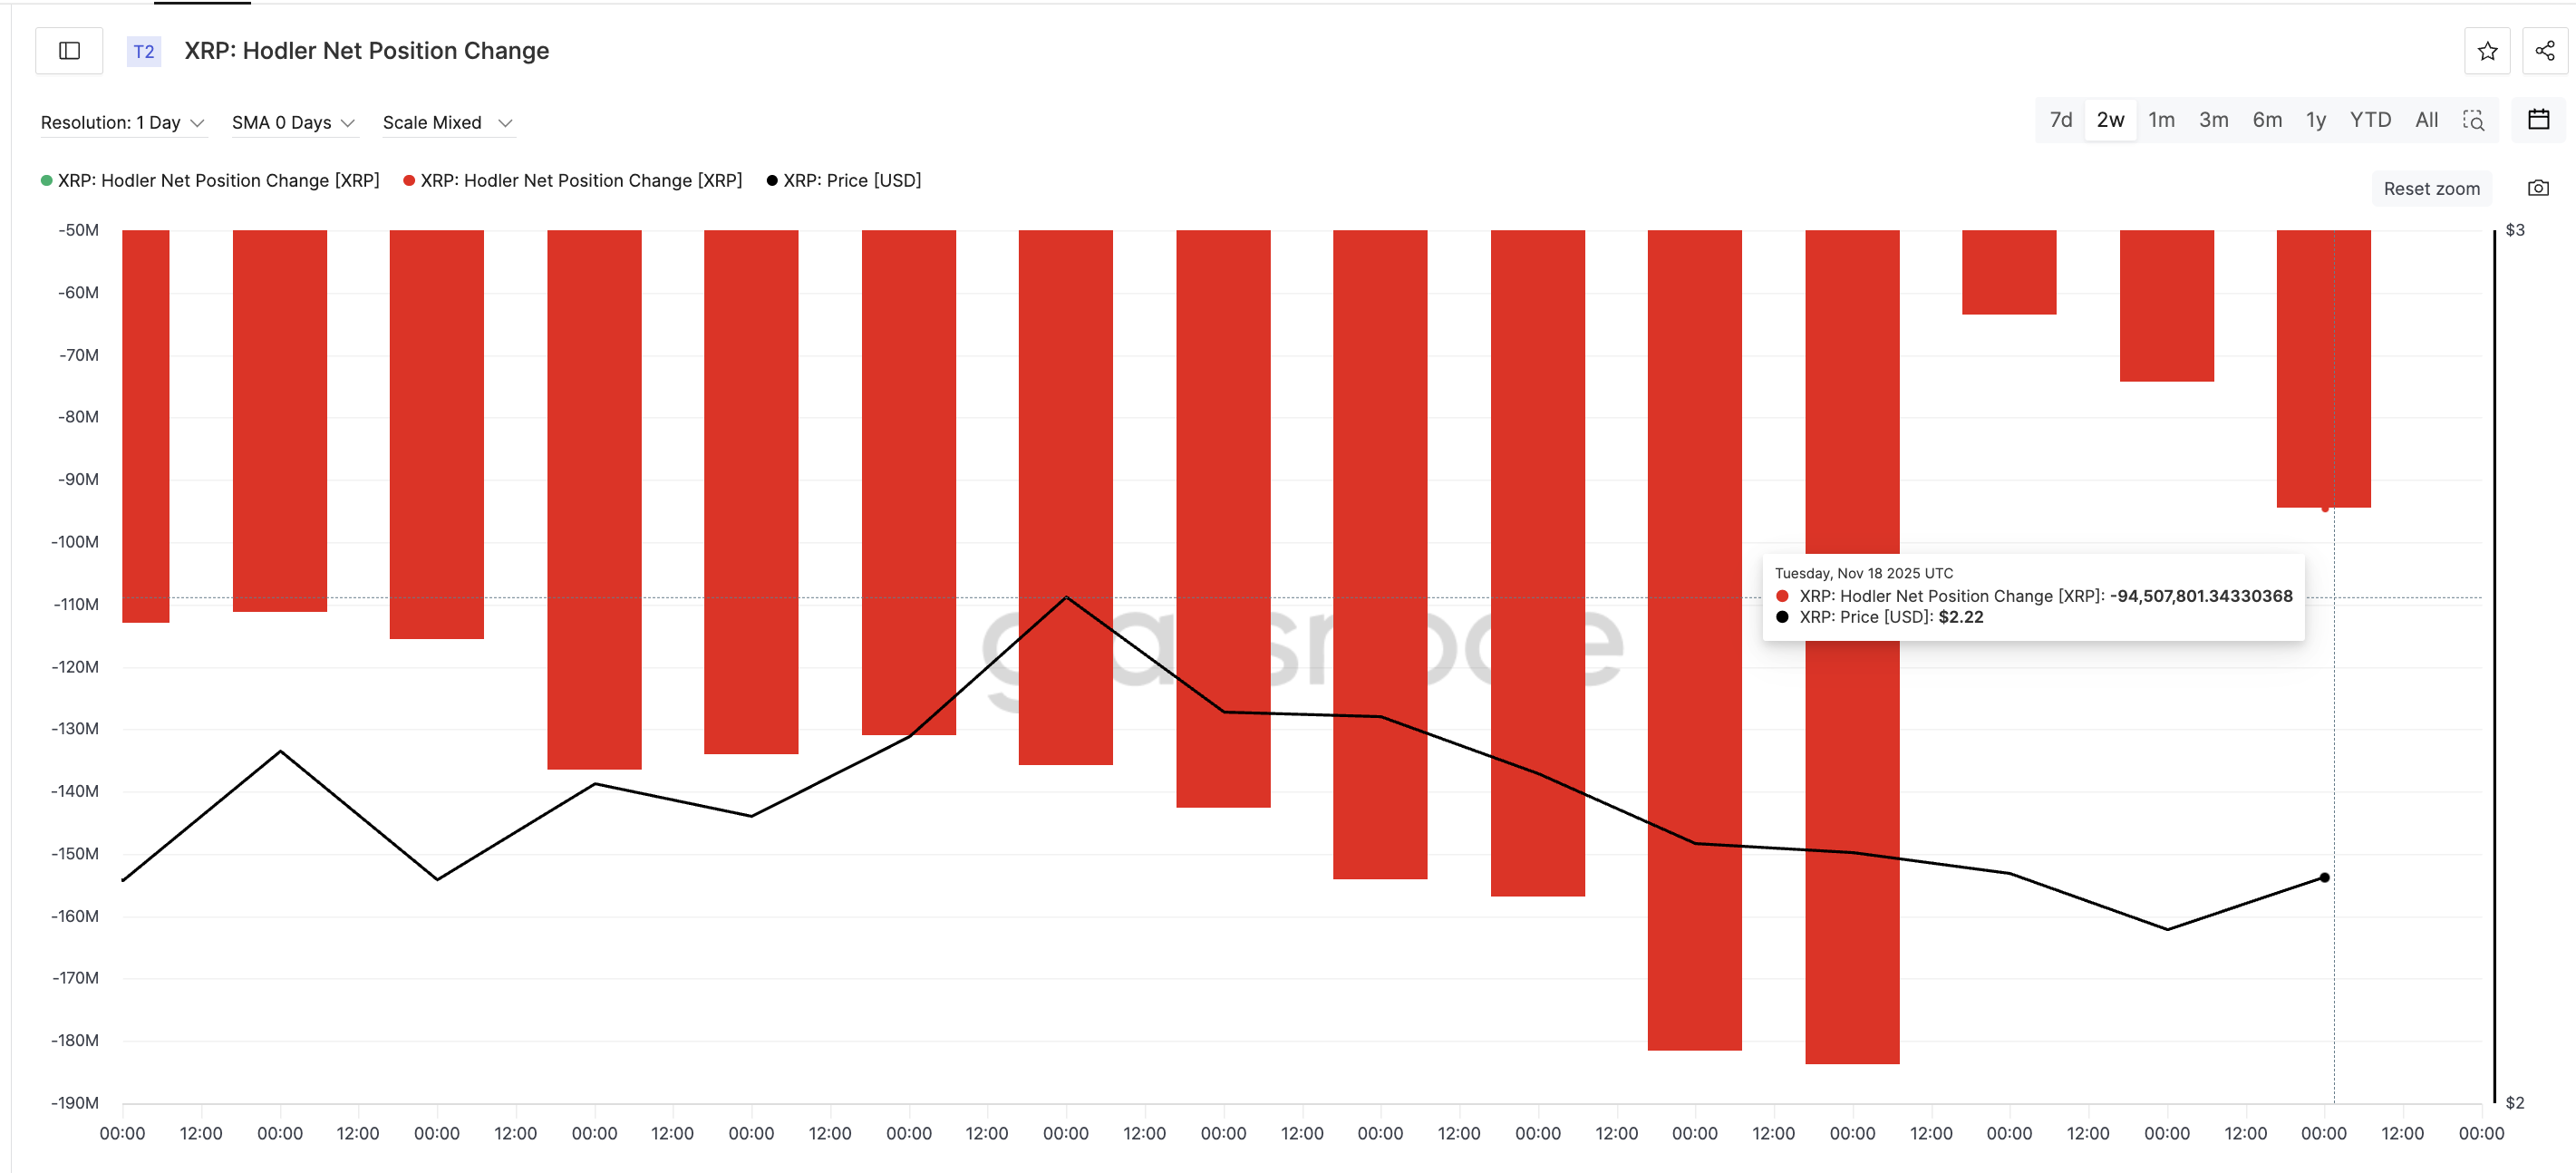
The XRP HODLer Net Position Change tracks whether long-term holders are adding or selling coins. On December 11, net selling peaked at roughly 216.9 million XRP. By December 18, that figure dropped to about 132.2 million XRP.

That is a decline of roughly 39% in daily selling pressure.

XRP Holders Sell Fewer Coins
XRP Holders Sell Fewer Coins: Glassnode

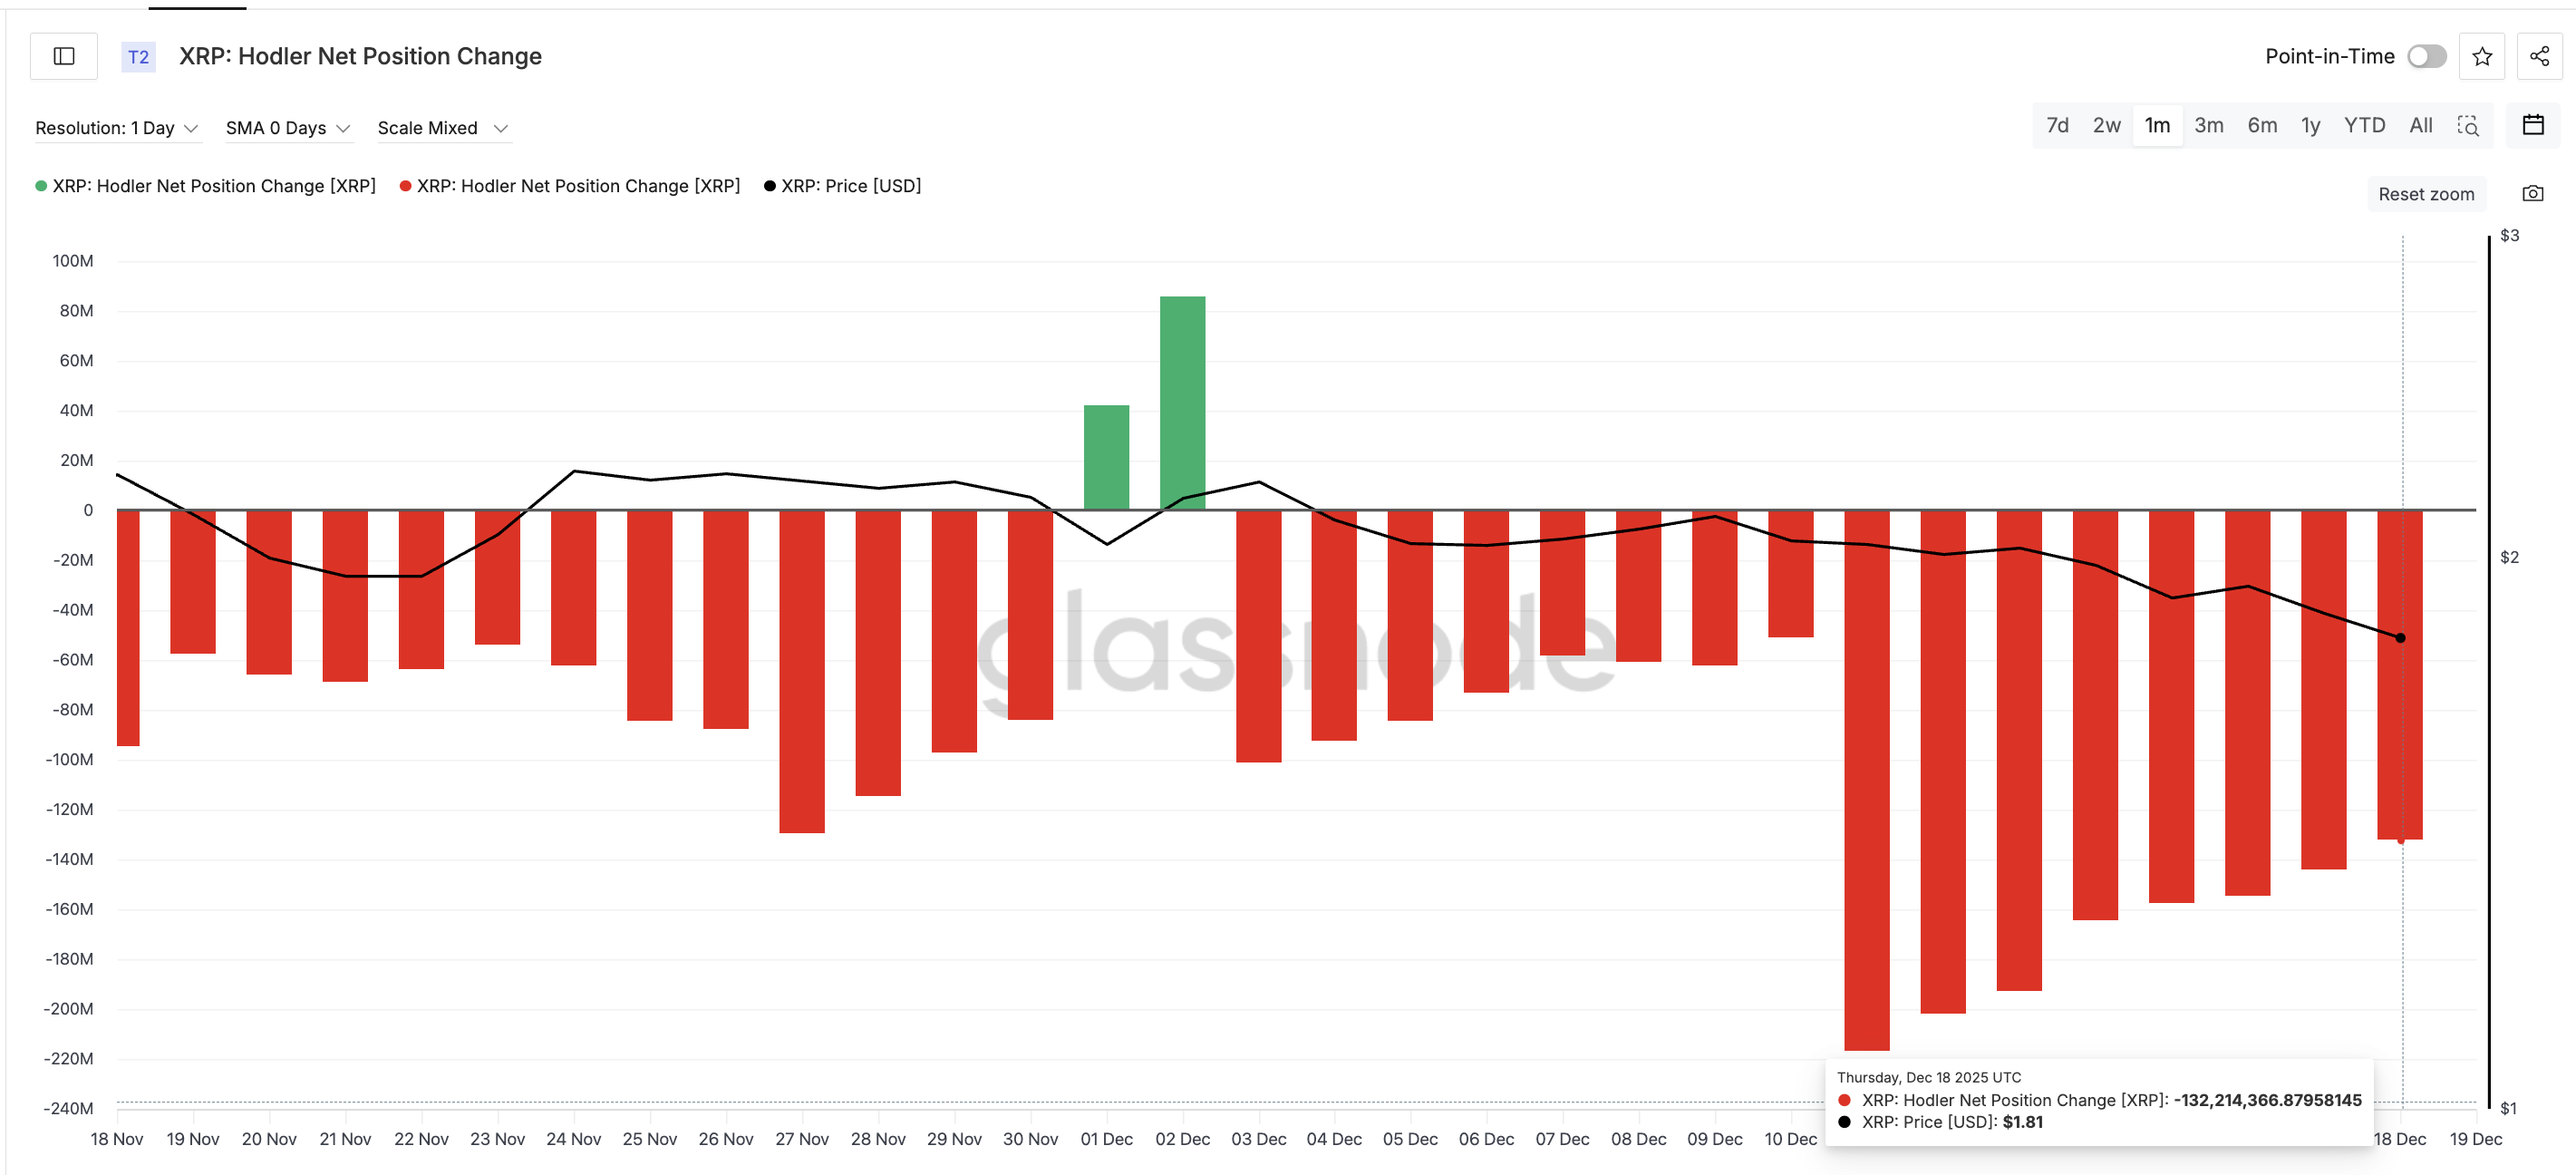
In simple terms, sellers are still present, but far fewer coins are being pushed onto the market. This aligns with the RSI divergence and strengthens the case that downside pressure is fading.

This does not guarantee a rally. But it does mean the market is no longer in full control of sellers.

Why One XRP Price Level Still Decides the Outcome

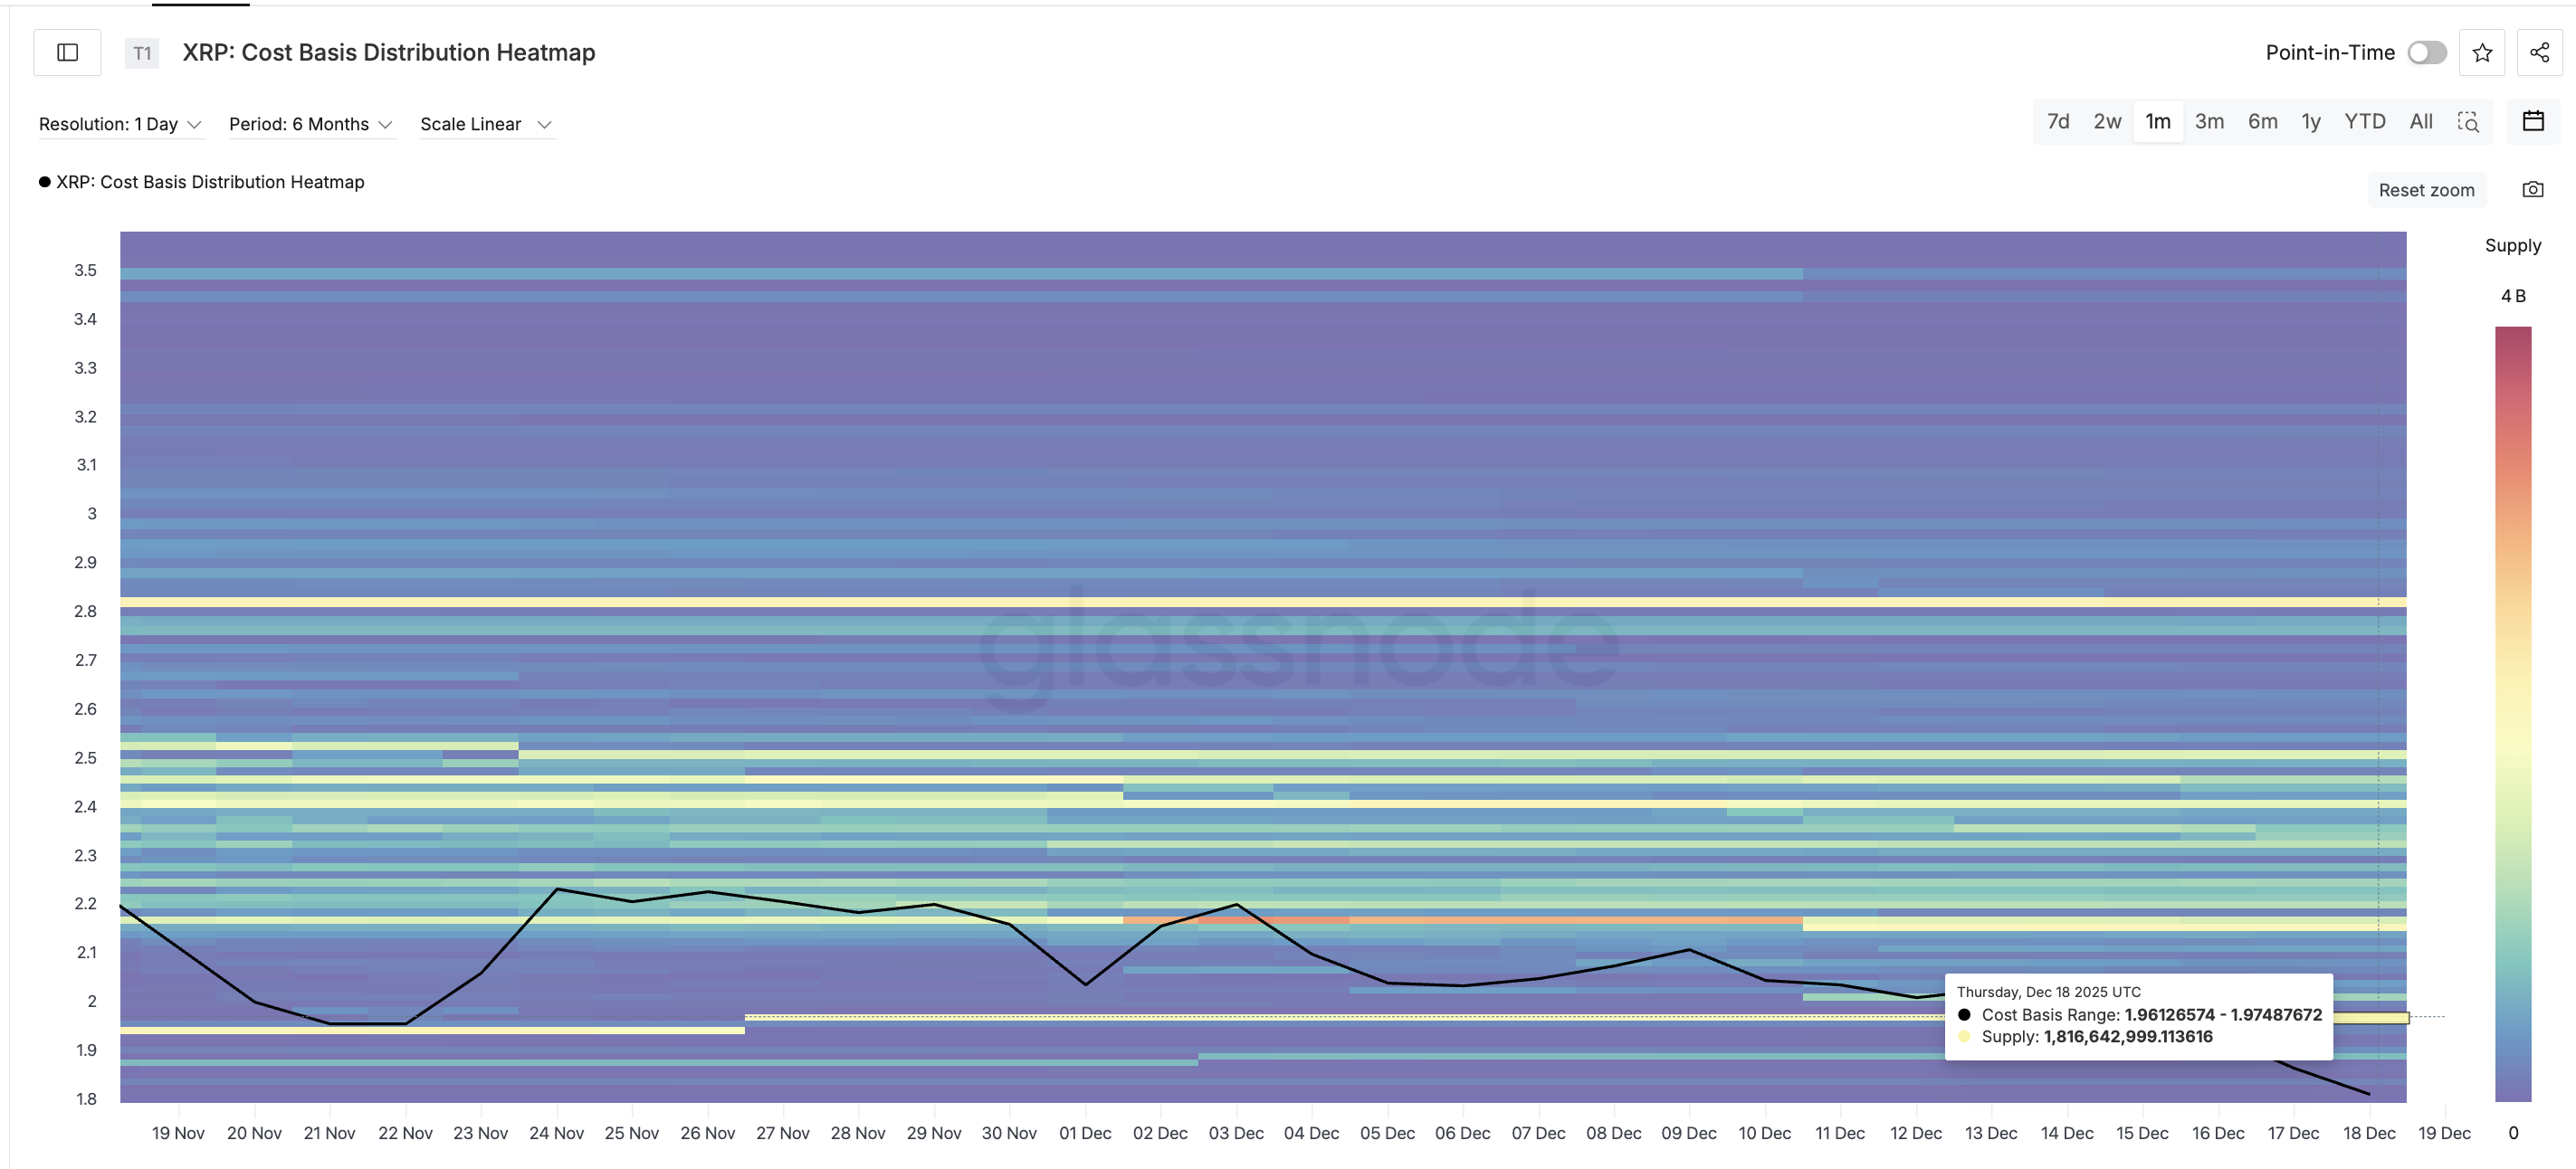
Even if selling pressure continues to ease, XRP still faces a major structural test overhead.

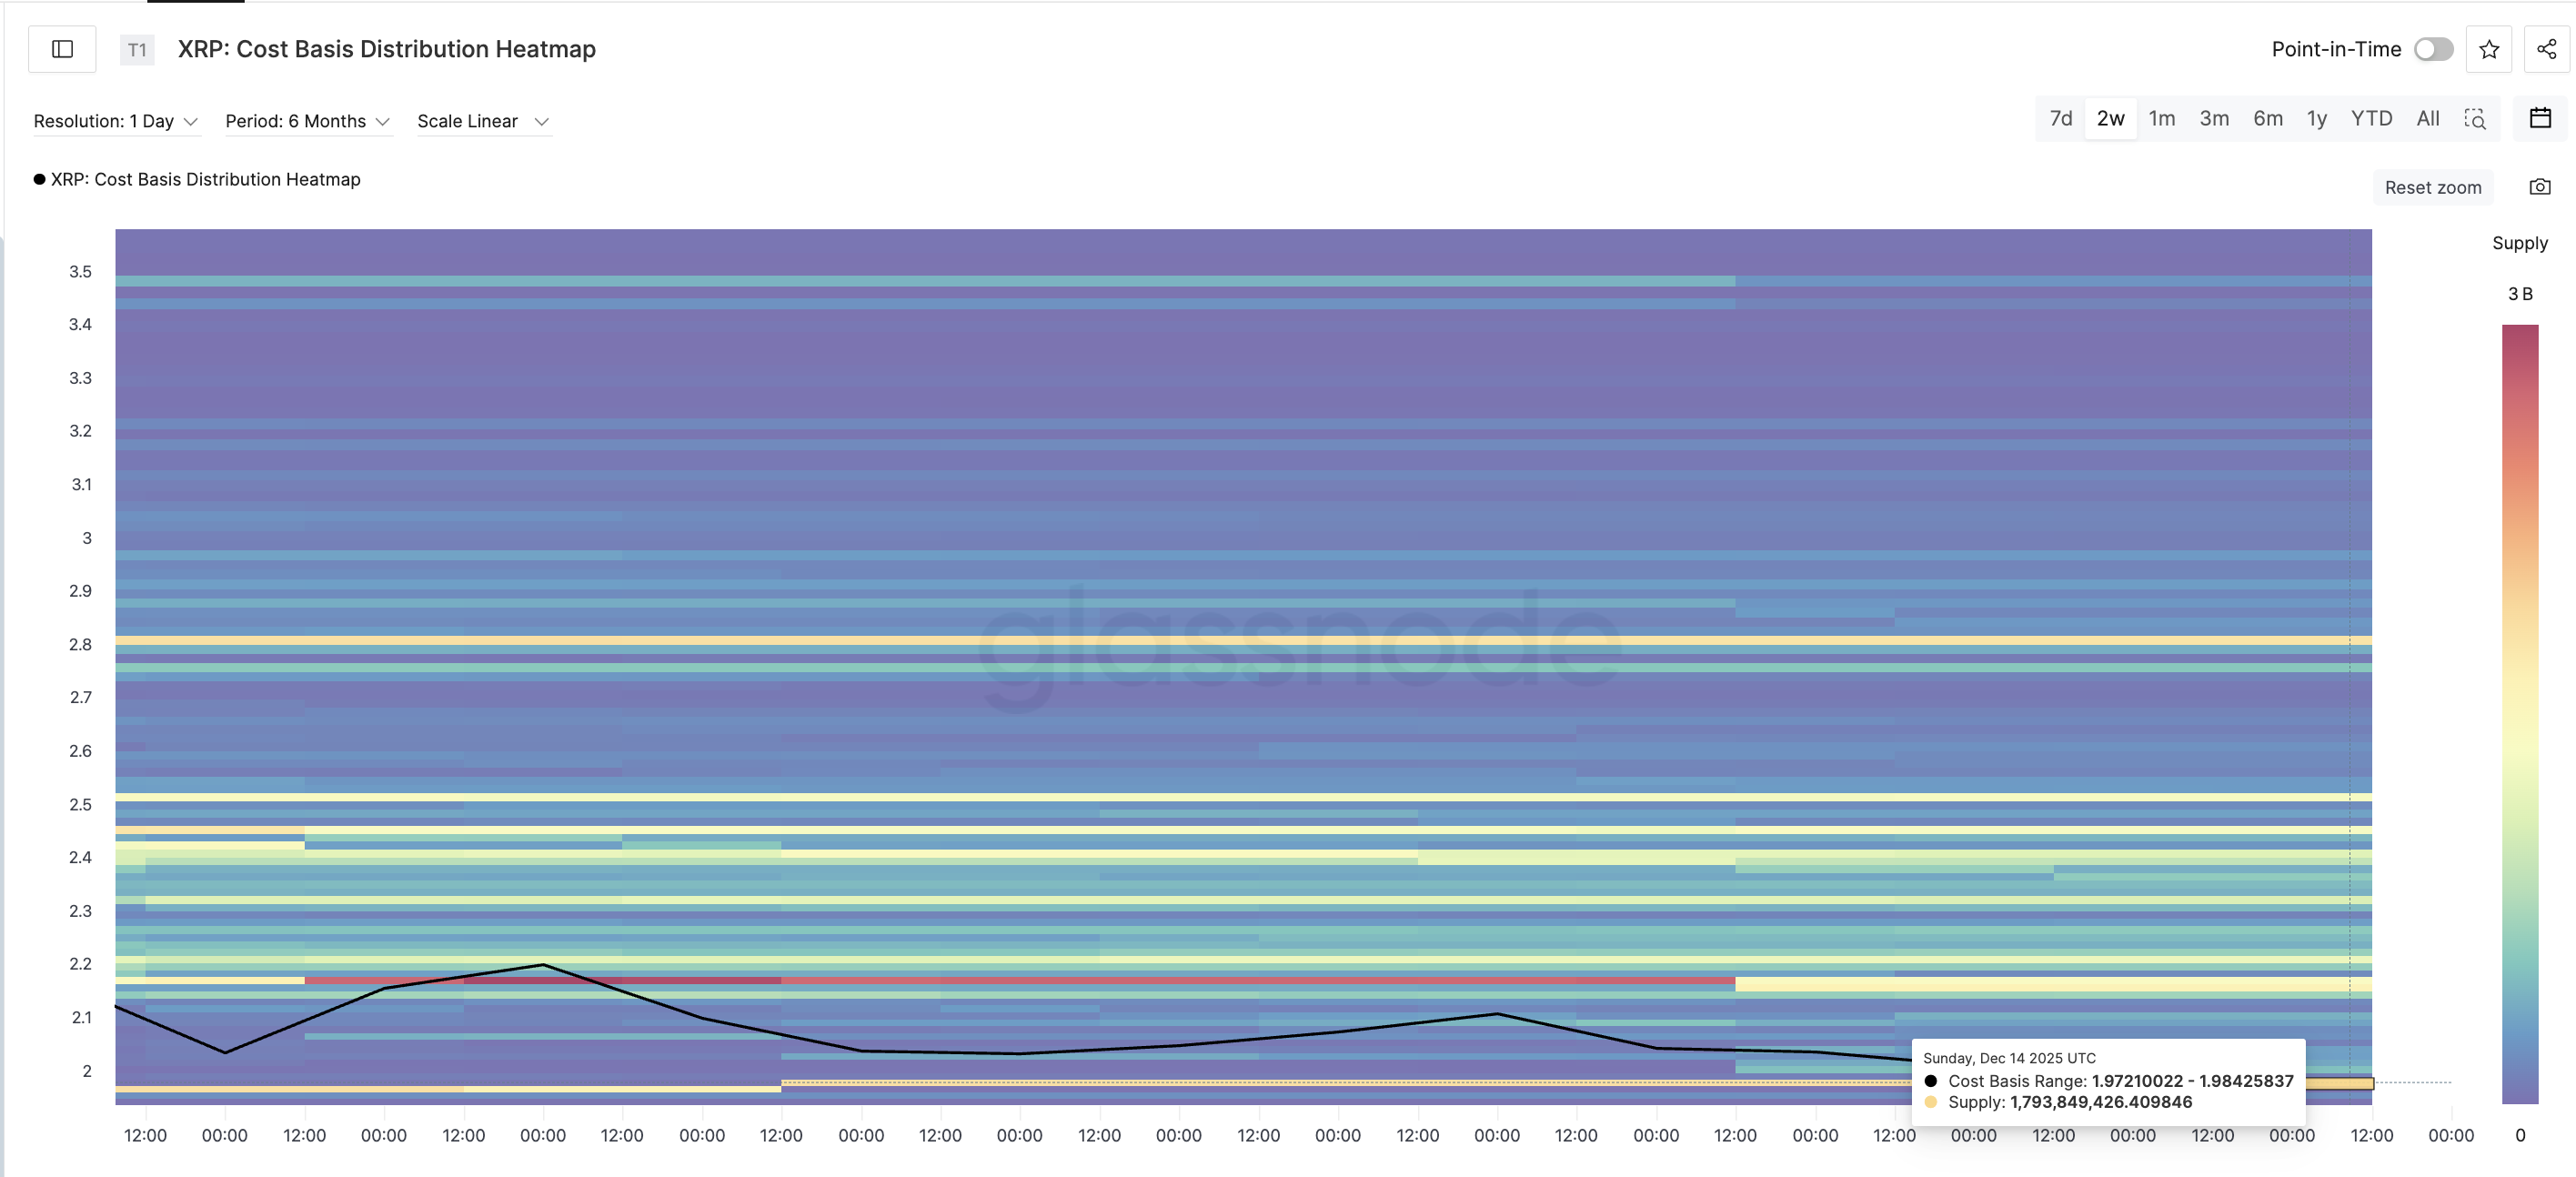
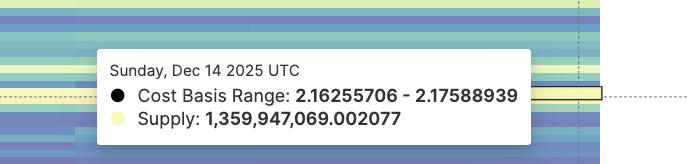
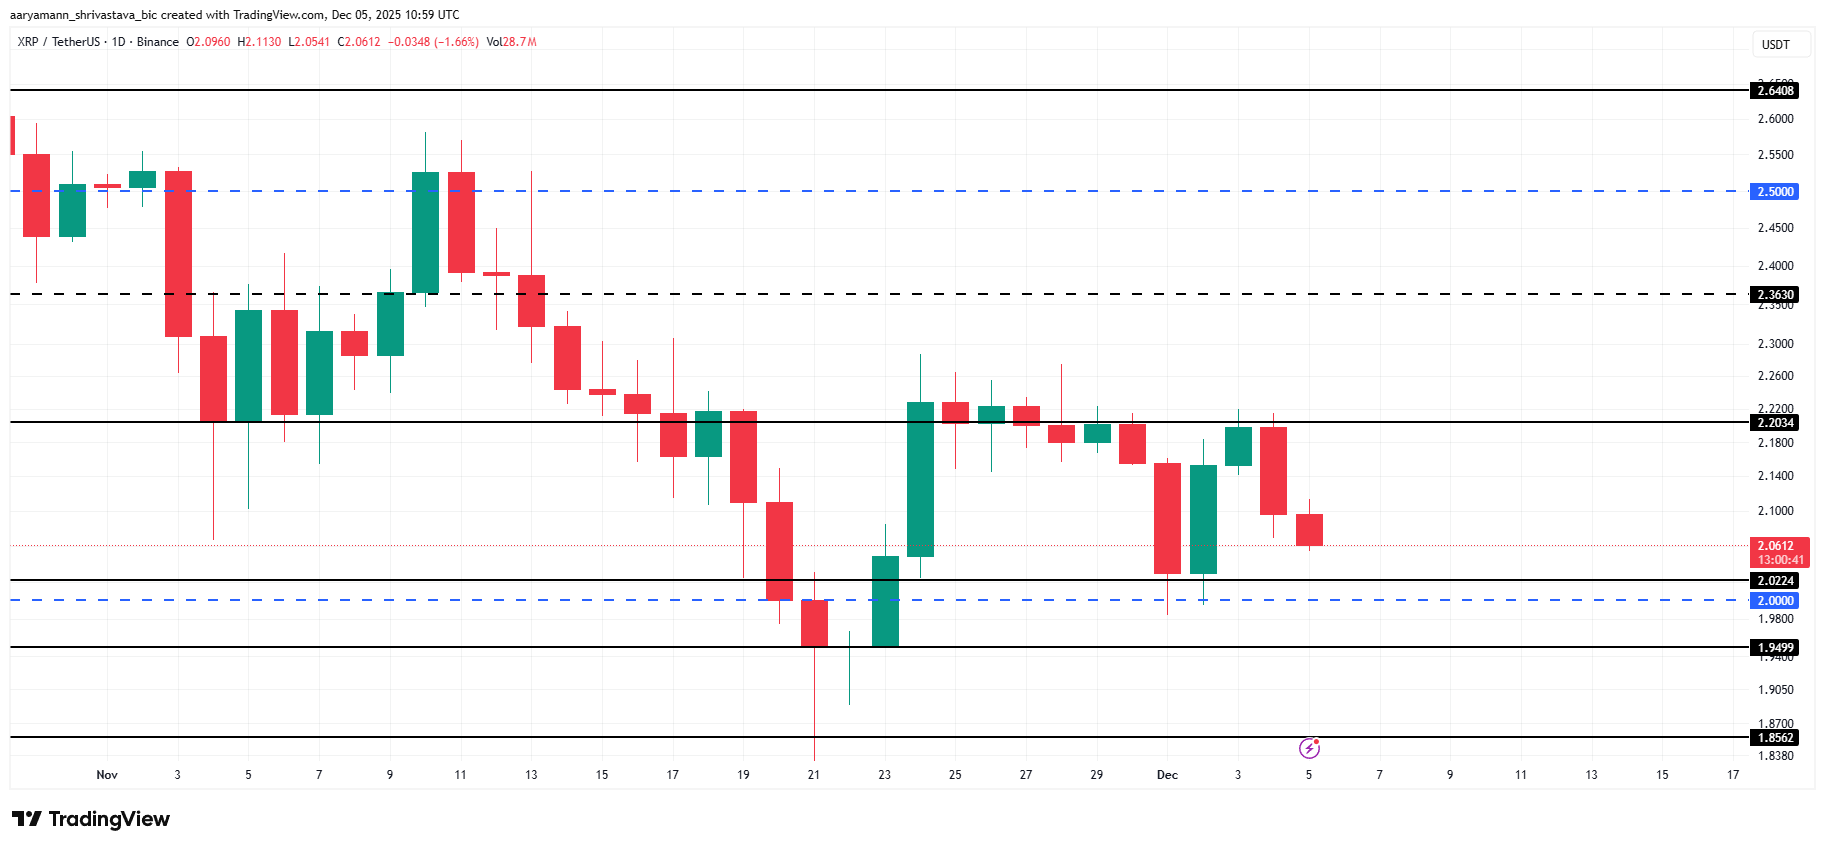
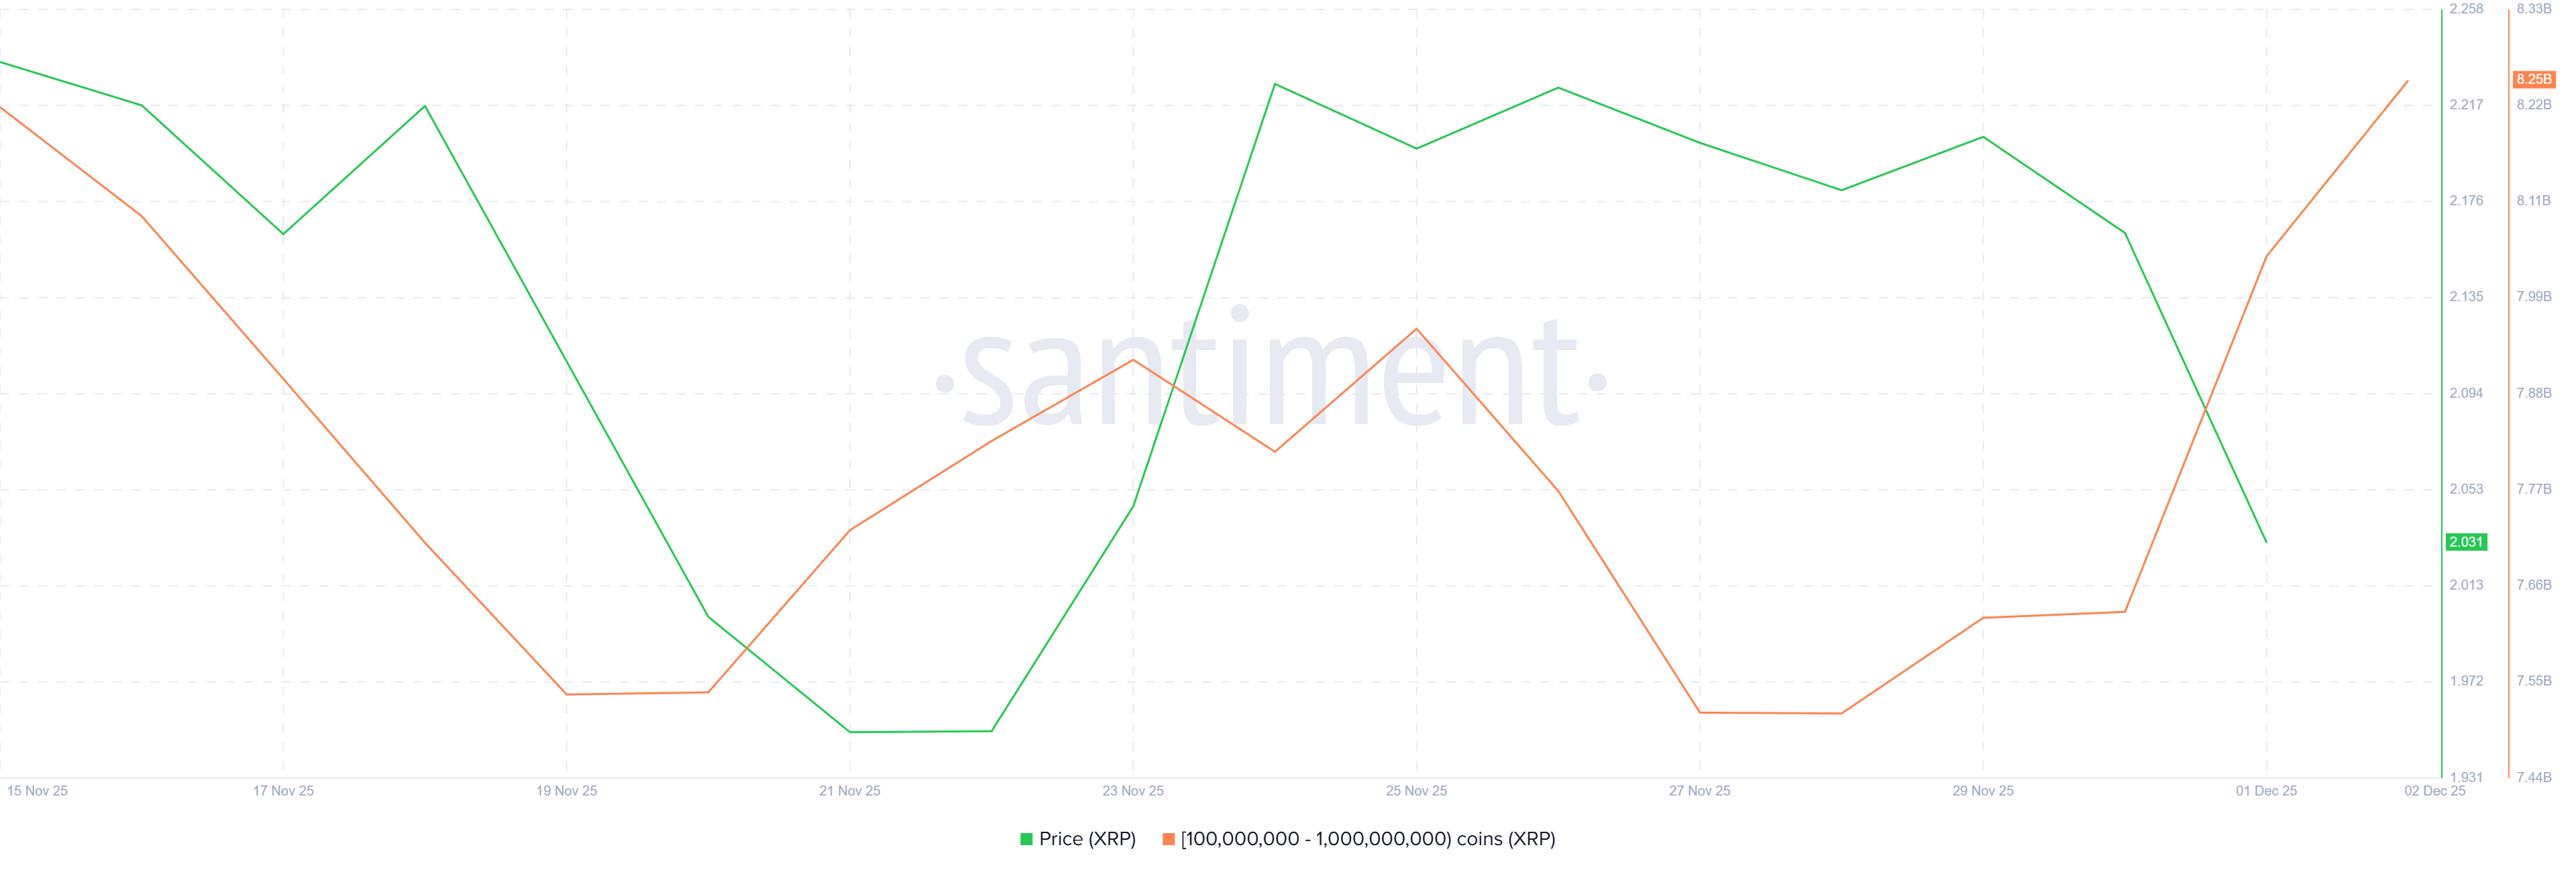
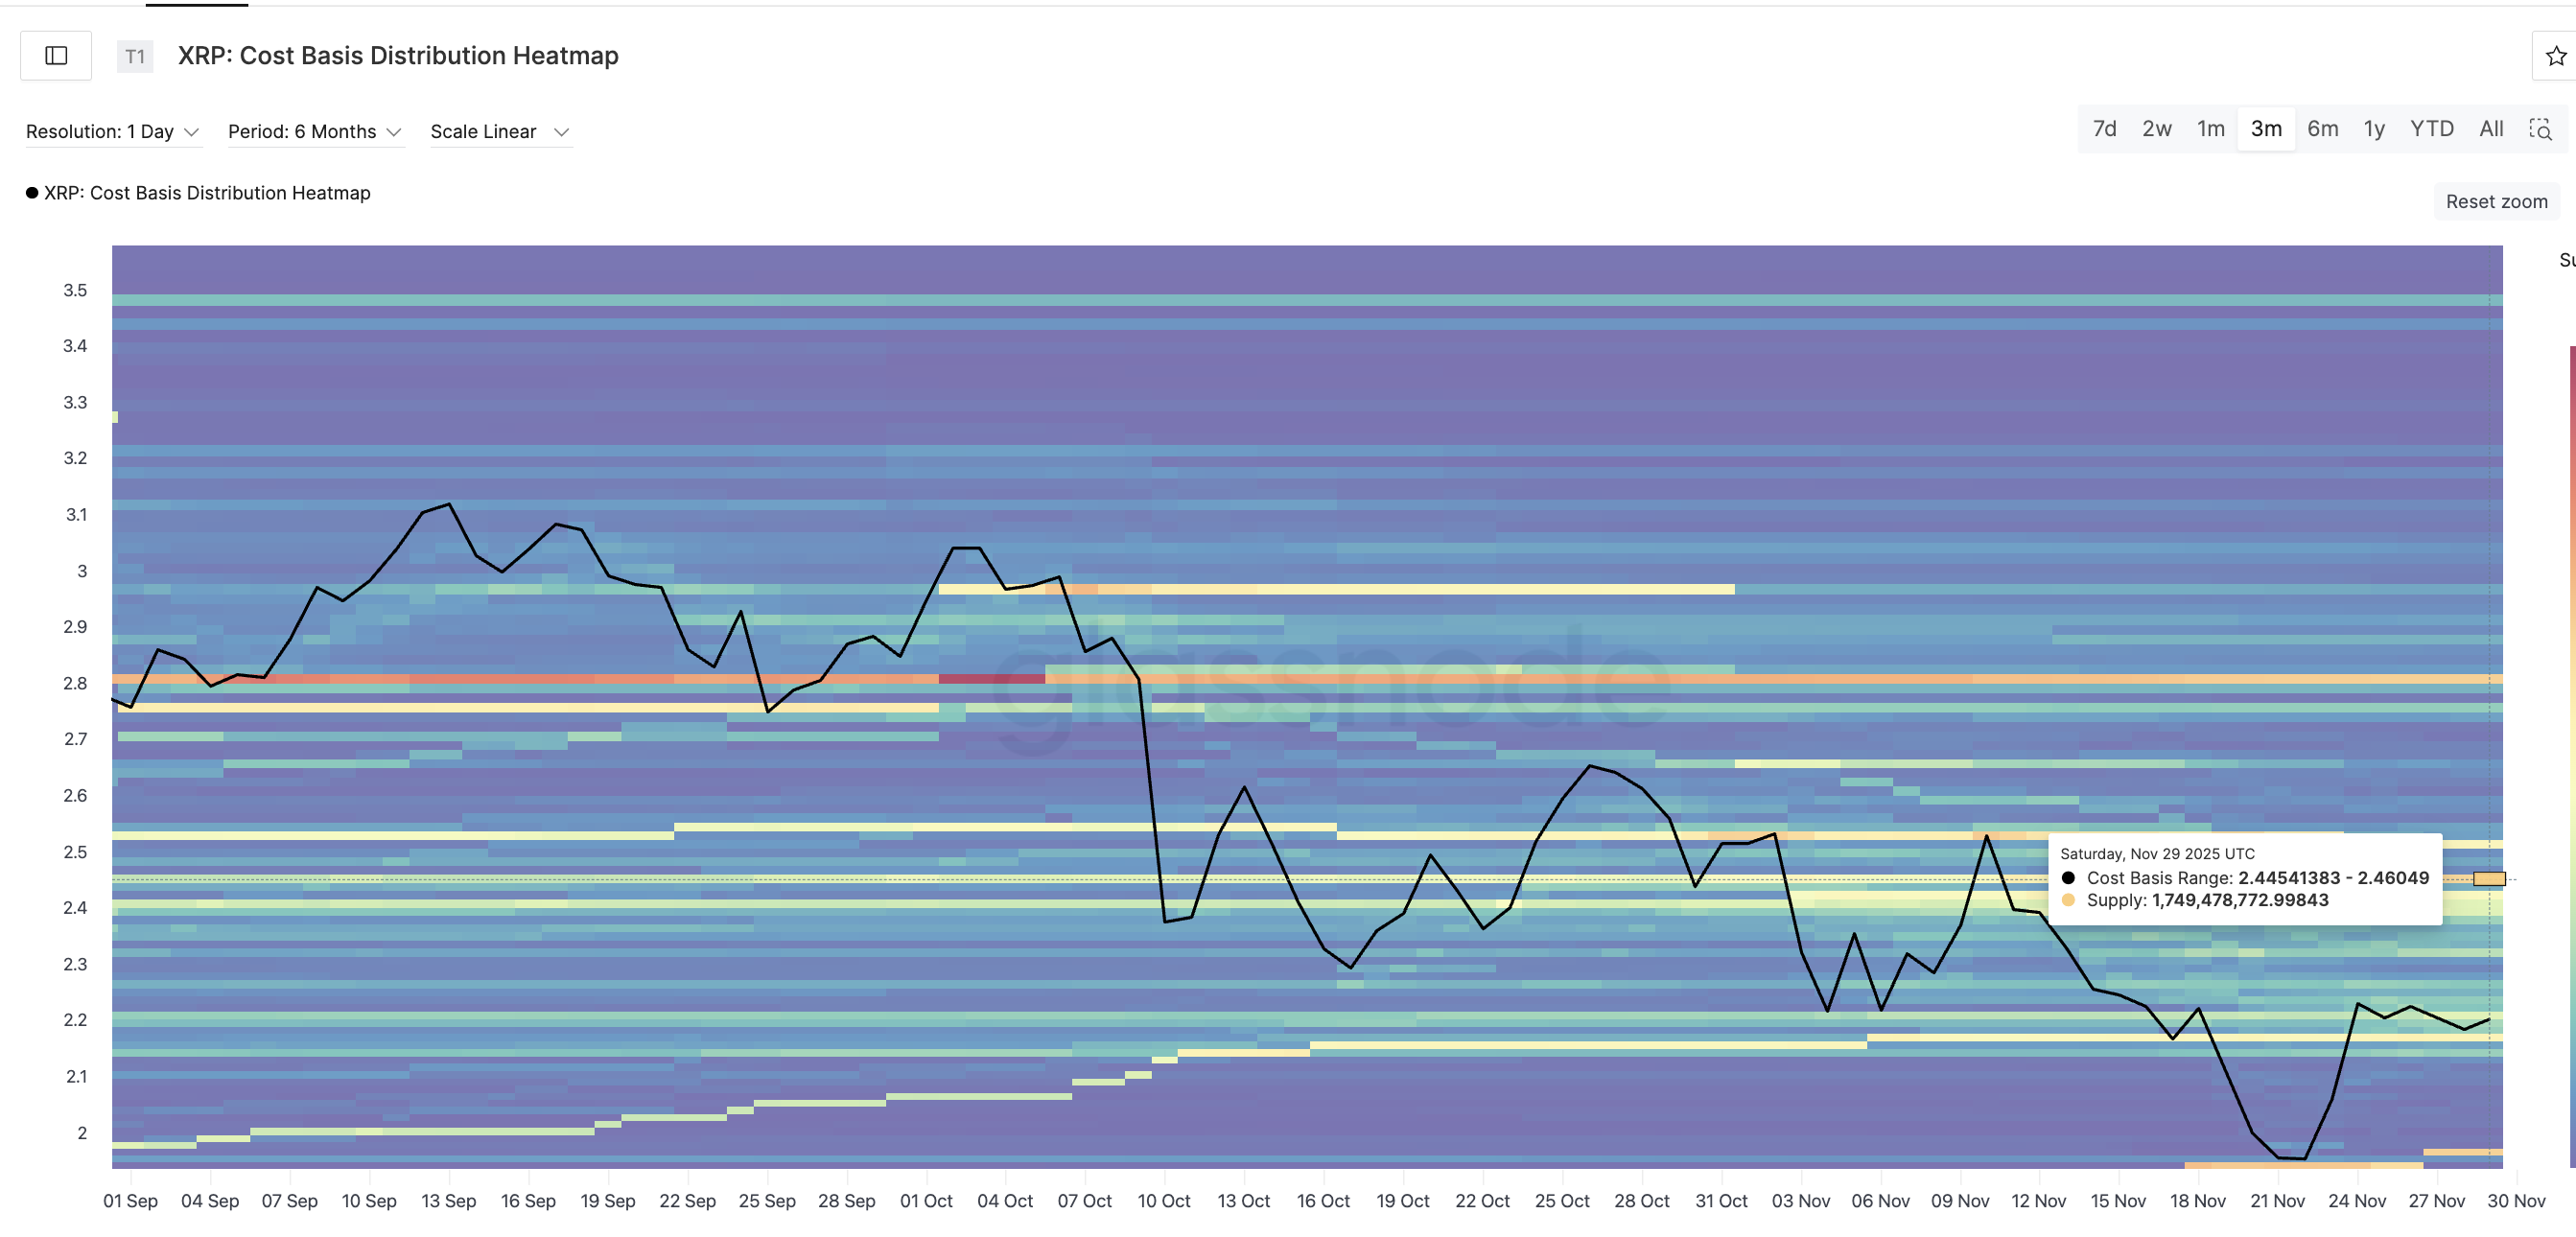
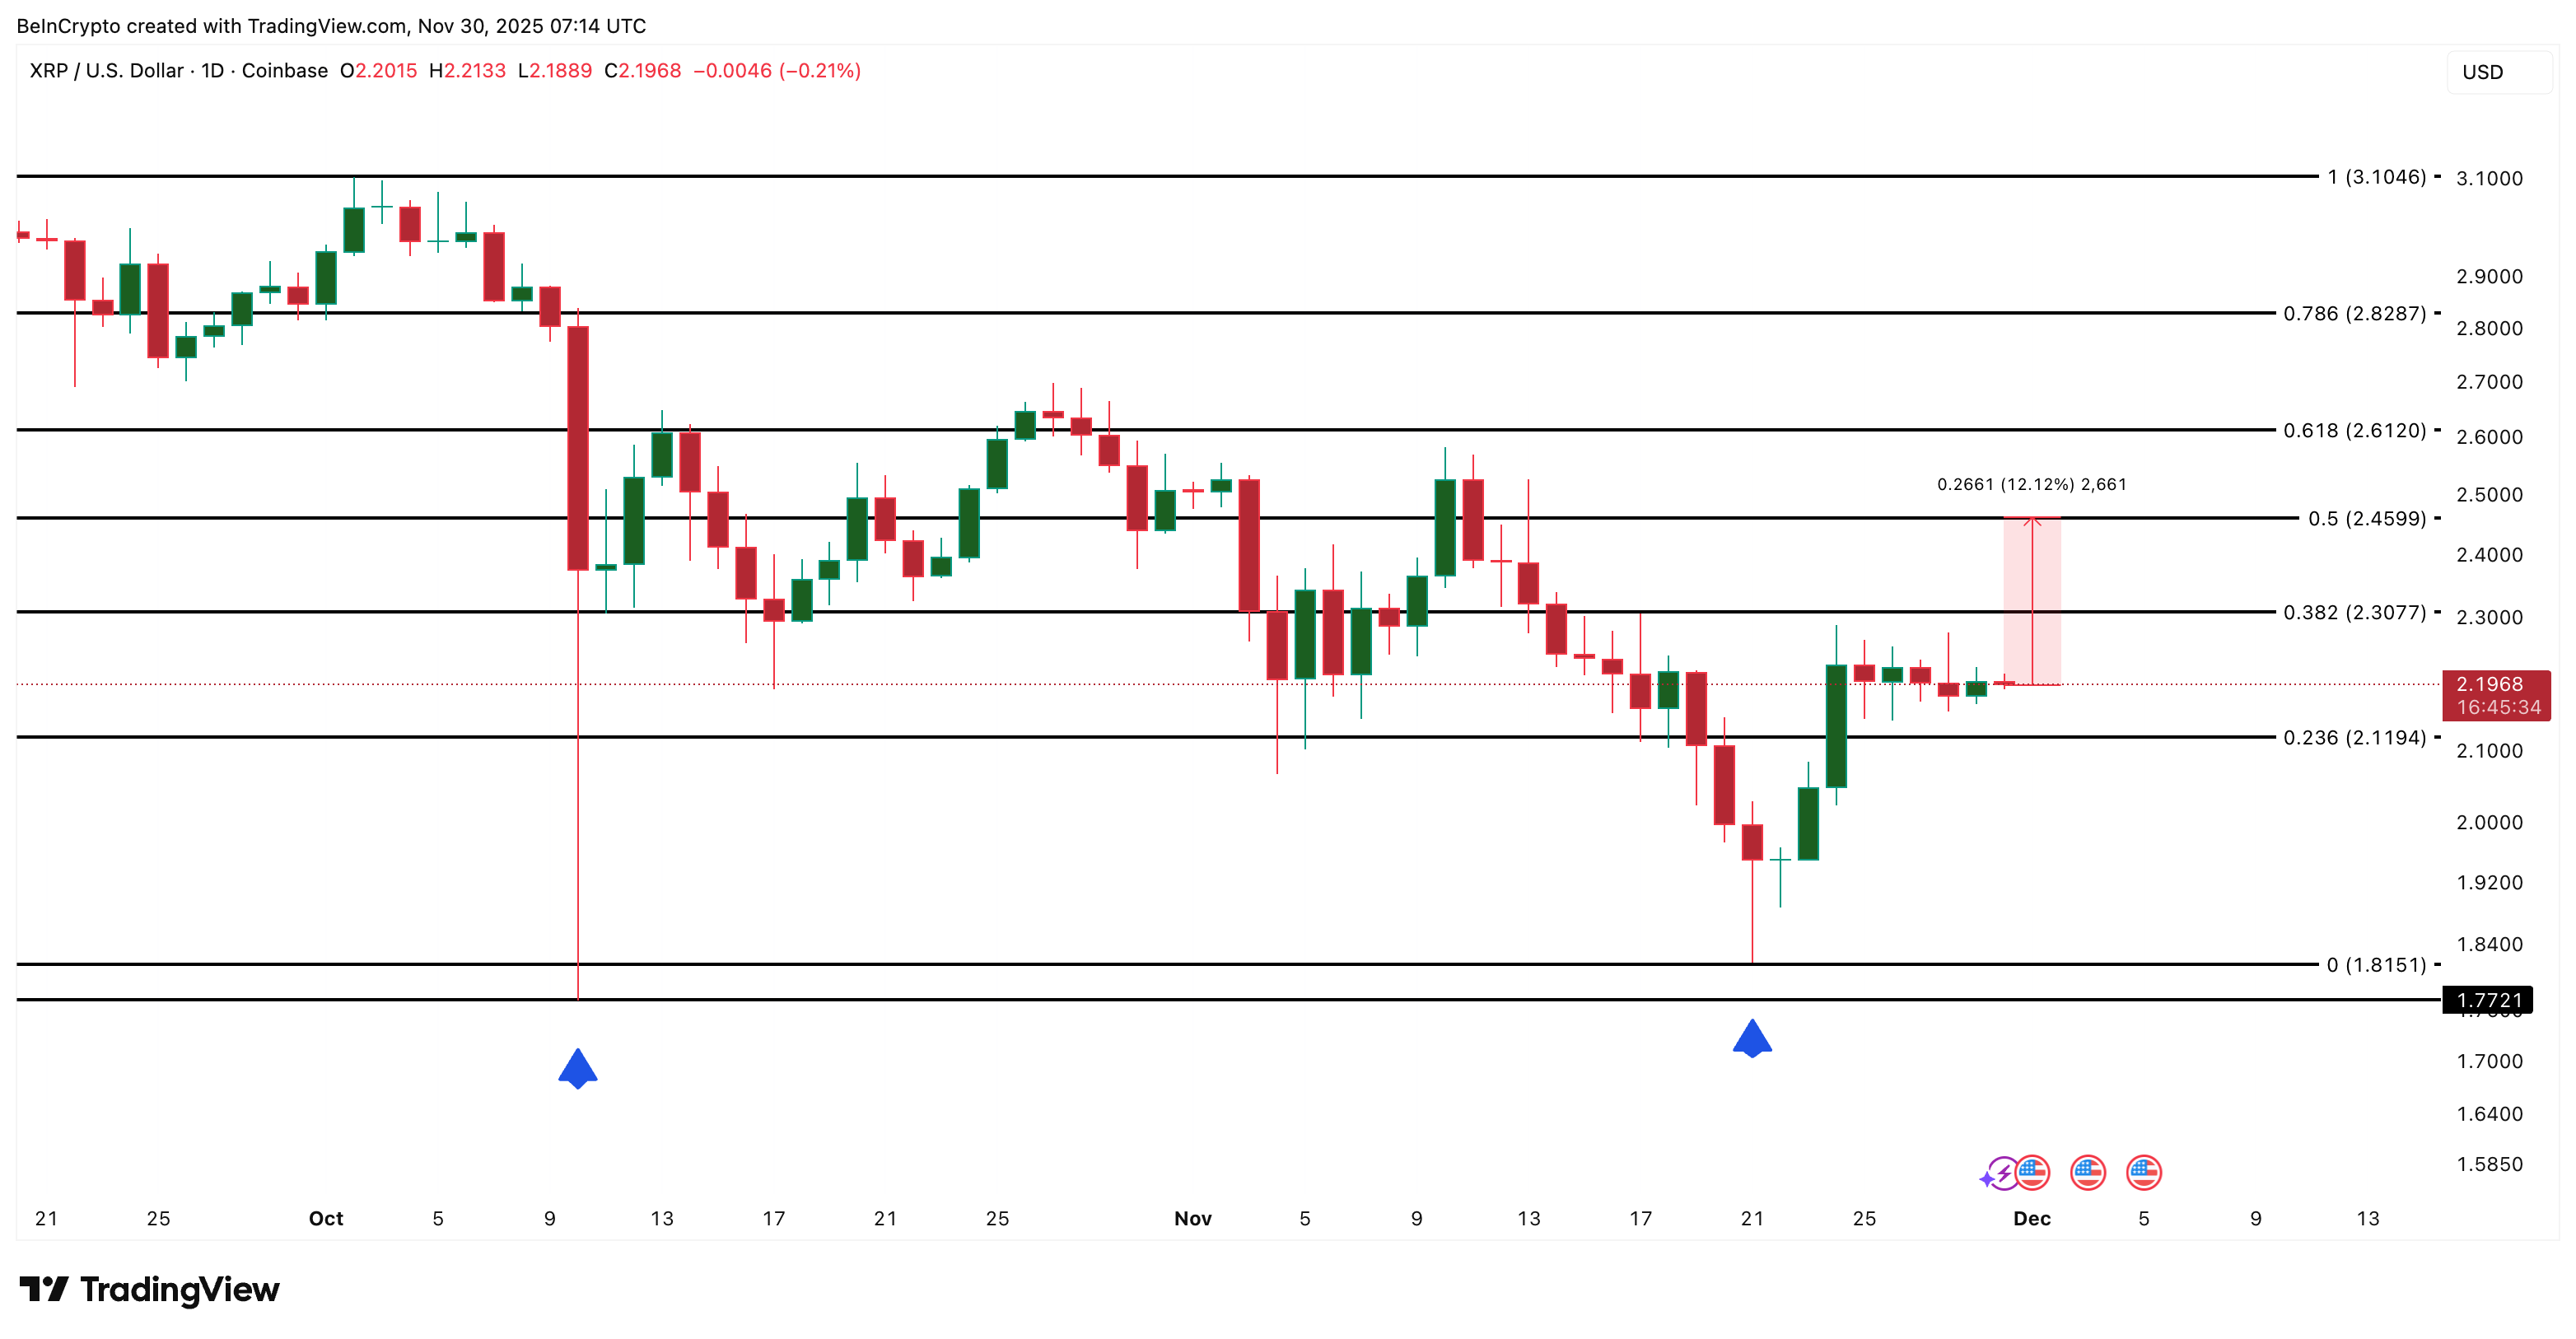
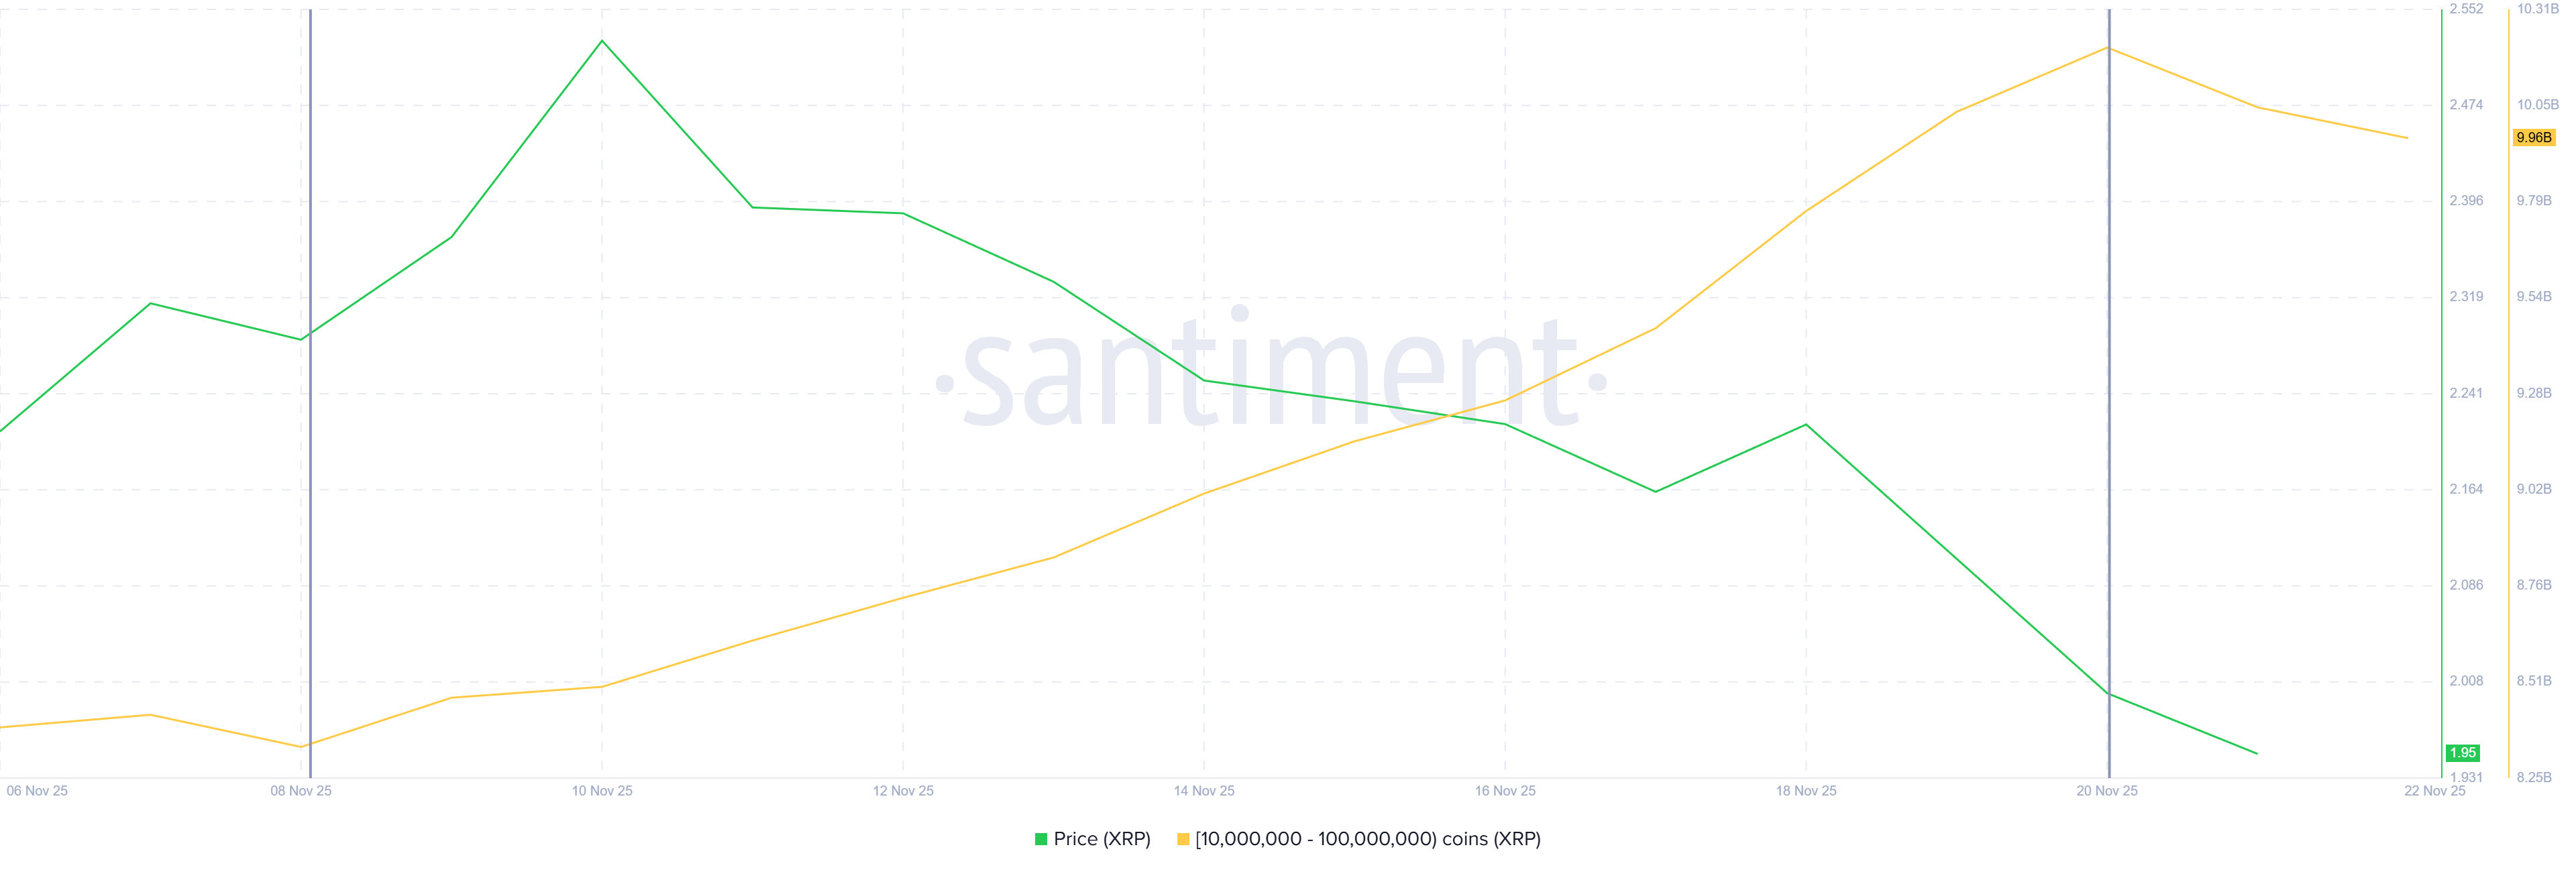
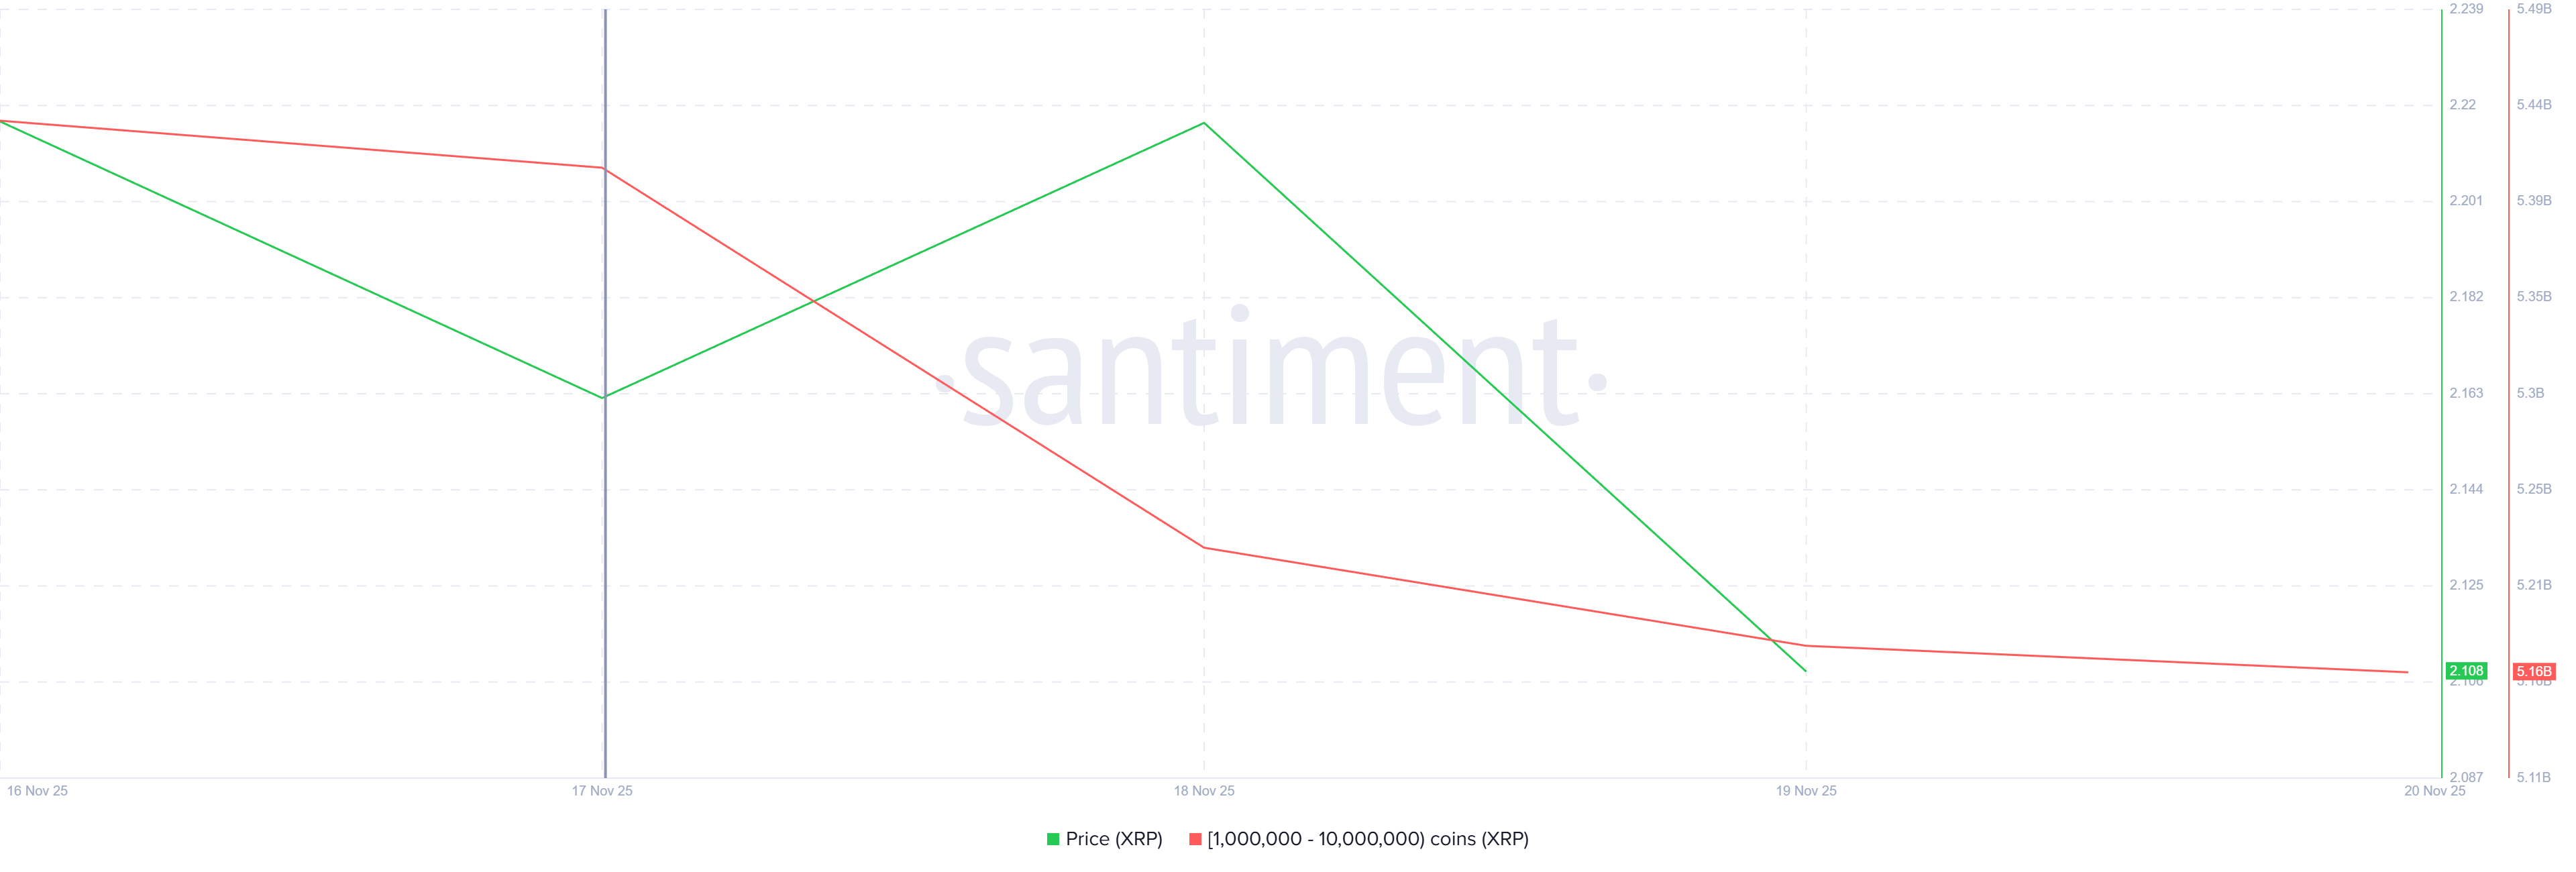
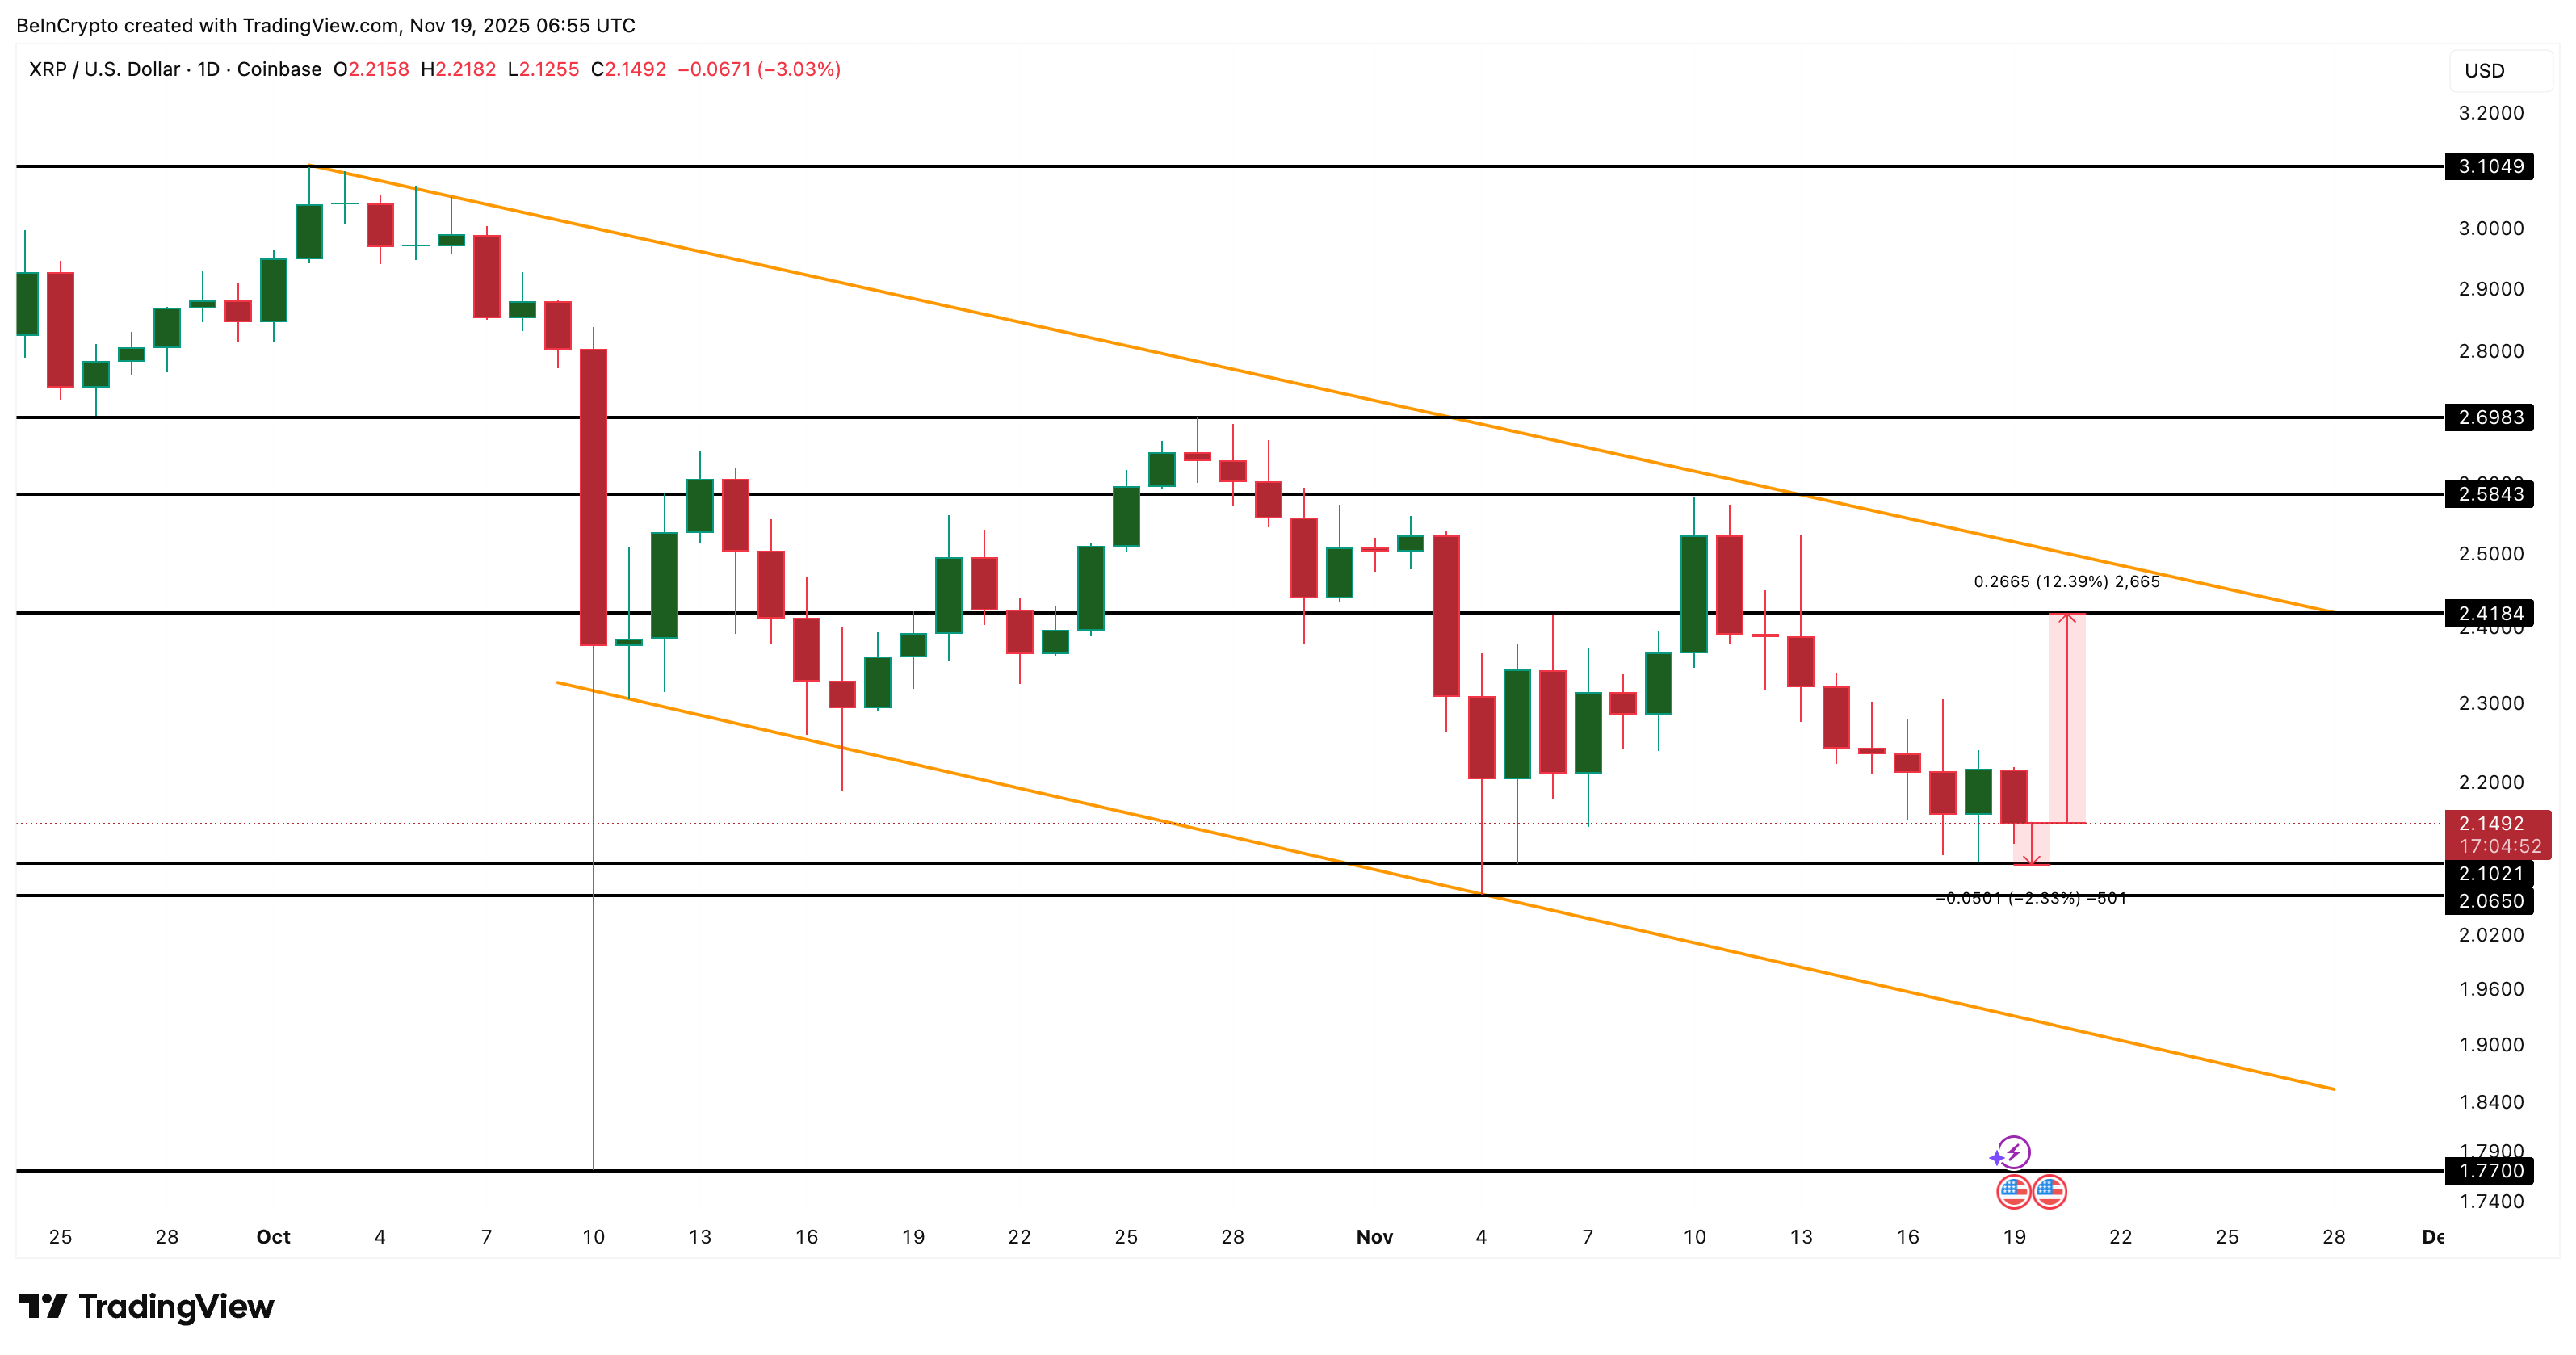
On-chain cost basis data shows a heavy supply cluster between $1.96 and $1.97. Around 1.82 billion XRP were accumulated in this zone. Cost basis data tracks where holders bought their coins. When price returns to those levels, many holders reach break-even and tend to sell.

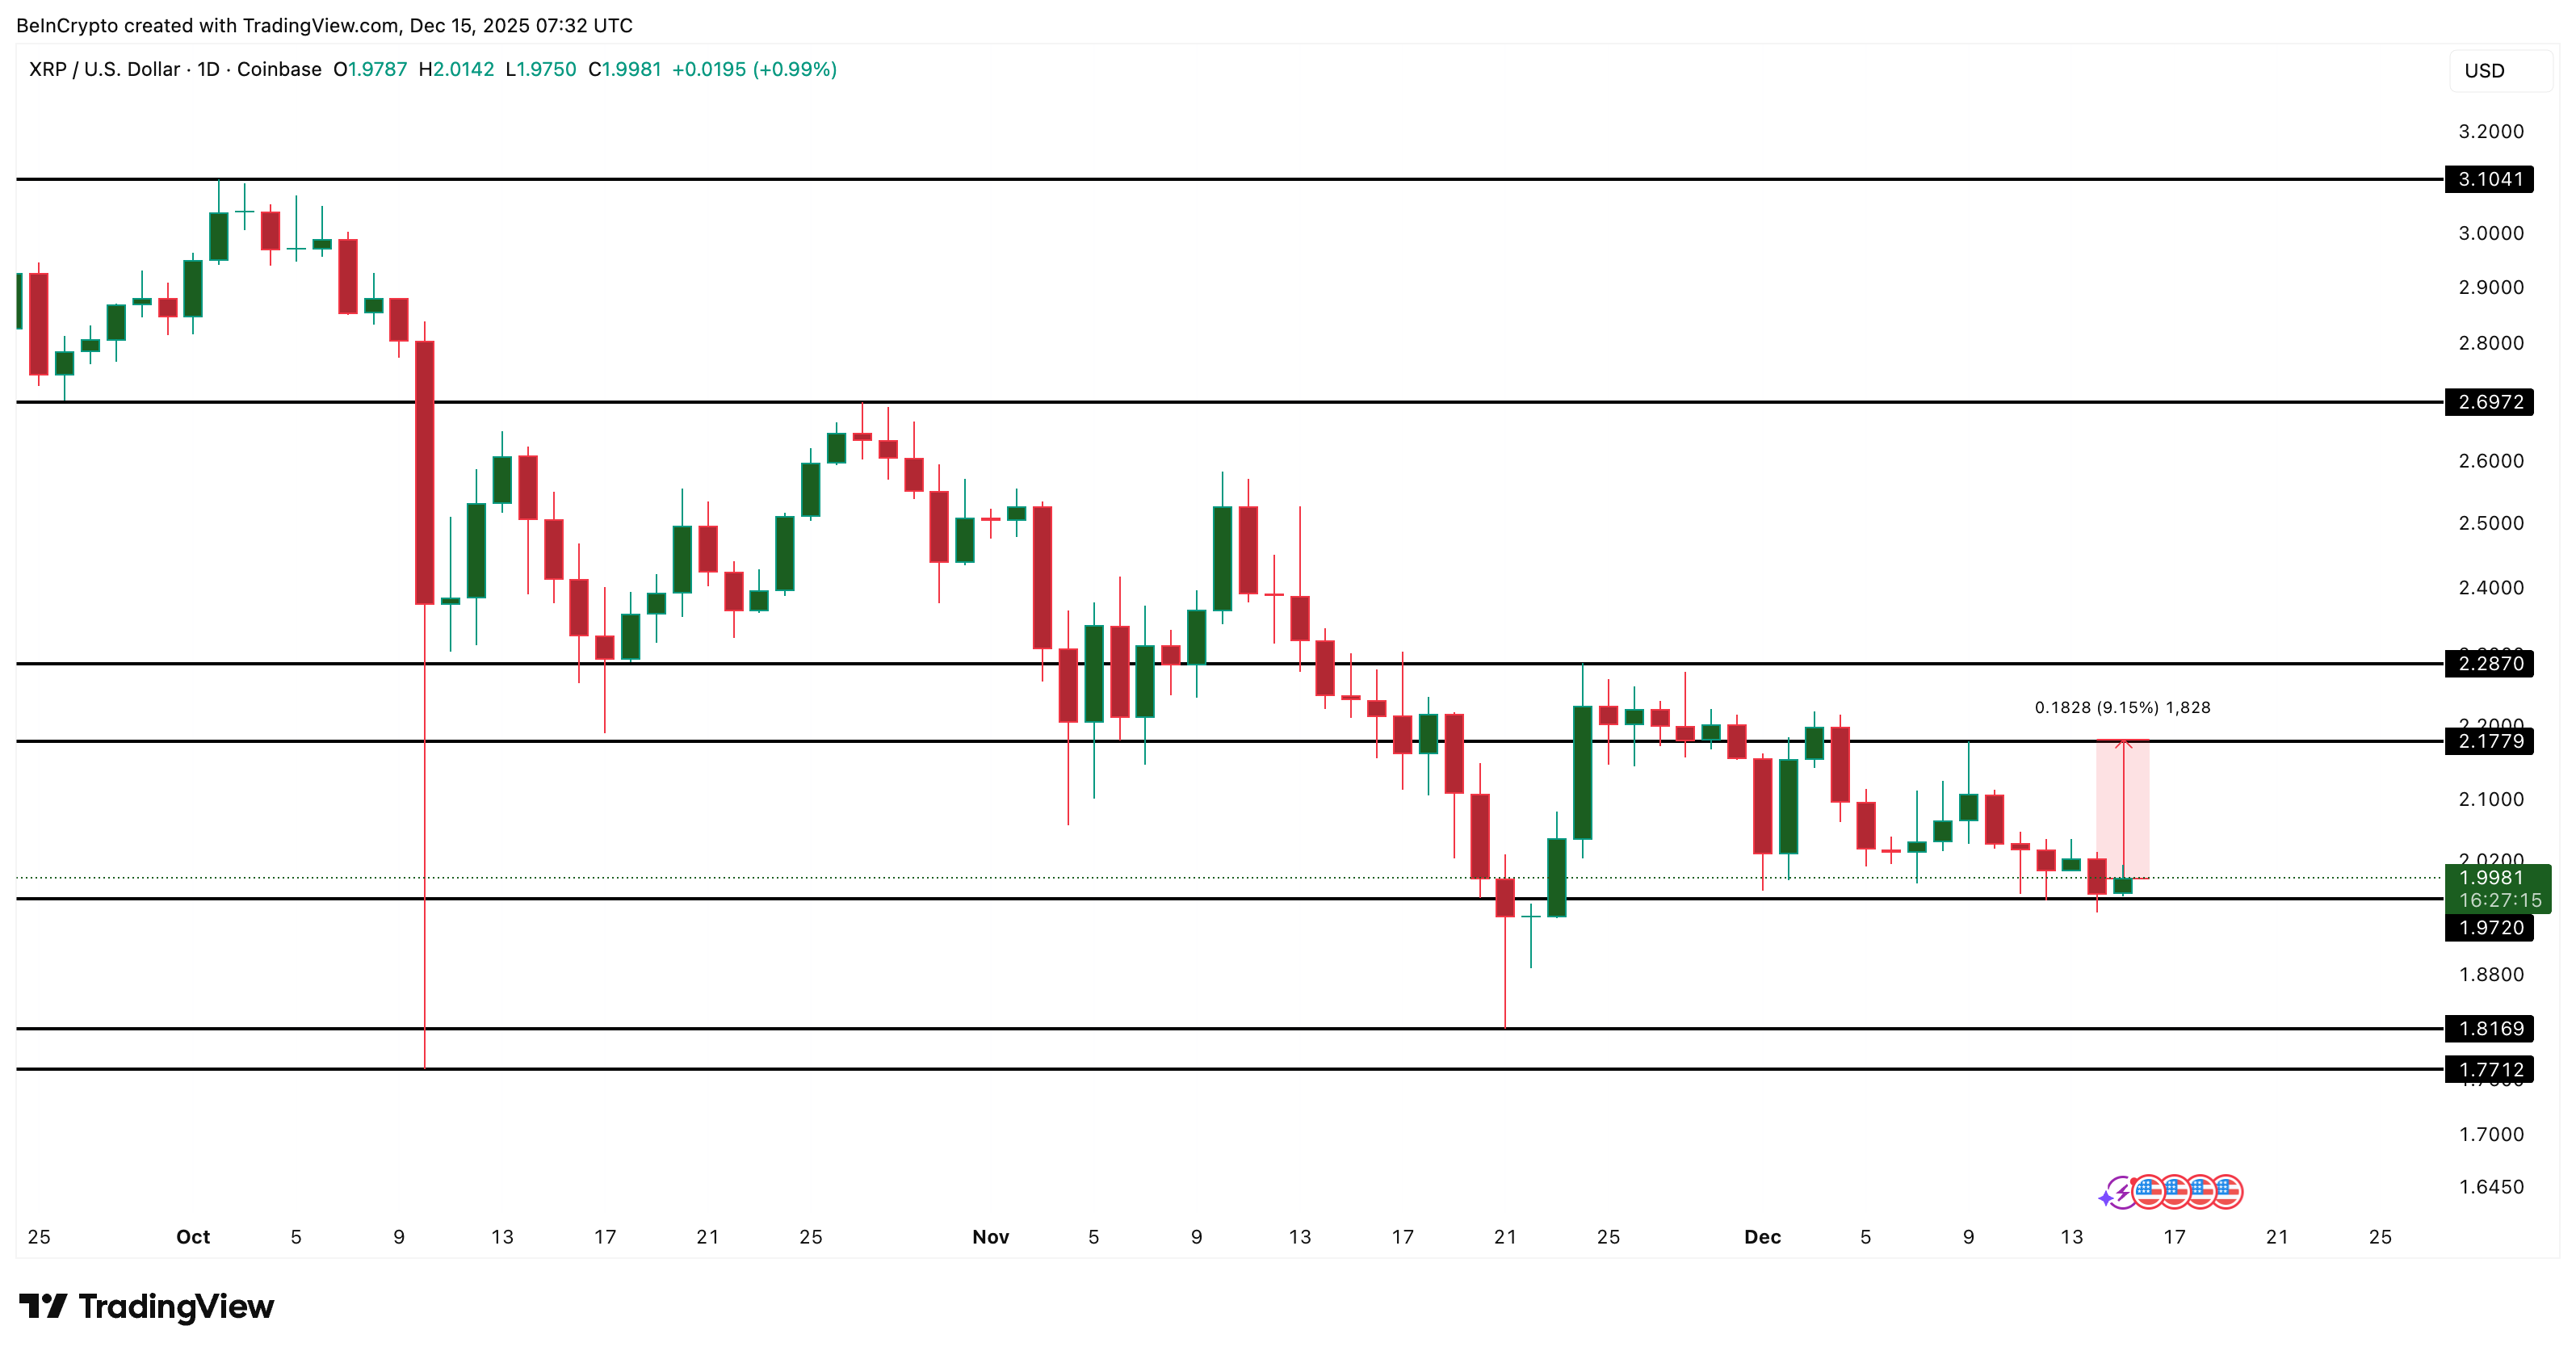
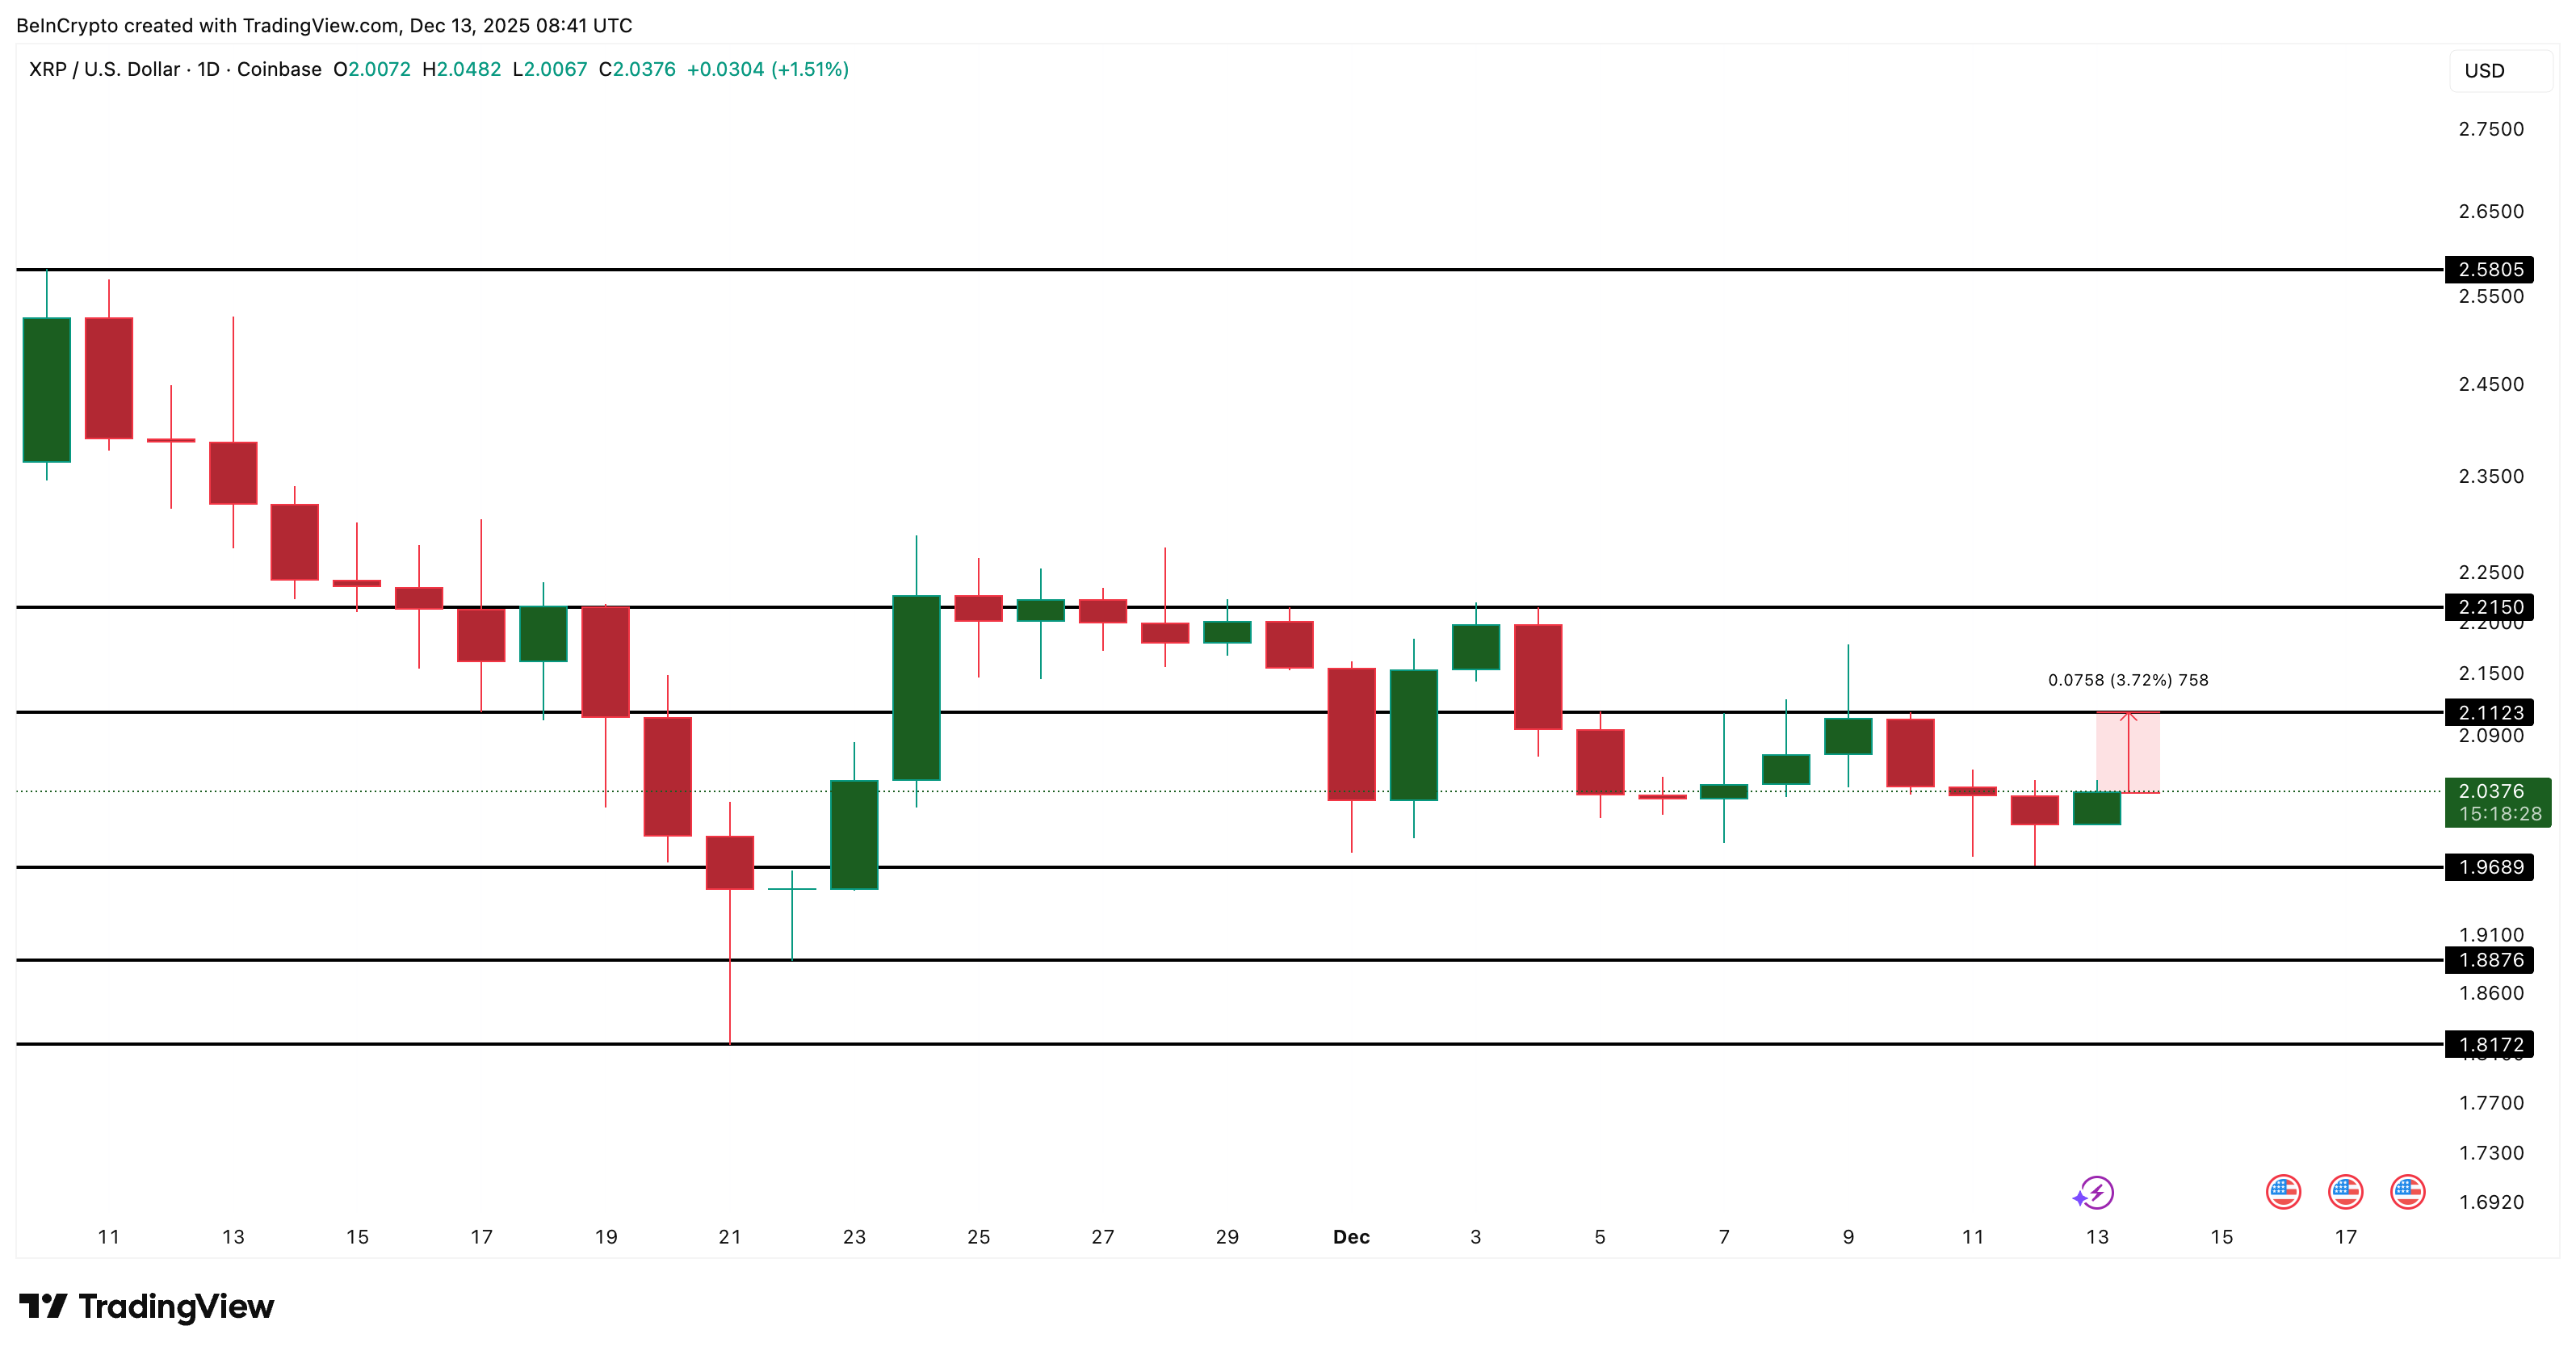
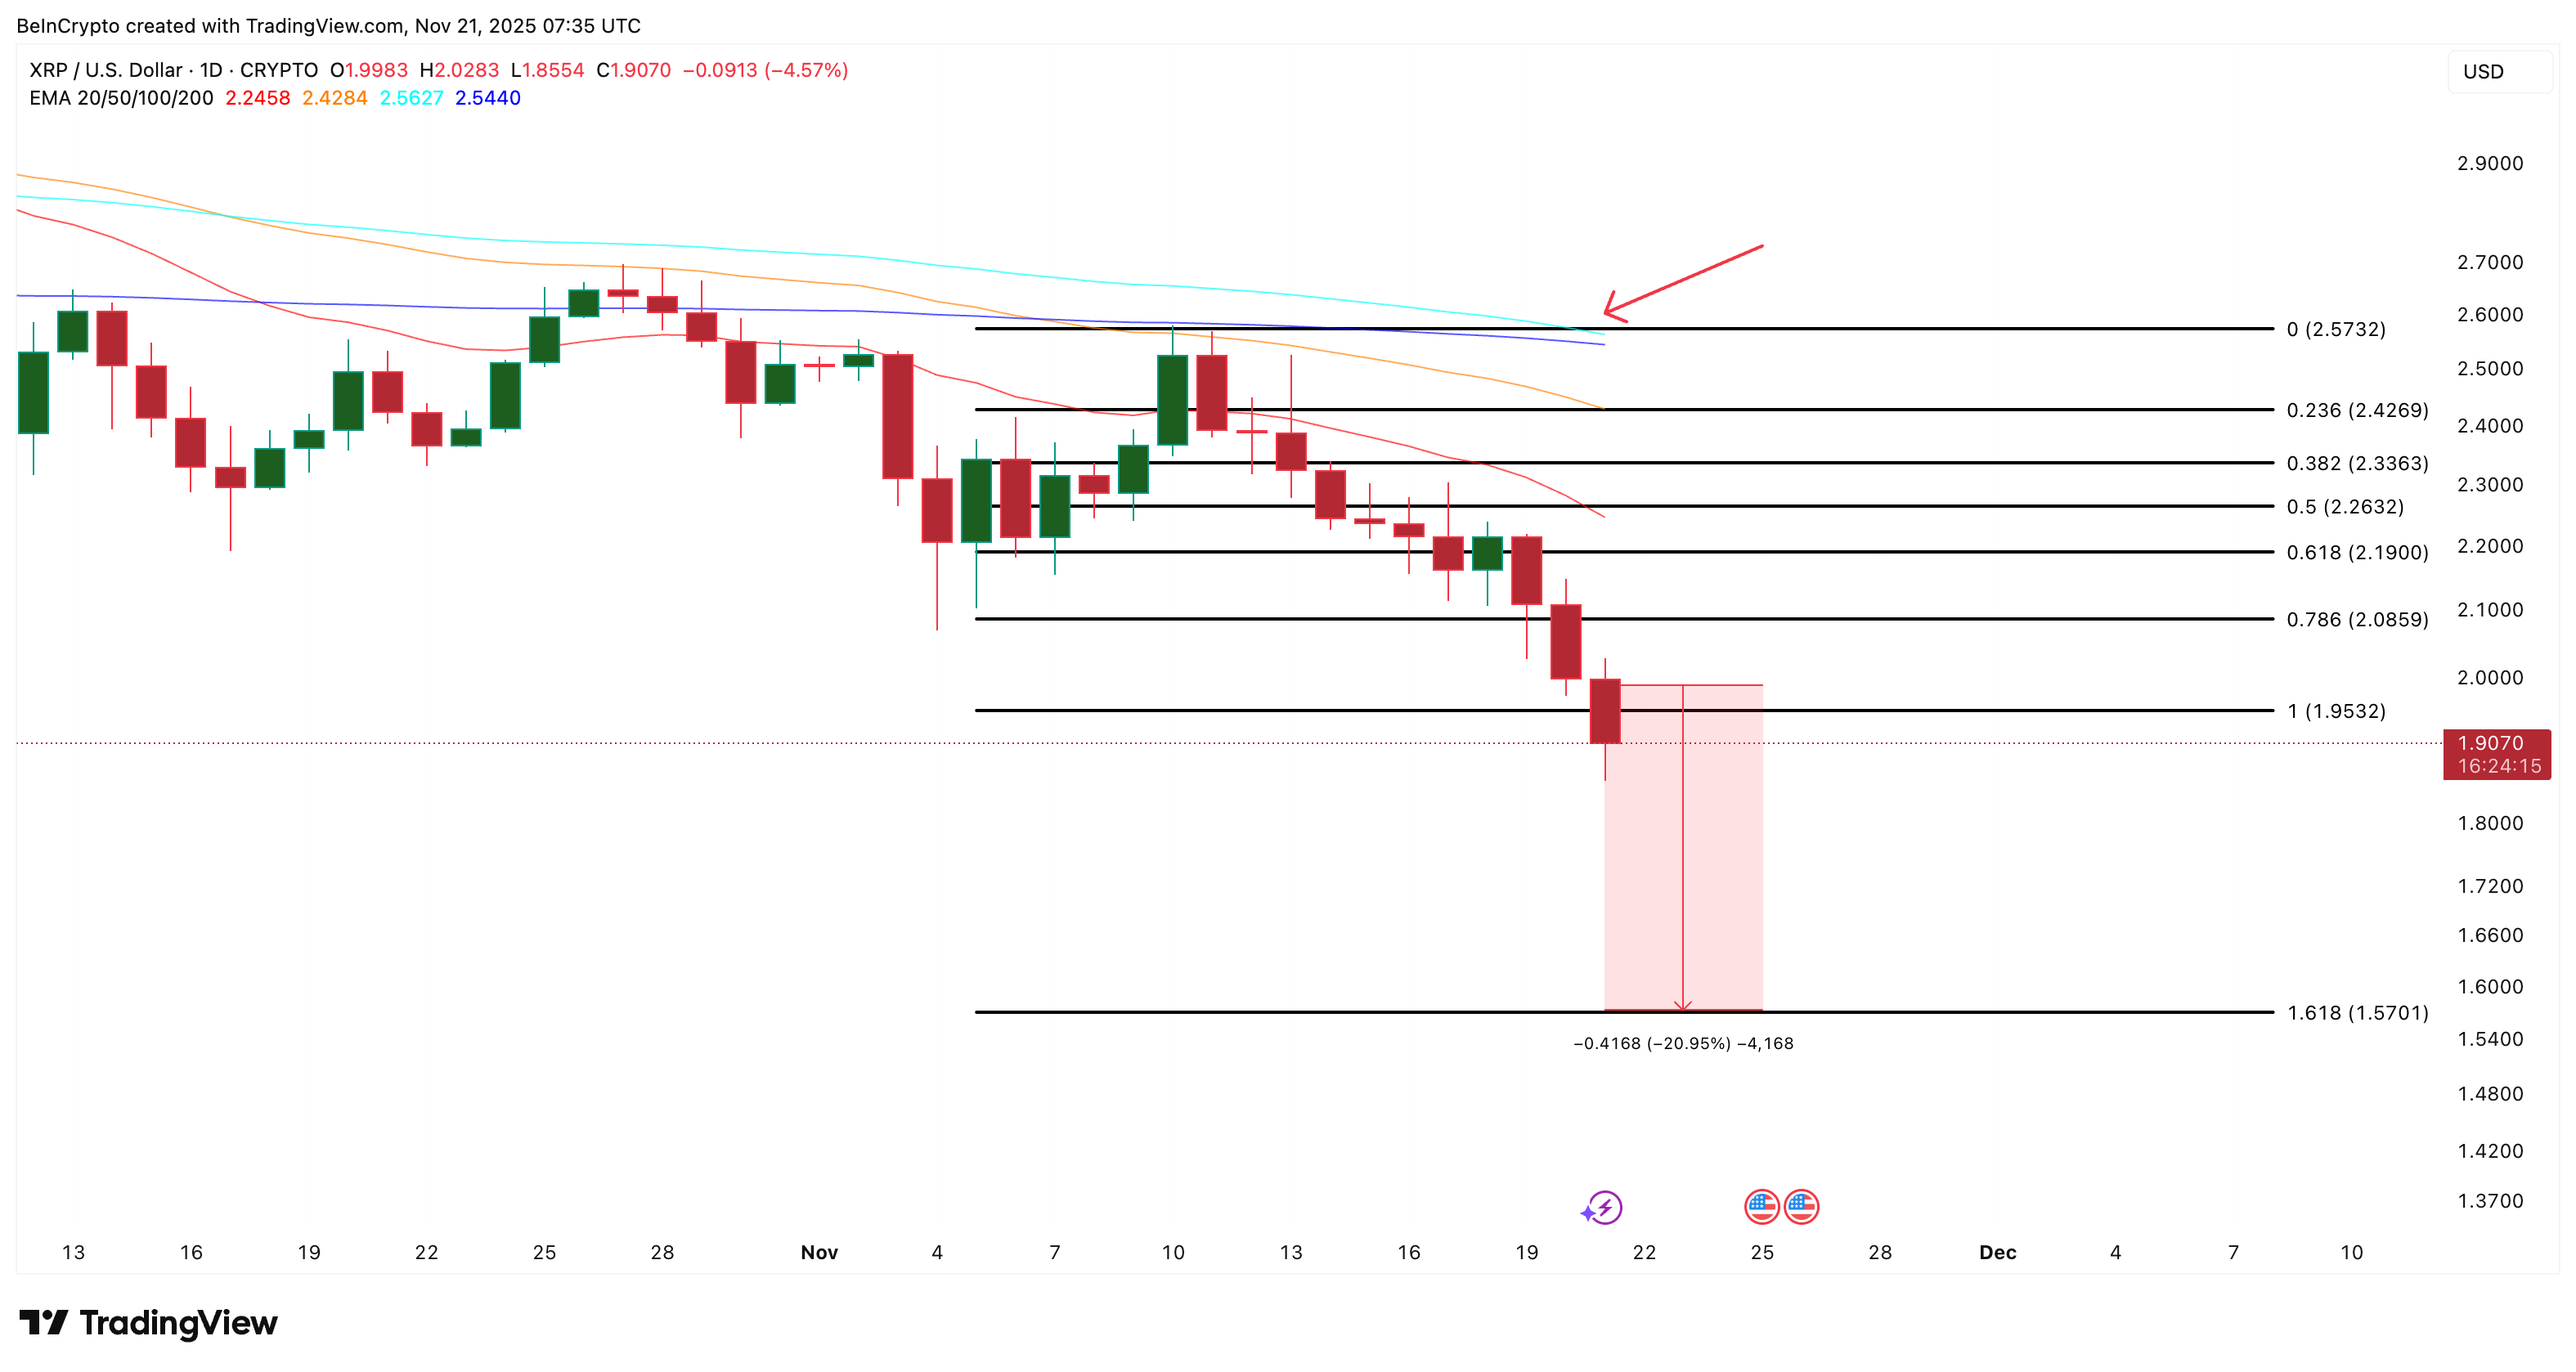
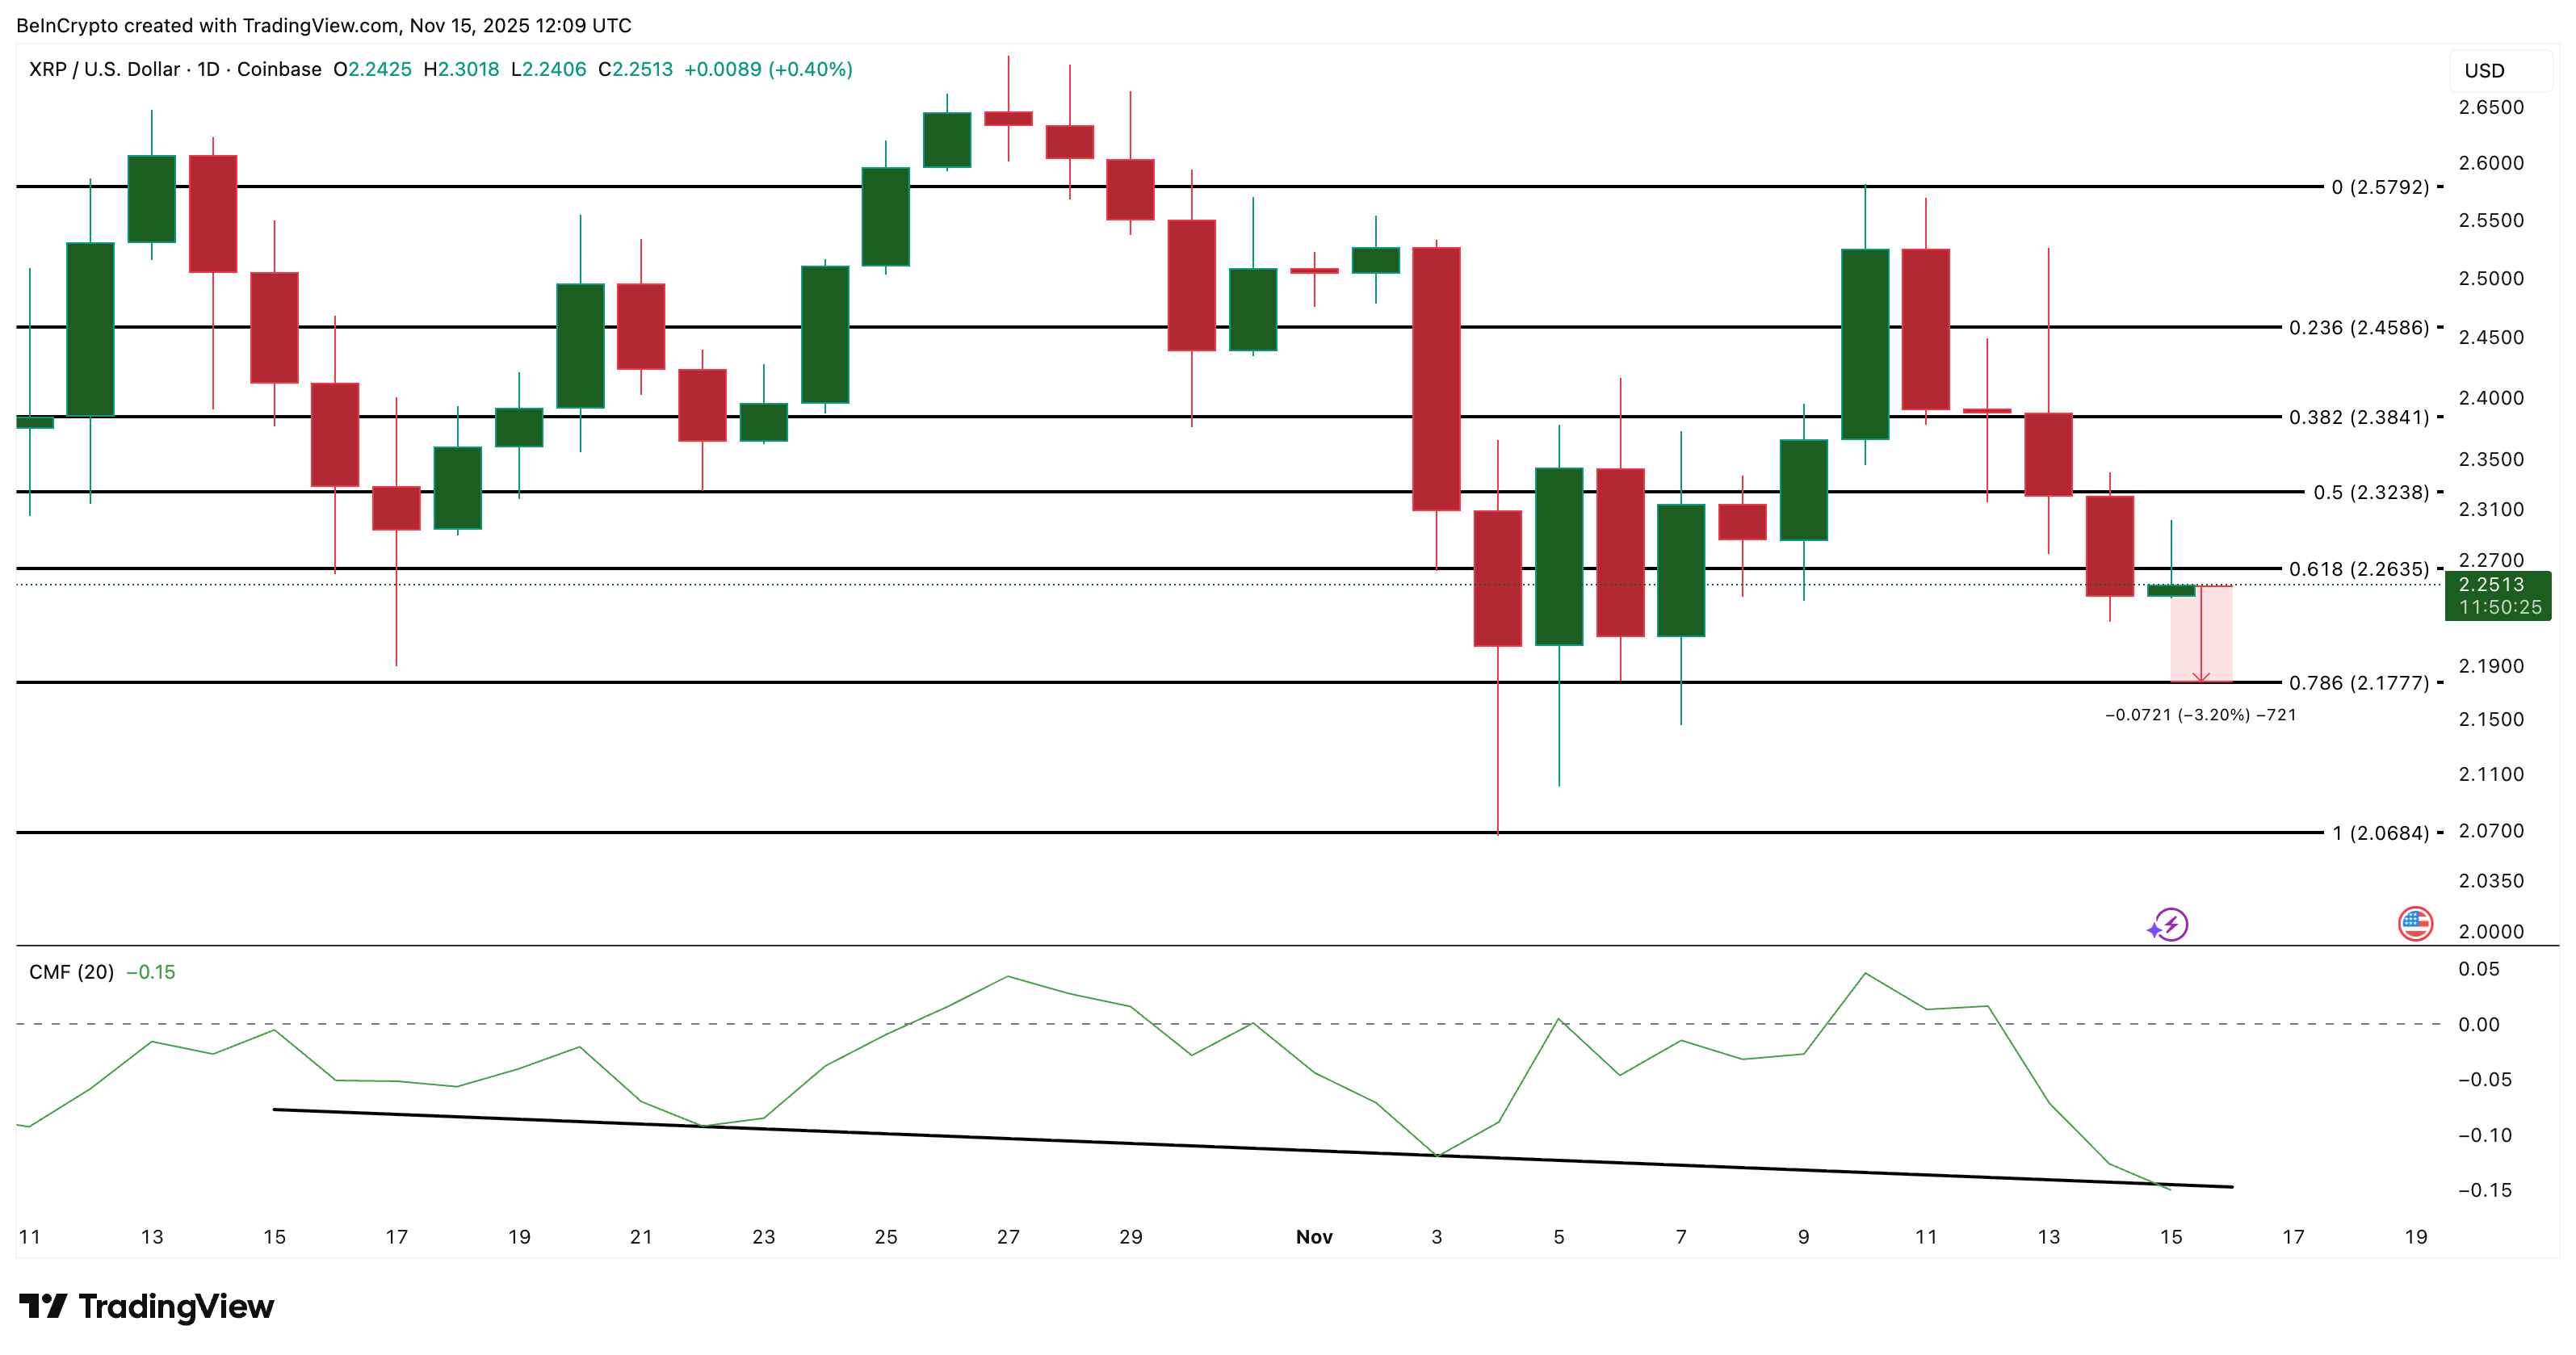
This makes the $1.96–$1.97 range a powerful resistance zone.

Strong XRP Supply Cluster
Strong XRP Supply Cluster: Glassnode

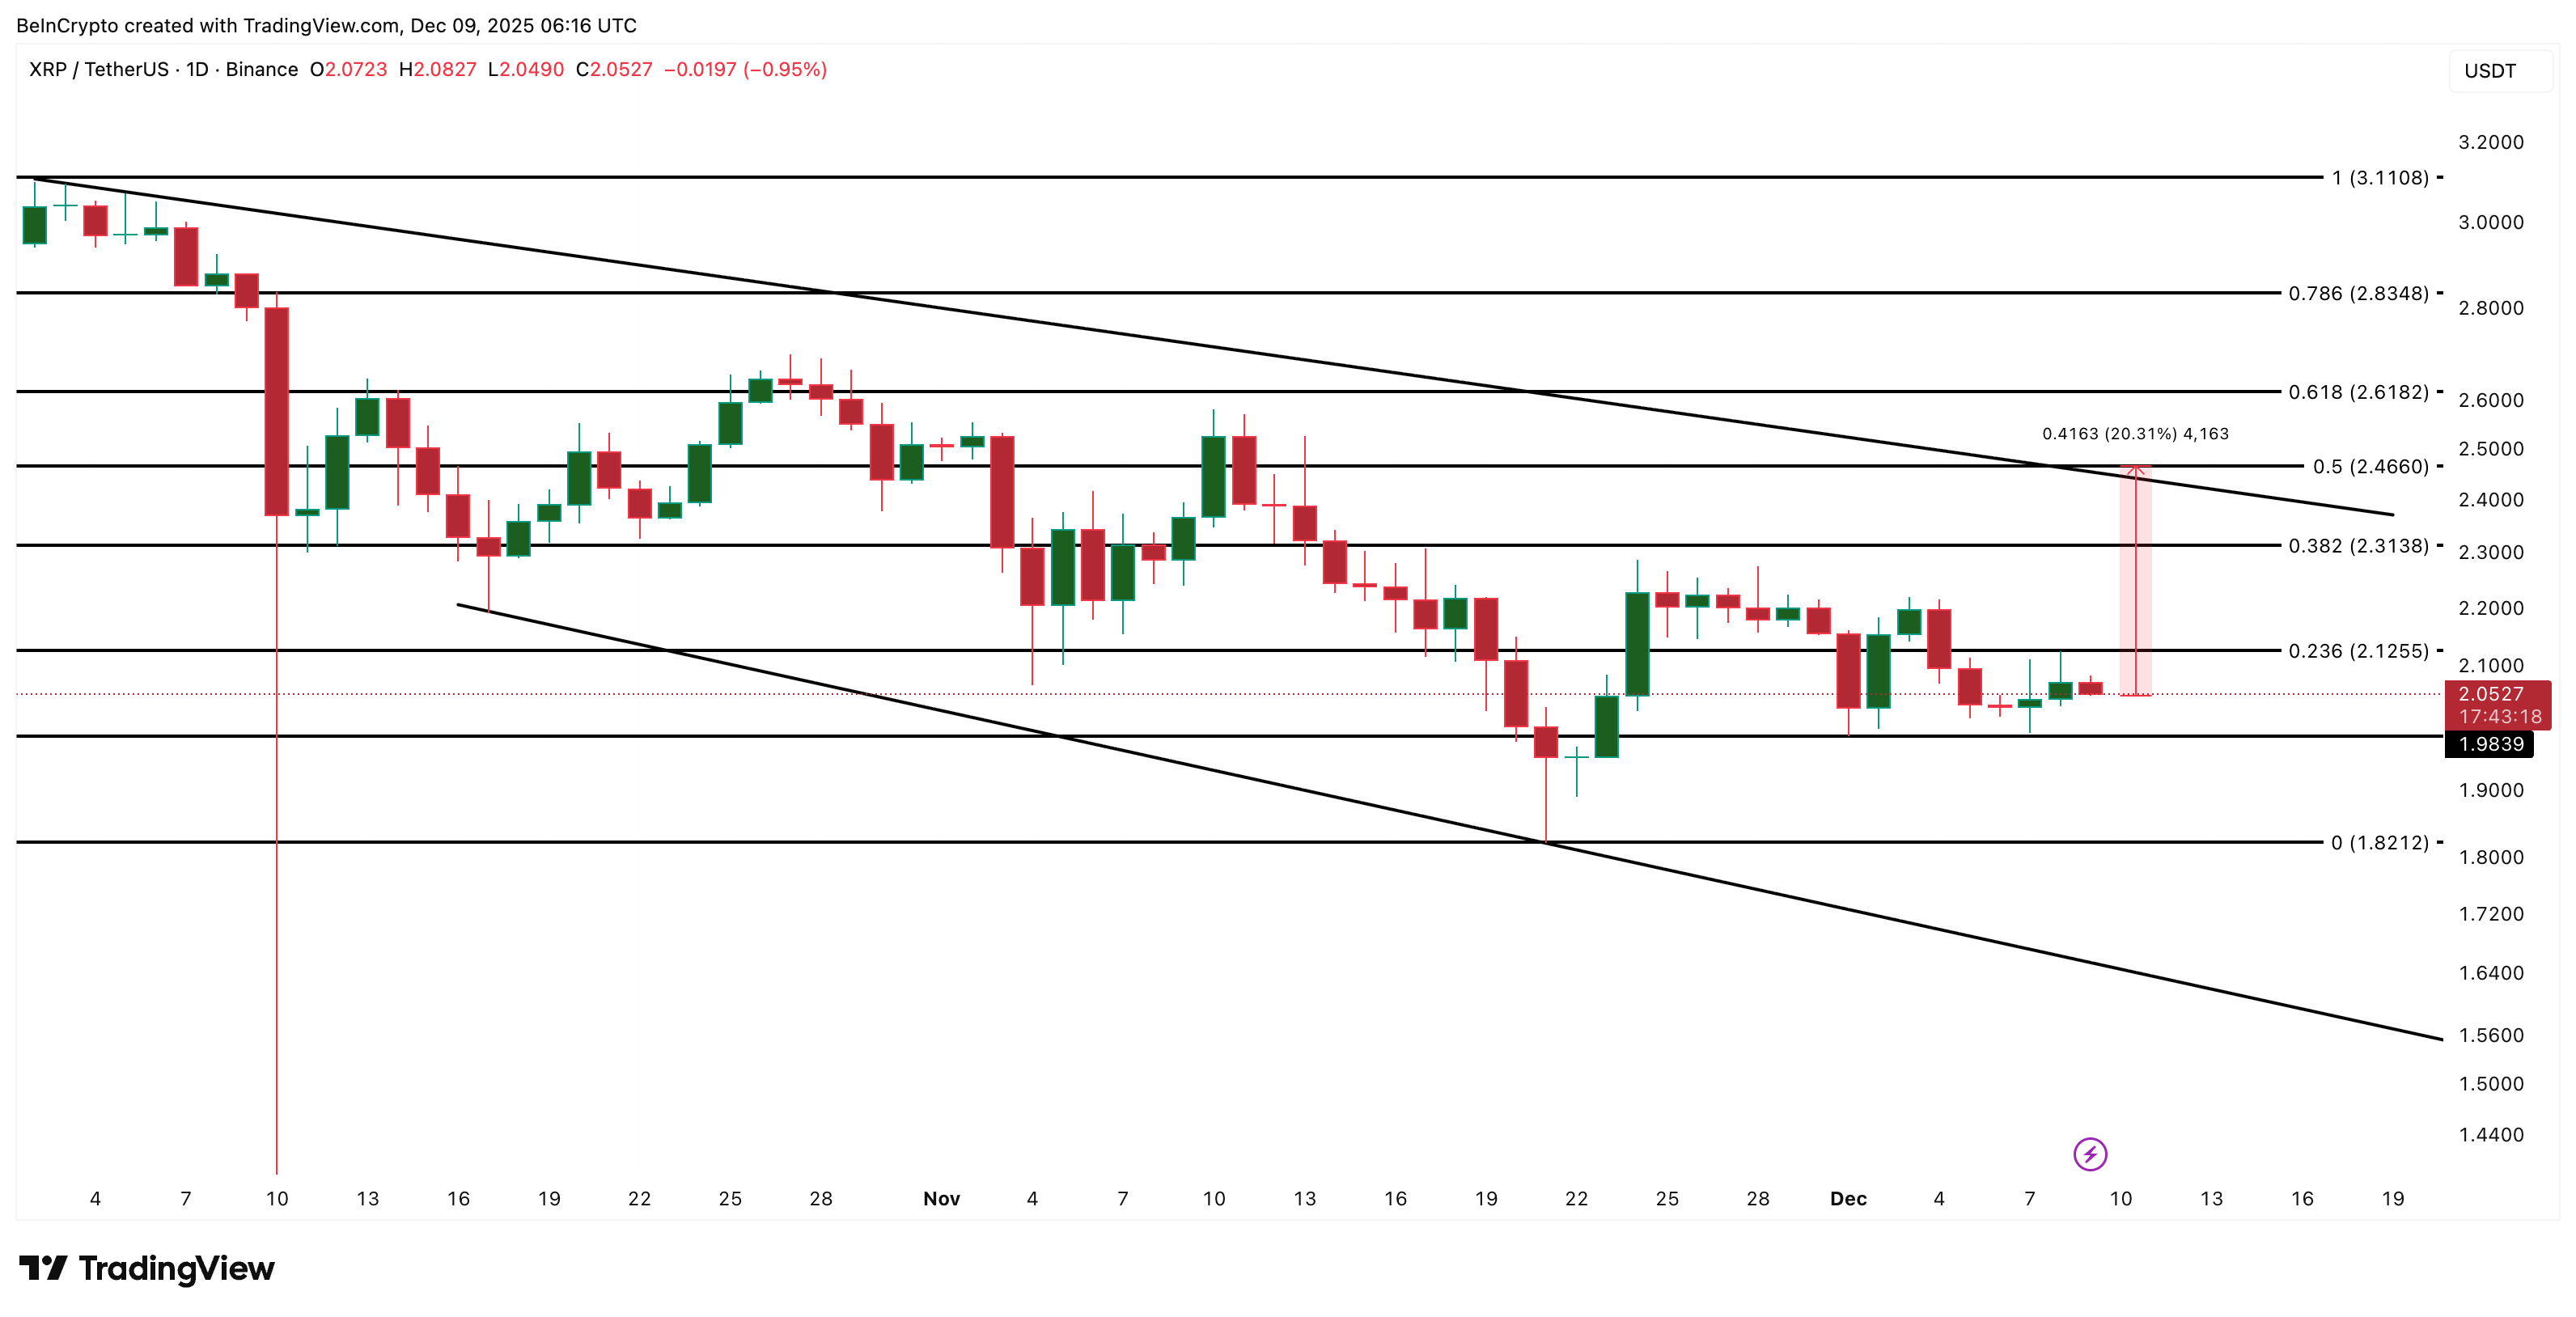
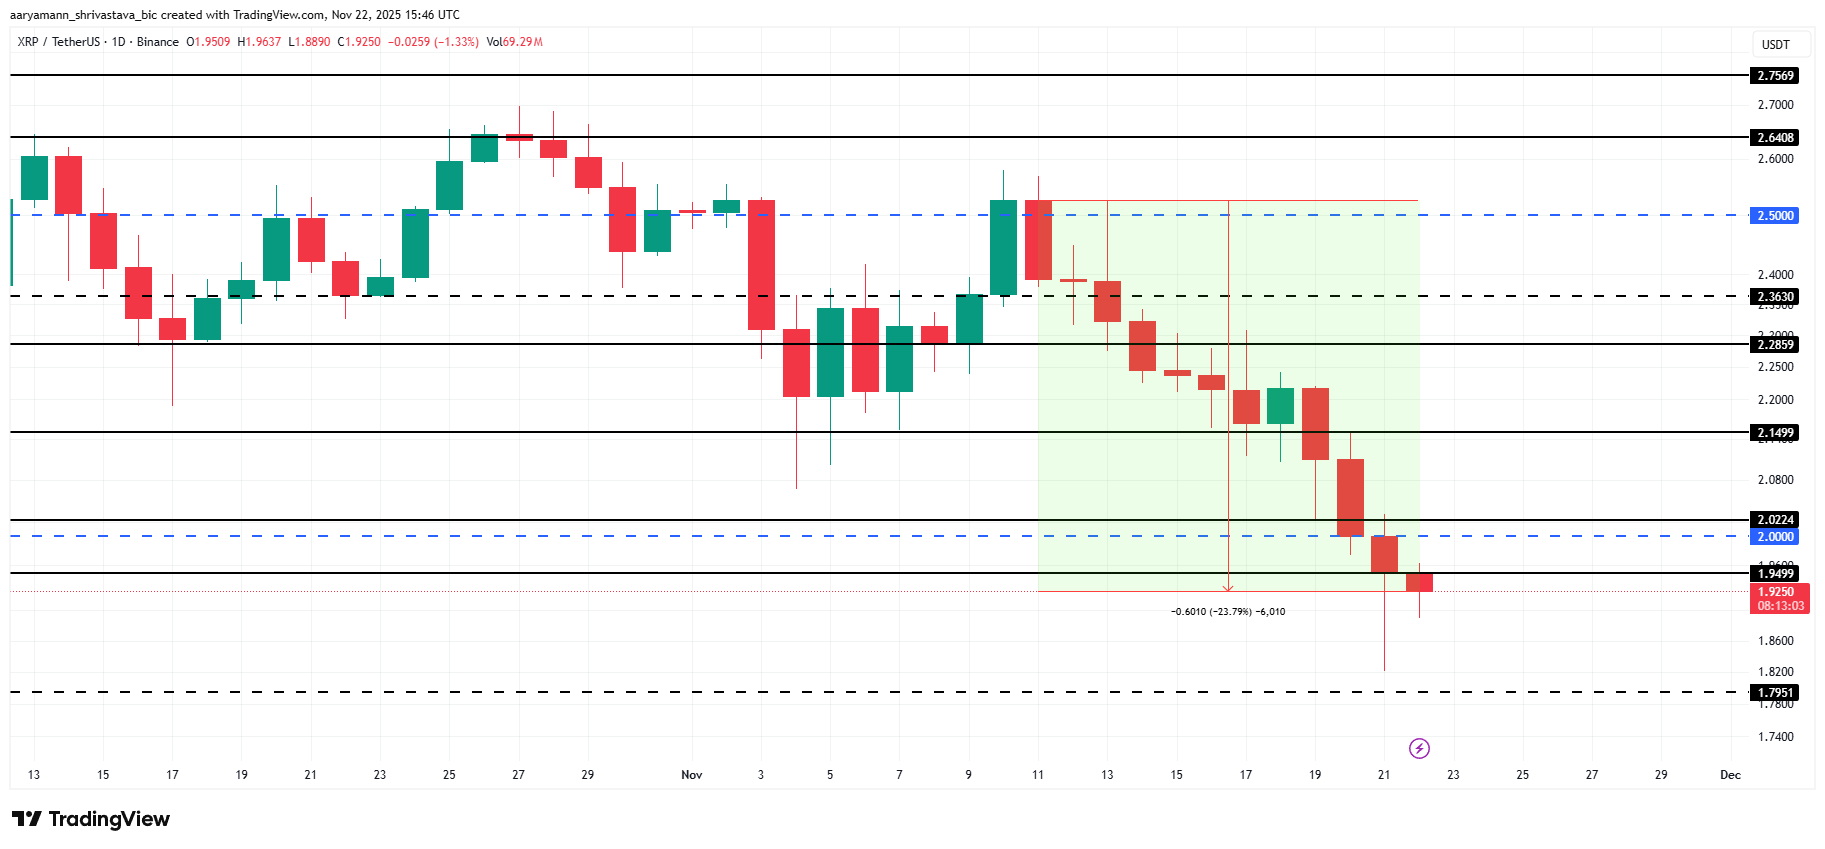
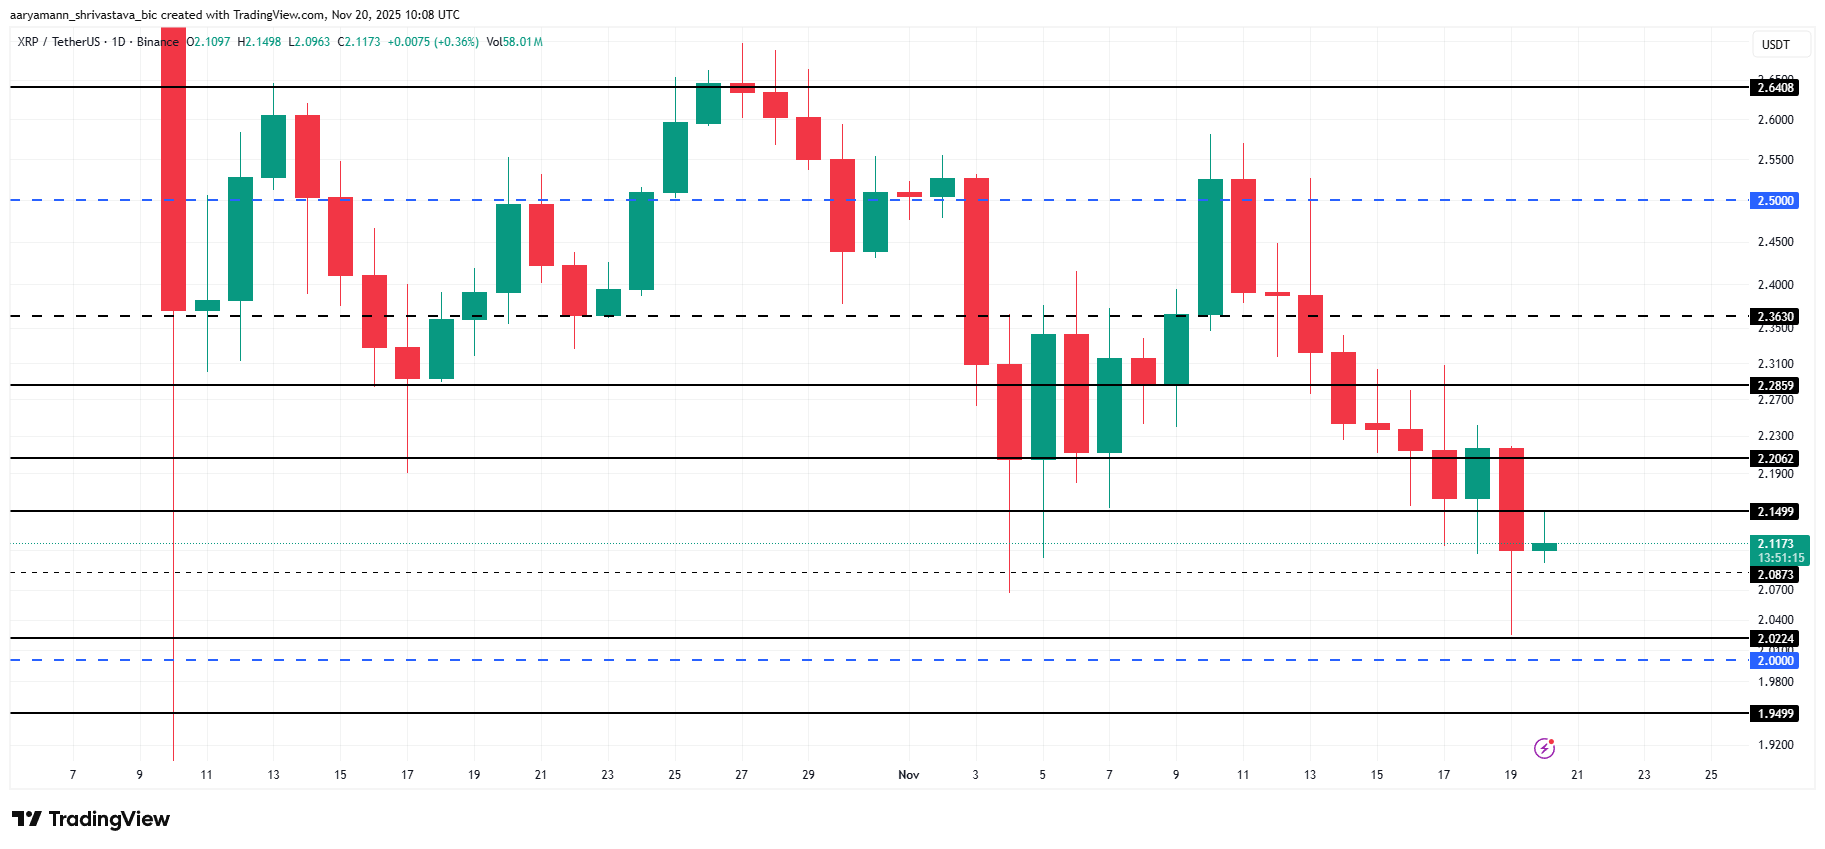
The price chart confirms this. The XRP price has repeatedly failed to hold above $1.96, and rebounds have stalled near the same area. If a bounce develops from current levels, this is where sellers are most likely to reappear.

For the rebound to become a genuine trend shift, the XRP price must post a clean daily close above $1.96. Without that confirmation, any upside move risks becoming another failed rally.

XRP Price Analysis
XRP Price Analysis: TradingView

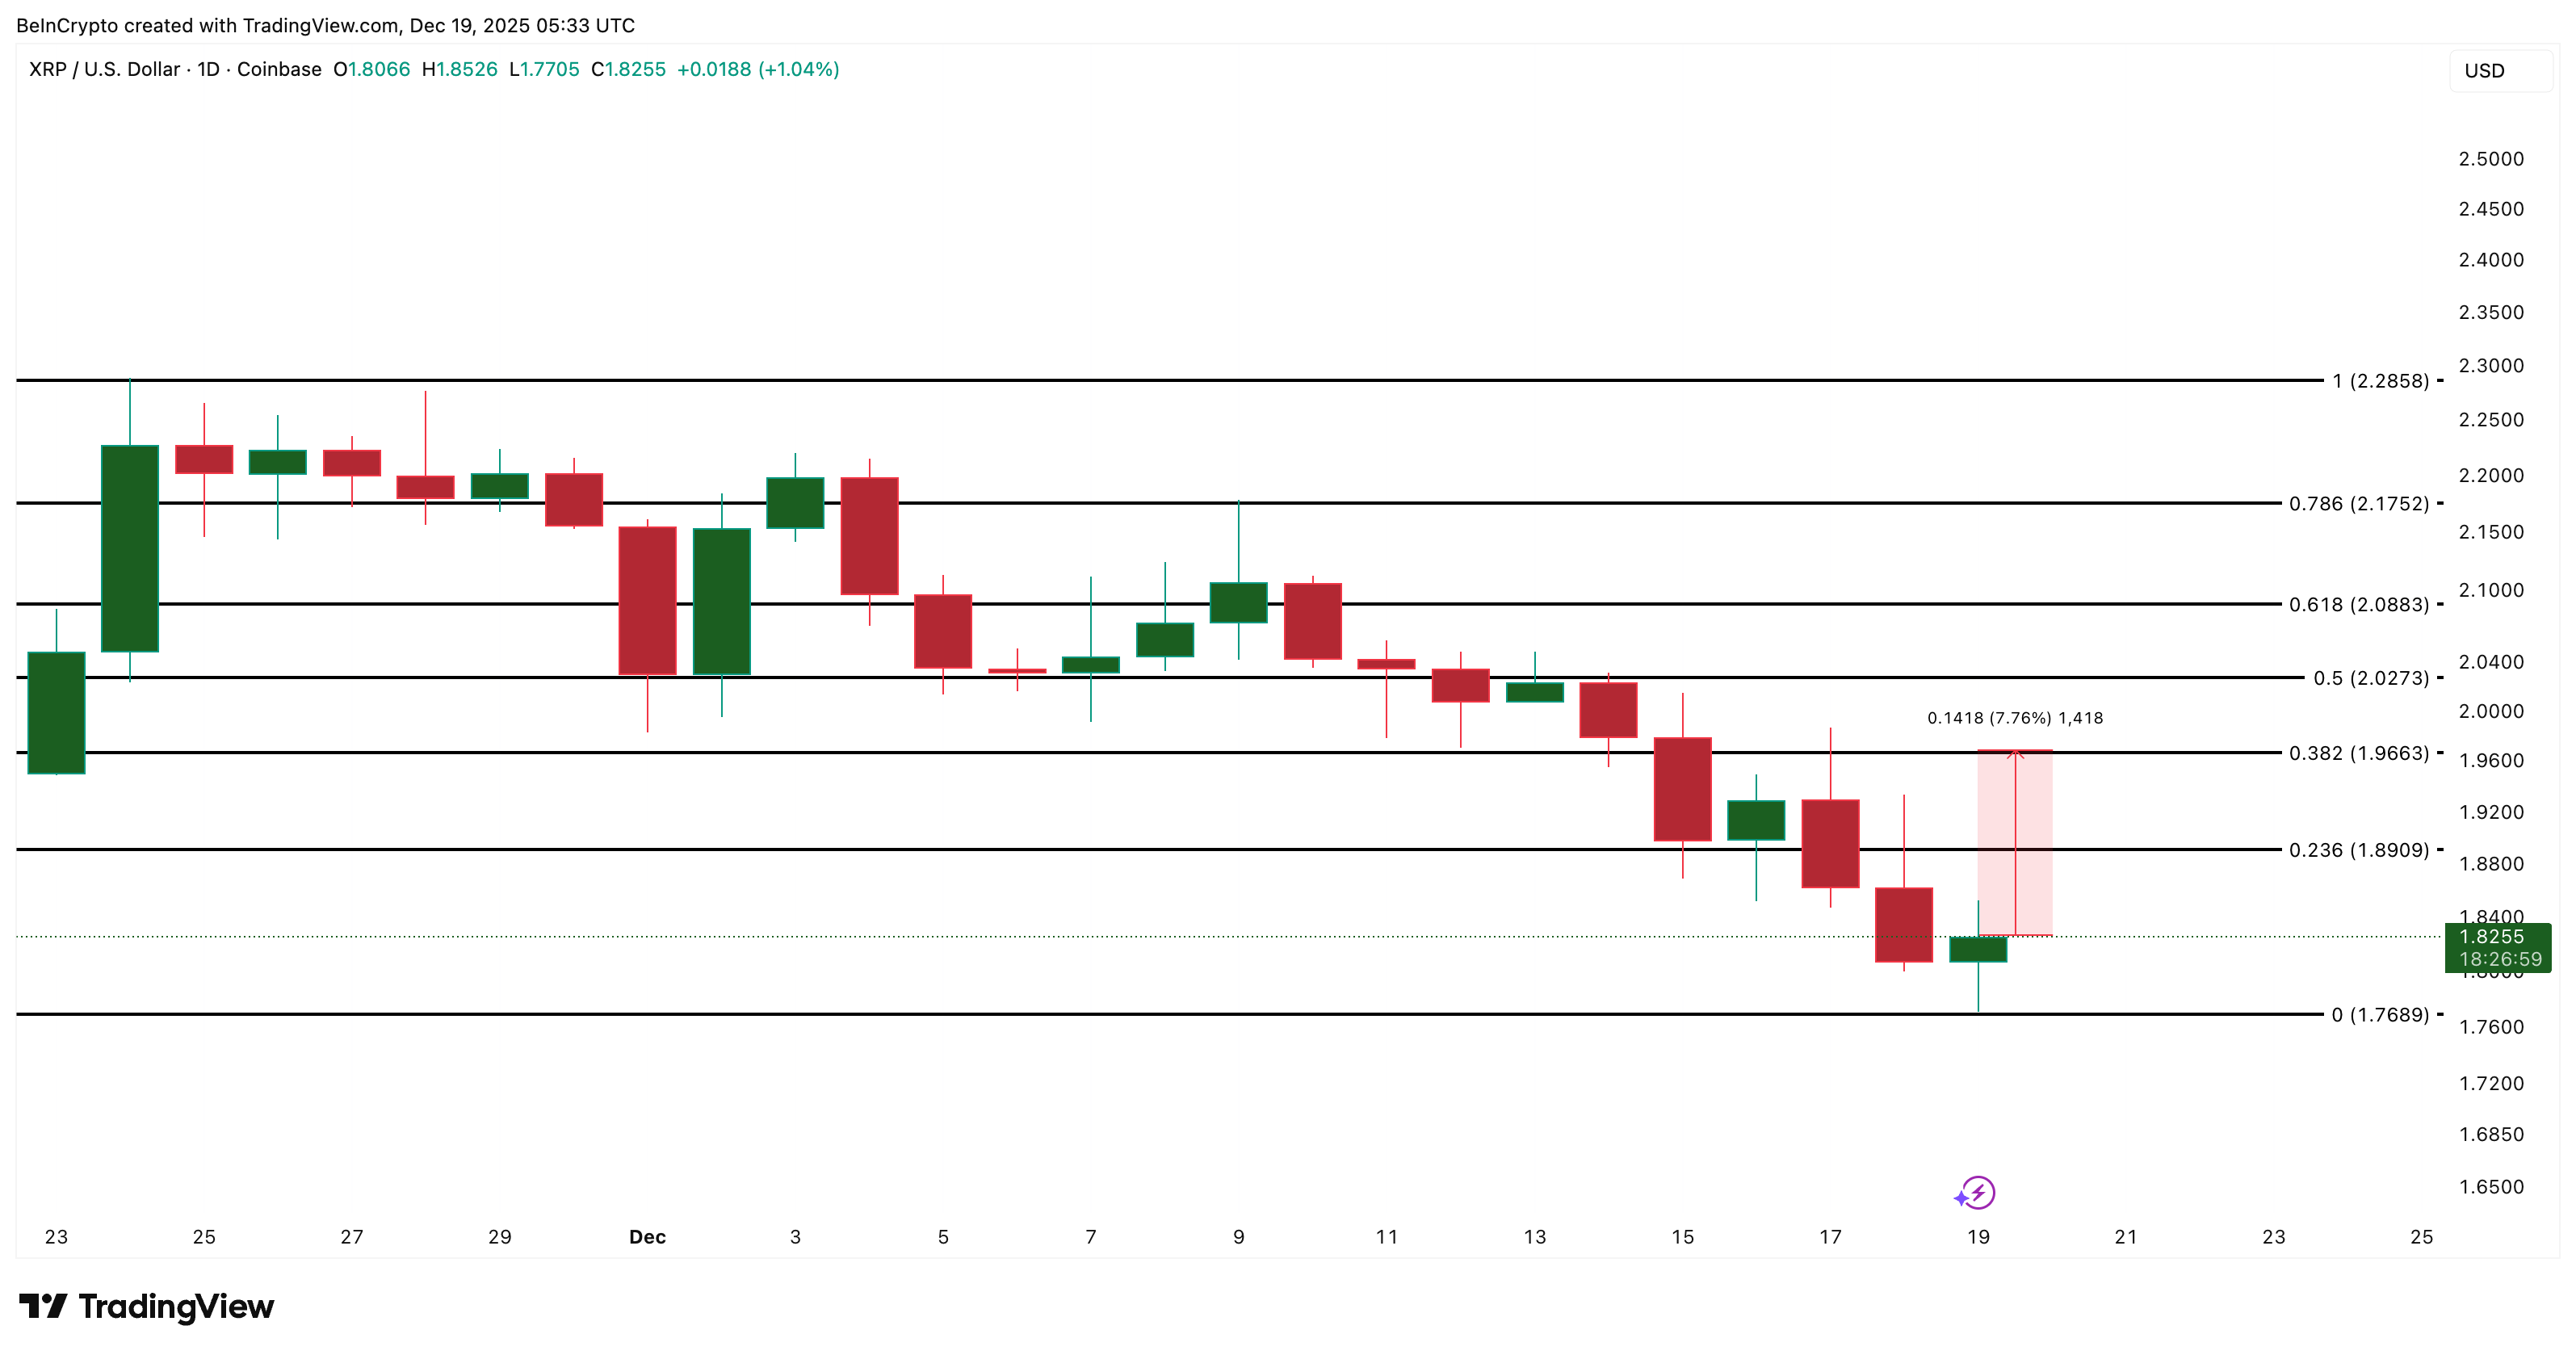
On the downside, $1.76 remains the key invalidation level. A break below it would suggest that seller control is returning, opening the door to deeper losses.

The takeaway is clear. Selling pressure has dropped sharply, and momentum is improving. But until XRP clears $1.96 with conviction, the market remains trapped between weakening sellers and a stubborn supply wall.

The post XRP Selling Pressure Collapses 39%, But This Price Level Still Controls the Outcome appeared first on BeInCrypto.

  •  

XRP Struggles Below $2.00 as Network Activity Remains Weak

XRP remains under pressure after extending its downtrend and slipping well below the $2.00 level. The pullback has dampened short-term momentum despite pockets of investor optimism. 

That confidence has yet to translate into stronger network activity, limiting XRP’s ability to stage a meaningful price recovery.

XRP Holders Are Doing Their Part

HODL Waves data shows growing conviction among longer-term XRP holders. Since the start of the month, wallets holding XRP for one to two years increased their supply share by 3%. This cohort now controls roughly 11% of circulating XRP.

The shift reflects mid-term holders maturing into long-term holders. Such behavior often signals confidence during periods of price weakness. These investors appear willing to endure volatility, anticipating a future recovery rather than reacting to short-term price swings.

However, this also indicates that the mid-term holders are underwater. Hence, they are forced to hold XRP tokens.

Want more token insights like this? Sign up for Editor Harsh Notariya’s Daily Crypto Newsletter here.

XRP HODL Waves
XRP HODL Waves. Source: Glassnode

Nonetheless, macro indicators suggest challenges persist. The network value to transactions ratio shows elevated readings. Rising NVT levels often suggest valuation is outpacing on-chain utility.

The indicator recently reached a three-month high, pointing to potential overheating. XRP’s transaction activity has not kept pace with market expectations. This imbalance weakens recovery attempts, as price advances lack confirmation from network usage and sustained demand.

XRP NVT Ratio
XRP NVT Ratio. Source: Glassnode

XRP Price May Be Safe From A Crash

XRP trades near $1.86 at the time of writing, remaining well below the $2.00 mark lost last week. The decline followed a failed attempt to break out of a month-long downtrend earlier this month. Momentum remains fragile under current conditions.

The token is holding above the $1.85 support level, which has been tested previously. XRP may consolidate below $1.94 if selling pressure eases. However, worsening sentiment could push the price toward $1.79, extending short-term losses.

XRP Price Analysis.
XRP Price Analysis. Source: TradingView

A recovery scenario depends on improving network activity and broader market stability. A break above $1.94 would be the first step toward reclaiming $2.00. Flipping $2.02 into support could drive XRP toward $2.20, invalidating the bearish trend.

The post XRP Struggles Below $2.00 as Network Activity Remains Weak appeared first on BeInCrypto.

  •  

One Critical XRP Price Level Surfaces — Holding It Could Trigger a 9% Bounce

XRP is trading near $1.99, down about 1% over the past 24 hours. Despite broader market volatility, it is only around 4% lower on the week, showing relative stability compared to many altcoins like ADA and BCH.

More importantly, the chart is flashing an early bullish reversal signal. The setup is not confirmed yet, but if one key level continues to hold, the odds of a short-term rebound, at least 9%, increase meaningfully.

Bullish Divergence Appears as the XRP Price Defends Key Support

XRP has formed a bullish divergence on the daily chart between December 1 and December 14. A bullish divergence happens when the price makes a lower low, but the Relative Strength Index (RSI) makes a higher low. RSI is a momentum indicator that measures buying and selling strength. When RSI improves while price weakens, it often signals that selling pressure is fading.

On the daily chart, a standard bullish divergence like this can lead to trend reversal — from bearish to bullish.

Yet, this divergence alone is not enough. It only matters if the XRP price holds support.

Bullish Divergence
Bullish Divergence: TradingView

Want more token insights like this? Sign up for Editor Harsh Notariya’s Daily Crypto Newsletter here.

That support sits near $1.97. XRP has repeatedly defended this zone, and on-chain data helps explain why.

The cost basis heatmap shows a dense cluster of XRP bought between roughly $1.97 and $1.98.

Strong Support Cluster: Glassnode

Around 1.79 billion XRP were accumulated in this range. A cost basis heatmap shows where large groups of holders bought their coins. When price trades near these levels, holders are less likely to sell at a loss, which strengthens support.

As long as XRP stays above $1.97, the bullish divergence theory remains valid, provided the RSI reading stays strong.

Why $2.17 Is the First Real Test for the Bulls

If support holds, XRP has room to move higher. The first upside target sits near $2.17, which is roughly a 9% move from current levels.

This level matters because the cost basis heatmap shows heavy supply between $2.16 and $2.17. About 1.36 billion XRP were acquired in this zone. That makes it a strong resistance area, where selling pressure is likely to appear.

XRP Price Can Face Resistance At This Level
XRP Price Can Face Resistance At This Level: Glassnode

If the XRP price pushes through $2.17 with a daily candle close, it could open the path toward $2.28, then $2.69, and eventually $3.10. Yet, those levels remain secondary for now and depend on broader market conditions.

The invalidation is clear. A daily close below $1.97 would weaken the reversal setup and expose downside toward $1.81 and $1.77.

XRP Price Analysis
XRP Price Analysis: TradingView

For now, the XRP price sits at a decision point. The bullish reversal signal is active, but only if the most important support level continues to hold.

The post One Critical XRP Price Level Surfaces — Holding It Could Trigger a 9% Bounce appeared first on BeInCrypto.

  •  

Largest XRP Whales Are Making a Move – Will Price Respond?

XRP price has rebounded from recent lows, rising nearly 4% from yesterday’s bottom and stabilizing after a modest pullback. While the broader trend remains cautious, a new metric suggests downside momentum may be fading.

With the XRP issuer recently moving closer to regulated-banking status, the focus now shifts to whether large holders continue to step in to confirm a real trend change.

Bullish Divergence Forms as Largest Whales Begin Adding

On the daily chart, the XRP price has flashed a bullish divergence between December 1 and December 12. During this period, price made a lower low, while the Relative Strength Index (RSI) formed a higher low. RSI measures momentum, and this pattern often appears when selling pressure weakens before a rebound.

Reversal Pattern Surfaces
Reversal Pattern Surfaces: TradingView

Want more token insights like this? Sign up for Editor Harsh Notariya’s Daily Crypto Newsletter here.

This setup has already triggered a bounce, but what makes it more compelling is whale behavior. The two largest XRP holder groups have already started responding.

Wallets holding more than 1 billion XRP increased their holdings from 25.36 billion on December 9 to 25.42 billion. At the same time, wallets holding between 100 million and 1 billion XRP reversed their selling trend, rising from 8.08 billion on December 11 to 8.15 billion at press time.

XRP Whales
XRP Whales: Santiment

In total, these two cohorts added roughly 130 million XRP. At the current price, that equals about $265 million in net accumulation. This confirms that the biggest holders are not just watching the divergence, they are acting on it.

The timing also matters. Ripple recently moved closer to securing a US banking license, reinforcing its long-term institutional narrative. That regulatory backdrop gives added weight to whale interest at these levels.

XRP Price Levels That Decide If the Reversal Holds

For the bullish divergence to stay valid, the XRP price needs follow-through. The first level that matters is $2.11. A daily close above it would mark a 3.72% move from current levels and confirm that buyers are regaining short-term control. XRP has not held above $2.11 since early December.

If that level breaks, the next resistance sits at $2.21. Only a sustained move above $2.21 would shift the structure bullish and reopen the path toward $2.58 or higher.

XRP Price Analysis
XRP Price Analysis: TradingView

On the downside, risk remains clearly defined. If the XRP price falls below $1.96 while RSI weakens, the bullish divergence would be invalidated. That scenario would expose $1.88 first, followed by $1.81 if selling accelerates.

Right now, the setup is constructive but unfinished. Momentum indicators show improvement, and whales have already responded once. For this reversal to fully play out, those large holders need to keep adding support, not just react briefly.

The post Largest XRP Whales Are Making a Move – Will Price Respond? appeared first on BeInCrypto.

  •  

XRP’s Breakout Faces Hurdles From $143 Million Whale Sell-Off

XRP price has fallen almost 10% over the past month despite a slight 1.5% gain this week. The price remains locked inside a $2.31–$1.98 range, failing to secure any meaningful breakout. This tension reflects a split in market behavior: whales are selling into strength while key holder groups continue accumulating.

The push and pull between these two sides is keeping the XRP price inside a falling wedge that has yet to confirm a bullish reversal.

Whales Trim While Key Holder Groups Resist the Pressure

Whale activity shows a clear shift toward caution.

Wallets holding 100 million–1 billion XRP cut their balances from 8.32 billion to 8.27 billion, starting December 7. Another group holding 10–100 million XRP reduced its supply from 11.01 billion to 10.99 billion on December 8. Together, they offloaded about 70 million XRP over the past 48 hours, worth roughly $143 million at the current price.

XRP Whales Sell
XRP Whales Sell: Santiment

Want more token insights like this? Sign up for Editor Harsh Notariya’s Daily Crypto Newsletter here.

The selling is not dramatic in token terms, but it arrives at a sensitive moment — exactly when XRP is trying to stabilize. This sell pressure helps explain why every breakout attempt has stalled before gaining momentum.

The counterforce comes from short- and mid-term holders, and this shows up clearly on HODL Waves. HODL Waves track how much XRP is held in each “coin age band,” showing how long tokens remain unmoved.

The one-to three-month group increased from 8.52% to 10.31%. The three-to six-month group rose from 9.40% to 10.87%.

Key Holders Keep Buying
Key Holders Keep Buying: Glassnode

These holders typically accumulate when they believe selling pressure is easing. Their buying into a 10% monthly decline suggests they expect the wedge structure to resolve to the upside eventually.

So XRP sits in a clear push-pull dynamic: whales selling on one side, active dip-buyers on the other.

That tension is holding the XRP price inside the same narrowing structure.

XRP Price Pattern Shows a Stalemate as Buyers and Sellers Pull in Opposite Directions

XRP is forming a falling wedge, a pattern that usually favors bullish reversals — but only if buyers can force a decisive breakout. Right now, the wedge is functioning more as a stalemate, with whale selling capping momentum and accumulating holders preventing deeper downside.

The breakout point sits near $2.46, where the descending trendline meets current price action. The XRP price needs a strong daily close above this level to confirm a reversal. If that happens, upside targets sit at $2.61, $2.83, and $3.11.

While price trades between $2.31 and $1.98, the wedge remains valid. A break below $1.98, however, weakens the pattern and exposes $1.82, a level that served as structural support earlier in the cycle.

XRP Price Analysis
XRP Price Analysis: TradingView

For now, the outlook is simple: Whale selling delays the breakout. Mid-term accumulation keeps the structure alive. The wedge will not resolve until one side overwhelms the other.

The post XRP’s Breakout Faces Hurdles From $143 Million Whale Sell-Off appeared first on BeInCrypto.

  •  

XRP Price Awaits Volatility Explosion That Could Save It From Slipping Below $2

XRP is struggling to recover as its price action continues to mirror Bitcoin’s weakness. The altcoin has failed to establish momentum over the last few days, pushing it closer to the critical $2.00 threshold. 

This correlation-driven decline has kept XRP from reclaiming key levels, raising concern among holders.

XRP Investors’ Losses Rise

The Net Unrealized Profit/Loss (NUPL) indicator highlights the growing pressure on XRP. NUPL recently slipped from the mildly bearish zone to below 0.25, entering the Fear zone for the first time in over a year. This signals that unrealized profits have significantly eroded, leaving many holders at or near losses.

This dip in sentiment may also act as a reversal trigger. Historically, NUPL falling into Fear has preceded periods of accumulation, as prices reach psychologically appealing levels. If investors interpret current conditions as oversold territory, XRP may benefit from renewed buy-side interest.

Want more token insights like this? Sign up for Editor Harsh Notariya’s Daily Crypto Newsletter here.

XRP NUPL
XRP NUPL. Source: Glassnode

XRP is also witnessing important macro shifts. The Squeeze Momentum Indicator shows a tightening squeeze that has been developing for nearly a month. A squeeze reflects a period of low volatility as pressure builds within the price structure, often leading to a strong directional breakout once it releases.

At present, the indicator suggests a potential tilt toward bullish momentum. If the squeeze resolves upward, XRP could experience a sharp volatility expansion, giving the asset the boost it needs to escape its recent stagnation.

XRP Squeeze Momentum Indicator
XRP Squeeze Momentum Indicator. Source: TradingView

XRP Price Needs To Escape

XRP is trading at $2.06 after two failed attempts to break the $2.20 resistance this week. The altcoin is now drifting toward the familiar $2.02 support level, which previously acted as a strong rebound point.

If XRP sees renewed investor confidence and a bounce from $2.02, the price could climb back to $2.20. A successful breakout above this resistance may open the door to $2.26, supported by the potential volatility surge indicated by the squeeze.

XRP Price Analysis.
XRP Price Analysis. Source: TradingView

However, a breakdown remains a risk. Losing the $2.02 support would place $2.00 in immediate danger. A fall below that threshold could push XRP toward $1.94 or even $1.85, invalidating the bullish outlook and signaling deeper correction potential.

The post XRP Price Awaits Volatility Explosion That Could Save It From Slipping Below $2 appeared first on BeInCrypto.

  •  

XRP Jumps 8% as Crypto Whales Scoop Up $1.3 Billion 

XRP is attempting a strong recovery after last week’s decline, with the altcoin posting an 8% rise in the past 24 hours. 

The broader market’s positive shift is helping XRP regain momentum, but the real catalyst appears to be renewed confidence from large investors. This surge in whale activity could position XRP for a retest of multi-week highs.

XRP Whales Rescue The Altcoin

Whale buying has intensified as XRP approached the $2.00 psychological level earlier this week. On-chain data shows that wallets holding between 100 million and 1 billion XRP collectively accumulated 620 million XRP in just a few days. At current prices, this accumulation is worth more than $1.36 billion. 

Such aggressive buying at discounted levels indicates that whales are positioning for a potential rebound and view the recent dip as a buying opportunity rather than a trend reversal. Their renewed confidence signals that the upside potential outweighs the short-term volatility.

Want more token insights like this? Sign up for Editor Harsh Notariya’s Daily Crypto Newsletter here.

Ethereum Whale Holding
Ethereum Whale Holding. Source: Santiment

The macro backdrop for XRP is also showing marked improvement. The HODLer Net Position Change — an indicator tracking movements among long-term holders — is flashing bullish for the first time since mid-October. The metric has shifted back into positive territory, signaling that LTHs have stopped selling and are once again accumulating. 

Support from long-term holders is critical for maintaining price floors during periods of market uncertainty. Their return provides XRP with a more stable base and reduces the likelihood of major downside moves, priming the asset for sustained recovery should broader market conditions remain favorable.

XRP HODLer Net Position Change
XRP HODLer Net Position Change. Source: Glassnode

XRP Price Has A Shot At Recovery

XRP is trading at $2.20 at the time of writing, up 8% in 24 hours after bouncing cleanly from the $2.00 intra-day low. The rebound from this key psychological level reinforces bullish sentiment and aligns with heavy whale accumulation.

Holding $2.20 as support places XRP in a strong position to target $2.36 next. If XRP manages to break this resistance, the altcoin could climb toward $2.50 and log its highest price in three weeks. Whale buying and LTH support make this scenario increasingly realistic.

XRP Price Analysis.
XRP Price Analysis. Source: TradingView

However, failure to maintain investor confidence could still introduce downside risk. If selling pressure increases, XRP may slip back to the $2.02 support level. This would invalidate the bullish setup and erase recent gains.

The post XRP Jumps 8% as Crypto Whales Scoop Up $1.3 Billion  appeared first on BeInCrypto.

  •  

What To Expect From XRP Price In December 2025

XRP price enters December after a weak November, with the token down nearly 13% for the month. December has often appeared strong on paper due to the 2017 outlier, but recent years have shown much tamer returns.

With ETF inflows rising, long-term holders selling, and XRP trading near a key resistance zone, traders want to know if December can offer a cleaner setup. This analysis looks at XRP’s seasonal history, on-chain behavior, and the levels that matter most.

December History And ETF Momentum For XRP: A Mixed Bag?

At first glance, December looks like a strong month for XRP, with an average gain of about 69.6%. But the median return is –3.16%, showing that the +818% surge in 2017 inflated the long-term average.

A more realistic comparison comes from recent years, with a gain of 6.94% in 2024 and 1.62% in 2023.

XRP Price History: CryptoRank

Want more token insights like this? Sign up for Editor Harsh Notariya’s Daily Crypto Newsletter here.

November 2025 has been weak. XRP is down almost 13%, which makes traders doubt whether the positive December seasonality still applies.

Ray Youssef, CEO of NoOnes, believes this December could behave differently because institutional demand is now active through ETFs. He told BeInCrypto:

“December is likely to look very different for XRP this year, mainly because institutional demand has now arrived… XRP enters the month on the back of the momentum generated from the ETF buzz, which has attracted substantial institutional interest and capital from the outset,” he said.

He also noted that XRP is already on a multi-day ETF inflow streak totaling more than $640 million and added:

“ETF inflow sustainability will now likely be the major tailwind for XRP’s price action in December,” he believes

ETF Data: SoSo Value

Youssef, however, still remains cautious. He warns:

“If the broader market environment weakens further and ETF flows reverse, XRP will likely follow BTC and ETH movements and retest $2”, he said.

Together, the mixed December history and the fresh ETF momentum show that XRP’s December depends heavily on whether institutional demand continues.

On-Chain Signals Aren’t The Most Bullish

XRP’s on-chain picture does not fully support a strong December yet. Long-term holders — especially those in the 1–3 year group — continue to reduce their balances.

This data comes from HODL Waves, which shows how supply is spread across different holding periods. Over the past month, the 1–2 year cohort dropped from 9.72% to 8.516%, and the 2–3 year cohort moved from 14.80% to 14.251%.

These changes may seem small, but they matter because these groups hold a significant share of the circulating supply. Their selling weakens any upside attempt.

XRP HODLers Selling
XRP HODLers Selling: Glassnode

Ray also warned about this behavior. He said:

“Long-term holders still control a disproportionate share of the circulating supply… XRP can record substantial gains in December only if institutional demand remains strong enough to offset any selling pressure from long-term holders,” he mentioned.

The cost basis heatmap reinforces the same risk. It shows the strongest supply cluster between $2.445 and $2.460, where about 1.749 billion XRP sits.

This is the exact area that has acted as resistance earlier. Even if ETF inflows remain strong, the XRP price still needs to break through this wall for a clean bullish trend to form.

XRP Price Heatmap
XRP Price Heatmap: Glassnode

Together, the long-term holder distribution and the heavy cost-basis cluster explain why the XRP price in December may need a significant push to gain momentum.

XRP Price In December: Key Levels And The Most Realistic Scenario

The XRP price trades near $2.196, just above the second rebound from $1.772. This forms a clear double-bottom structure — one bounce in October and another in late November.

The pattern supports a short-term recovery attempt, but XRP must clear $2.307 and then the key breakout level at $2.459. This level perfectly aligns with the cost basis heatmap clusters.

A clean daily close above $2.459 unlocks the next zone near $2.612. This lines up with the 0.618 Fibonacci level, the cost-basis cluster, and Ray Youssef’s own view. As he said:

“A more realistic target for December is $2.60. A clear breakout above $2.60 would be the first firm indication of a bullish shift,” he highlighted.

The technical and fundamental targets both sit at $2.60–$2.61.

XRP Price Analysis: TradingView

If ETF flows weaken and Bitcoin and Ethereum pull back, XRP can follow the broader market. Youssef noted:

“If BTC and ETH experience another downturn in December, XRP will likely follow suit,” he mentioned.

If that happens, the key zone to watch is $2.119. A close below it exposes the $1.772 support again.

At this point, the XRP price in December sits between two paths. Sustained ETF demand can drive a break above $2.459 and then $2.60–$2.61.

Without it, the XRP price is likely to remain tied to Bitcoin’s direction and revisit lower ranges.

The post What To Expect From XRP Price In December 2025 appeared first on BeInCrypto.

  •  

XRP Whales’ $4 Billion Sell-Off in November Is The Highest In 30 Days Since March 2023

XRP is attempting to recover this week, buoyed by renewed optimism following the launch of spot XRP ETFs. The increased attention has supported a modest rebound, yet the bullish momentum is under pressure. 

A wave of major whale selling throughout November is hindering XRP’s ability to regain strong upward traction, creating a critical turning point for the asset.

XRP Whales Break Record

Whale behavior has taken a sharply bearish turn. This month, large XRP holders registered their biggest single-month sell-off since March 2023.

Addresses holding between 1 million and 10 million XRP have collectively sold more than 2.20 billion XRP, valued at over $4.11 billion. Their cumulative holdings have fallen to 4.39 billion XRP, breaking a 32-month low.

This aggressive distribution highlights deepening concerns among high-value wallets. Many whales appear to be cutting exposure to avoid further losses, signaling that confidence remains fragile despite ETF-driven optimism. The scale of selling indicates that large holders are not yet convinced of a sustained recovery.

Want more token insights like this? Sign up for Editor Harsh Notariya’s Daily Crypto Newsletter here.

Ethereum Whale Holding
Ethereum Whale Holding. Source: Santiment

Broader macro indicators reinforce these concerns. XRP’s Net Unrealized Profit/Loss (NUPL) recently dipped below the 0.25 threshold, entering the “Fear” zone before bouncing back slightly. Historically, this level has produced two distinct outcomes.

If fear stabilizes and investors refrain from selling, prices often recover as profits gradually rebuild. However, if fear accelerates, capitulation typically follows, triggering steep declines.

Whether XRP stabilizes or weakens further depends heavily on investor behavior over the coming days. A decisive move toward $2.50 would signal growing confidence and reduce the risk of capitulation. Conversely, continued fear-driven selling could place downward pressure on the price, pushing XRP back into a vulnerable zone.

XRP NUPL
XRP NUPL. Source: Glassnode

XRP Price Is Far From Target

XRP is trading at $2.20, moving sideways below the $2.28 resistance. The newly launched ETFs are helping the asset hold above the crucial $2.14 support, but momentum remains muted.

If XRP fails to build on recent gains due to persistent whale distribution, consolidation between $2.28 and $2.14 is likely. A break below $2.14 could send the price toward $2.00 or lower, continuing the bearish trend.

XRP Price Analysis.
XRP Price Analysis. Source: TradingView

If selling subsidies and investors regain confidence, XRP may challenge the $2.28 barrier. A breakout above this level could propel the price to $2.36 and eventually toward $2.50. This would invalidate the bearish thesis and encourage renewed accumulation.

The post XRP Whales’ $4 Billion Sell-Off in November Is The Highest In 30 Days Since March 2023 appeared first on BeInCrypto.

  •  

XRP Whale Selling Hits $480 Million In 48 Hours As Price Falls Below $2

XRP has fallen below the key $2 psychological support level as bearish pressure intensifies across the broader market. The altcoin’s decline has accelerated over the past week, prompting significant selling from major holders. 

This shift in behavior from large investors has amplified downward momentum and weakened XRP’s short-term outlook.

XRP Whales Switch Their Stance

Whales have moved decisively from accumulation to heavy selling. Addresses holding between 10 million and 100 million XRP have dumped more than 250 million tokens in the past 48 hours alone, worth over $480 million.

This selling wave follows more than 20 consecutive days of accumulation by the same group of holders.

Such an abrupt shift signals a loss of conviction among large investors who had previously supported XRP’s rise. Their exit removes a crucial source of market strength and may prolong XRP’s decline. Without renewed confidence from whales, recovery momentum could weaken further and keep prices under pressure.

Want more token insights like this? Sign up for Editor Harsh Notariya’s Daily Crypto Newsletter here.

XRP Whale Holding
XRP Whale Holding. Source: Santiment

Macro indicators also highlight growing fragility. The MVRV Long/Short Difference has slipped below zero for the first time in five months, indicating that long-term holders have lost profitability. This shift pushes profit opportunity toward short-term holders, who tend to sell quickly once prices rise.

If XRP’s price rebounds even modestly, short-term holders may capitalize on their gains by selling, which could suppress upward movement. This dynamic often keeps volatility elevated and limits breakout potential. 

XRP MVRV Long/Short Difference
XRP MVRV Long/Short Difference. Source: Santiment

XRP Price May Need Support

XRP has fallen 23% over the past 11 days and trades at $1.92, sitting just under the $1.94 resistance level. The drop below $2.00 marks a significant psychological break and reinforces the current bearish sentiment across the market.

If whale selling accelerates and macro indicators worsen, XRP could fall further toward $1.79 or even lower. Such a move would deepen losses and extend the current downtrend as market sentiment weakens.

XRP Price Analysis.
XRP Price Analysis. Source: TradingView

However, if investor support stabilizes or broader market conditions improve, XRP may be able to reclaim $2.00 as support.

A successful recovery could lift the price toward $2.14 and higher, helping reverse recent losses and invalidating the bearish thesis.

The post XRP Whale Selling Hits $480 Million In 48 Hours As Price Falls Below $2 appeared first on BeInCrypto.

  •  

XRP Flashes a Bottoming Signal; Yet the Price Recovery Looks Delayed

The XRP price trades near $1.90, down about 9% over the past 24 hours and extending its 30-day decline to around 19%. A few bottoming signals have appeared, especially from short-term holders.

But the XRP price still looks far from a recovery. This piece explains why the bounce has not happened yet.

Short-Term Capitulation Has Appeared, but the Recovery Is Missing

The short-term holder NUPL, which measures net unrealized profit or loss, has dropped to –0.30, its lowest reading this year. This level marks capitulation, a phase where most recent buyers are holding losses and are either forced to exit or emotionally flushed out.

Earlier local XRP bottom signals like this have led to clean rebounds.

In April, NUPL fell to –0.13 and XRP bounced.

In June, NUPL fell to –0.15 and XRP bounced again.

Key Bottoming Signal
Key Bottoming Signal: Glassnode

Want more token insights like this? Sign up for Editor Harsh Notariya’s Daily Crypto Newsletter here.

This time, despite a deeper capitulation reading, XRP is still sliding. The missing element comes from the spent coins data.

Spent Coins Show Peak Capitulation Has Not Fully Played Out

The spent coins age band metric shows how many XRP coins from different age groups are being moved. When spent coins rise while price falls, it shows real capitulation pressure. This metric doesn’t only include the short-term holders and might also show how aggressively the long-term and mid-term holders are moving XRP.

A strong example came earlier this month.

Between November 2 and November 5, the price dropped from $2.54 to $2.15. During the same period, spent coins increased from 20.32 million to 104.85 million. This was a rise of about 416%, which marked a clear capitulation event. That ensured a local bottom formation on November 5.

XRP Coins Keep Moving During The Dip
XRP Coins Keep Moving During The Dip: Santiment

The current structure, coins moving while the price corrects, is similar but much smaller.

Between November 17 and now, the XRP price dropped from $2.27 to $1.96. Spent coins increased from 45.87 million to 97.31 million, a rise of about 112%.

Since 112% is far below the earlier 416% spike, the washout phase may not be complete. If spent coins continue rising toward early-November levels, the XRP price may see more downside before the final bottom forms.

This incomplete washout explains why the short-term capitulation reading has not triggered a recovery yet. And why some more XRP price downside could be waiting.

XRP Price Levels Suggest One More Downside Zone

XRP sits close $1.95, an important support. Losing this level exposes the next zone near $1.57, which could highlight the final XRP bottom if capitulation continues. The price is currently under the support, but for a breakdown confirmation, it needs a clean daily close under $1.95.

One more risk is building on the chart. The 100-day exponential moving average (EMA) is moving closer to the 200-day average. If the 100 moves below the 200, traders treat it as a bearish crossover. And that could be a bigger short-term correction catalyst.

XRP Price Analysis: TradingView

An exponential moving average (EMA) gives more weight to recent prices, so it reacts faster than a simple moving average and helps confirm short-term pressure.

For the XRP price to show early strength, it must first reclaim $2.08, followed by $2.26. That would invalidate the near-term bearish trend.

The post XRP Flashes a Bottoming Signal; Yet the Price Recovery Looks Delayed appeared first on BeInCrypto.

  •  

Bitwise XRP ETF Goes Live, Up Next Grayscale; Yet Price Crashes 5%

XRP has fallen 5% this week as its ongoing decline continues despite growing institutional interest. The altcoin is struggling to recover, even with two XRP ETFs already live and two more scheduled to launch next week. 

This disconnect has raised questions about why price action remains soft.

XRP Whales Are Selling

Whale activity offers the clearest explanation for the weakness. Large holders have continued selling throughout the week, adding downward pressure on XRP. In the last 48 hours alone, wallets holding between 1 million and 10 million XRP have sold more than 250 million tokens, worth over $528 million.

Whales remain highly influential due to their ability to shift liquidity and sentiment. Sustained selling from these holders signals a lack of confidence in the near-term outlook. If the selling continues, it could deepen XRP’s decline, especially as the price approaches key support levels.

Want more token insights like this? Sign up for Editor Harsh Notariya’s Daily Crypto Newsletter here.

XRP Whale Holding
XRP Whale Holding. Source: Santiment

Macro momentum, however, paints a more nuanced picture. New XRP addresses have surged over the past week, climbing to a monthly high. This rise appears linked to the launch of Caanary Capital’s ETF (XRPC) and Bitwise’s ETF (XRP), both of which are driving renewed participation in the network.

Additional inflows are expected as Grayscale’s XRP Trust ETF (GXRP) and Franklin Templeton’s XRP ETF (XRPZ) go live on Monday. These launches are likely encouraging new users to enter the market, providing a counterweight to whale selling and offering potential support for future price stability.

XRP New Addresses
XRP New Addresses. Source: Glassnode

XRP Price Continues To Fall

XRP trades at $2.11 at the time of writing, maintaining support at $2.08. The asset is marking a monthly low and facing mixed sentiment due to conflicting signals from whales and new entrants. Price stability will depend on whether fresh capital outweighs ongoing sell-offs.

If inflows from new addresses continue, they may offset the recent whale selling. This could help XRP rebound above $2.20 and push toward $2.28. ETF-driven demand has the potential to restore short-term momentum and encourage accumulation.

XRP Price Analysis.
XRP Price Analysis. Source: TradingView

If XRP breaks below the $2.08 support, the downside risk increases. The price could fall to $2.02 or slip below $2.00 if selling intensifies. Such a decline would invalidate the bullish thesis and reflect a deeper shift in market sentiment.

The post Bitwise XRP ETF Goes Live, Up Next Grayscale; Yet Price Crashes 5% appeared first on BeInCrypto.

  •  

Selling Pressure Jumps 48% as XRP Sits on a Fragile Floor — What’s Next For The Price?

XRP price trades near $2.15 today after dropping over 18% since November 10. The token has spent the past month moving inside a bearish channel. And the latest structure now shows weakening volume, rising long-term selling, and the price sitting close to a key support.

If buyers fail to defend one level, the XRP price could slide into a deeper leg of its downtrend.

Falling Channel and Volume Breakdown Strengthen the Bearish Setup

XRP continues to move inside a descending channel that has guided every bounce and rejection for more than a month. This pattern is a bearish continuation structure, and the recent candles show that each recovery attempt is getting weaker.

This weakness is most visible in the On-Balance Volume (OBV) indicator. OBV adds volume on green days and subtracts it on red days to show whether buying or selling pressure is dominating. Between November 4 and 9, OBV briefly moved above the descending trend line connecting its lower highs. The XRP price responded with a quick short-term bounce.

Weak Buying Affecting XRP Price
Weak Buying Affecting XRP Price: TradingView

Want more token insights like this? Sign up for Editor Harsh Notariya’s Daily Crypto Newsletter here.

But once OBV slipped back below the trend line on November 12, the tone changed. The indicator has stayed below that trend line since, showing that market-wide buying pressure has continued to weaken. This aligns perfectly with the price action: XRP began its 18.6% decline on November 10, the same window in which OBV started curling downward again.

The lack of volume strength means buyers are not stepping in with conviction. That sets the stage for the next metric.

Long-Term Holders Are Increasing Their Selling

Glassnode’s Hodler Net Position Change tracks how much long-term holder supply is entering or leaving exchanges and wallets. It is one of the clearest measures of long-term conviction.

Over the past few days, long-term holders have sharply increased their selling again after dipping to the lowest fortnightly level on November 16:

  • Nov 16: –63.57 million XRP
  • Nov 18: –94.50 million XRP

Now, that’s a 48.6% rise in long-term outflows in just two days.

Hodlers Keep Selling
Hodlers Keep Selling: Glassnode

This confirms that the pressure shown on OBV is not random noise. It comes at the same time that long-term holders are reducing their positions more aggressively. When long-term seller activity rises while volume weakens, it typically signals a market that has not found its bottom yet. And that view keeps every nearby support level at risk.

Together, OBV and Hodler Net Position Change point to the same idea: buyers are not absorbing the increased selling pressure.

XRP Price Levels That Matter Most

The XRP price now sits close to the most important support on the chart: $2.10. This level has acted as a reaction zone multiple times inside the falling channel. If the daily candle closes below $2.10, XRP could extend its move toward $1.77, the long-term channel floor.

On the upside, the level that must be reclaimed to invalidate this bearish setup is $2.41. Clearing $2.41 would show that buyers have regained strength and would open the path toward $2.58. Only a daily close above $2.58 would flip the short-term trend back to bullish.

XRP Price Analysis
XRP Price Analysis: TradingView

Right now, the structure still leans negative. Volume is weakening. Long-term holders are selling faster. And the XRP price remains inside a falling channel. Unless XRP reclaims $2.41, all eyes stay on $2.10. This fragile floor decides whether XRP stabilizes or enters a deeper slide.

The post Selling Pressure Jumps 48% as XRP Sits on a Fragile Floor — What’s Next For The Price? appeared first on BeInCrypto.

  •  

XRP Dip Buyers Are Active — So Why Is the Price Still Falling?

XRP price is down almost 8% in the past week, and even though the last 24 hours have been flat, the absence of red cannot be mistaken for strength.

The chart and on-chain data indicate that XRP is under real pressure, despite one group of investors continuing to buy the dip.


Short-Term Holders Keep Buying — But One Group Doesn’t Agree

HODL Waves — a metric that shows how much supply each holding-duration group controls — reveals that two short-term cohorts have been steadily accumulating XRP through the month.

On October 16, wallets holding XRP for 1–3 months controlled 8.94% of supply. As of November 14, they hold 9.17%.

Another short-term cohort, the 1-week to 1-month group, has increased from 3.74% to 5.53% of the supply in the same period.

Dip Buying Remains Active
Dip Buying Remains Active: Glassnode

Want more token insights like this? Sign up for Editor Harsh Notariya’s Daily Crypto Newsletter here.

Despite the XRP price dropping 7.8% over the past 30 days, these groups are accumulating, likely positioning for short-term bounces.

But this buying doesn’t seem strong enough to lift the price for one key reason.

The Hodler Net Position Change — a metric that tracks the amount of long-term investor supply entering or leaving wallets — indicates that long-term holders are selling aggressively. It showed heavy negative flow on November 3, when long-term wallets removed 102.50 million XRP. Instead of easing, outflows continued to rise.

XRP HODLers Keep Selling
XRP HODLers Keep Selling: Glassnode

By November 14, the number had jumped to 181.50 million XRP: a 77% increase in long-term selling pressure in less than two weeks.

This is the core reason the XRP price was unable to bounce: short-term buying is being overwhelmed by long-term exits.


XRP Price Feels the Pressure as Big Money Steps Back

On the chart, XRP is still struggling to break above $2.26, a strong 0.618 Fibonacci resistance level. The push higher is weakening because money inflows are fading rapidly.

The Chaikin Money Flow (CMF) — which measures buying and selling pressure — has plunged since November 10. It now sits at –0.15, showing net outflows. CMF has also broken below a descending trendline, indicating that larger investors are withdrawing rather than adding. When CMF stays negative while breaking trend support, upside attempts usually fail.

XRP Price Analysis
XRP Price Analysis: TradingView

If weakness continues, XRP risks losing $2.17, exposing a deeper move toward $2.06. A breakdown below $2.06 would invalidate any short-term bullish attempts.

The only way to regain momentum is a clean daily close above $2.38 — a level that has rejected the price multiple times this month. Clearing it could open a path toward $2.57 and flip the near-term structure bullish.

The post XRP Dip Buyers Are Active — So Why Is the Price Still Falling? appeared first on BeInCrypto.

  •  

XRP Price Prediction 2025: Where Could XRP Land Before The Year Ends?

XRP is trading sideways after a volatile stretch that mirrored its Q3 movement. The altcoin has held within a narrow range despite increased market activity. 

Historical patterns now suggest a potential shift, as XRP once again displays signs commonly seen before stronger Q4 performances.

XRP Is Mirroring Its Past In Many Ways

Q4 has historically been one of the strongest periods for XRP. Over the past 12 years, the token’s average Q4 return stands at 134%. While such gains are unlikely to repeat in the coming weeks, the trend highlights the asset’s long-term seasonal strength and signals conditions that often precede bullish reversals.

This historical resilience positions XRP as one of the few major cryptocurrencies that consistently benefits from year-end momentum. 

Want more token insights like this? Sign up for Editor Harsh Notariya’s Daily Crypto Newsletter here.

XRP Quarterly Returns.
XRP Quarterly Returns. Source: CryptoRank

Unrealized losses are rising again, creating conditions that have previously triggered strong rebounds. Investors often push prices higher when losses spike, driven by the incentive to recover value. The same behavior was observed in November 2024, April 2025, and June 2025, each followed by a clear move upward.

If this pattern repeats, XRP may be positioned for a recovery fueled by renewed buying pressure. The recent uptick in unrealized losses suggests growing tension in the market, which historically precedes breakouts as investors attempt to regain profitability.

XRP Relative Unrealized Loss
XRP Relative Unrealized Loss. Source: Glassnode

The MVRV Long/Short Difference is dipping toward the neutral zone. This indicates long-term holders are seeing reduced profits, often a precursor to a shift in short-term holder behavior. A drop below neutral would signal rising short-term gains, which may lead to brief selling as traders lock in profits.

After this phase, the indicator typically climbs back into positive territory. When long-term holder profits rise again, XRP has often followed with upward price action. This dynamic suggests a possible setup for stronger gains if the market aligns with previous cycles.

XRP MVRV Long/Short Difference
XRP MVRV Long/Short Difference. Source: Santiment

XRP Price Awaits A Trigger

XRP trades at $2.29 after moving sideways for several weeks following a 22% drop in October. The consolidation reflects market caution but also shows resilience as buyers continue to defend key levels through short-term uncertainty.

The current indicators suggest a bullish outlook that supports a move above $2.50, a crucial psychological zone. Clearing this level may allow XRP to break past $2.64 and potentially reach $3.02, helping the token recover October’s losses.

XRP Price Analysis.
XRP Price Analysis. Source: TradingView

However, XRP has been in sideways movement for 34 days, similar to late July after another 22% crash. If history repeats, XRP may continue ranging between $2.20 and $2.50, delaying any major breakout until stronger momentum emerges.

The post XRP Price Prediction 2025: Where Could XRP Land Before The Year Ends? appeared first on BeInCrypto.

  •