Japan Tightens, America Eases: Which Central Bank Really Moves Markets Now? | US Crypto News
Welcome to the US Crypto News Morning Briefing—your essential rundown of the most important developments in crypto for the day ahead.
Grab a coffee because today’s Morning Briefing isn’t just about interest rates. It’s about leverage, funding, and which side of the Pacific really sets the rhythm for risk assets when the policy paths split. As one central bank eases (the US), the other tightens (Japan). The tension between the two is beginning to reshape global liquidity in ways that don’t show up in a single chart or price candle.
Crypto News of the Day: Japan Raises Interest Rates, But the Fed Cuts, Which Side Has A Stronger Impact?
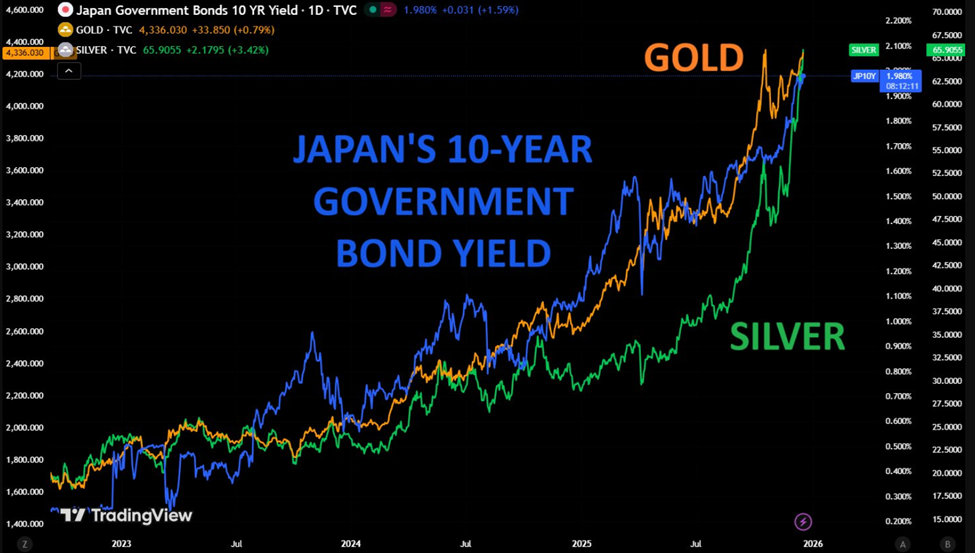
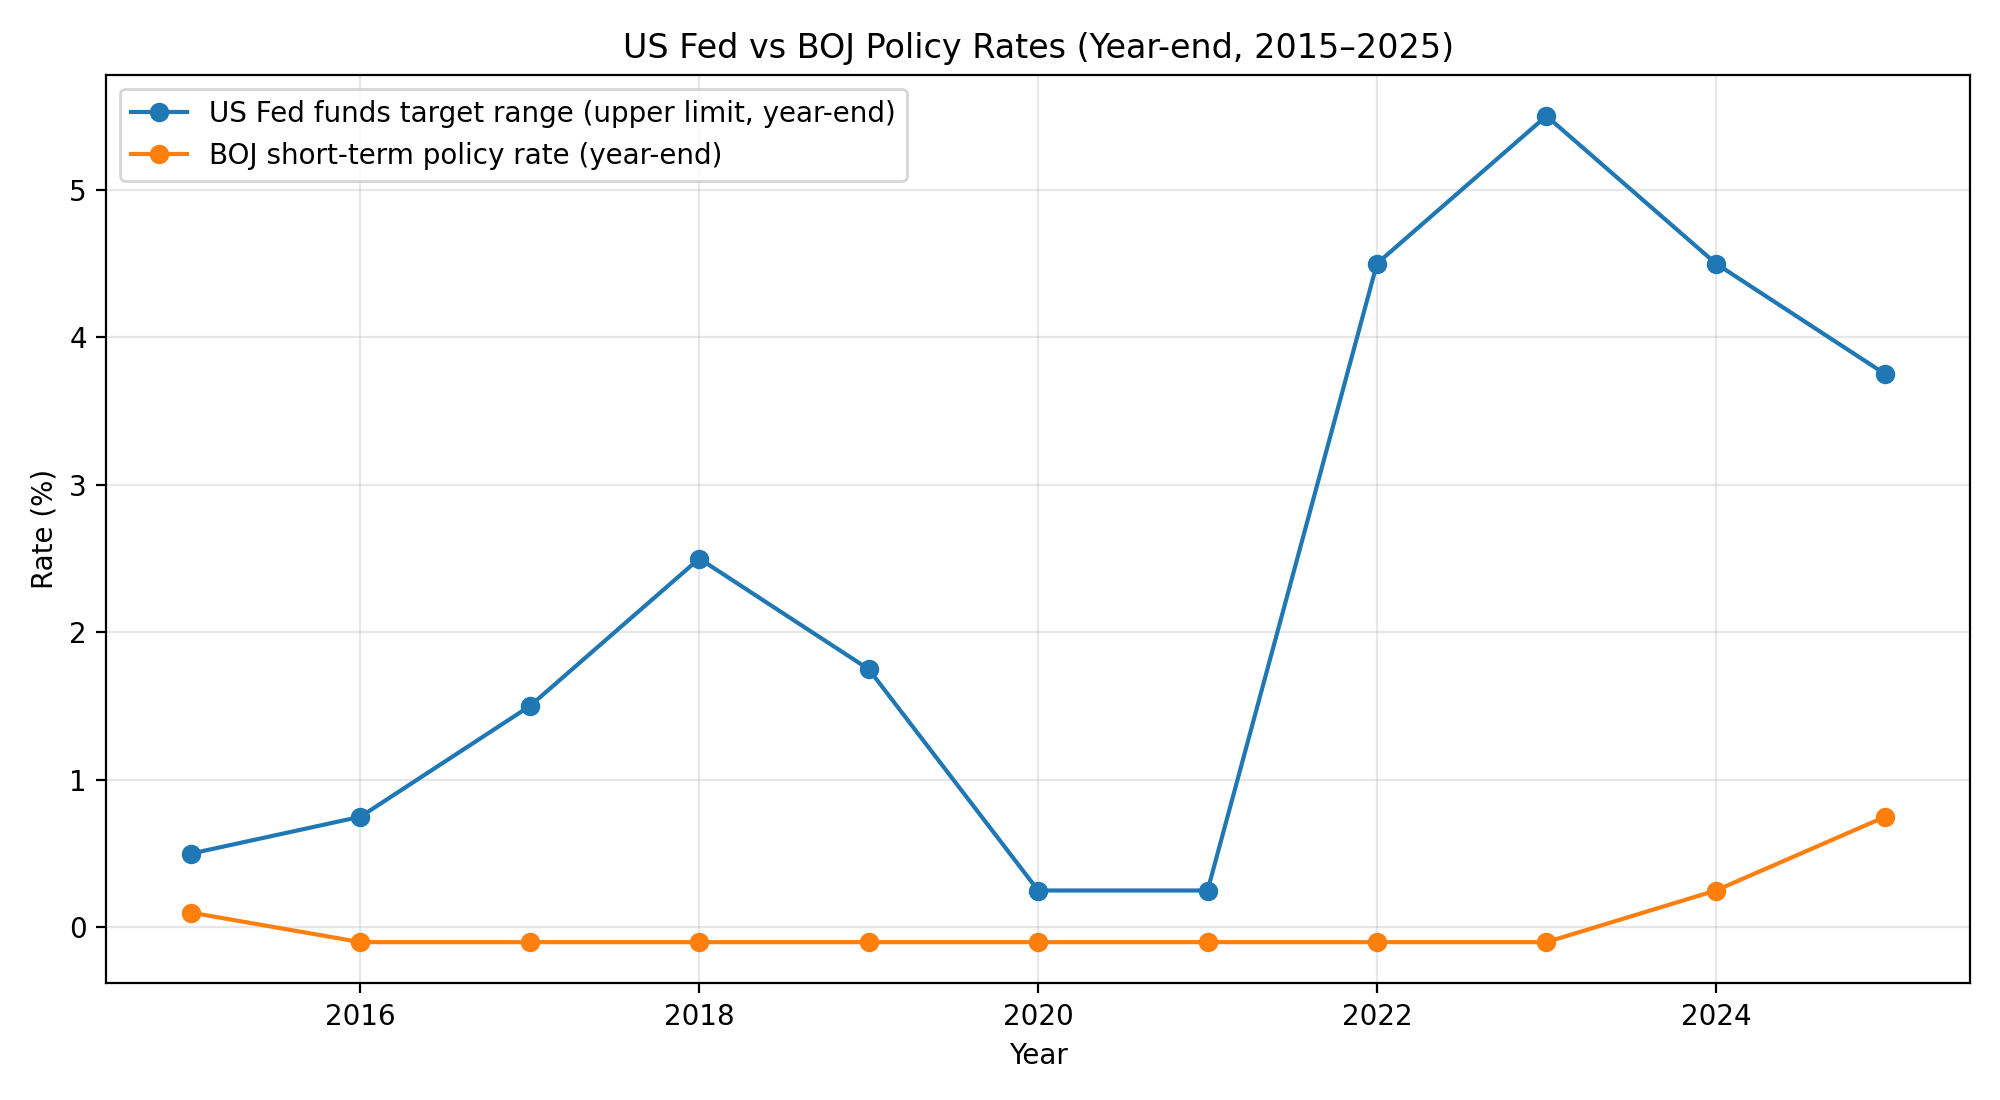
Global markets are at an impasse, amid a rare and consequential policy divergence. On the one hand, the US Federal Reserve has begun cutting interest rates to support slowing growth. In contrast, the Bank of Japan (BOJ) is moving in the opposite direction, raising rates to levels not seen in three decades.
The question facing investors is no longer whether these moves matter, but which one ultimately carries more weight for global liquidity, currencies, and crypto markets.
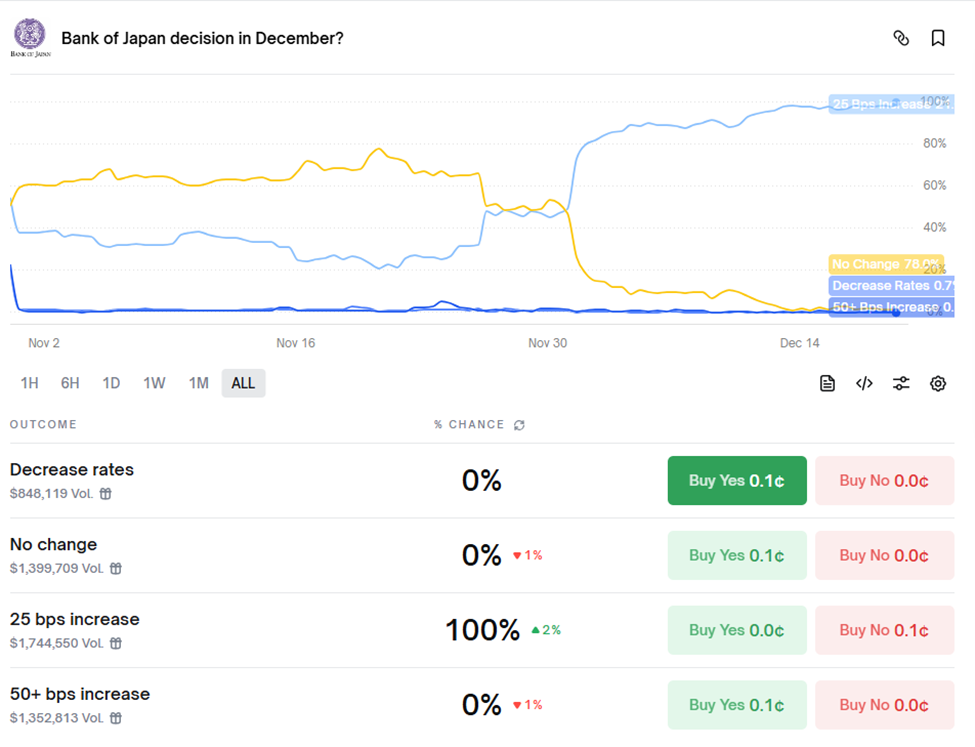
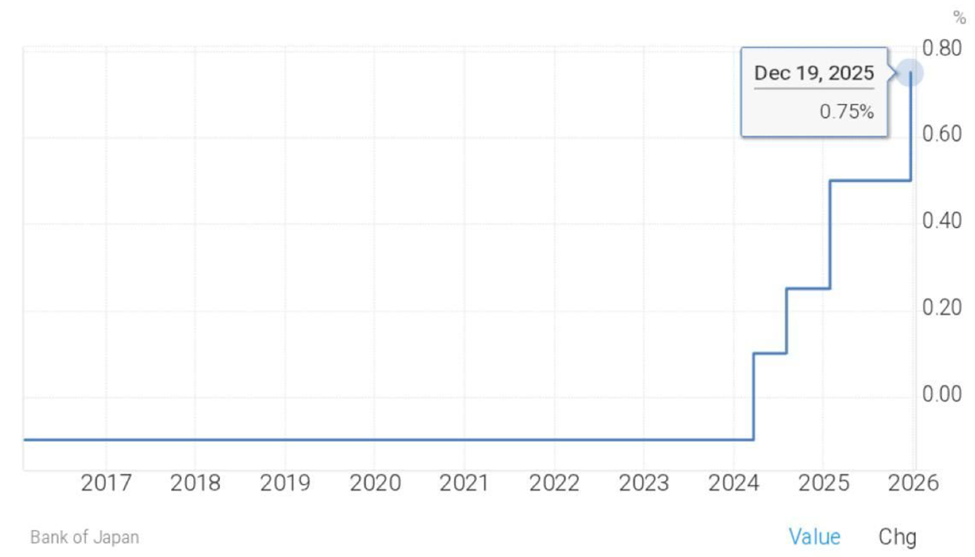
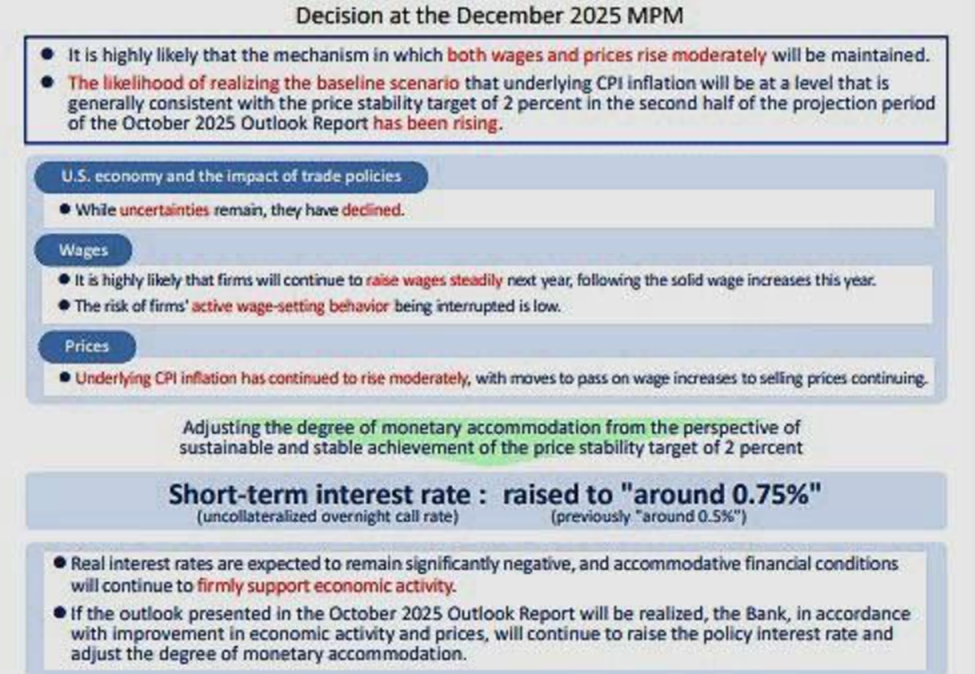
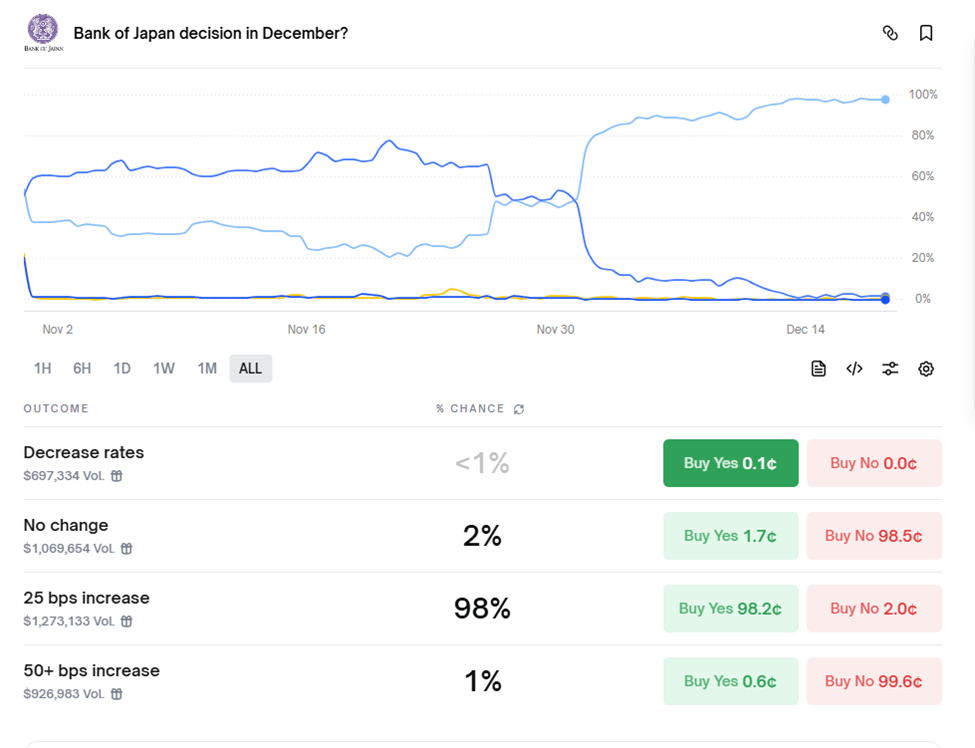
On December 19, the BOJ raised its policy rate by 25 basis points to 0.75%, the highest level since 1995. This marks another step away from decades of ultra-loose monetary policy. Macro analysts see the move as more than a routine adjustment.
🚨 BREAKING: 🇯🇵 BOJ DELIVERS THE HIKE
— Wise Advice (@wiseadvicesumit) December 19, 2025
Rates raised 25 bps to 0.75%, marking a 30-year high.
Japan’s era of ultra-easy money keeps fading.
This is a major global LIQUIDITY shift… watch yen and risk assets closely. 👀 pic.twitter.com/vfciRH84WJ
Unlike the Federal Reserve’s rate cuts, which are cyclical and designed to smooth economic slowdowns, Japan’s tightening is structural. For nearly 30 years, near-zero Japanese rates anchored one of the world’s most important sources of cheap leverage.
Even modest increases now carry outsized consequences because they disrupt funding strategies deeply embedded across global markets.
The immediate impact was most visible in currency markets. Despite the historic hike, the yen initially weakened as Governor Kazuo Ueda offered limited clarity on the pace of future tightening.
Reuters noted that the currency slipped as the BOJ “stays vague on tightening path.” This highlights how forward guidance, not just the hike itself, remains critical.
Still, analysts argue the real transmission channel lies elsewhere: the yen carry trade, as reported in a recent US Crypto News publication.
As Japanese yields rise and the US–Japan rate gap narrows, borrowing yen to fund higher-yielding positions becomes increasingly expensive.
Fed cut rates, but the message mattered more than the cut. Their dot plot now shows fewer cuts ahead. That flipped expectations from “easy money coming” to “higher for longer.” At the same time, BOJ hike expectations strengthened the yen → yen carry trades started unwinding →… pic.twitter.com/eSaJLWQajg
— Dmytro V7 🇺🇦 (@V7Dmytro) December 16, 2025
This is where the divergence between Tokyo and Washington becomes critical:
- Fed cuts tend to support markets gradually by easing credit conditions.
- BOJ tightening, by contrast, forces immediate repositioning as leverage costs rise.
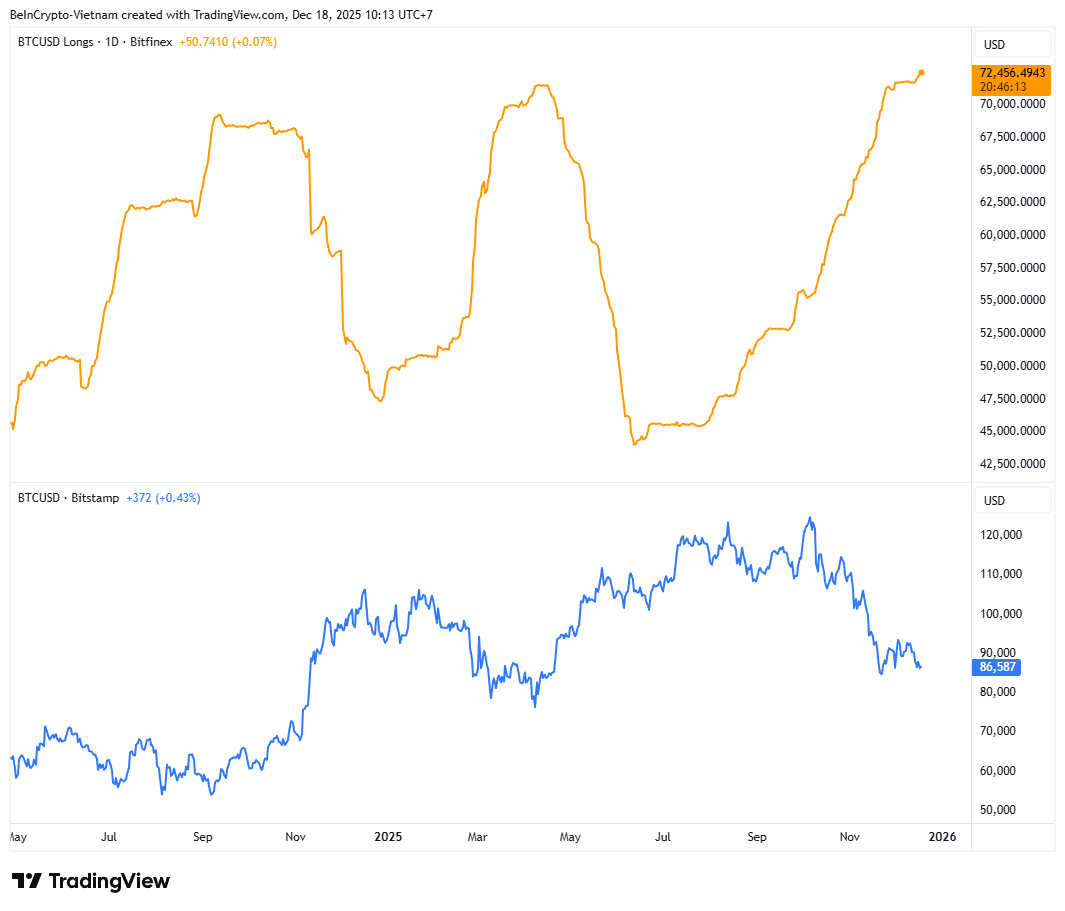
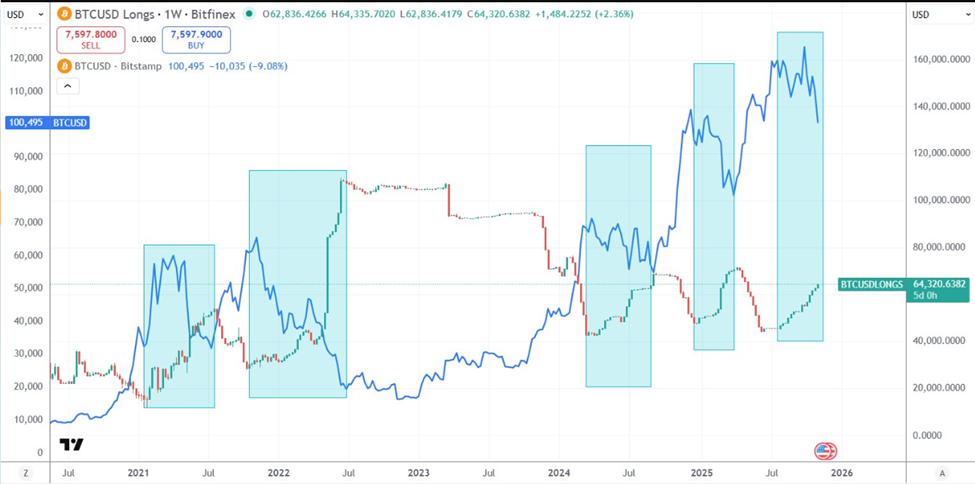
Crypto markets have historically experienced this impact more quickly than traditional assets. Previous BOJ tightening cycles coincided with sharp Bitcoin drawdowns of 20–30% as liquidity tightened and carry trades unwound.
THE BANK OF JAPAN MIGHT BE BITCOIN’S BIGGEST ENEMY
— Merlijn The Trader (@MerlijnTrader) December 14, 2025
Japan holds the most US debt.
Every time they hike, Bitcoin bleeds:
March 2024: -23%
July 2024: -30%
Jan 2025: -31%
Next hike: Dec 19
Next move: loading…
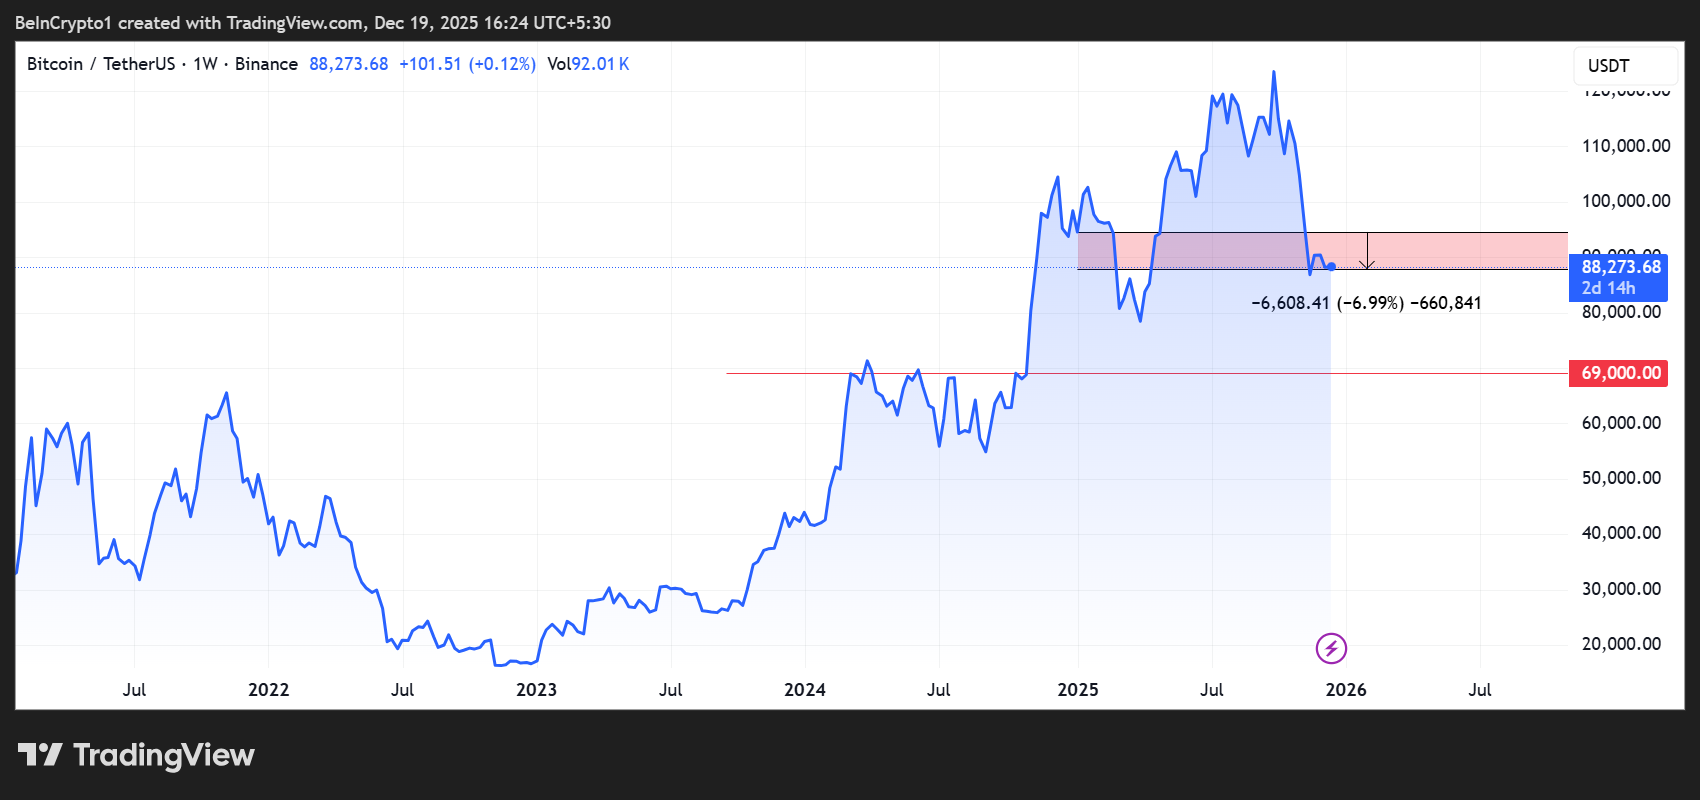
If the pattern repeats, $70K is in play. pic.twitter.com/R5916R702I
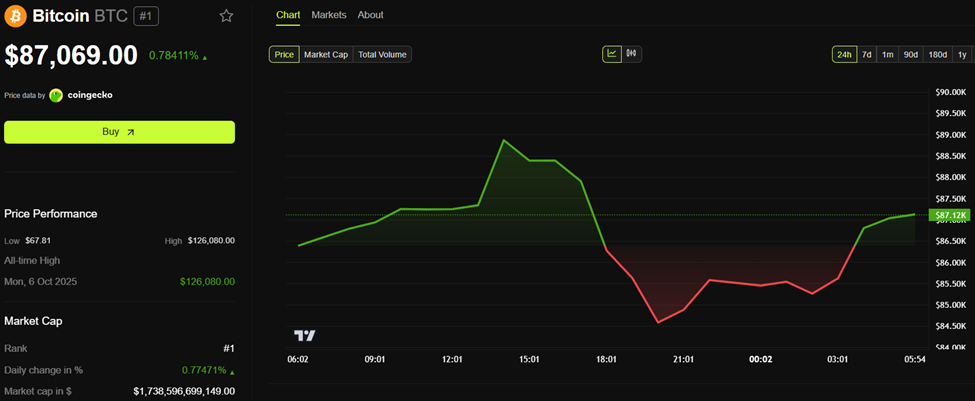
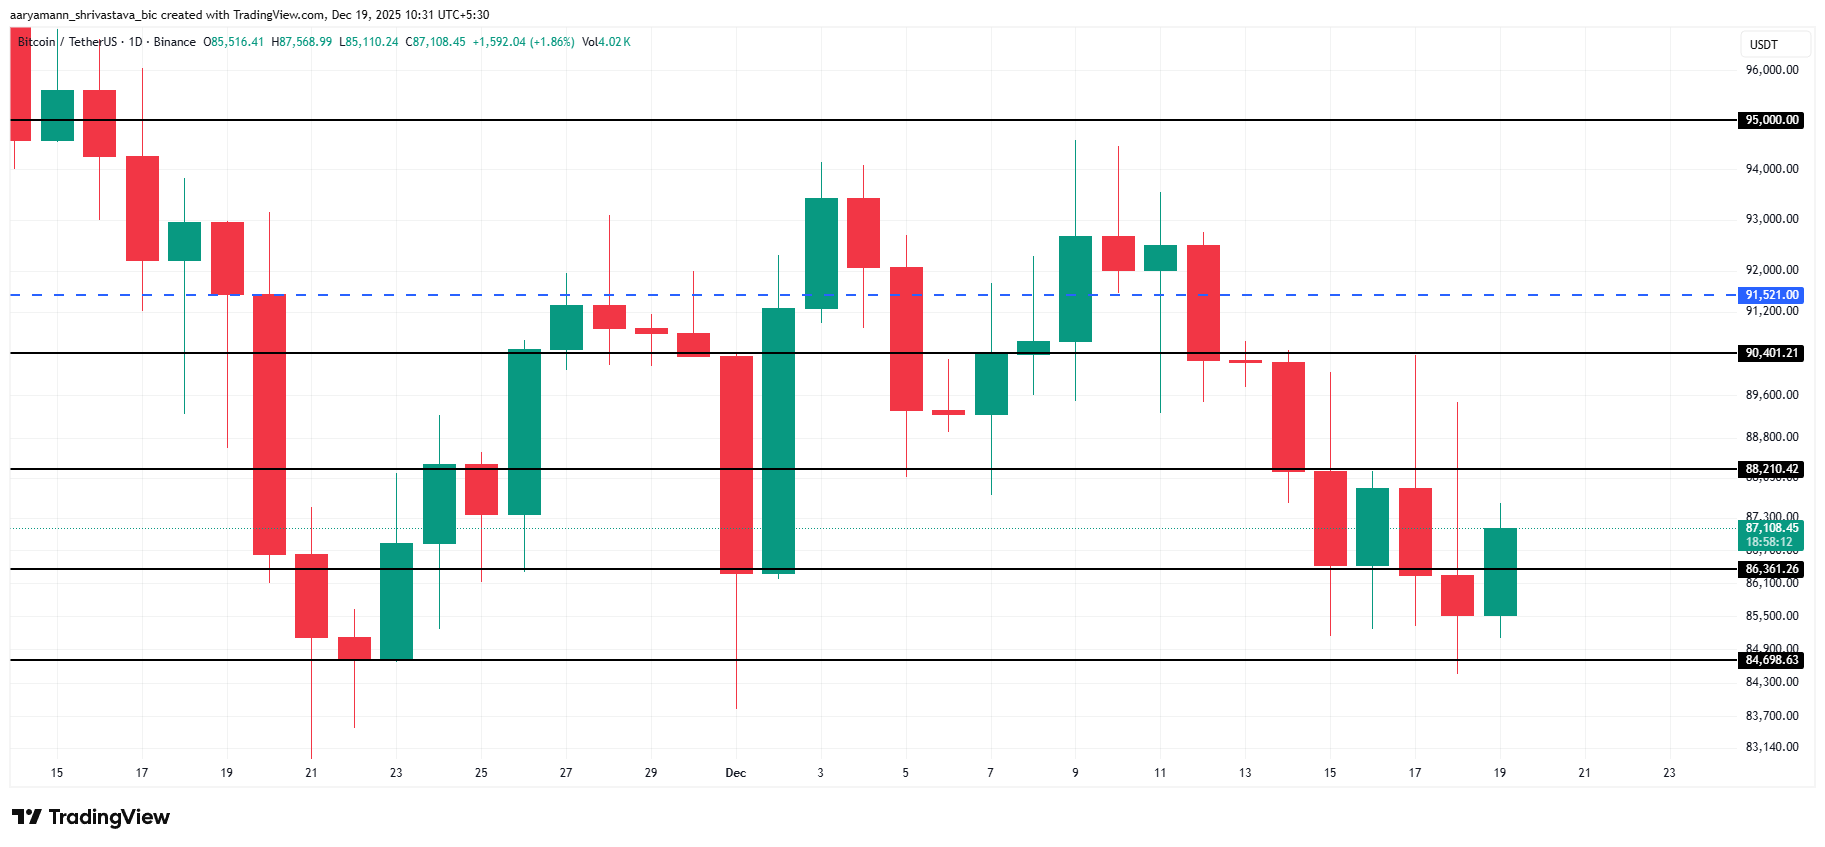
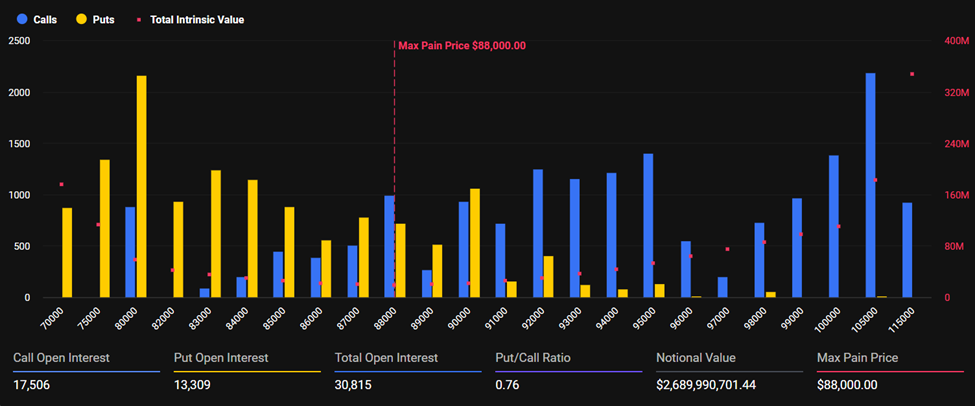
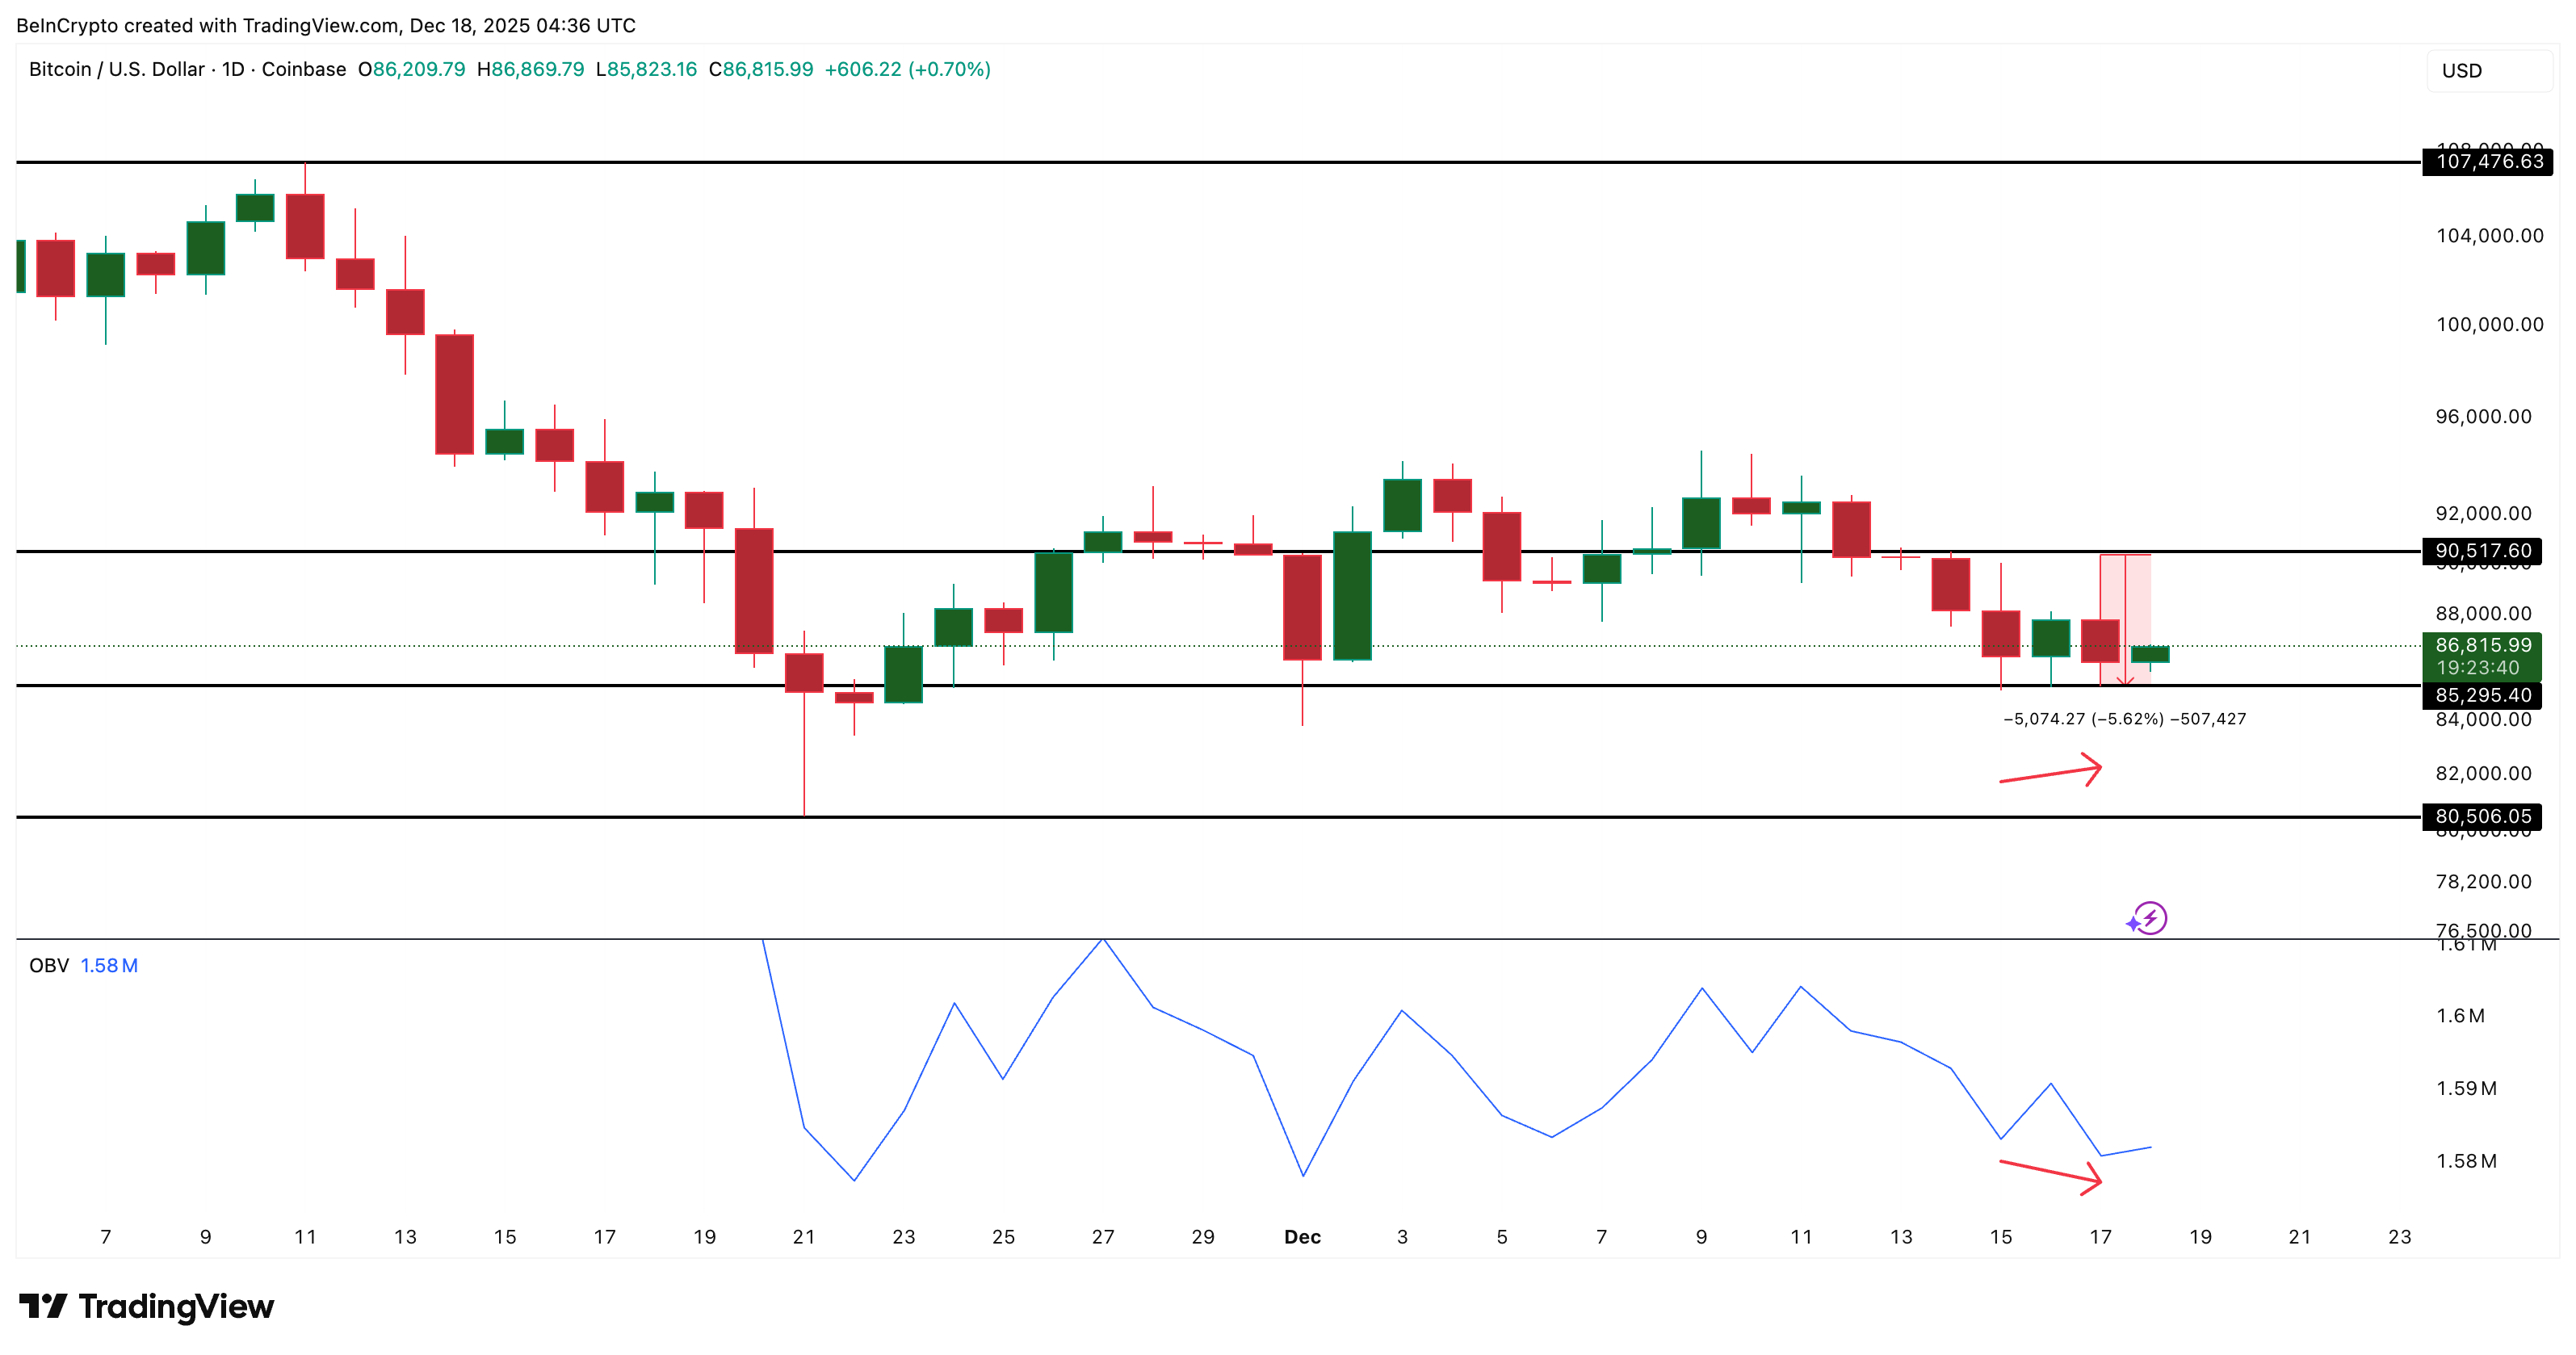
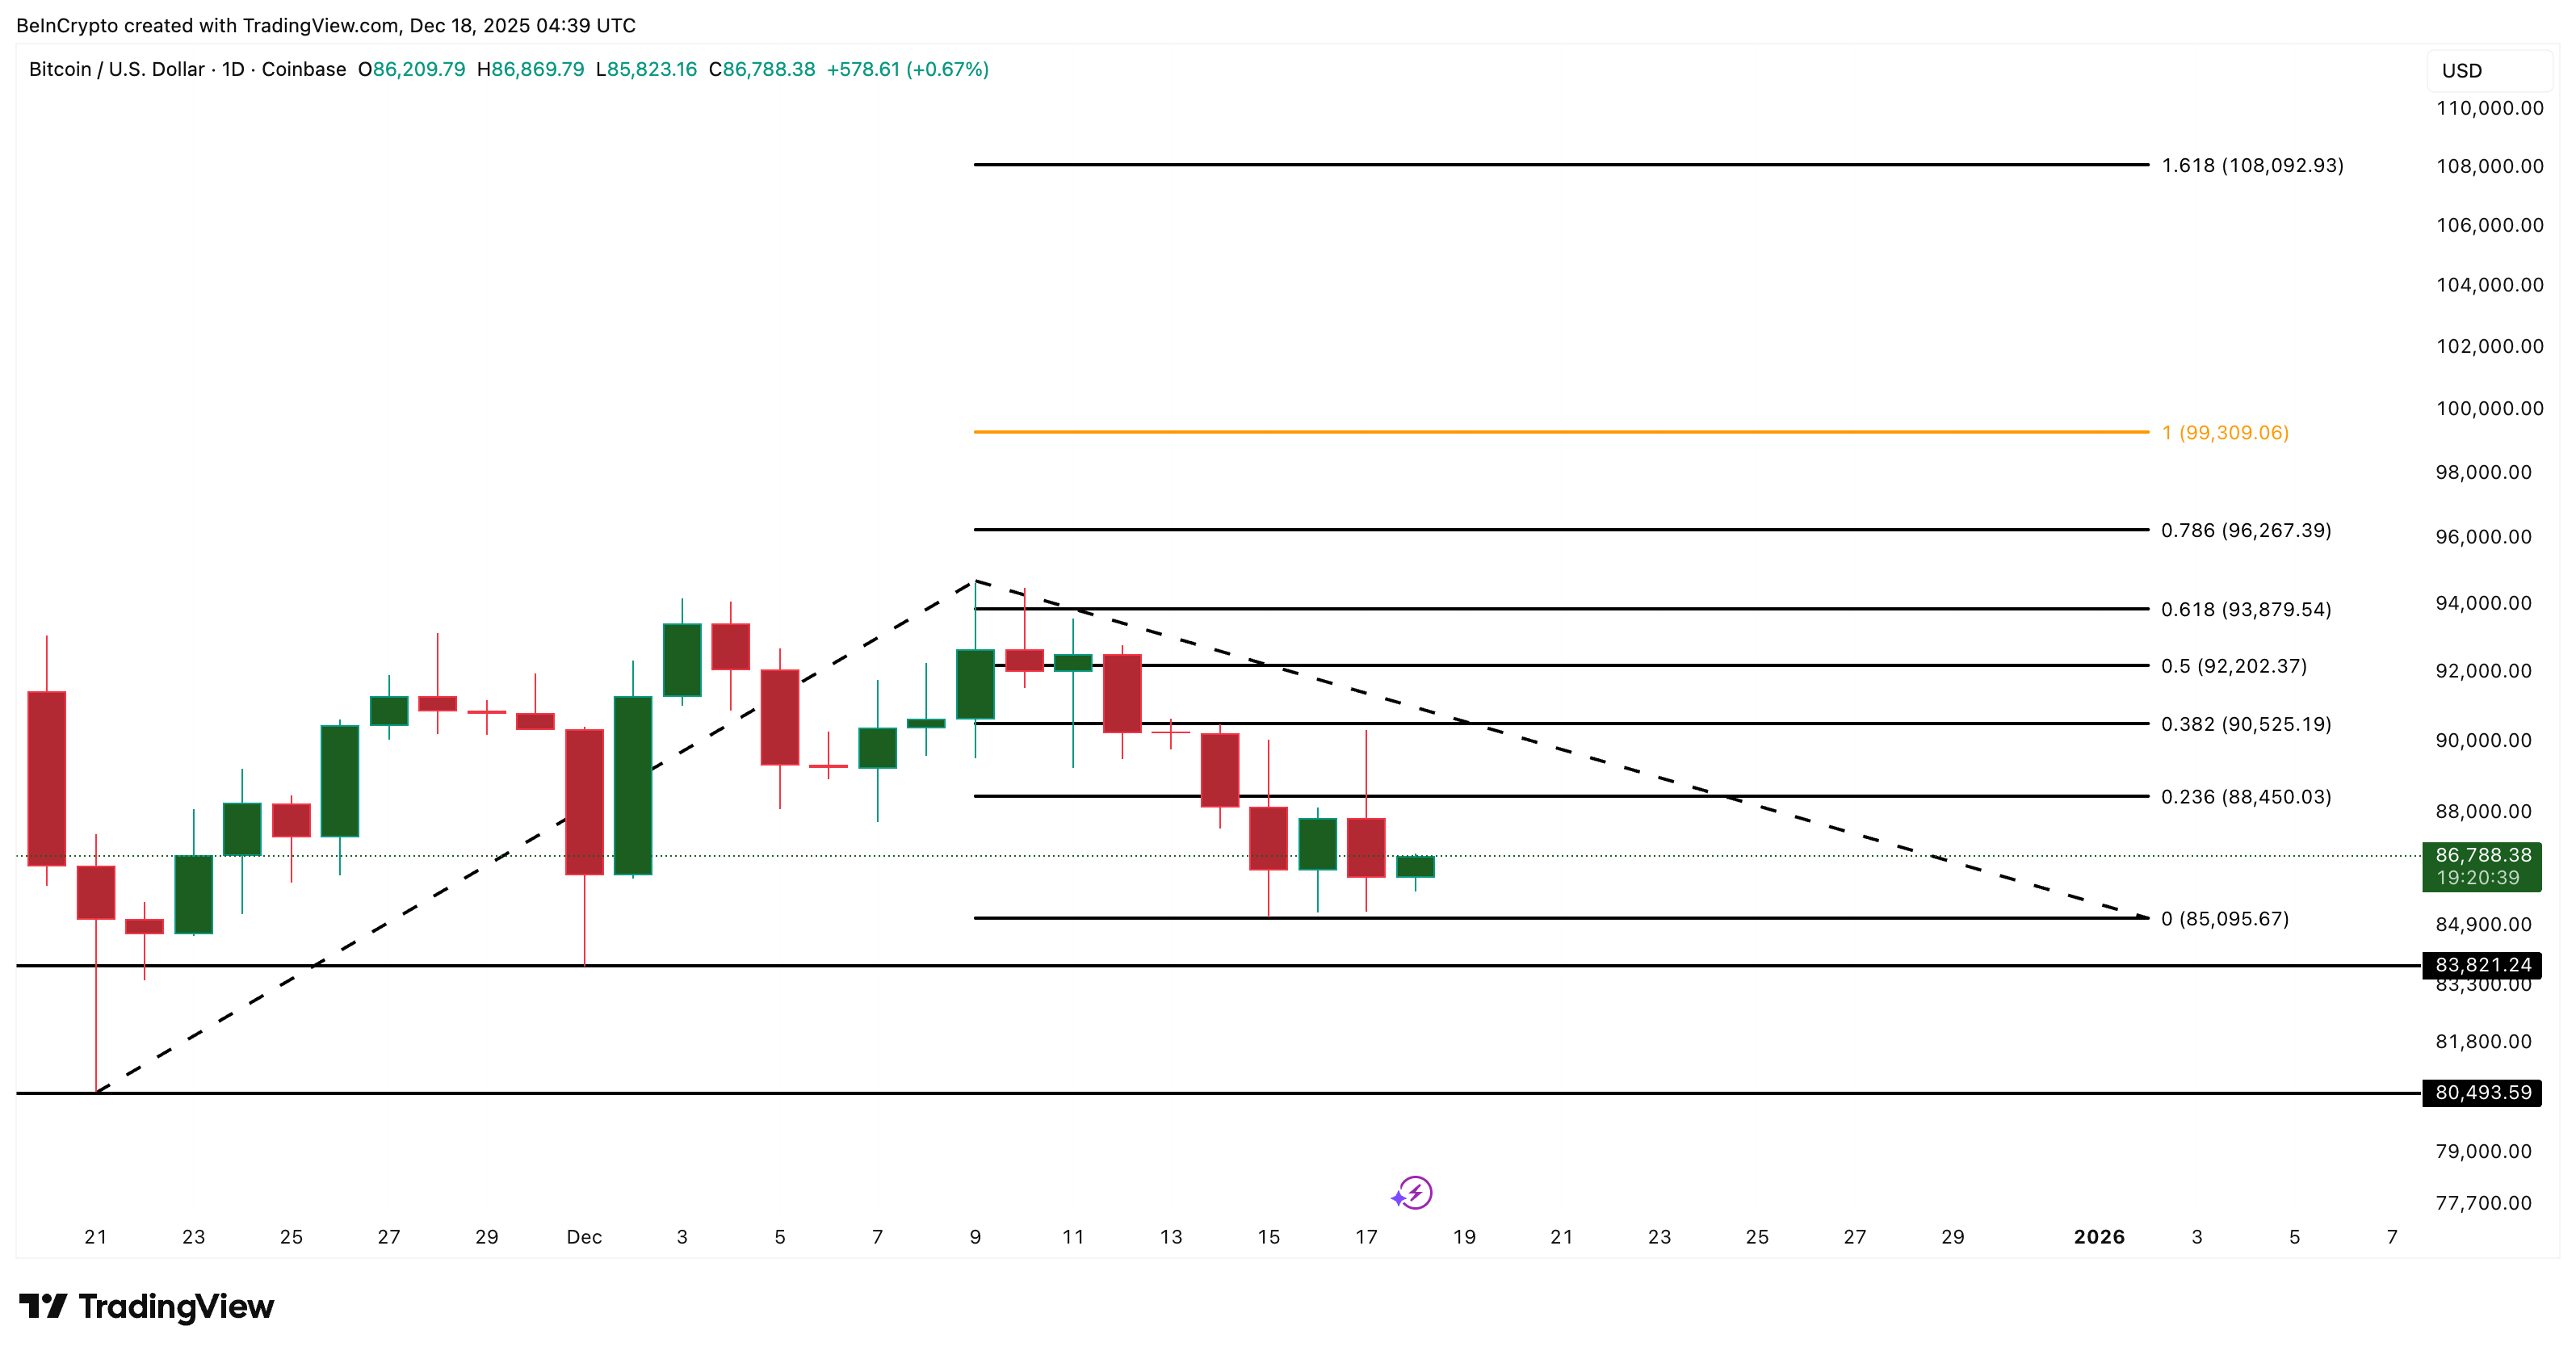
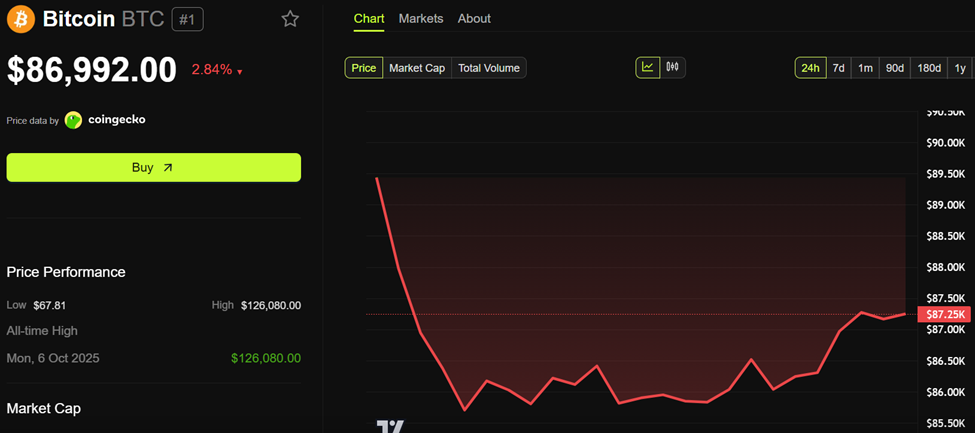
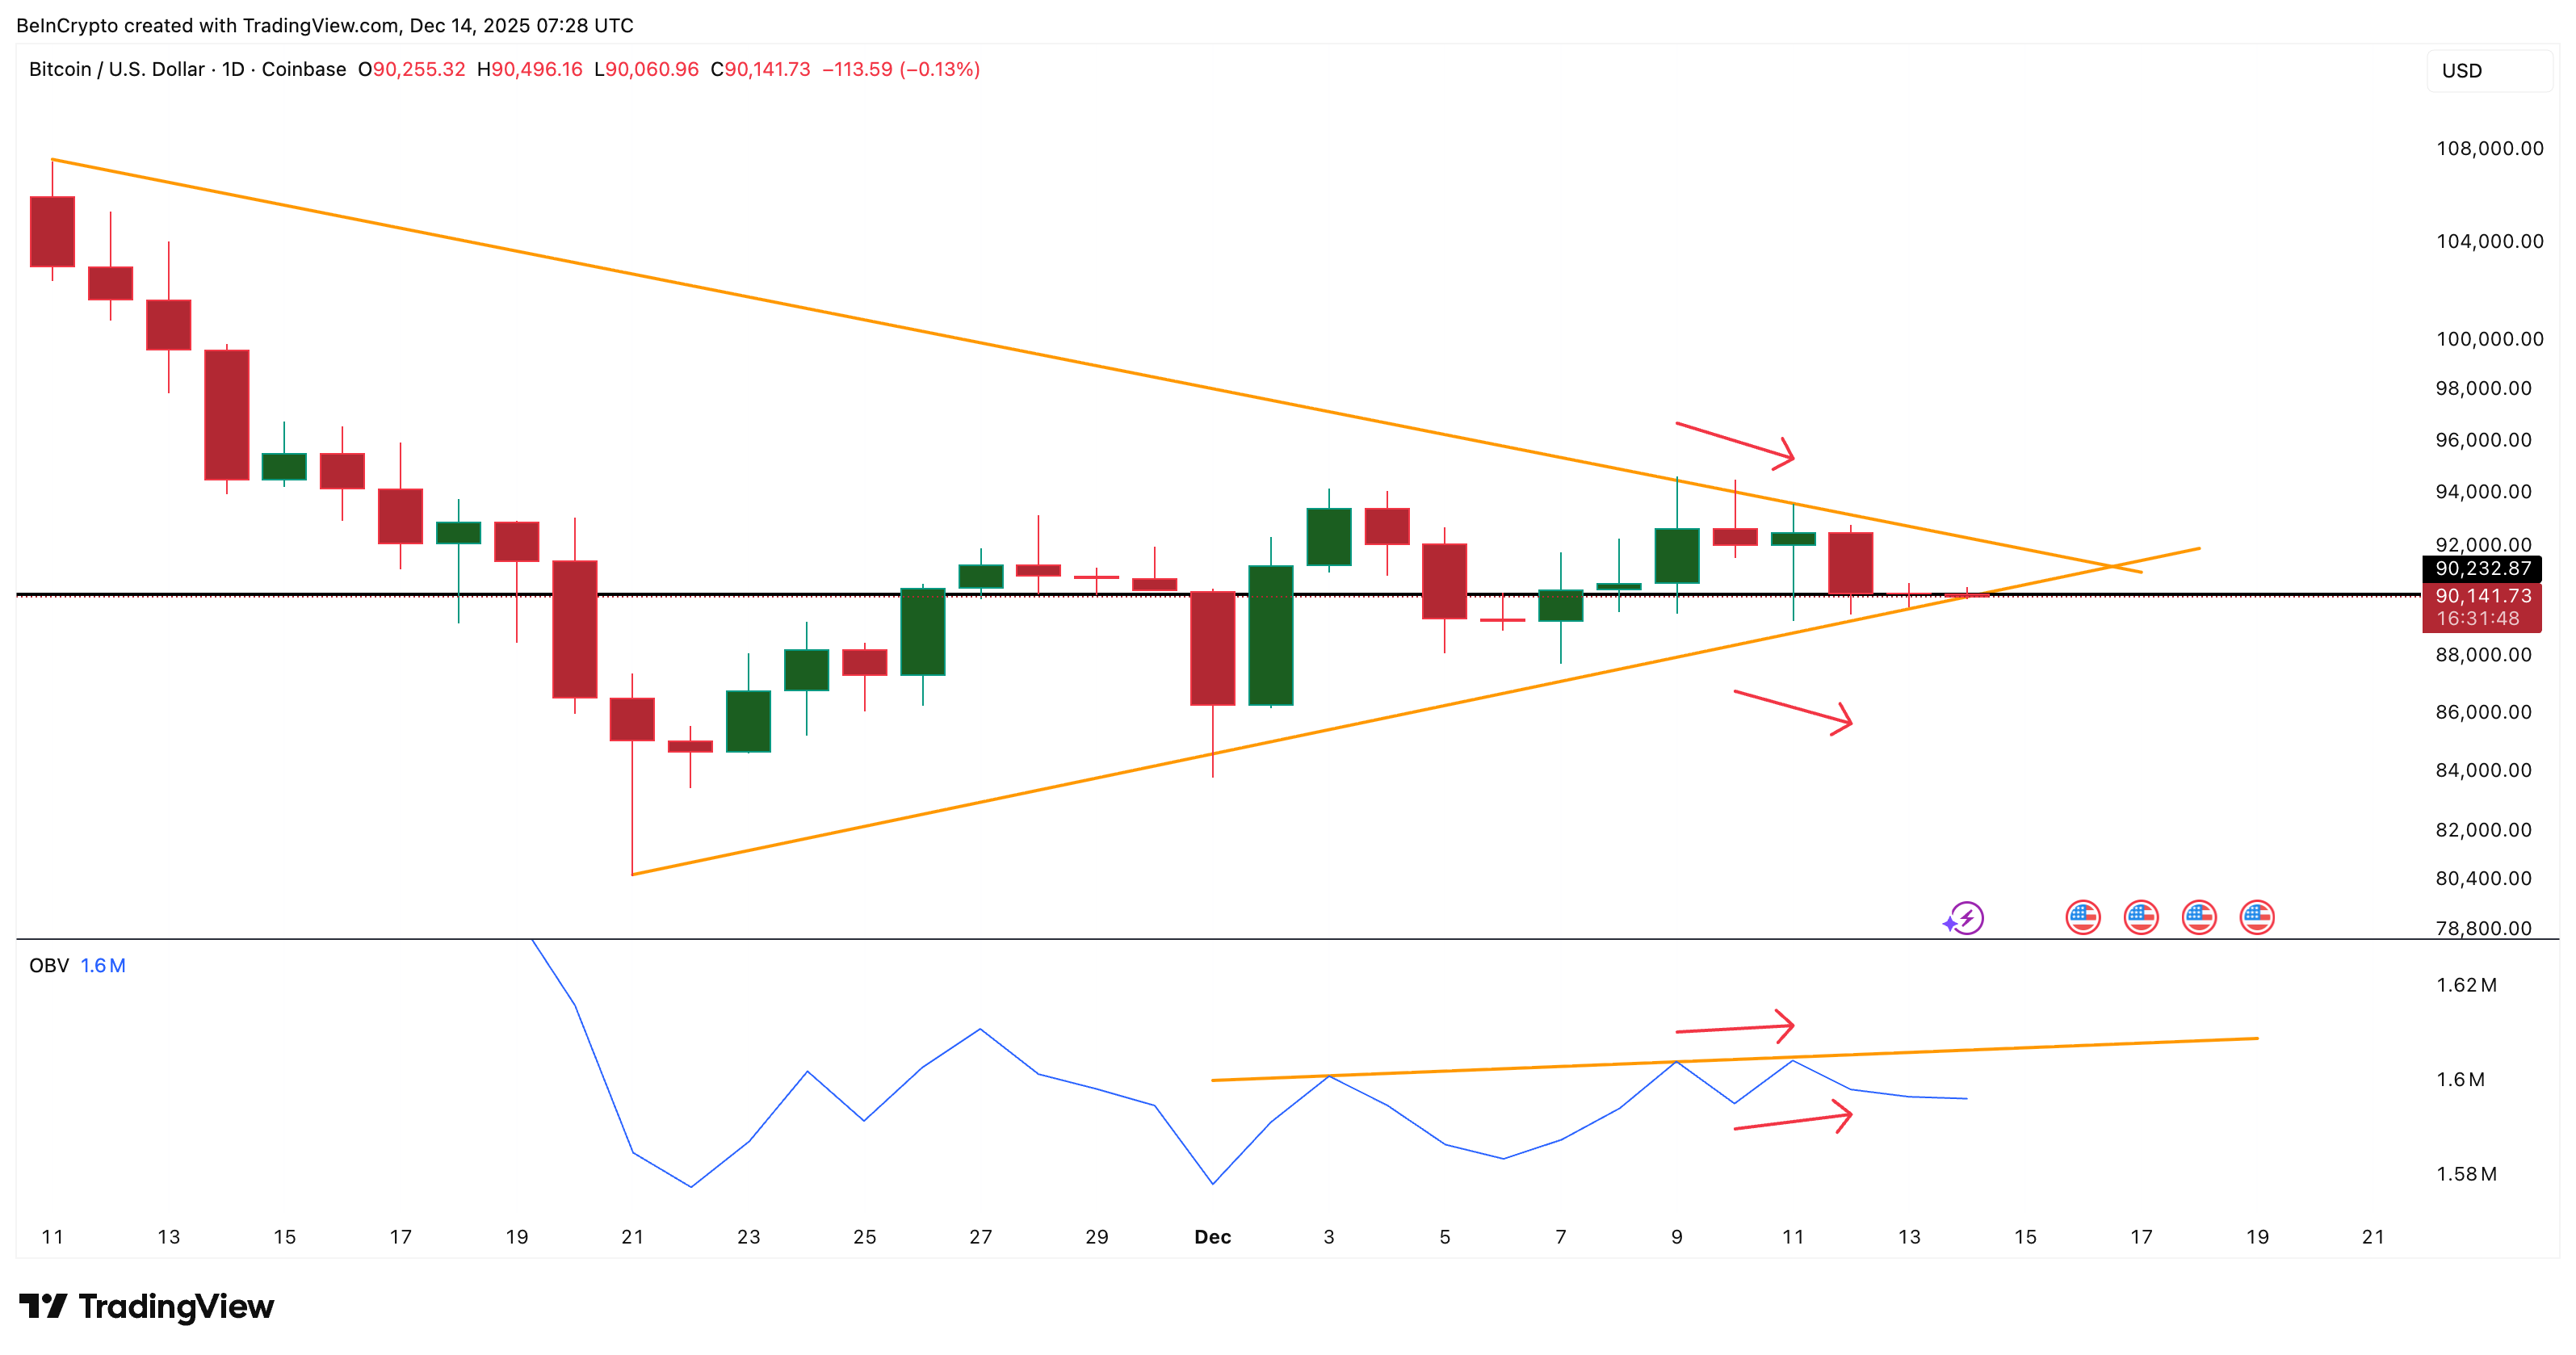
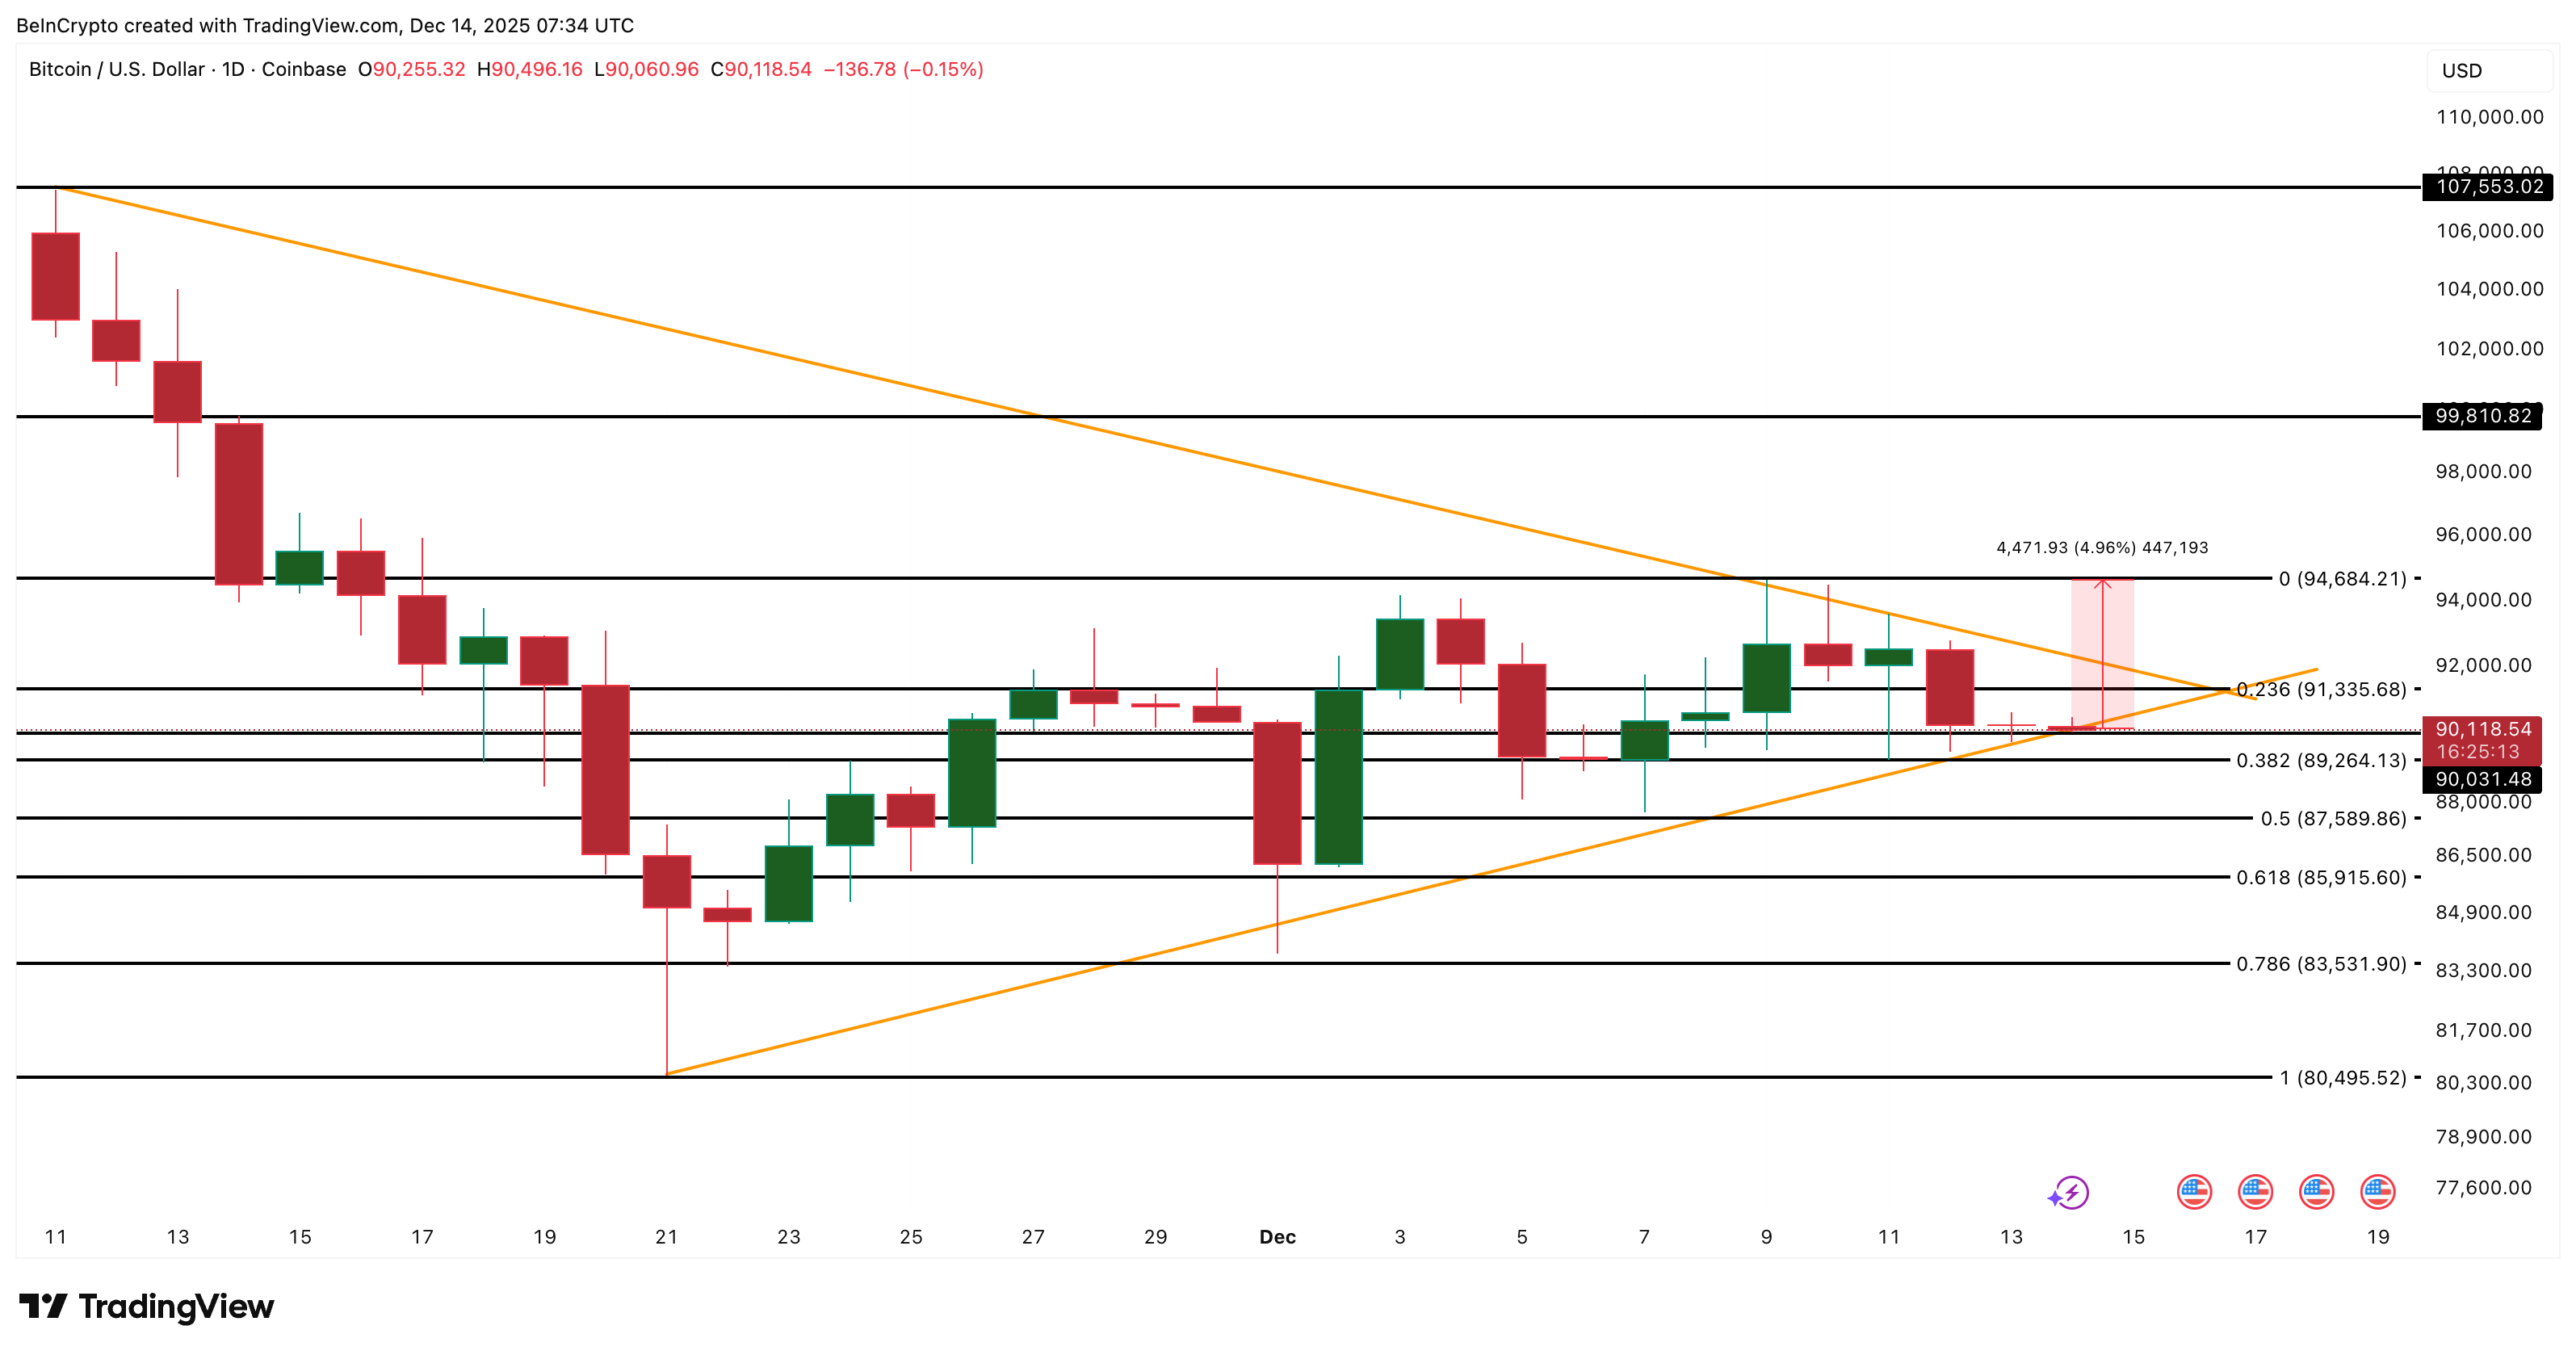
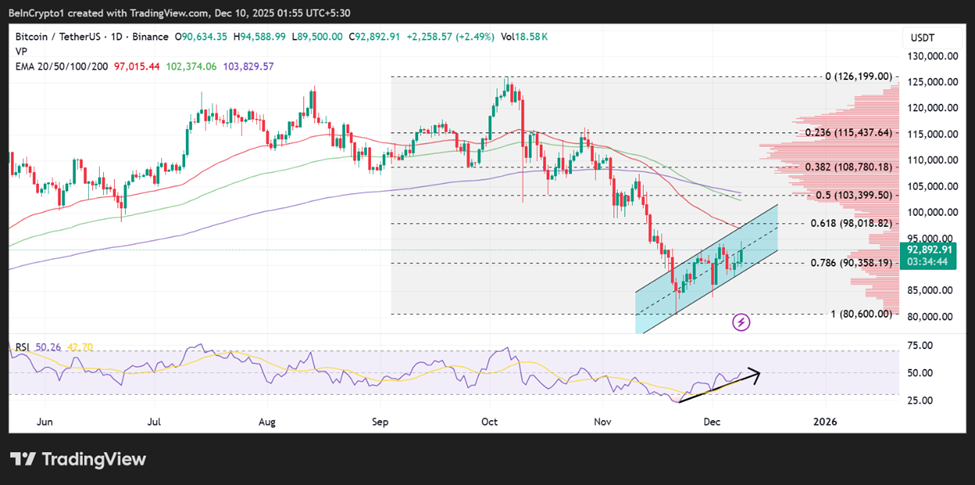
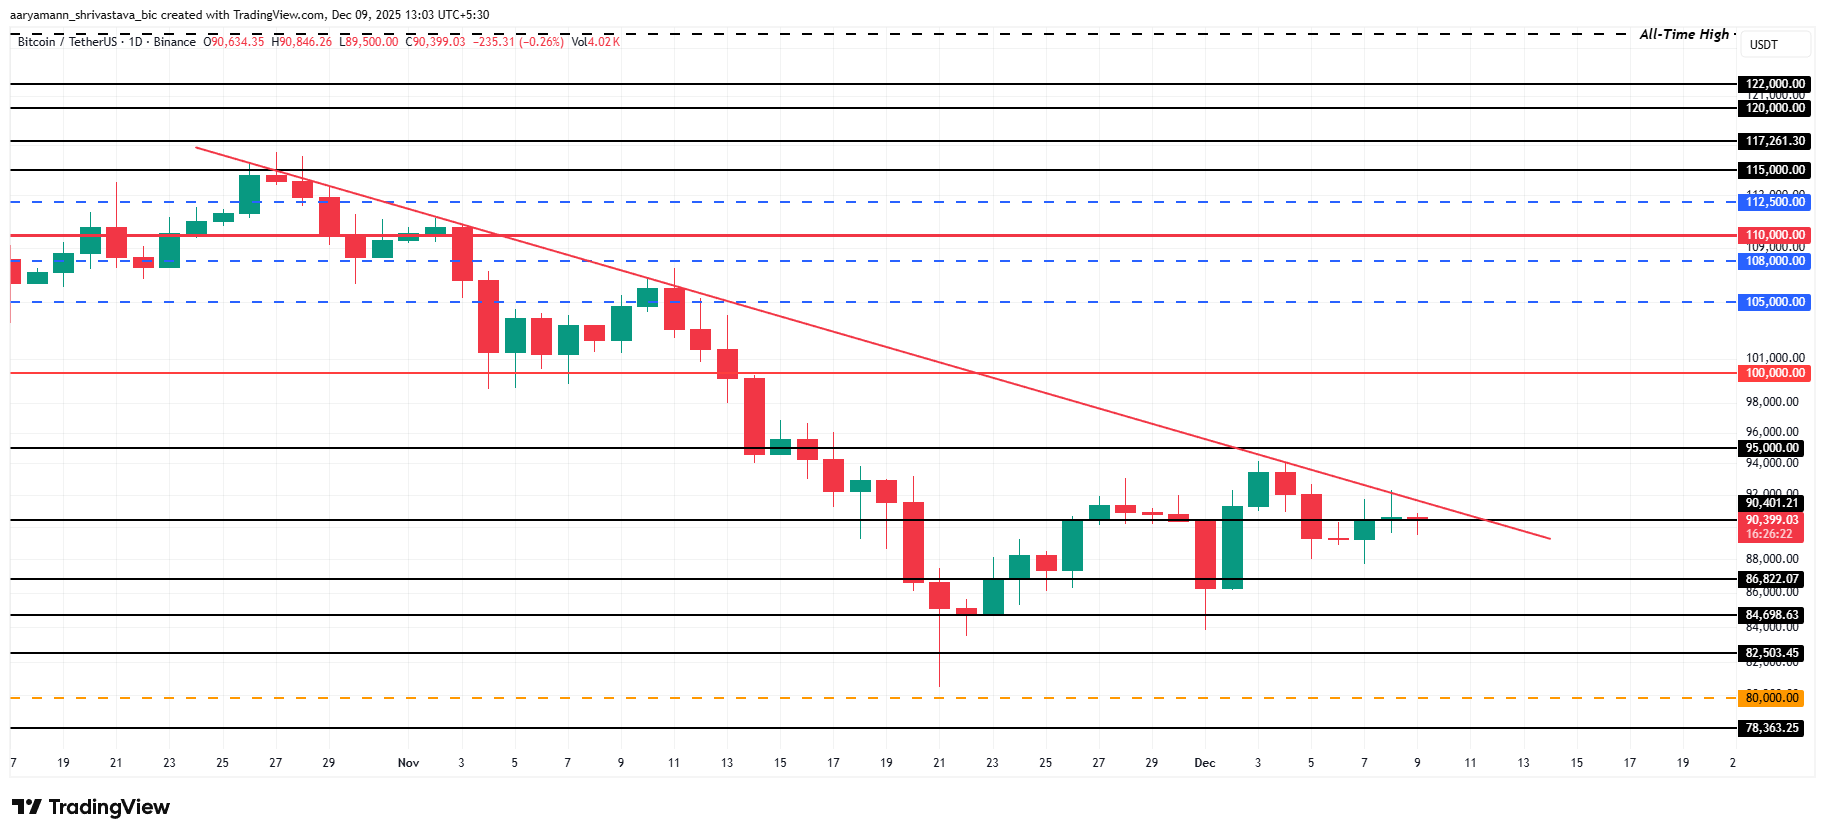
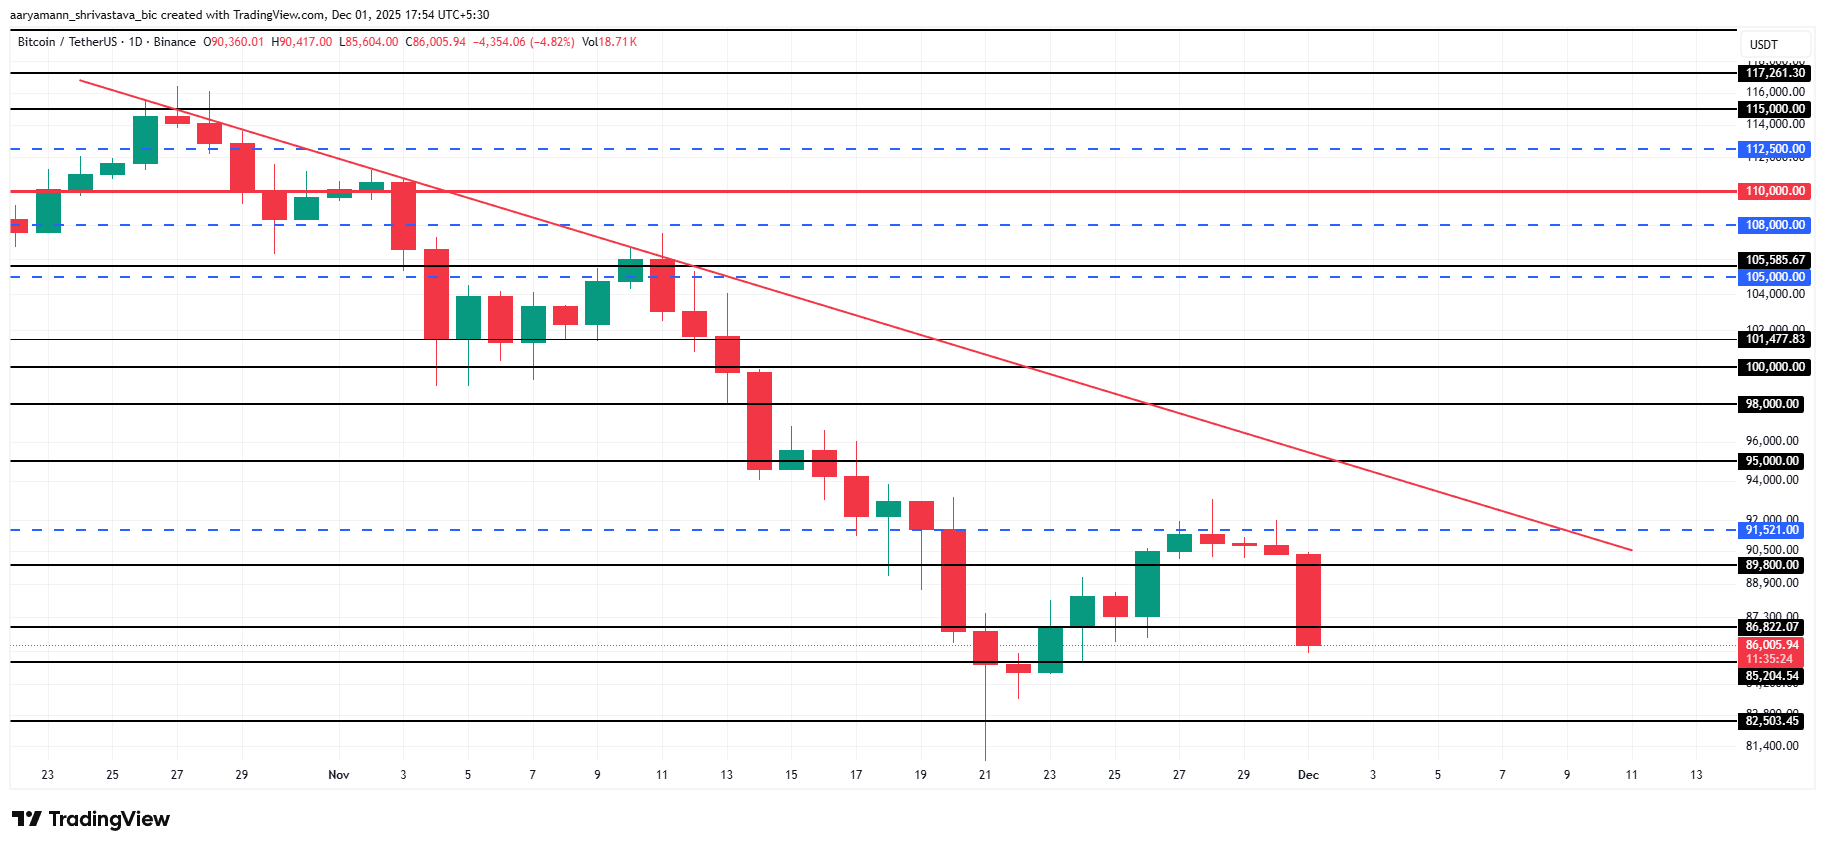
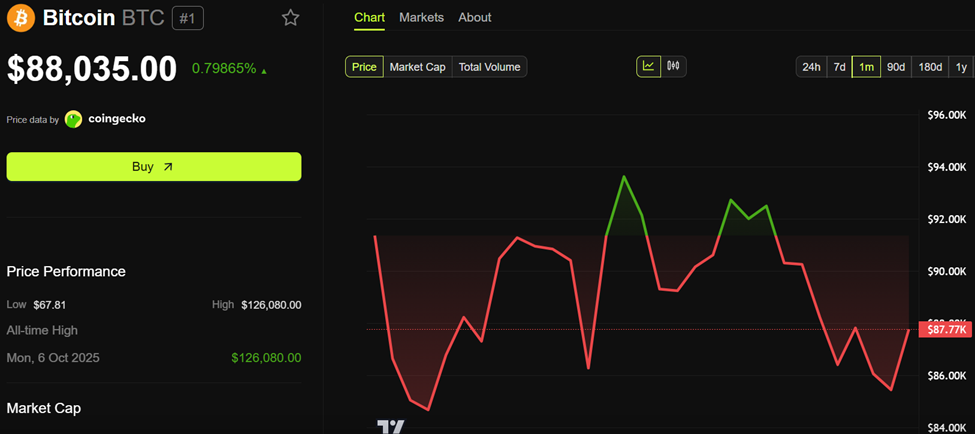
That pattern has made Bitcoin’s recent stability stand out. As of this writing, BTC was trading for $88,035, up by almost 1% in the last 24 hours.
“History shows every prior tightening triggered 20–30% Bitcoin drops as yen carry trades unwound and liquidity tightened. Yet with the hike fully priced in and BTC holding around $85k–$87k, this could be the dip buyers have been waiting for,” wrote analyst Blueblock.
However, resilience at the top of the crypto market does not eliminate risk elsewhere. Altcoins, which are far more sensitive to liquidity conditions, remain exposed if Japanese tightening continues.
Indeed, BOJ officials have openly signaled willingness to keep tightening if wage growth and inflation remain durable. Analysts at ING and Bloomberg have warned that while further hikes may not be imminent, the direction of travel is clear.
The implication for global markets is stark. Fed cuts may provide broad support over time, but Japan’s retreat from ultra-easy policy strikes directly at the foundation of global leverage.If the BOJ continues down this path, its influence on liquidity, currencies, and crypto could outweigh US easing, at least in the near term.
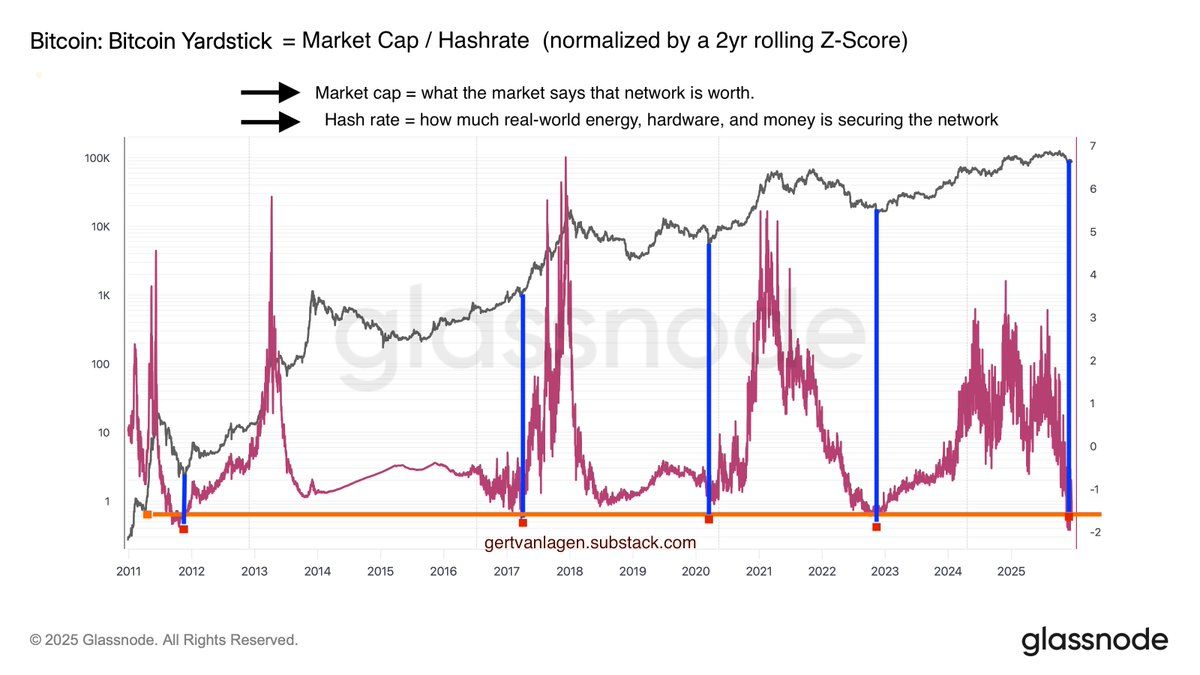
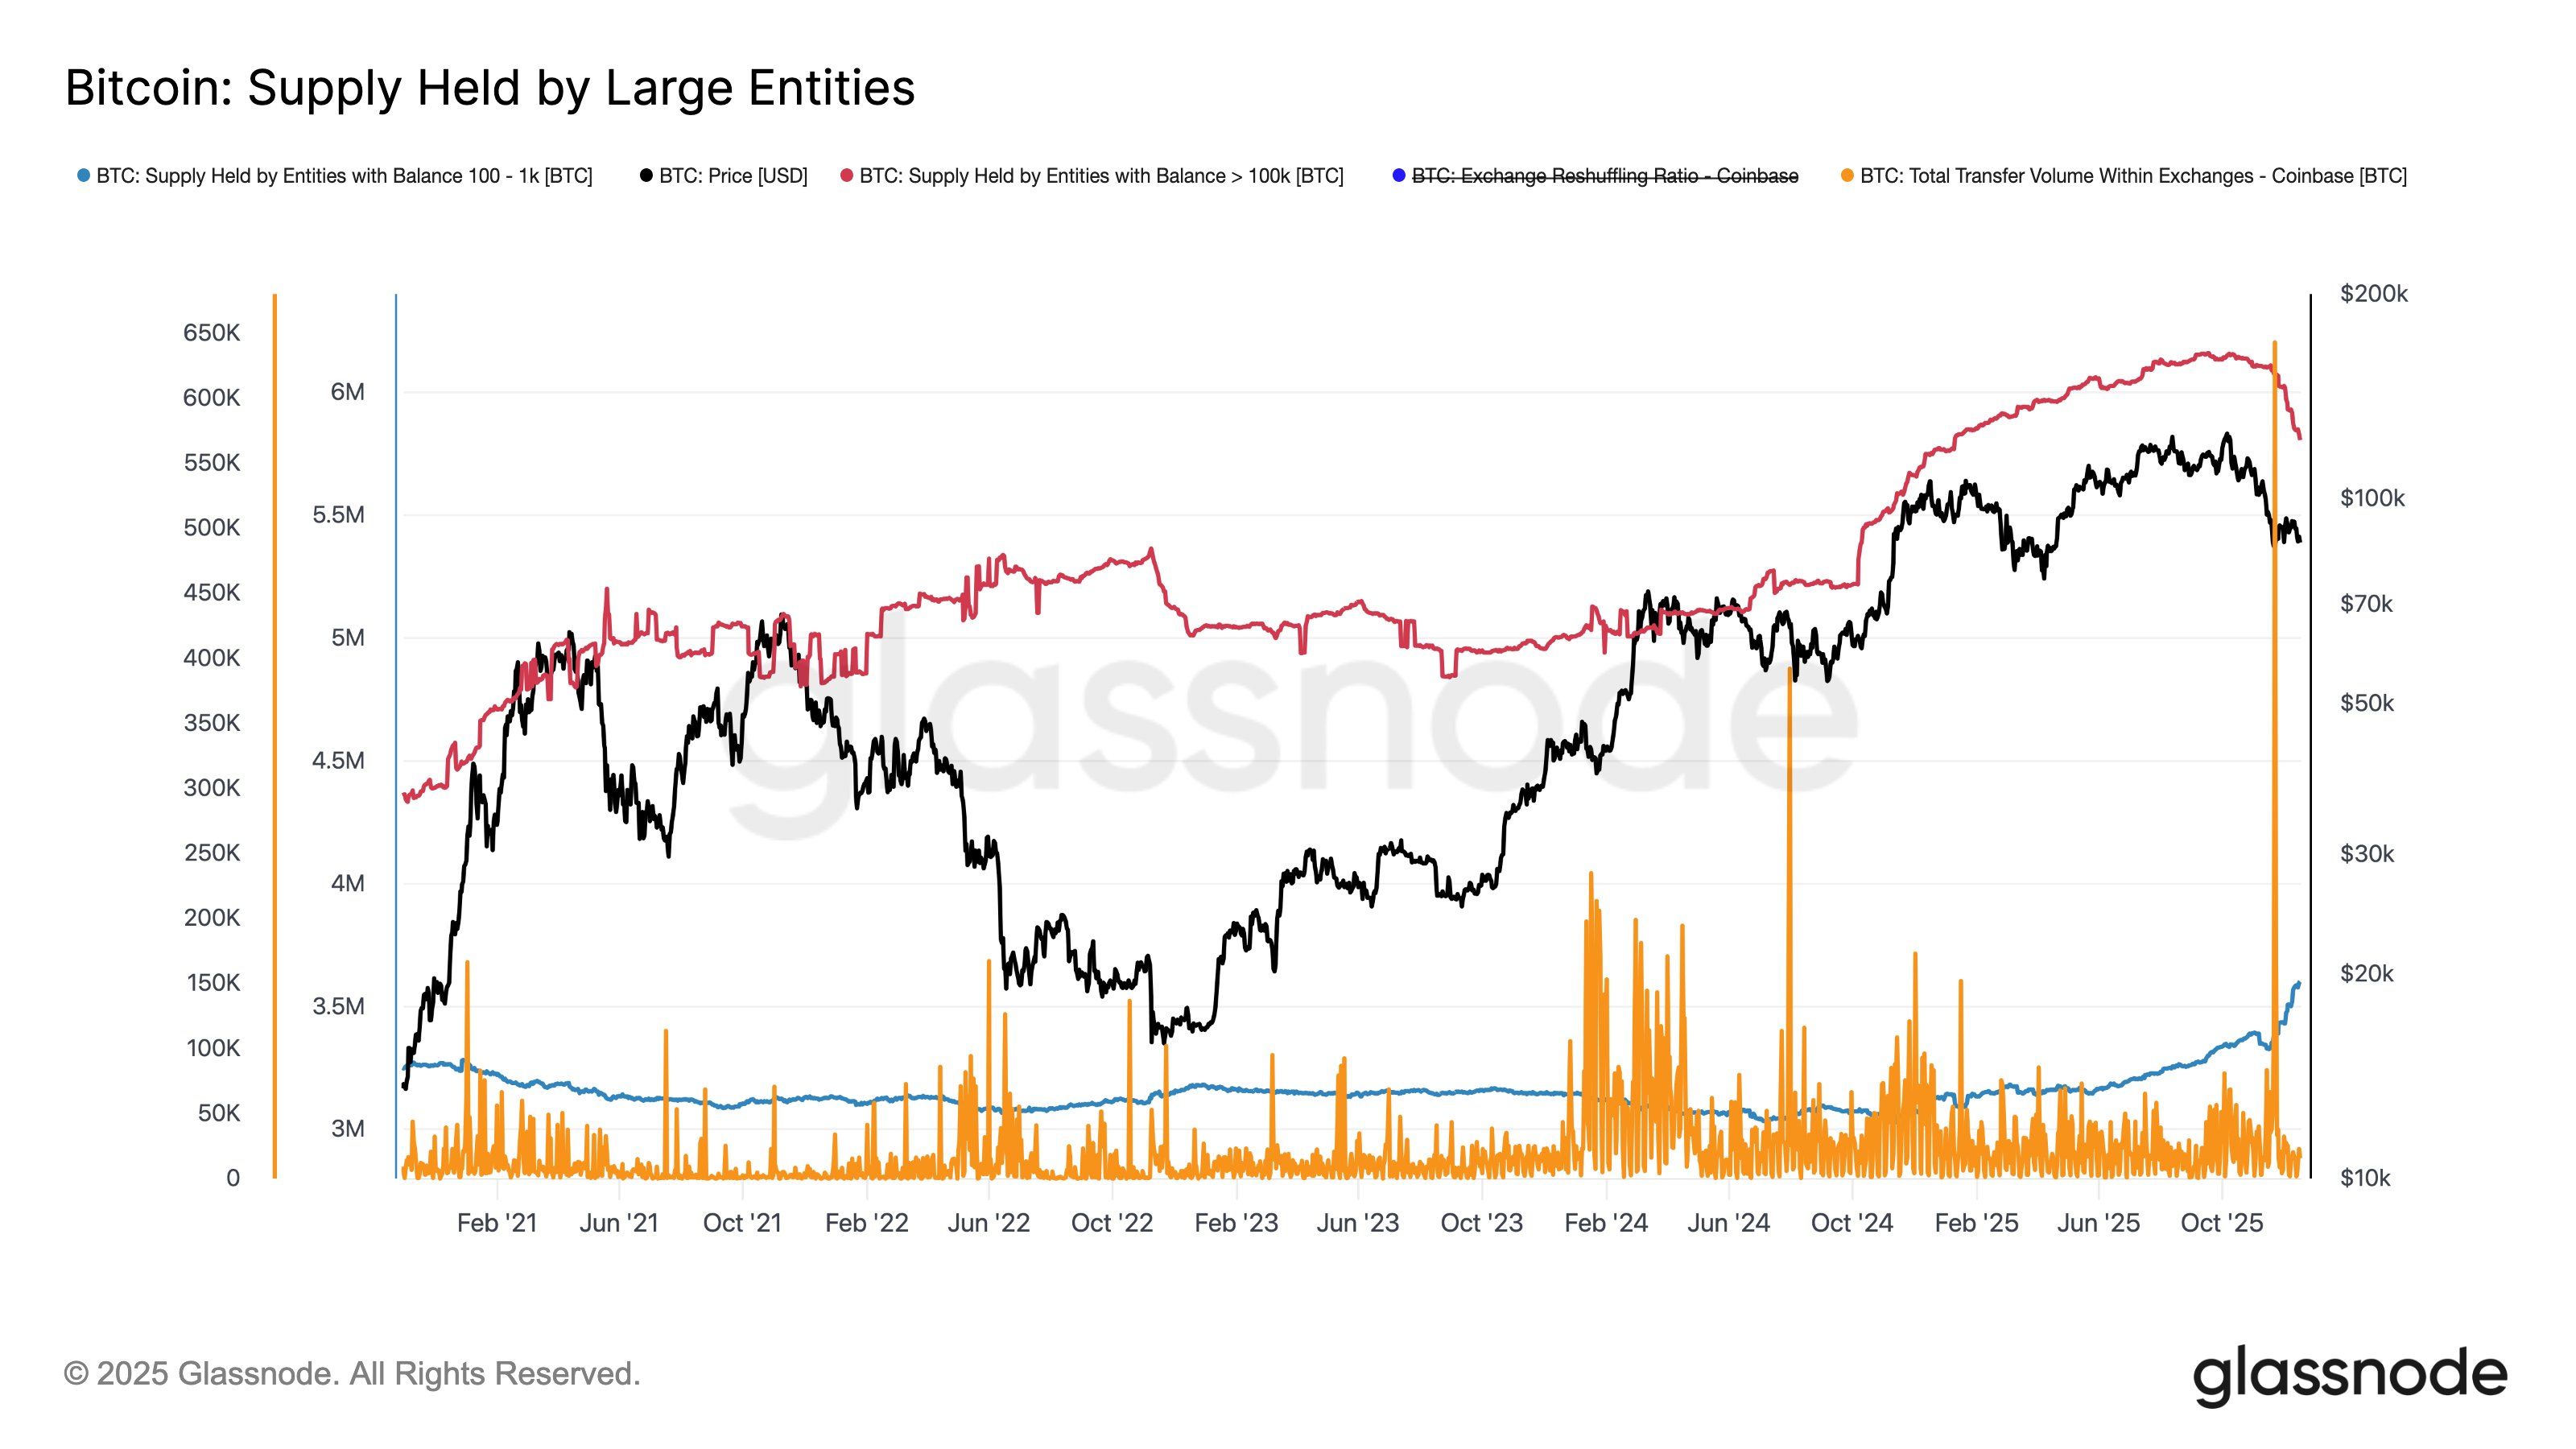
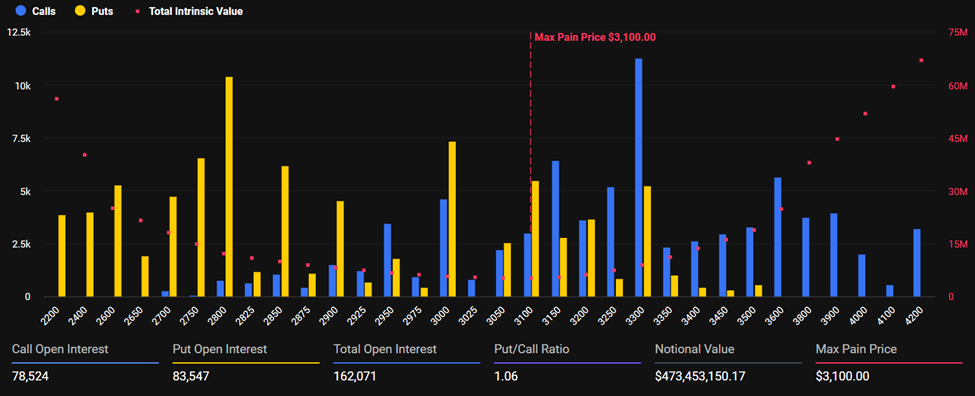
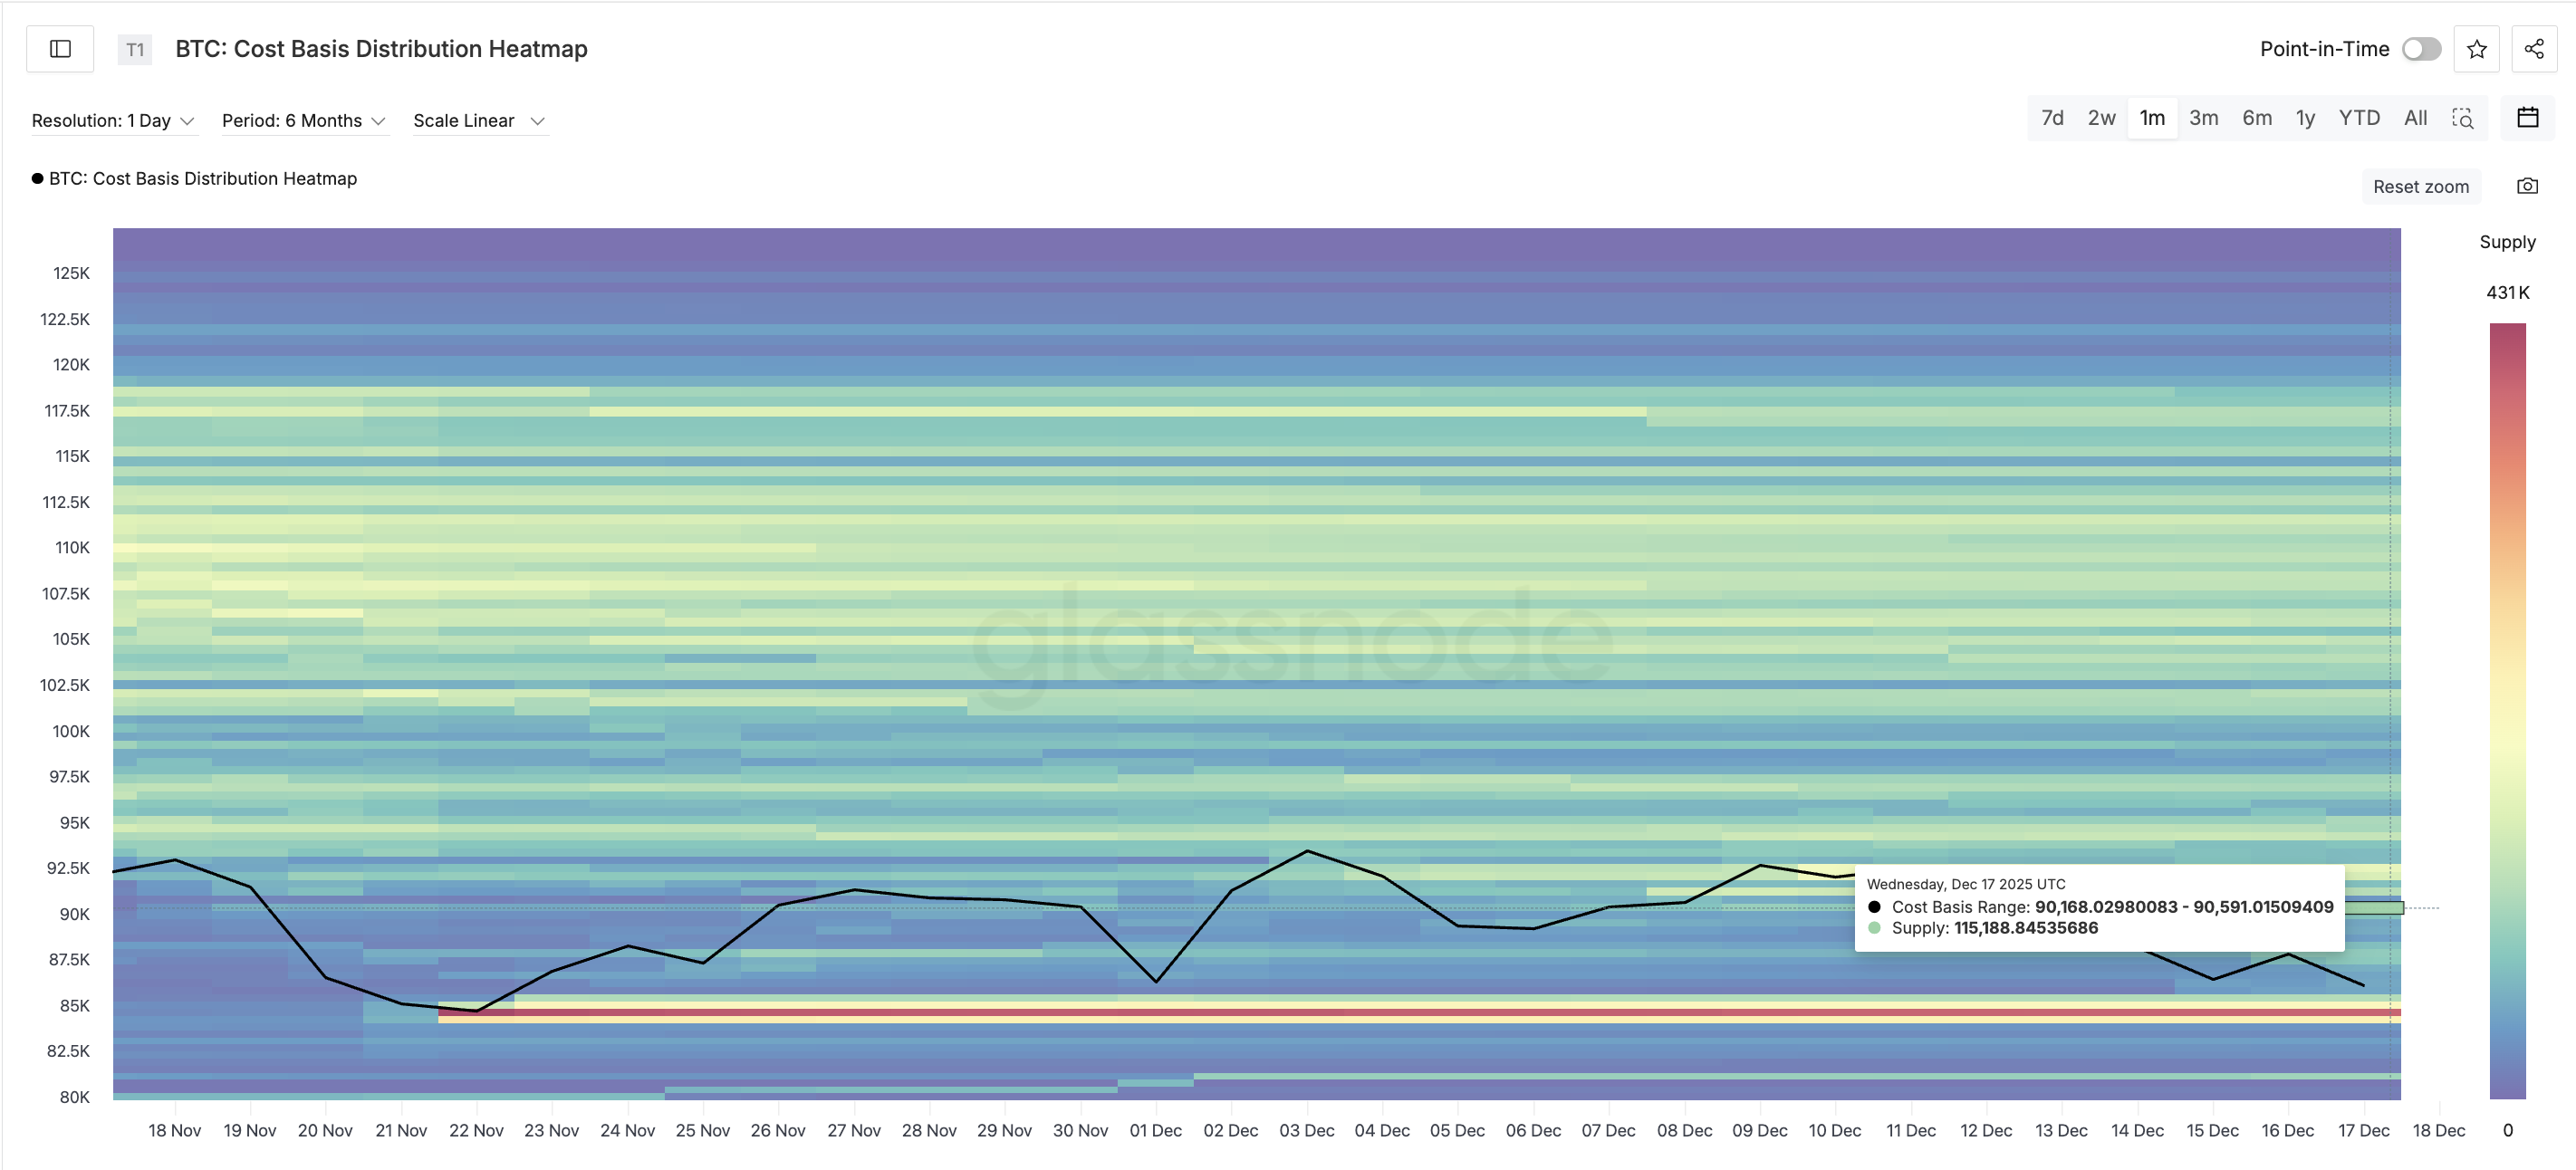
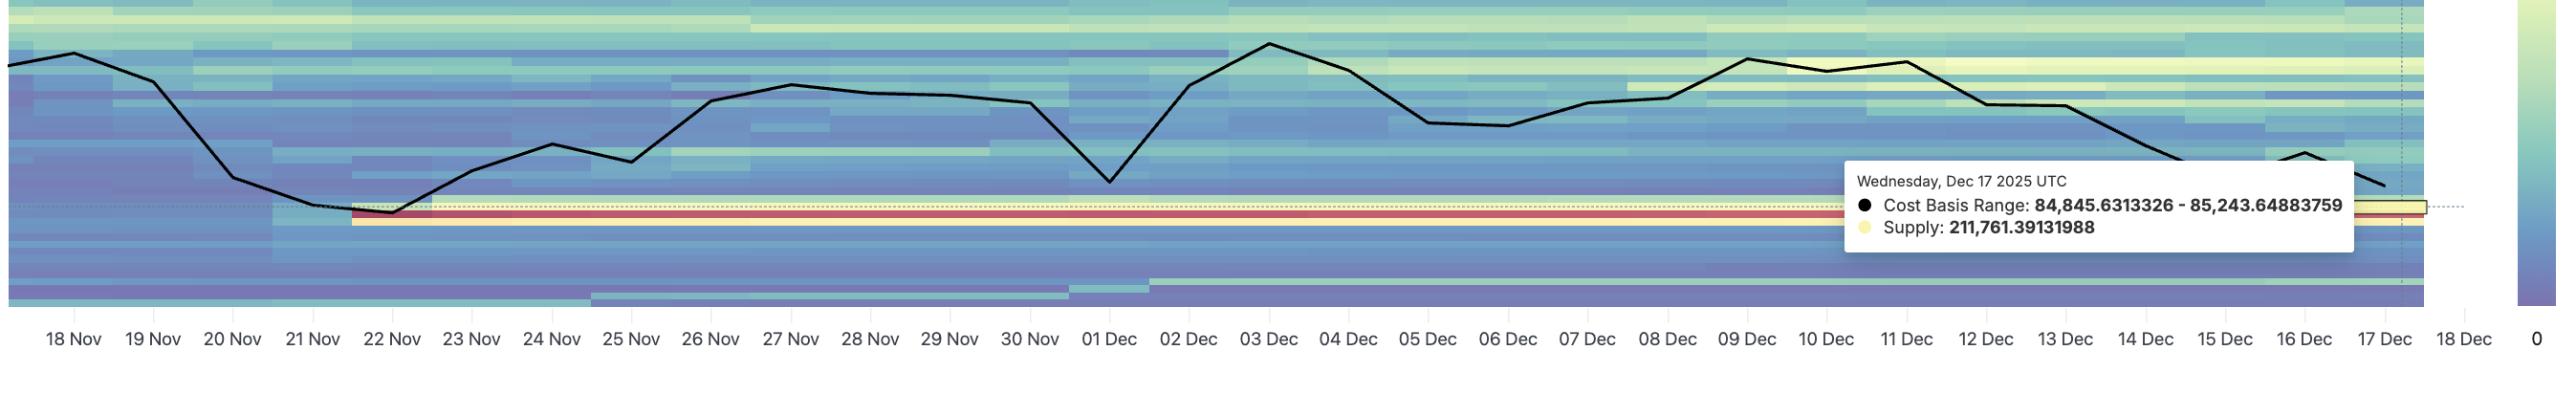
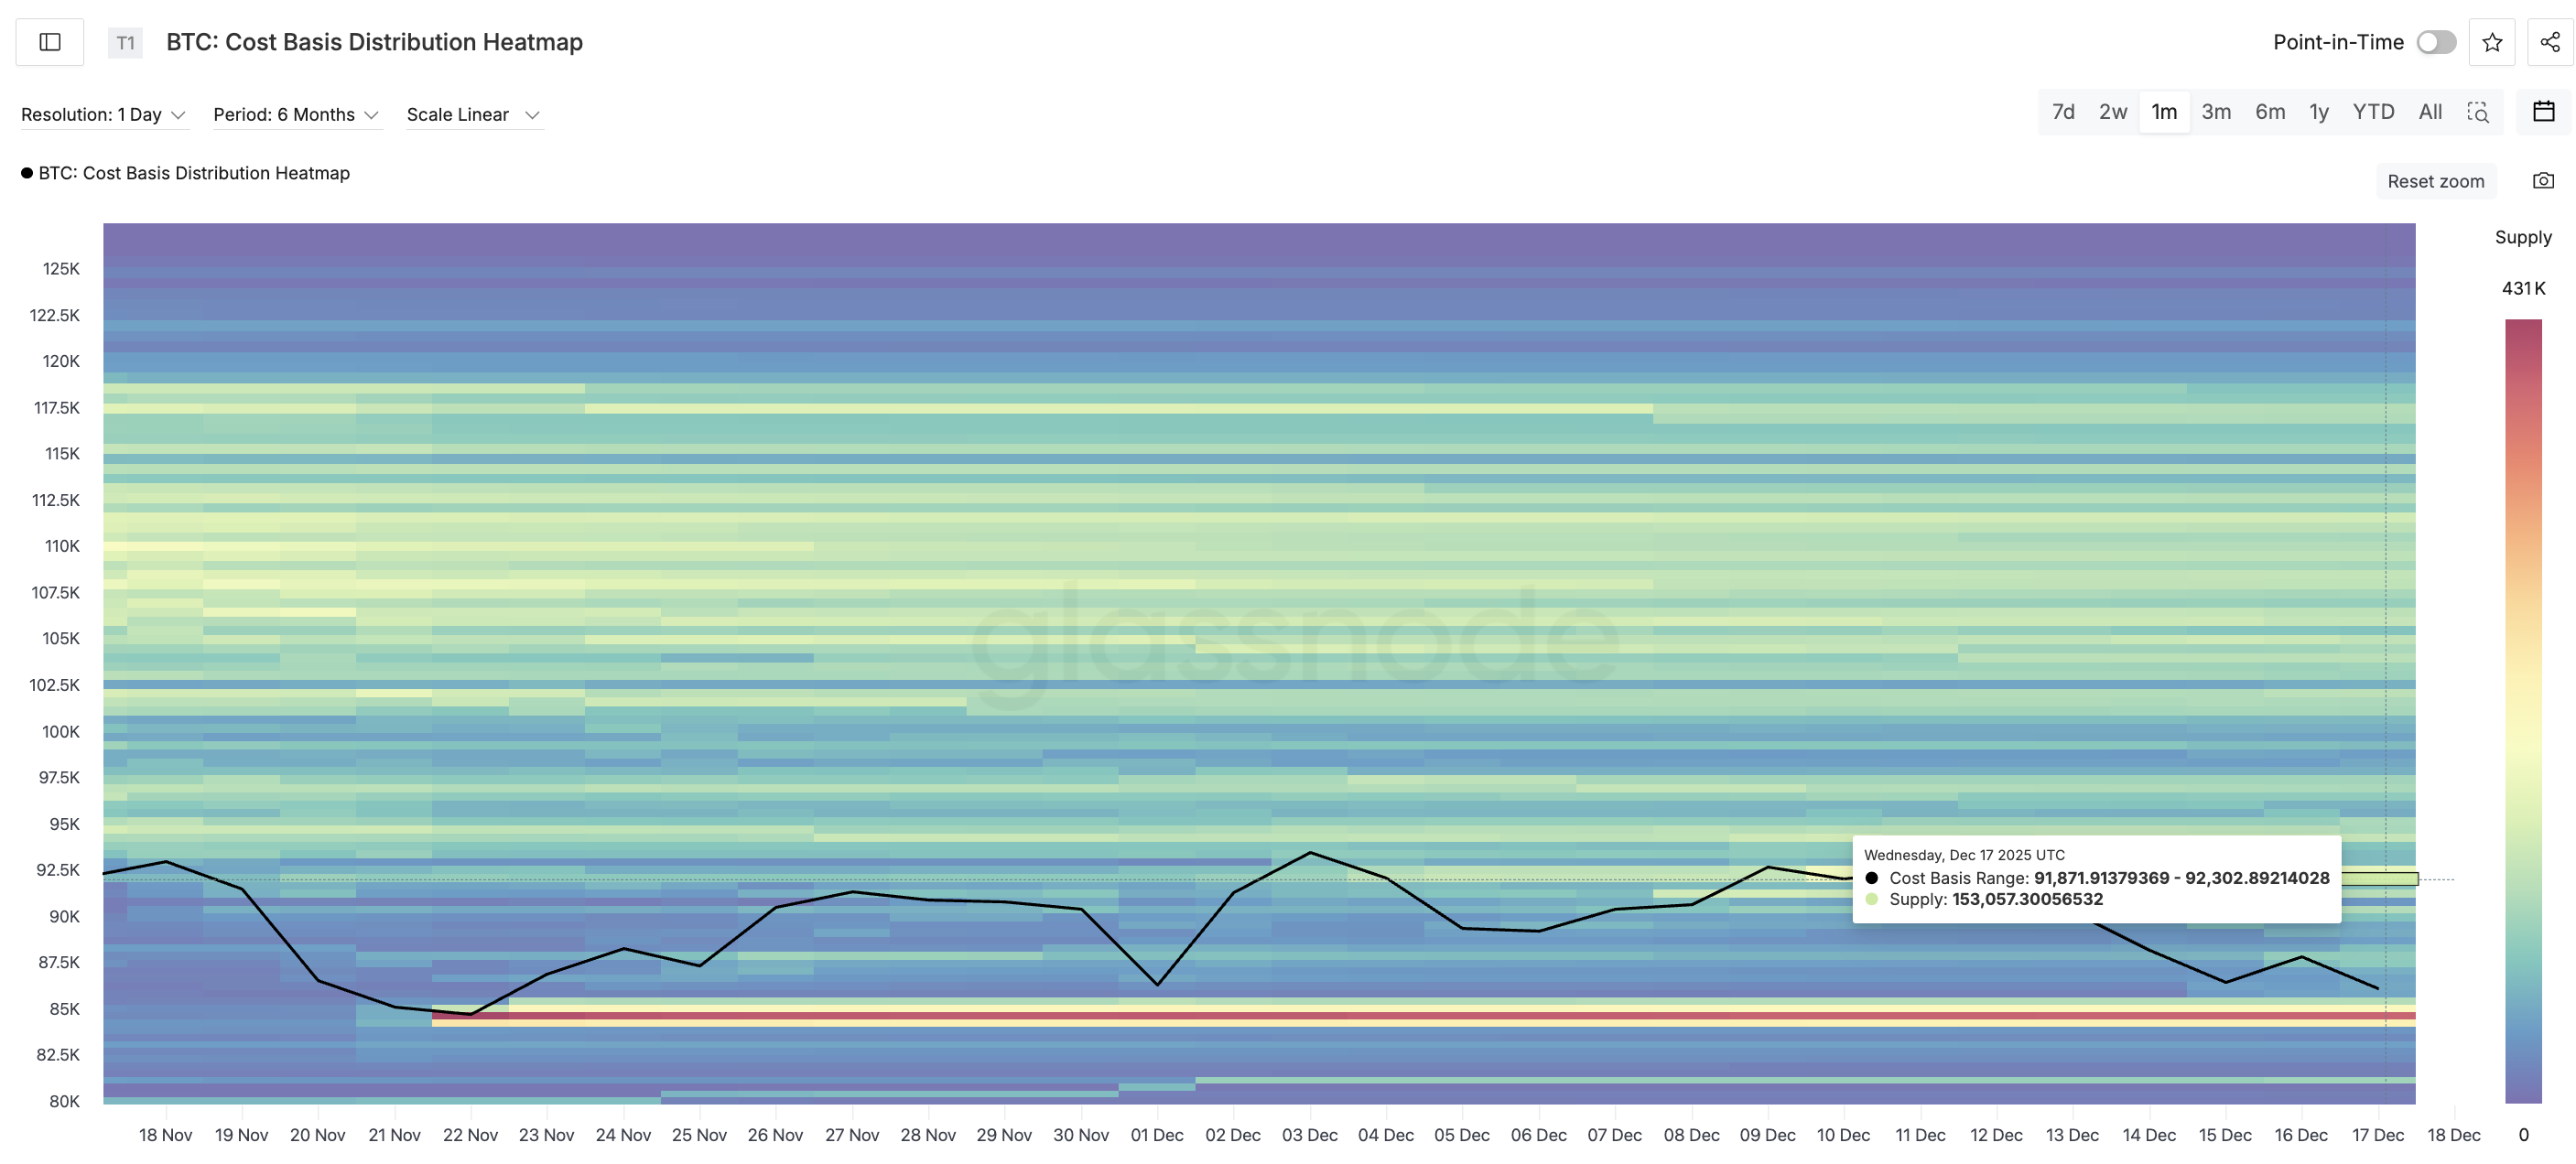
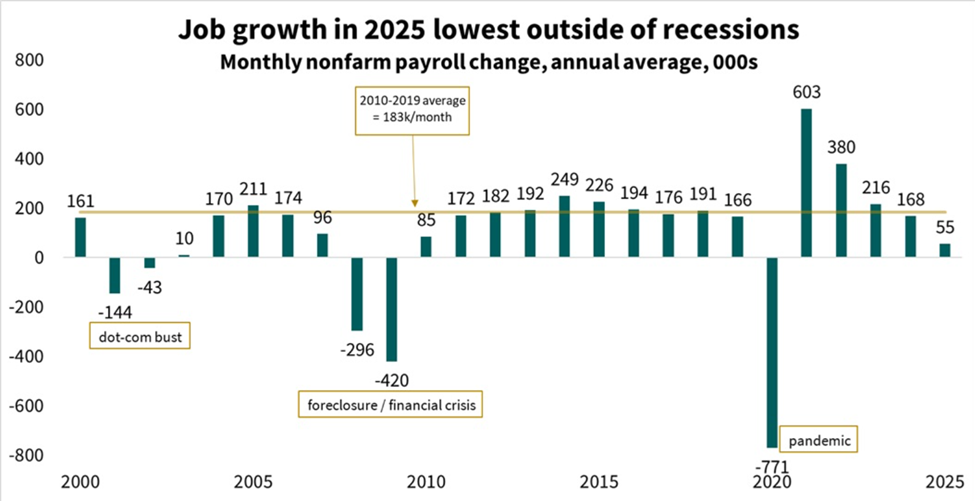
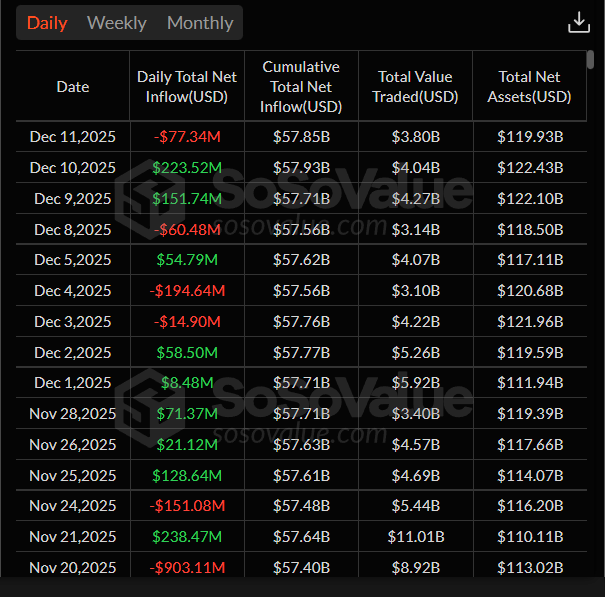
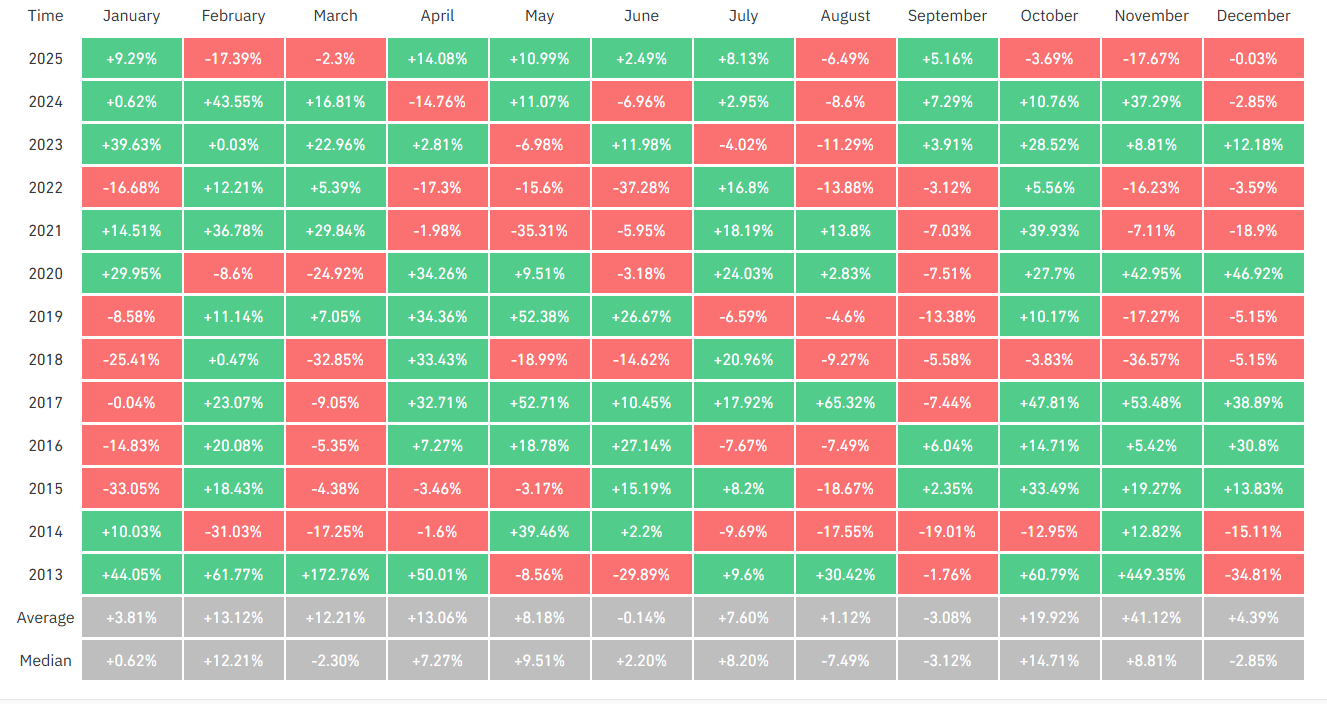
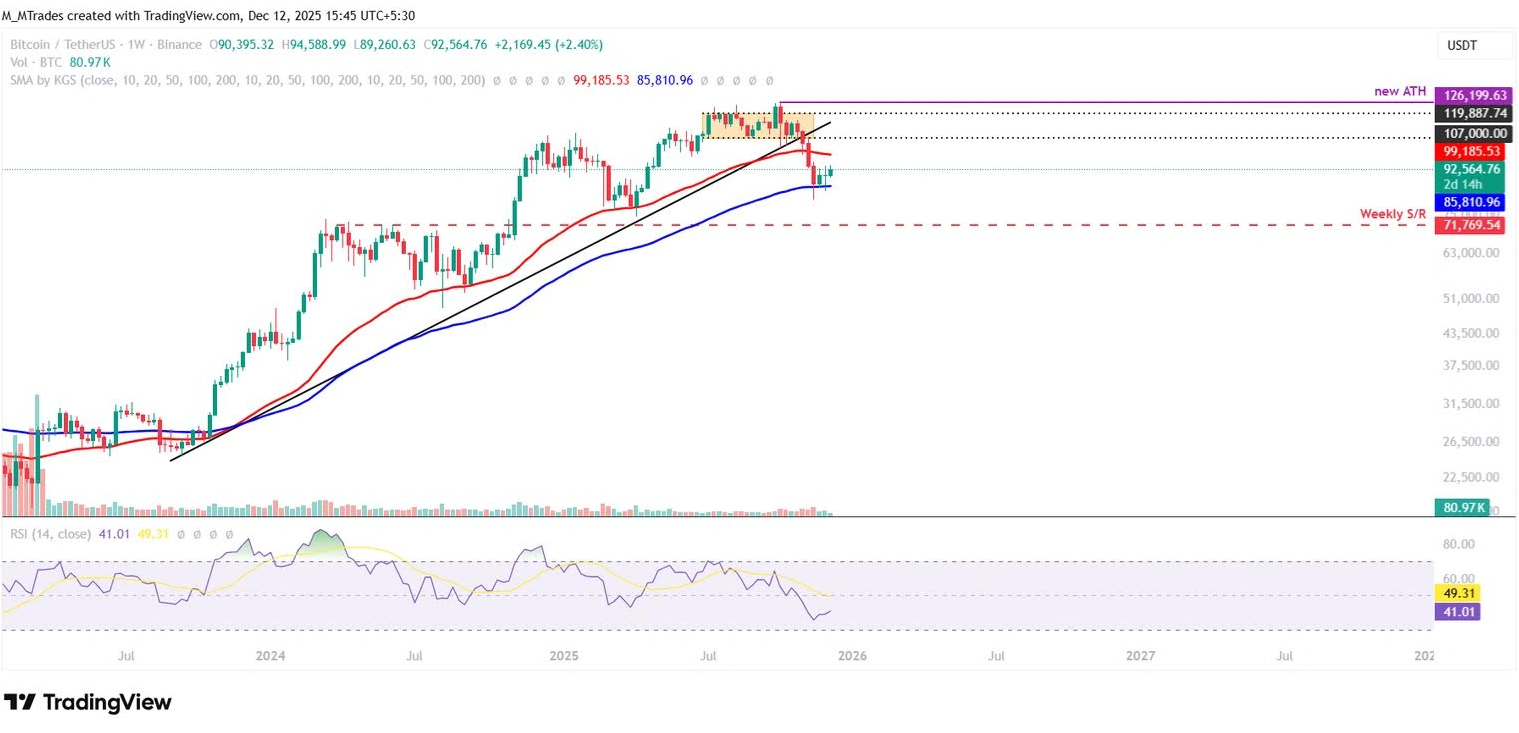
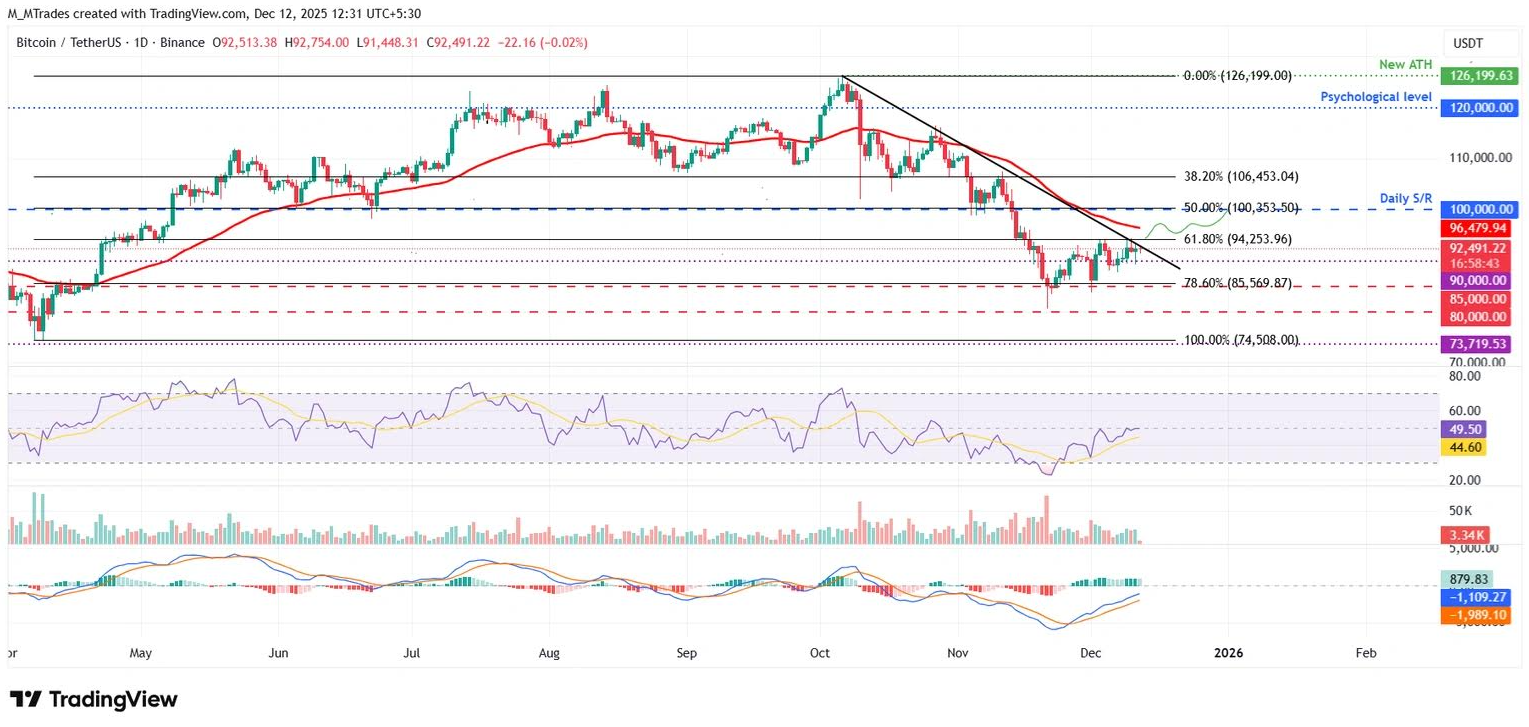
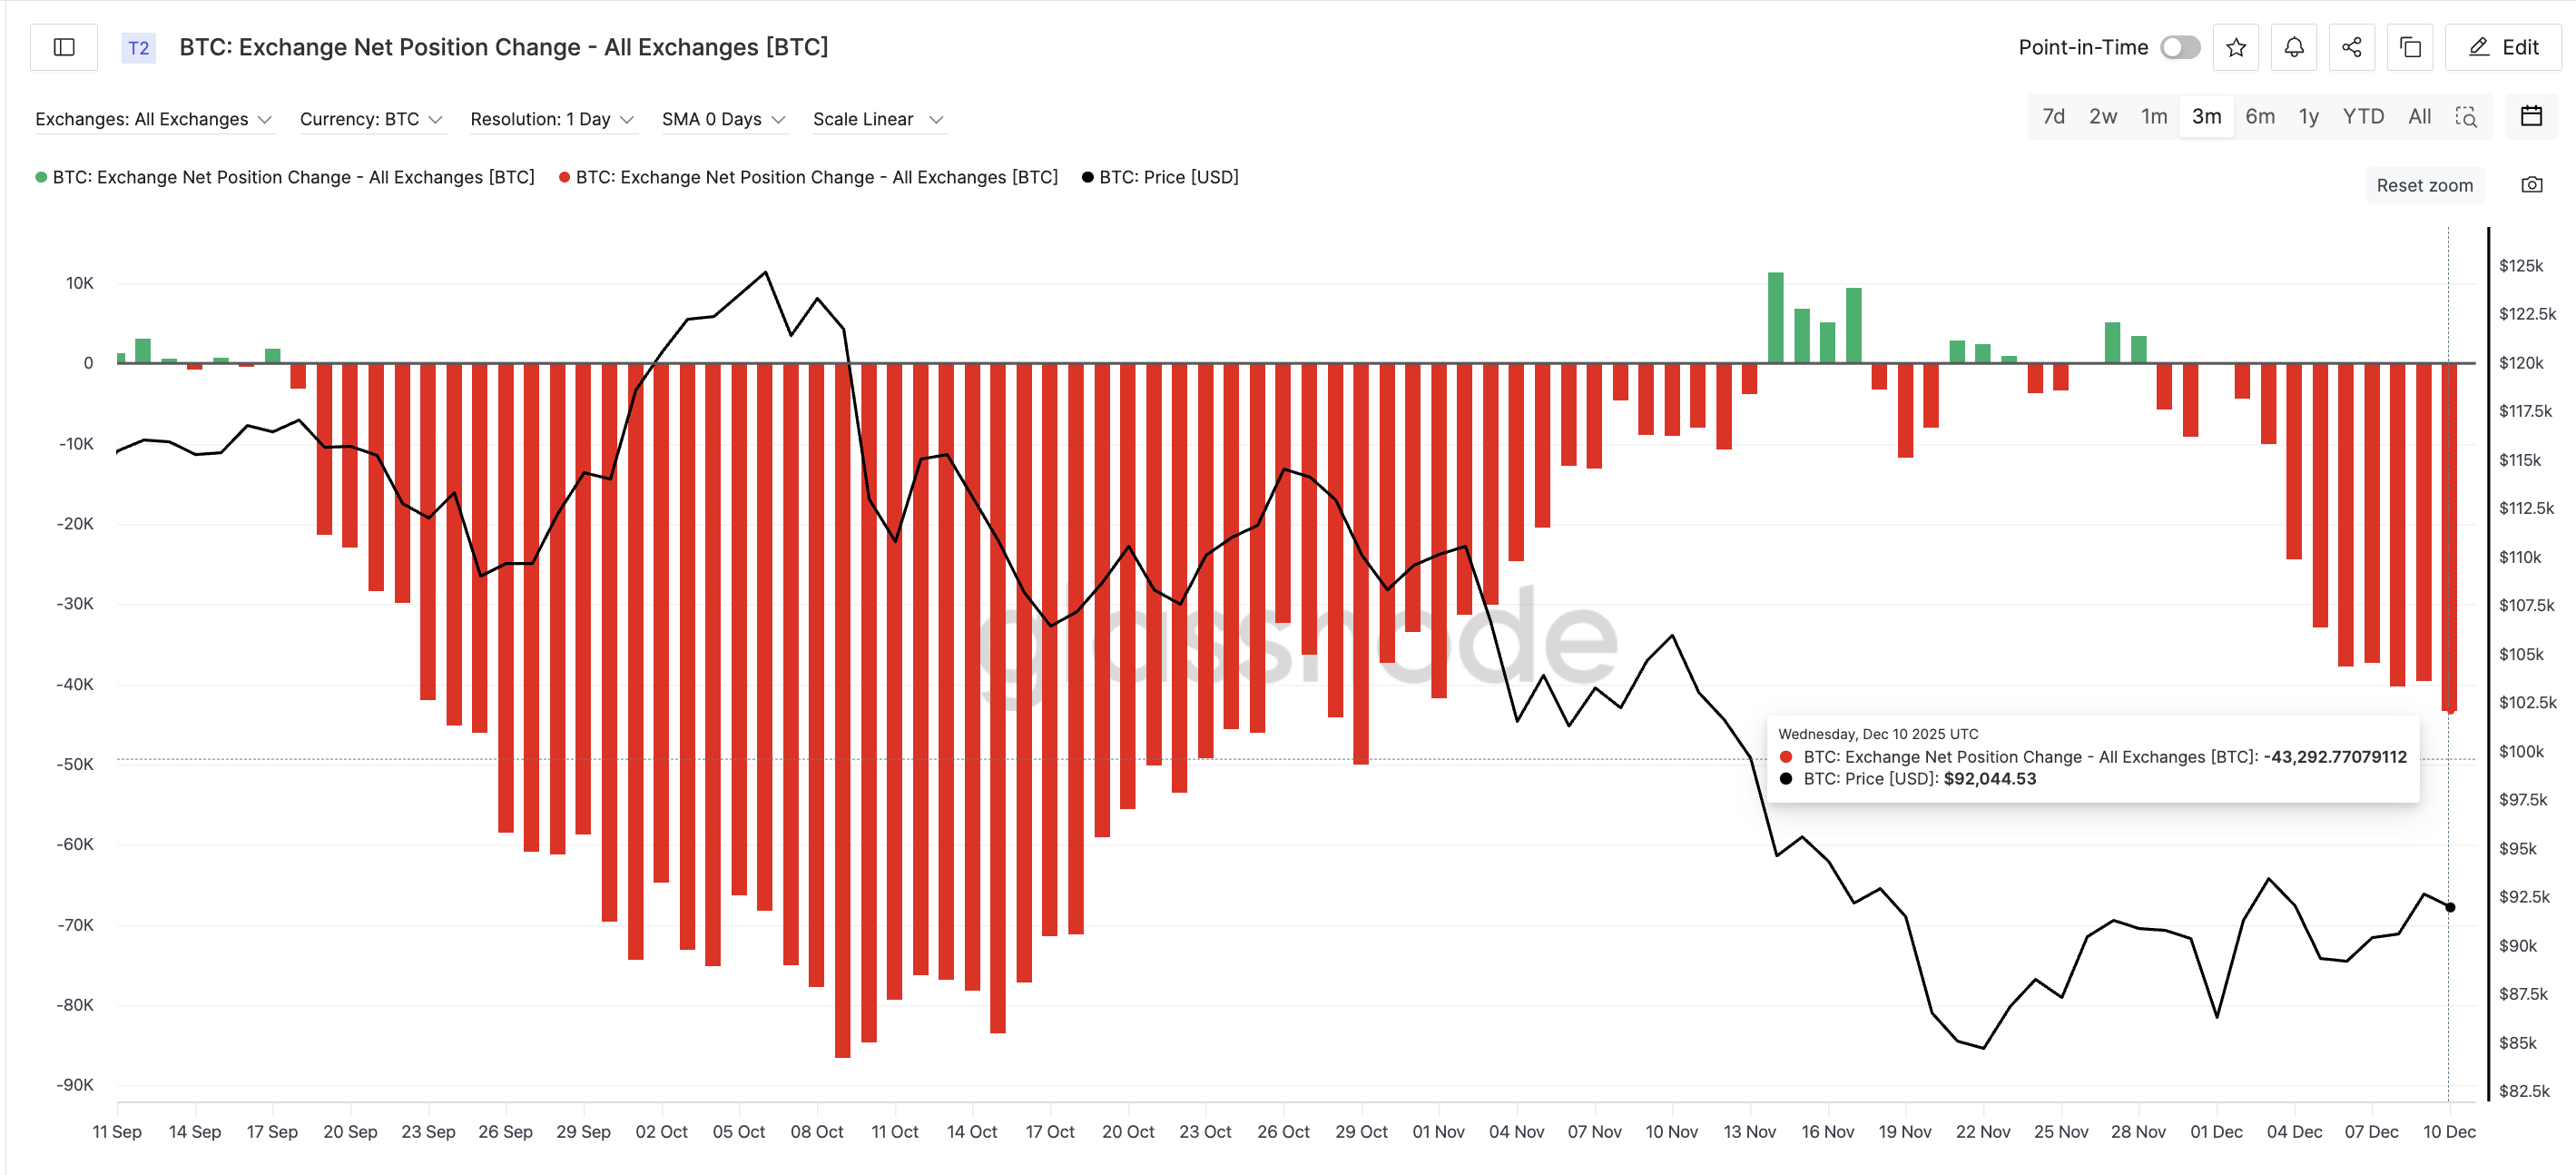
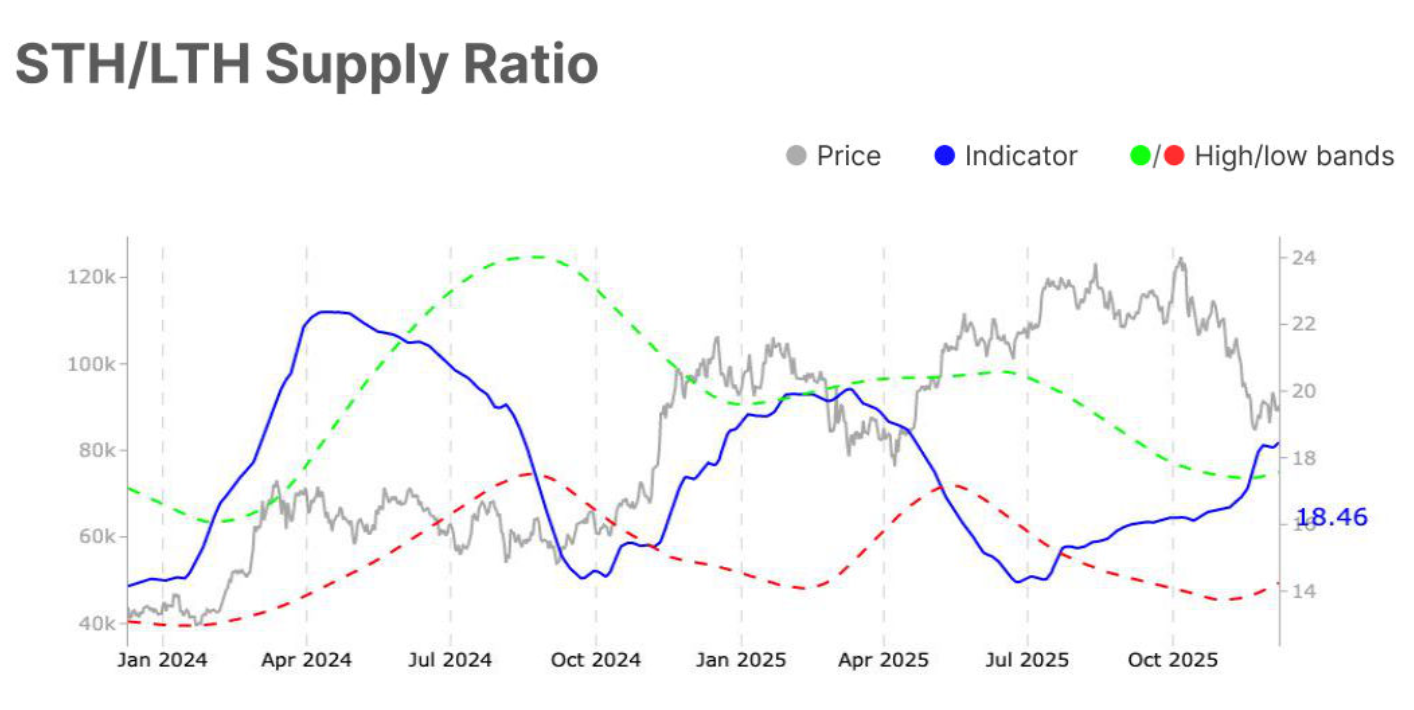
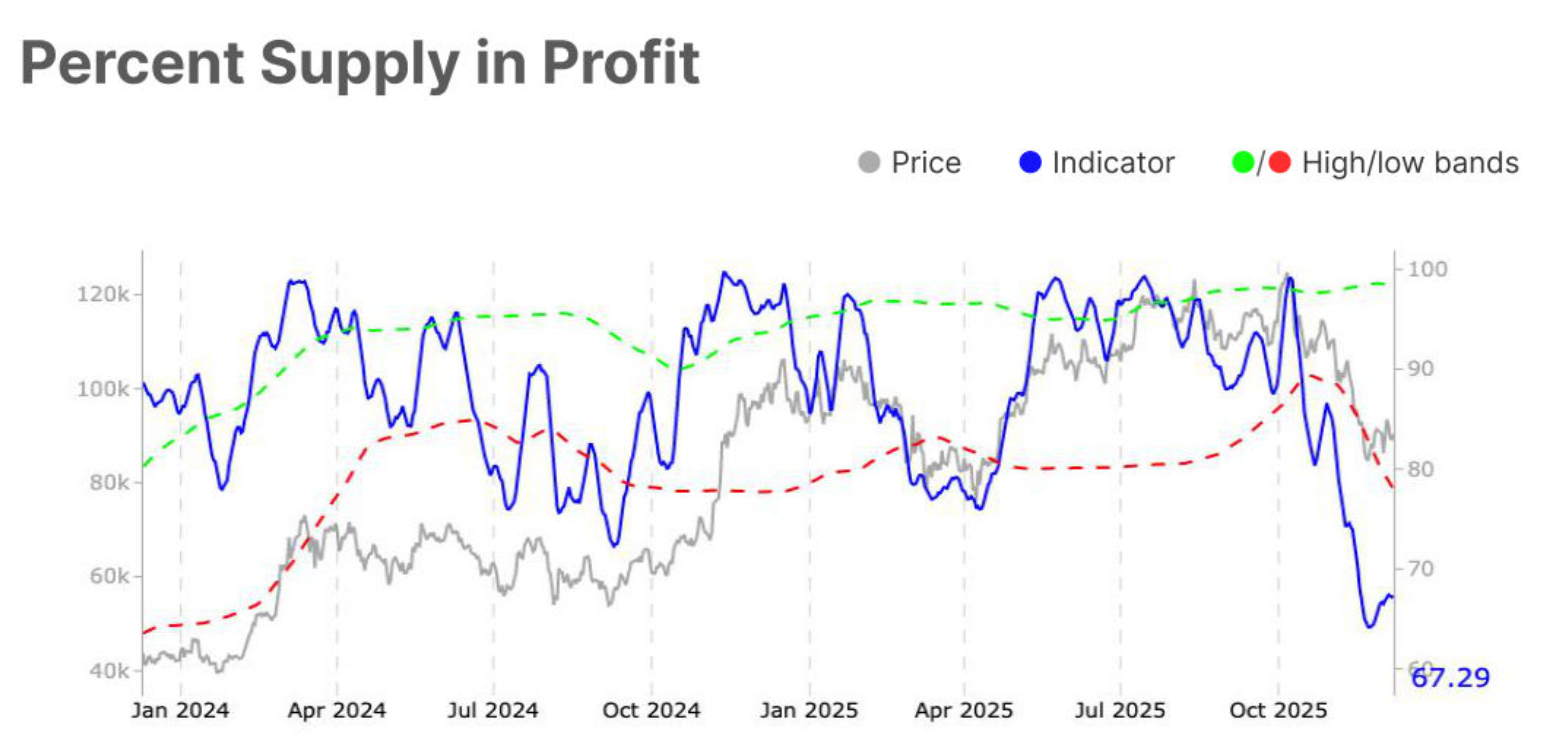
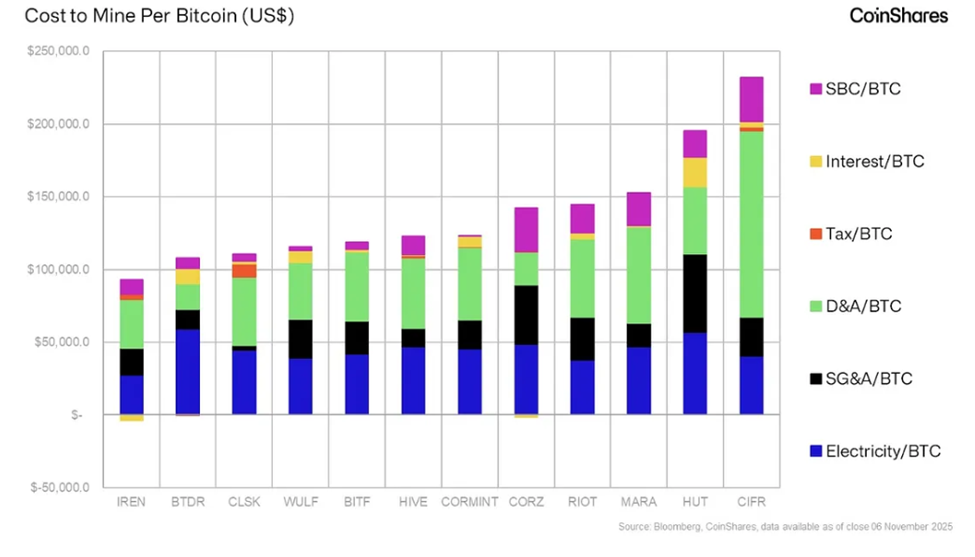
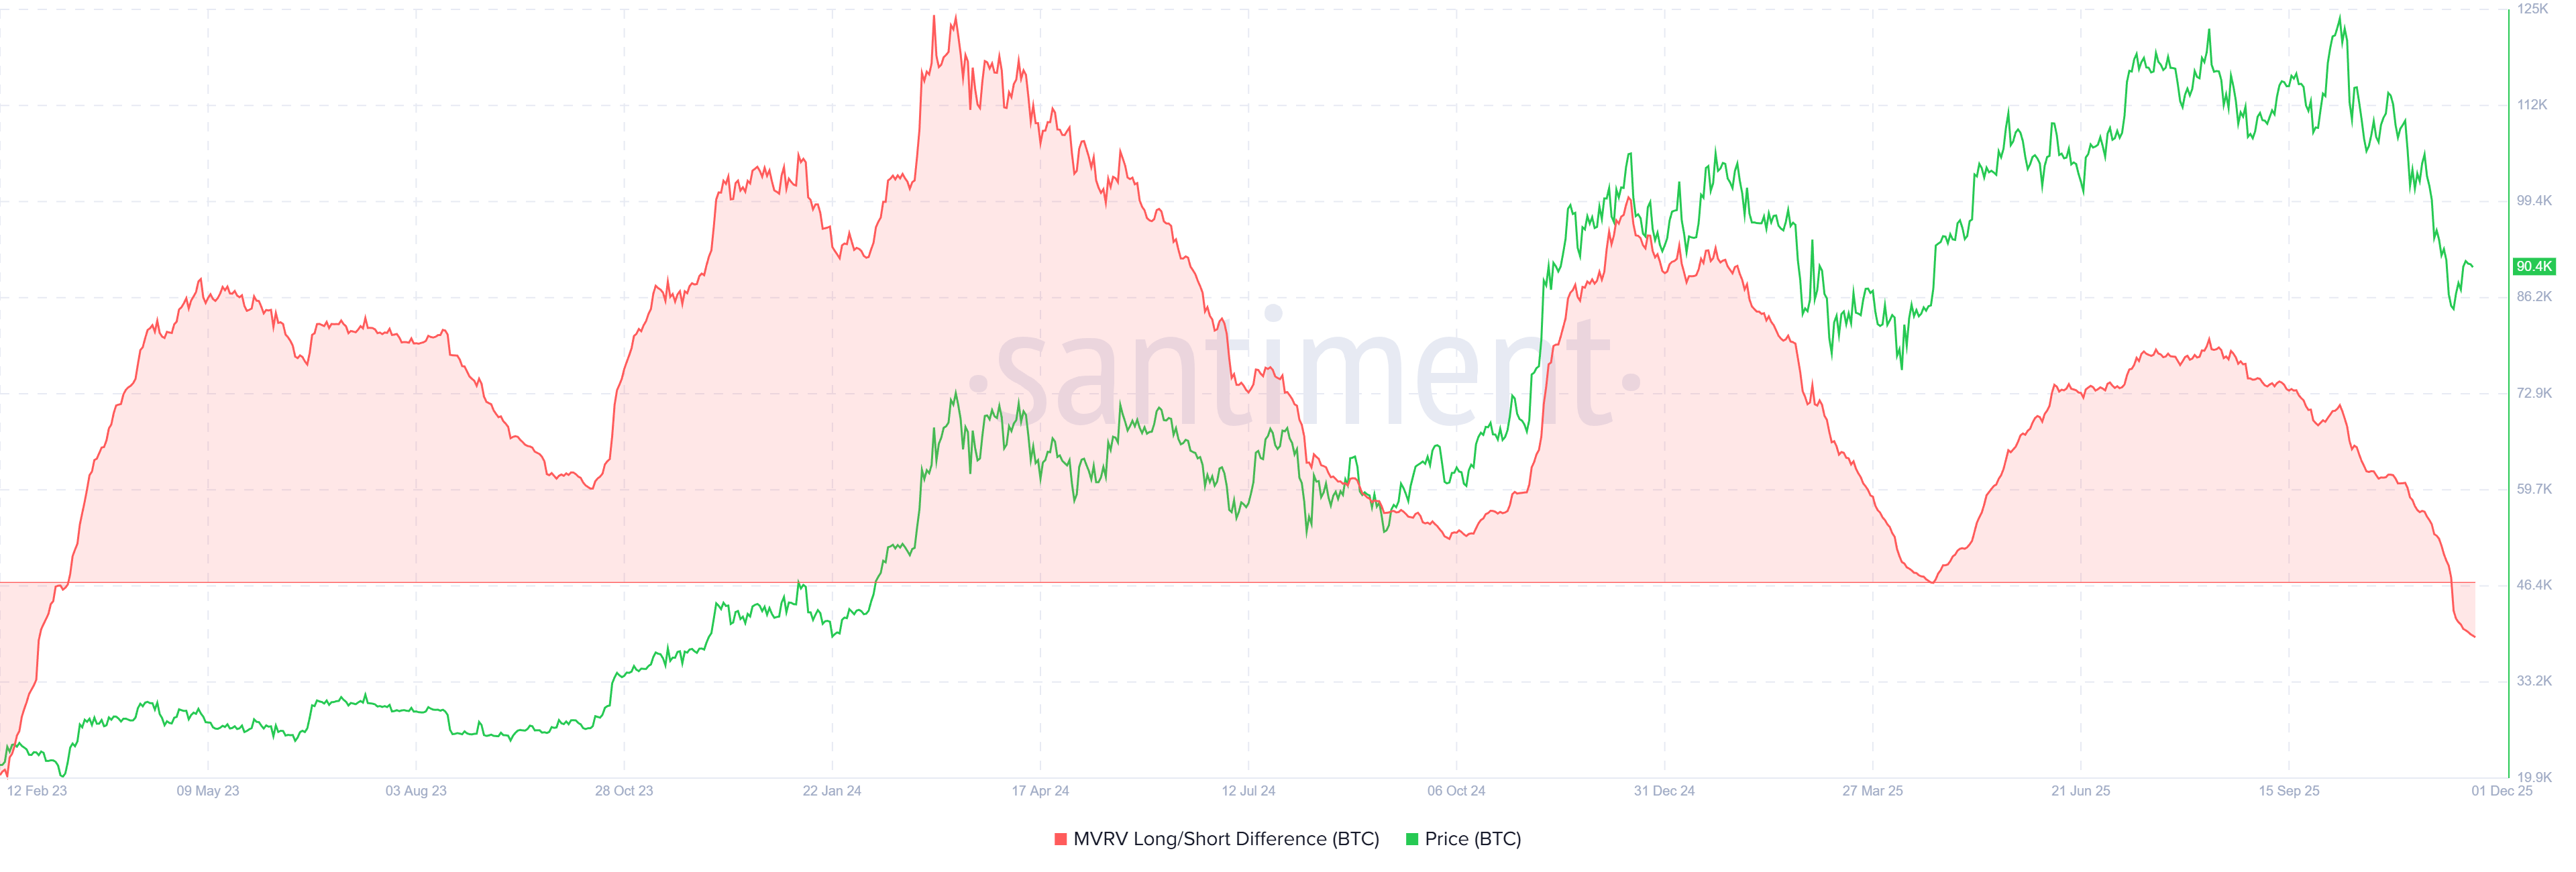
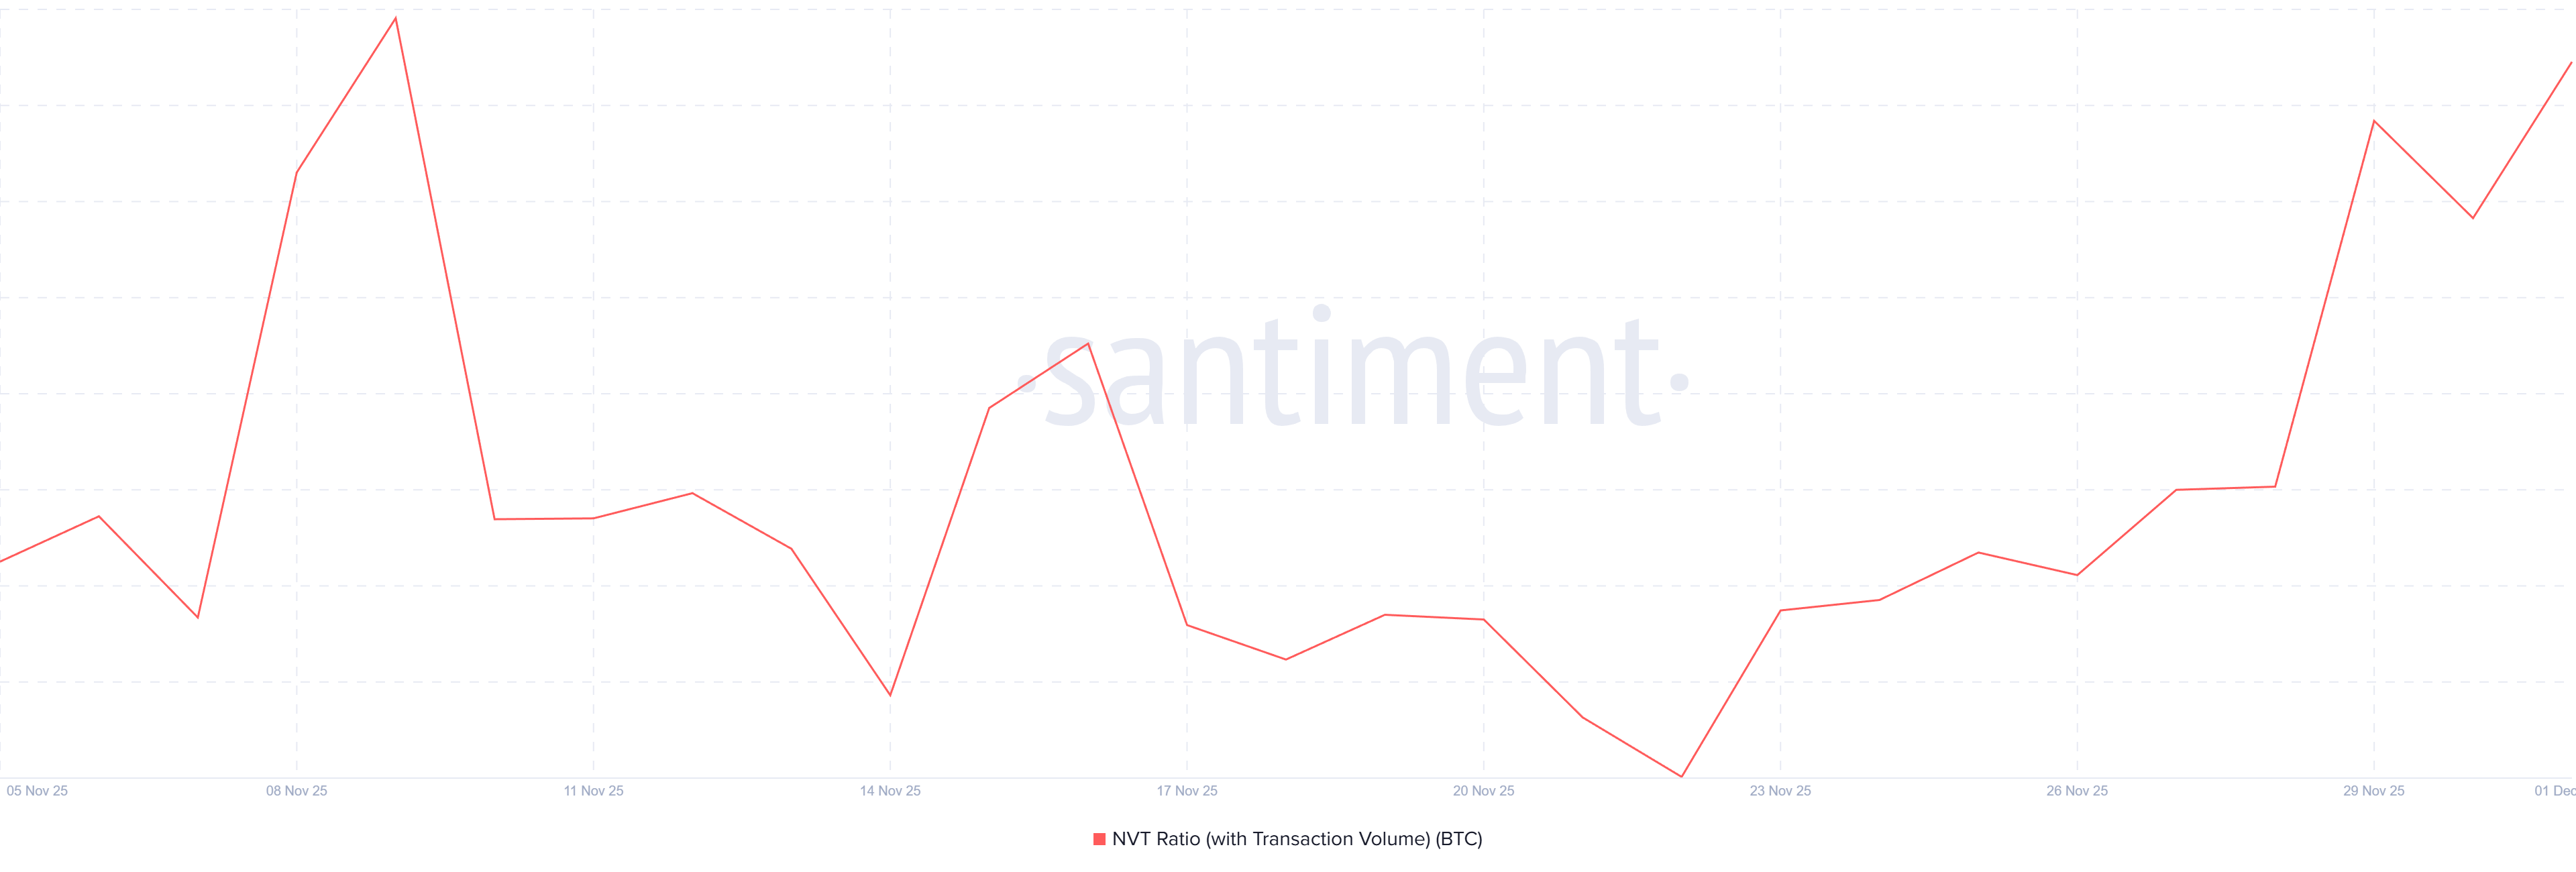
Chart of the Day
Byte-Sized Alpha
Here’s a summary of more US crypto news to follow today:
- What does a 100% accurate historical indicator signal for Bitcoin in December?
- ADA is down 70% in 2025 —But two new sources of demand are emerging for Cardano.
- Is Toncoin undervalued? December data signals potential rebound.
- XRP selling pressure collapses 39%, but this price level still controls the outcome.
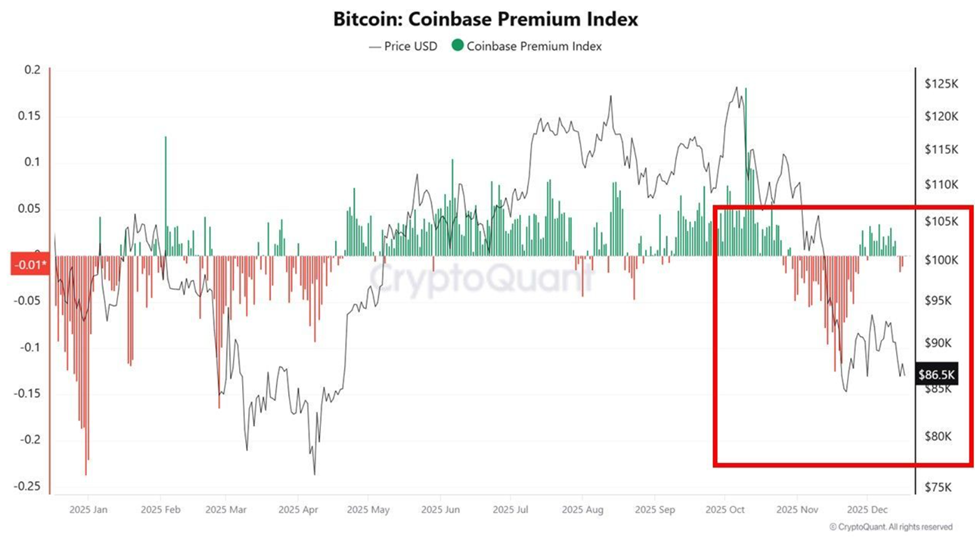
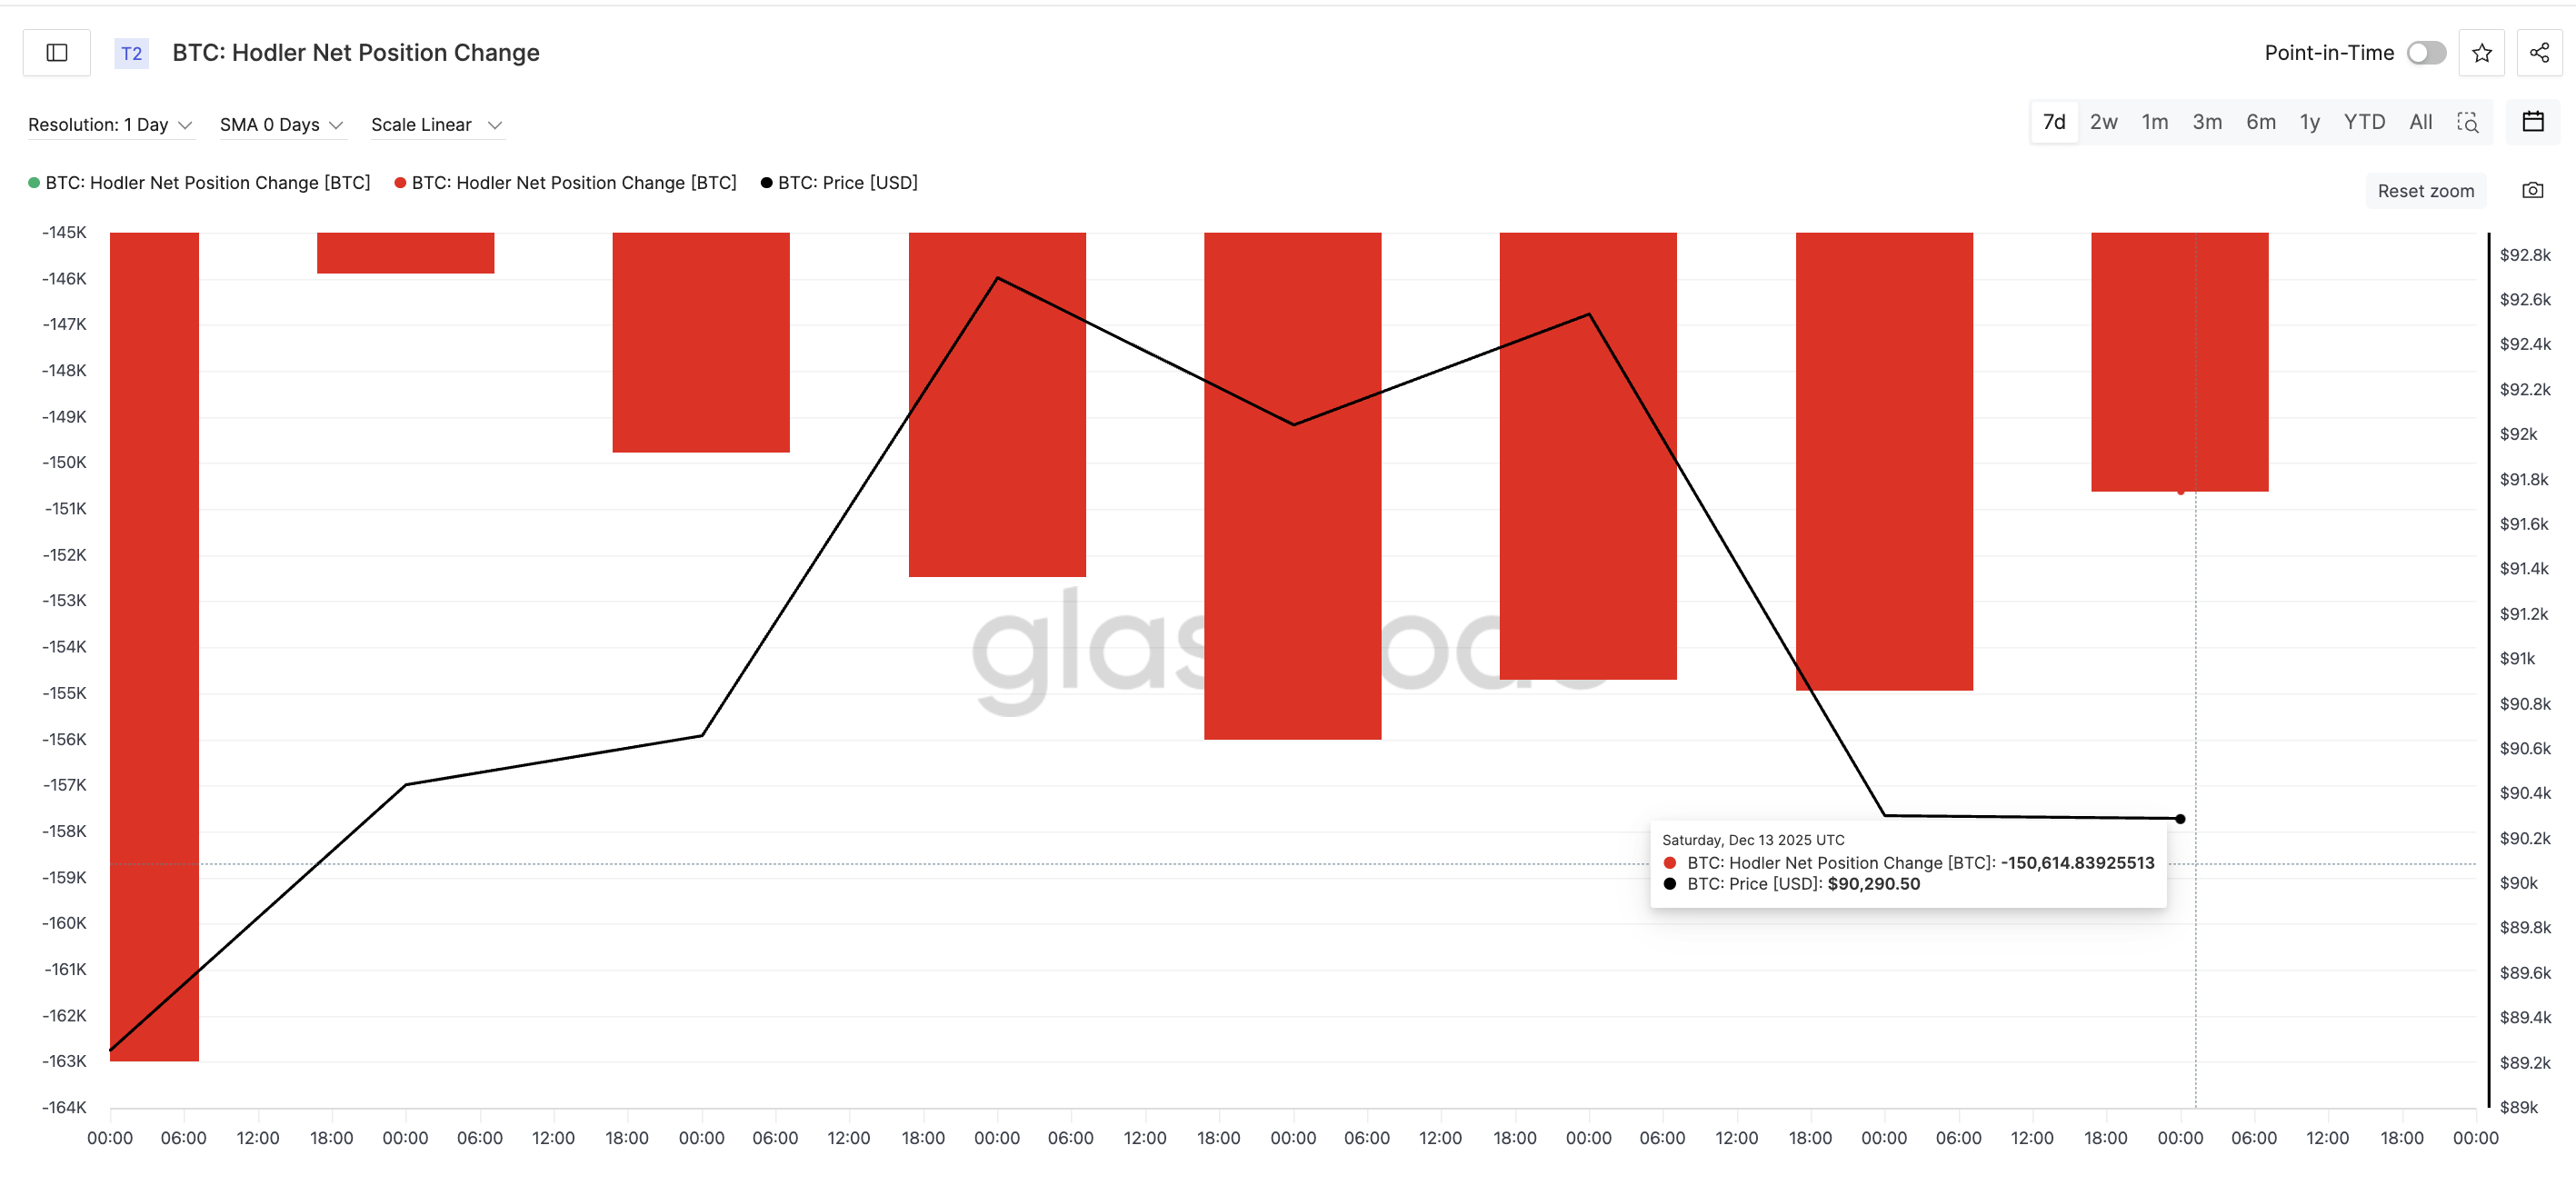
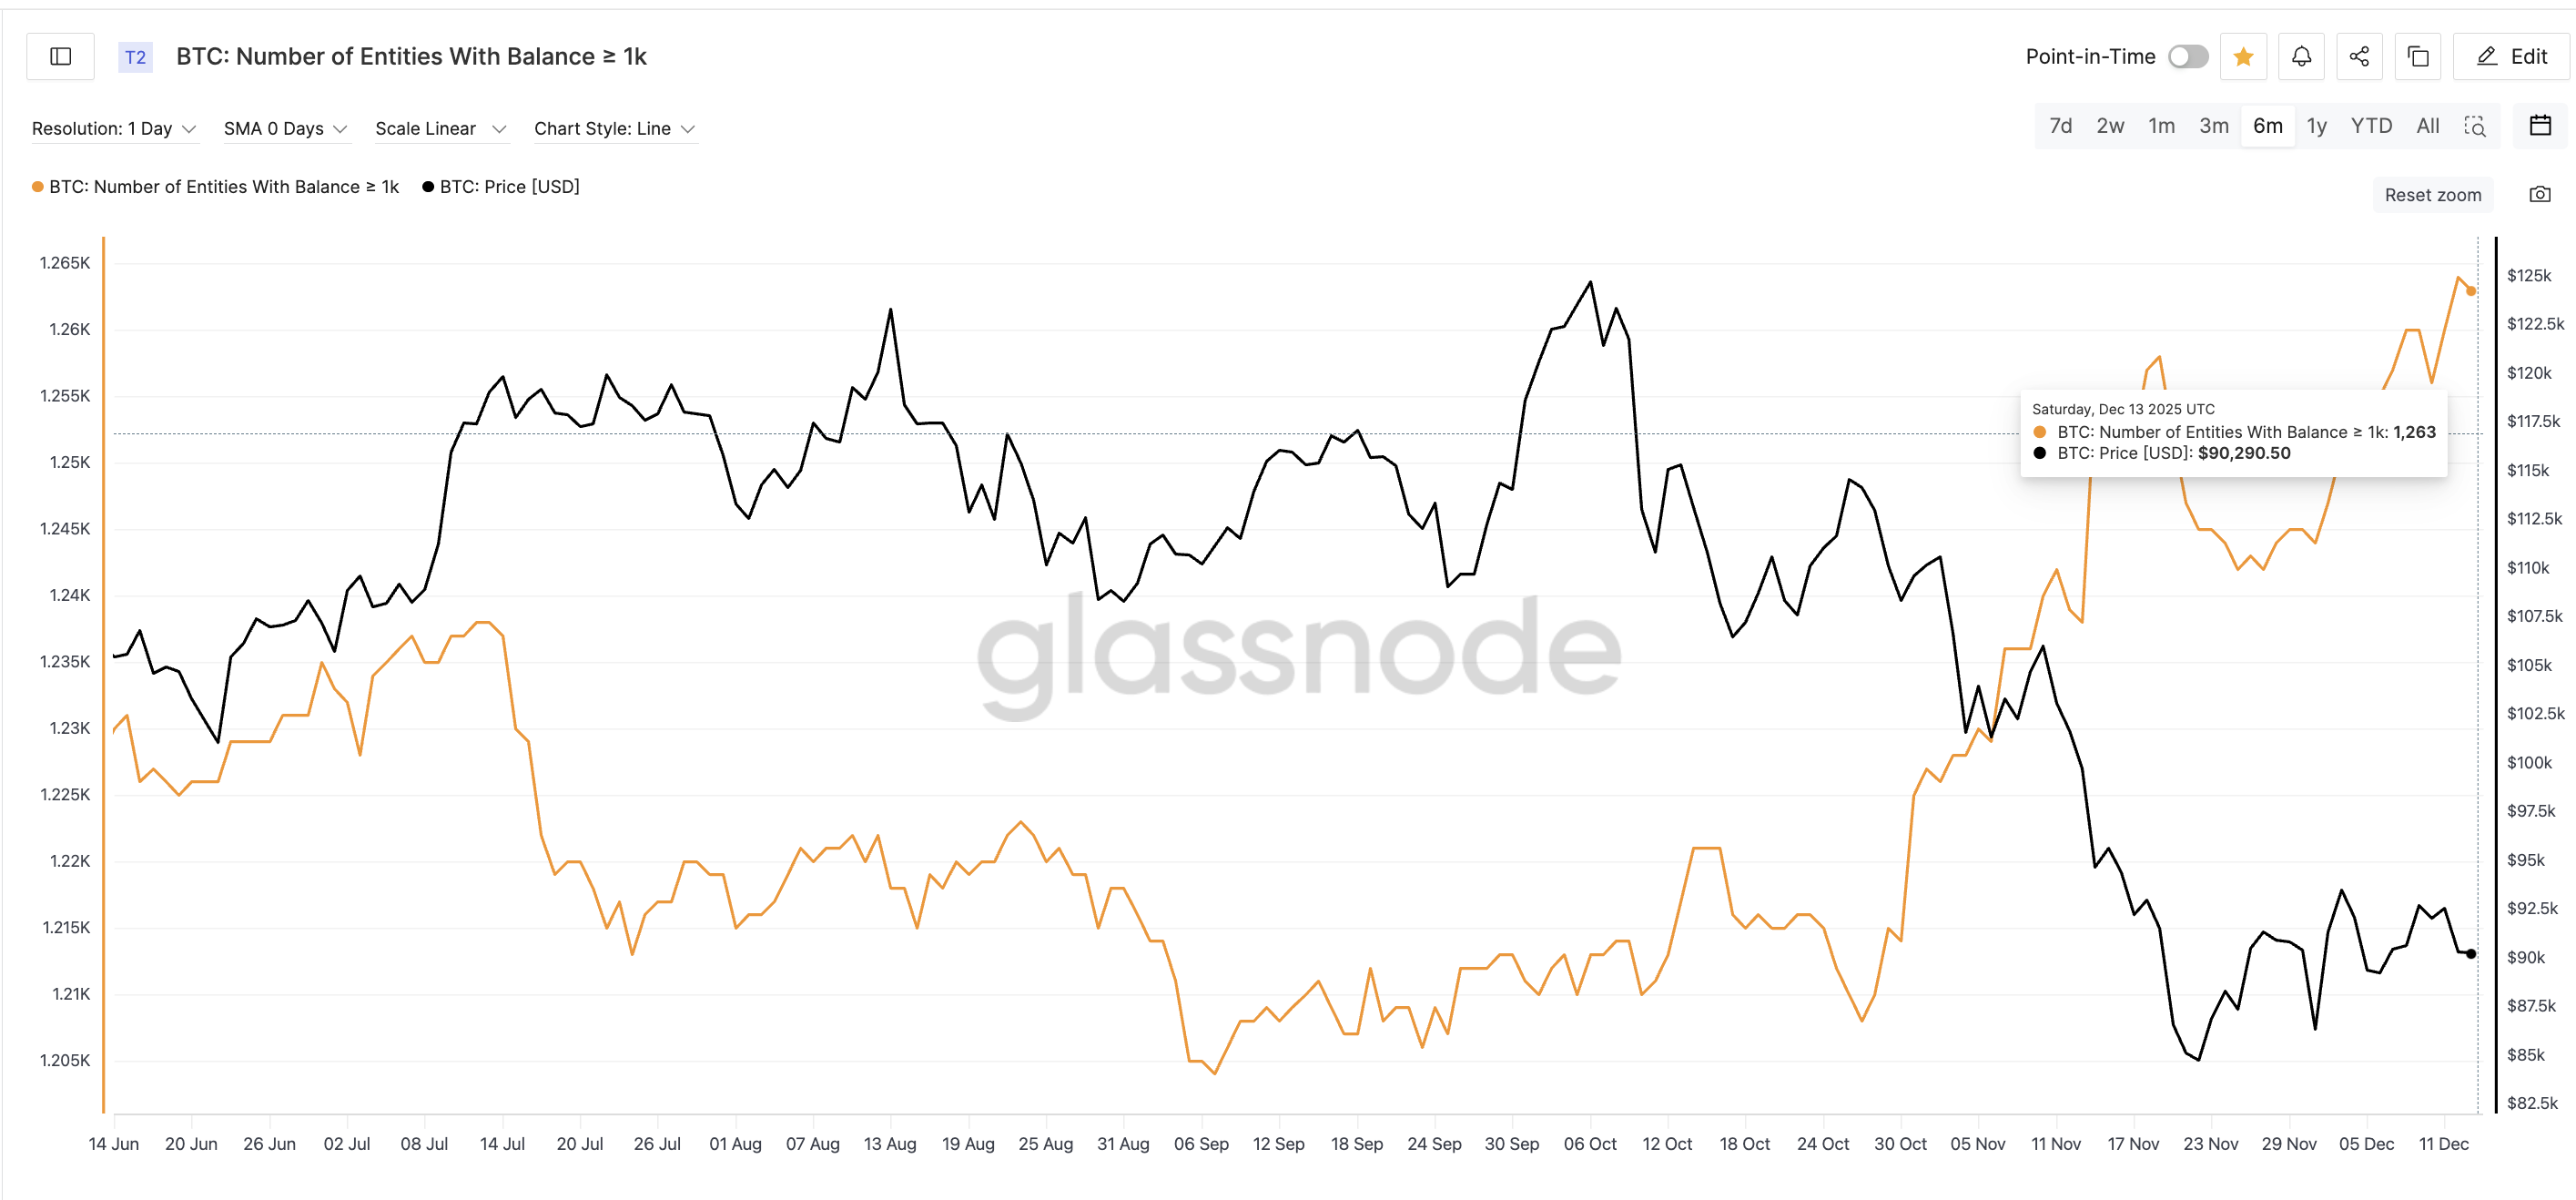
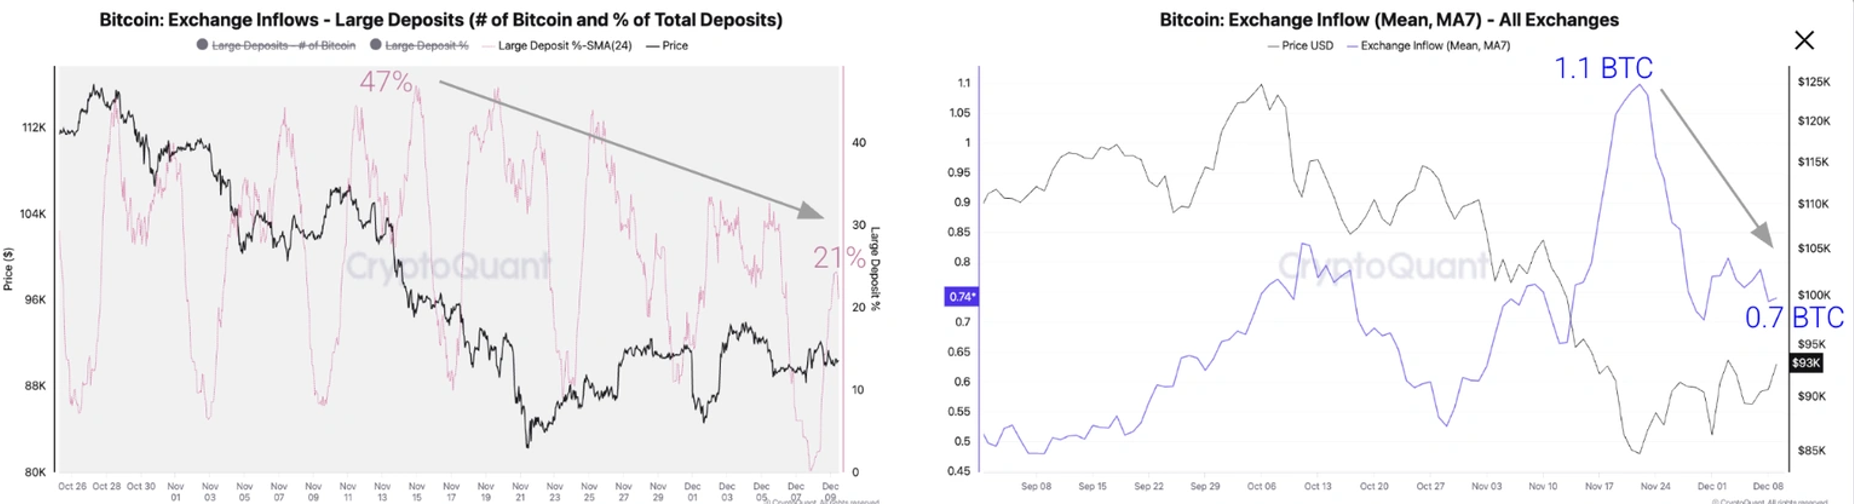
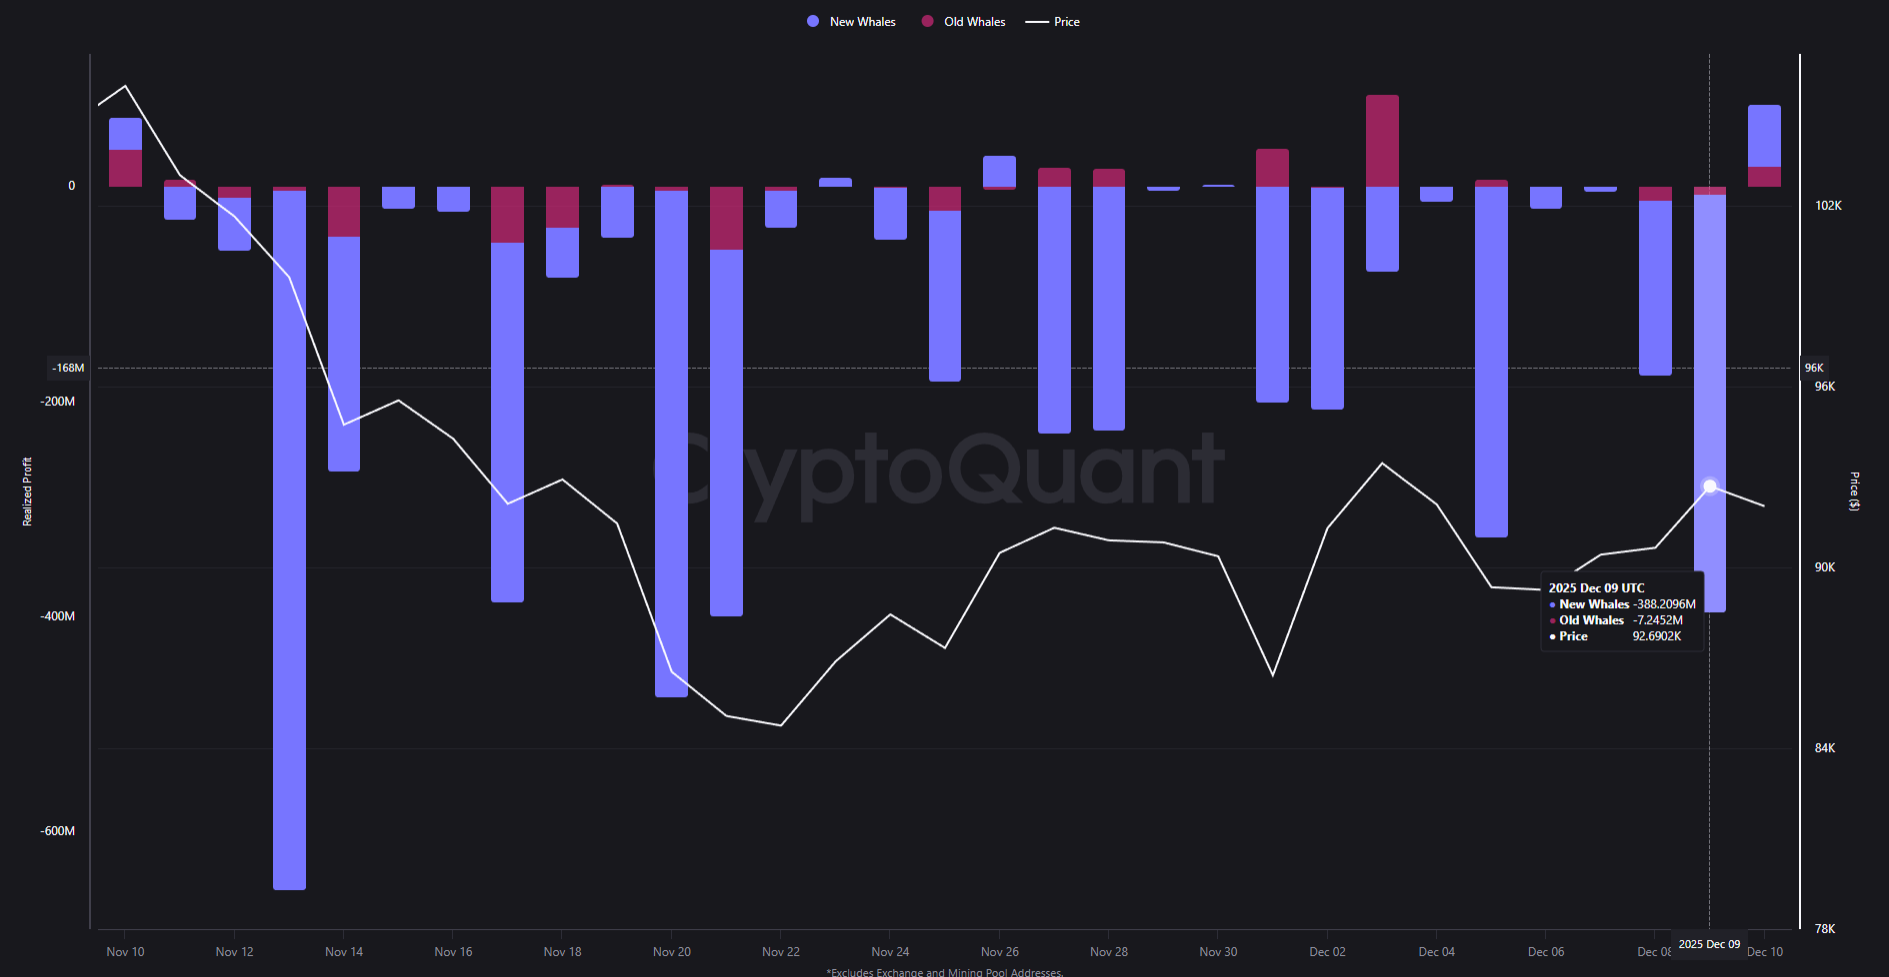
- Bitcoin whales moved — But not in the way markets assumed.
Crypto Equities Pre-Market Overview
| Company | At the Close of December 18 | Pre-Market Overview |
| Strategy (MSTR) | $158.24 | $163.97 (+3.62%) |
| Coinbase (COIN) | $239.20 | $246.00 (+2.84%) |
| Galaxy Digital Holdings (GLXY) | $22.51 | $22.95 (+1.95%) |
| MARA Holdings (MARA) | $9.69 | $9.87 (+1.86%) |
| Riot Platforms (RIOT) | $13.38 | $13.73 (+2.62%) |
| Core Scientific (CORZ) | $14.56 | $15.04 (+3.30%) |
The post Japan Tightens, America Eases: Which Central Bank Really Moves Markets Now? | US Crypto News appeared first on BeInCrypto.