Reading view

90% of HBAR Buyers Are Gone — Is Price Breakdown Now the Base Case?

Hedera is moving into a risky zone. Over the past month, buying pressure has dropped by nearly 90%, even as the HBAR price continues to slide. While the broader crypto market is trying to stabilize, Hedera is not seeing the same response, especially on the charts.

Buyers are stepping away instead of buying dips. At this point, a downside break is no longer a low-chance outcome. It is starting to look like the base case.

Spot Buying Has Almost Vanished as Downtrend Stays Intact

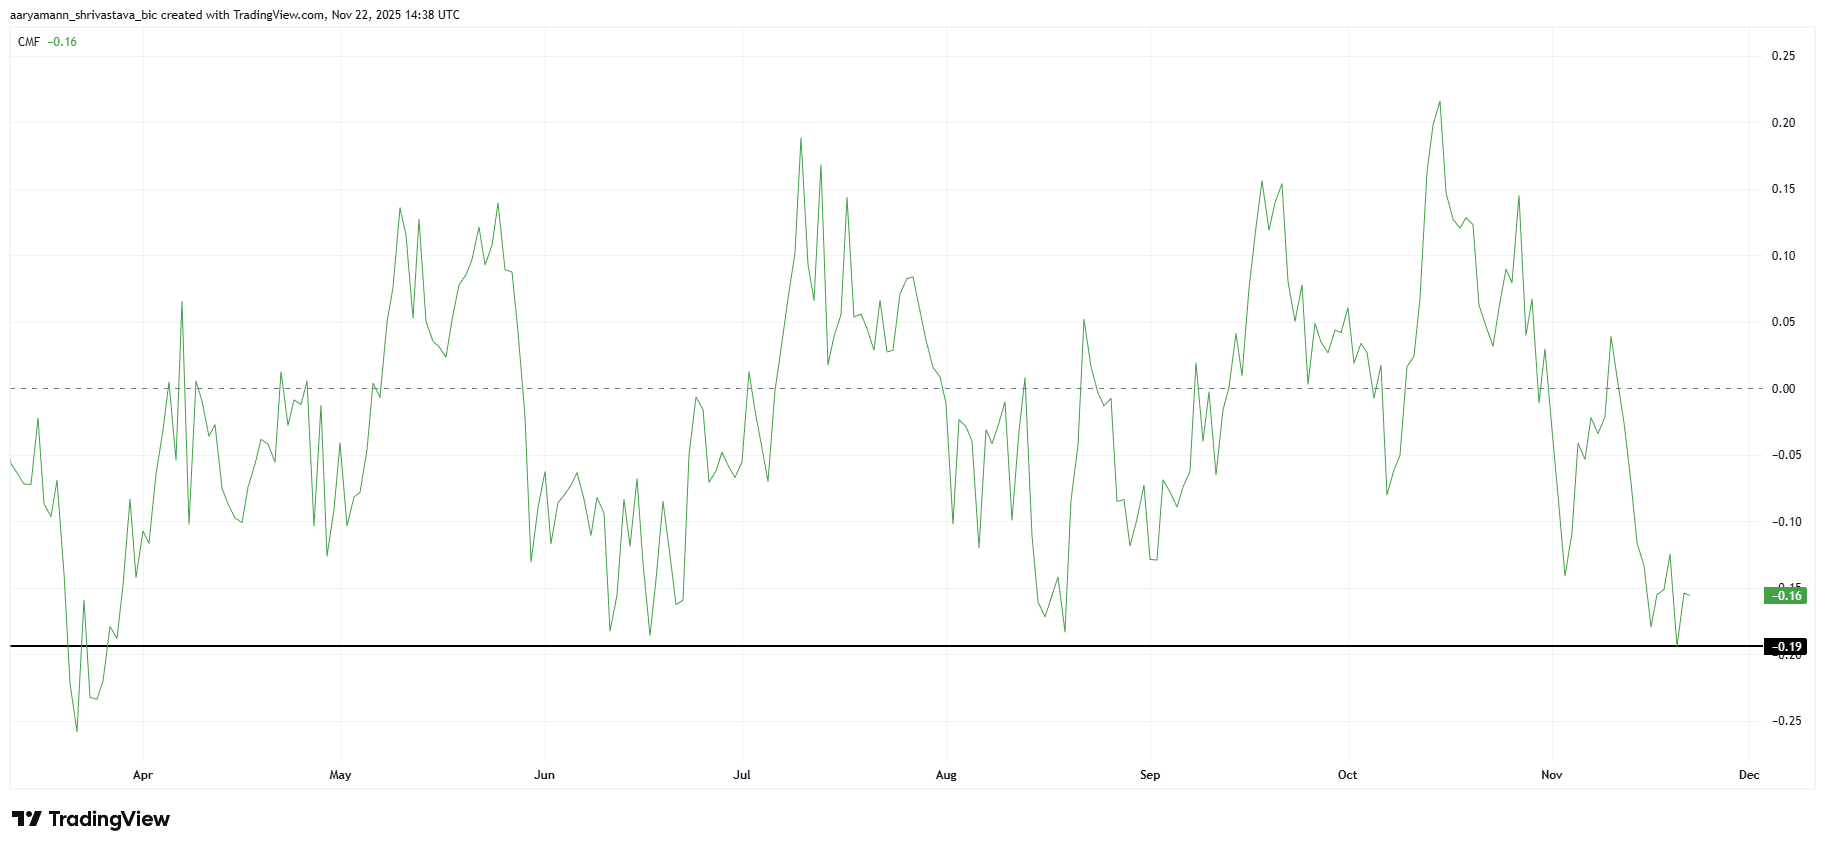
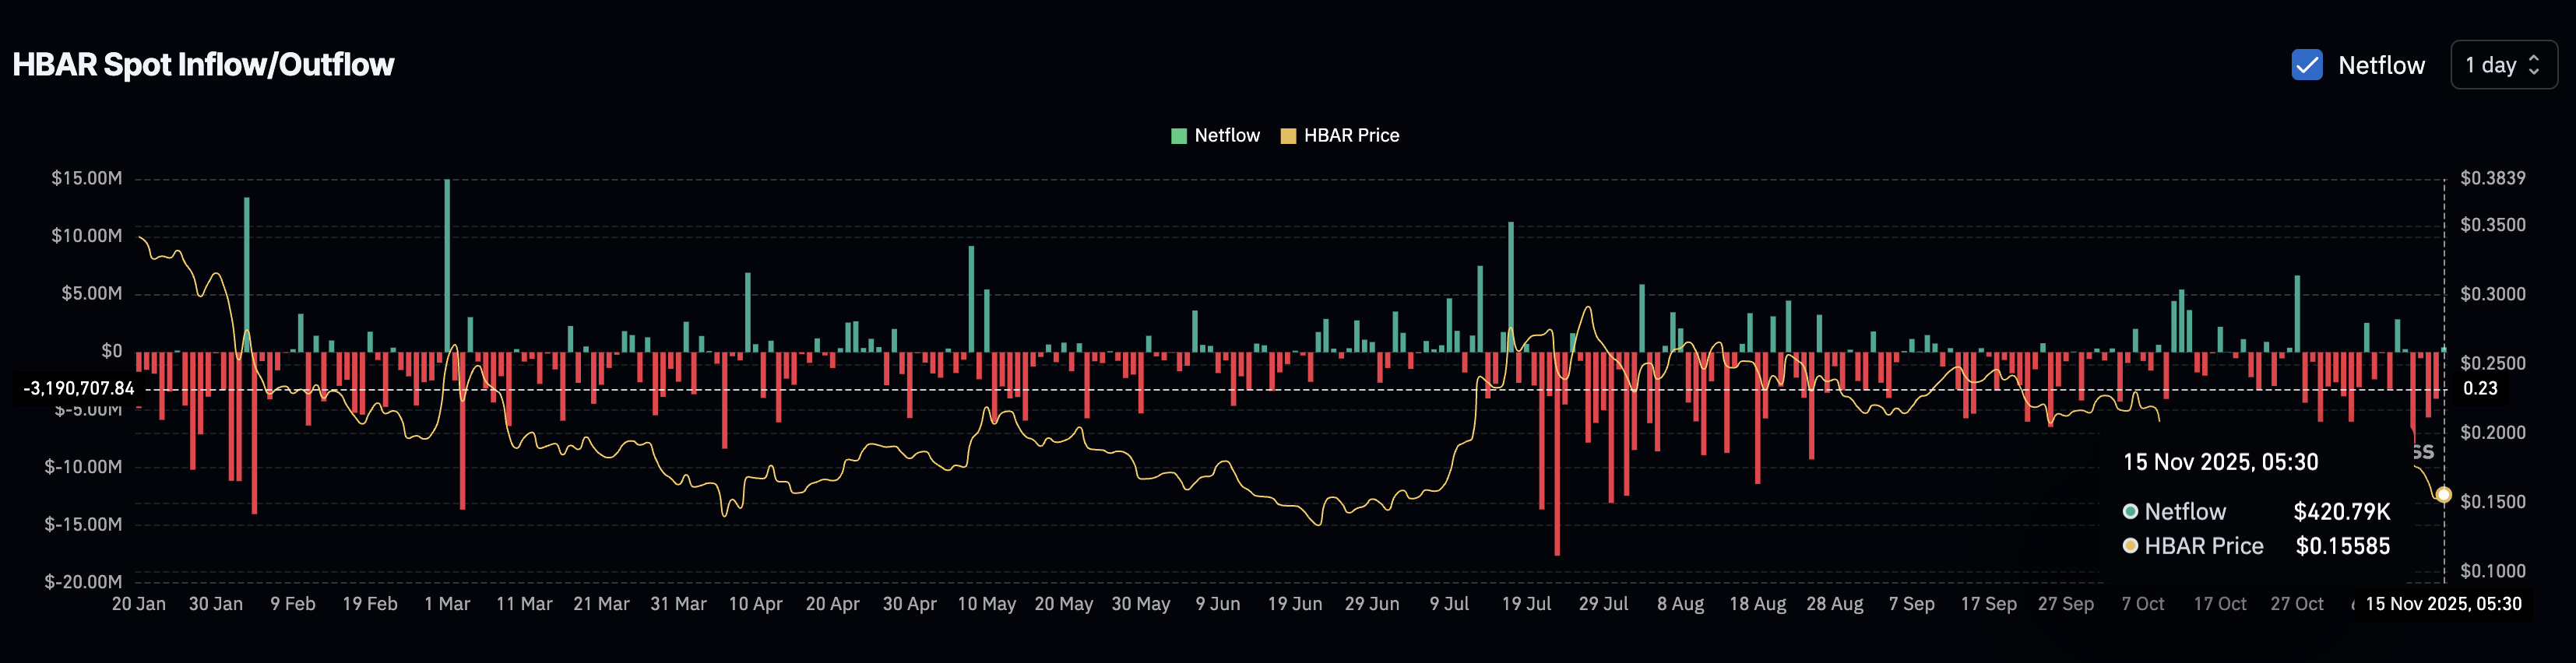
The HBAR spot market shows the clearest warning.

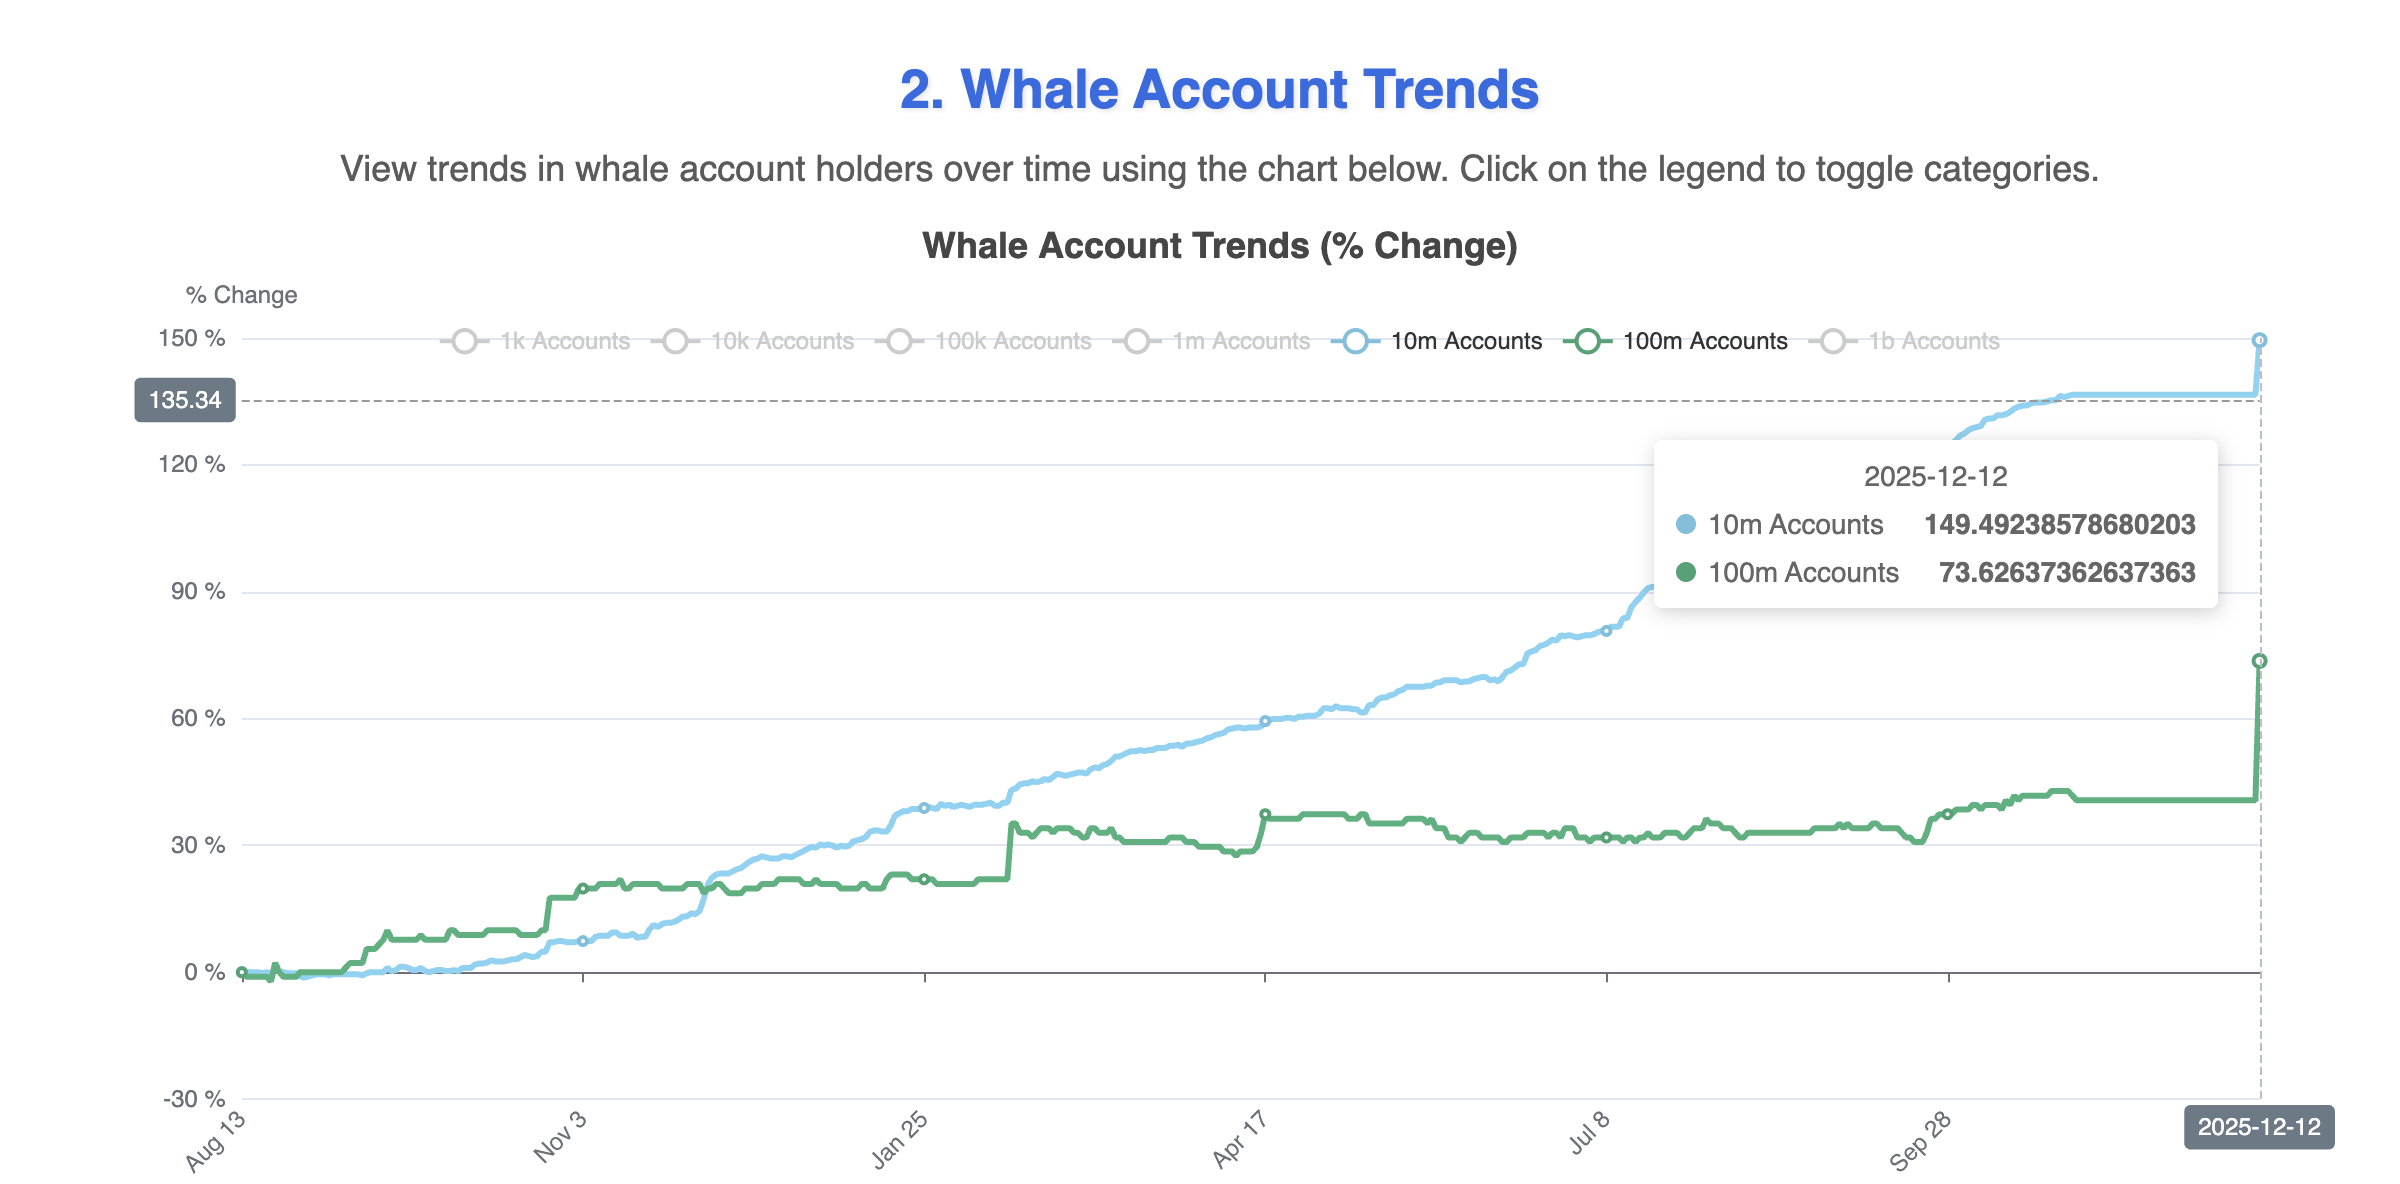
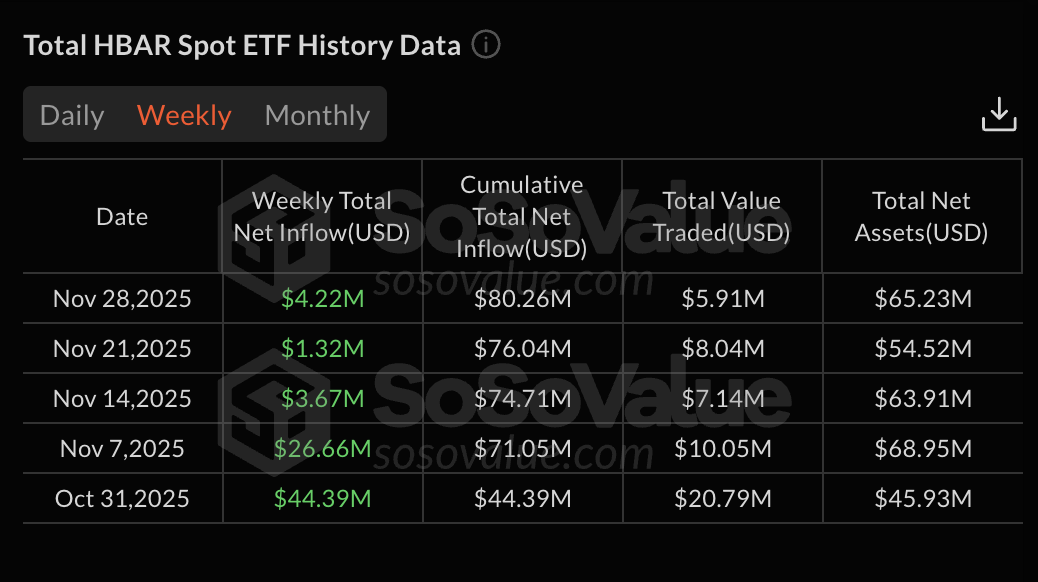
In the week ending November 10, Hedera recorded spot outflows of approximately $26.7 million, indicating strong buying as coins moved off exchanges. By the week ending December 15, that number fell to just $2.4 million. That is a collapse of roughly 90% in buying pressure in little more than a month.

Buyers Leaving
Buyers Leaving: Coinglass

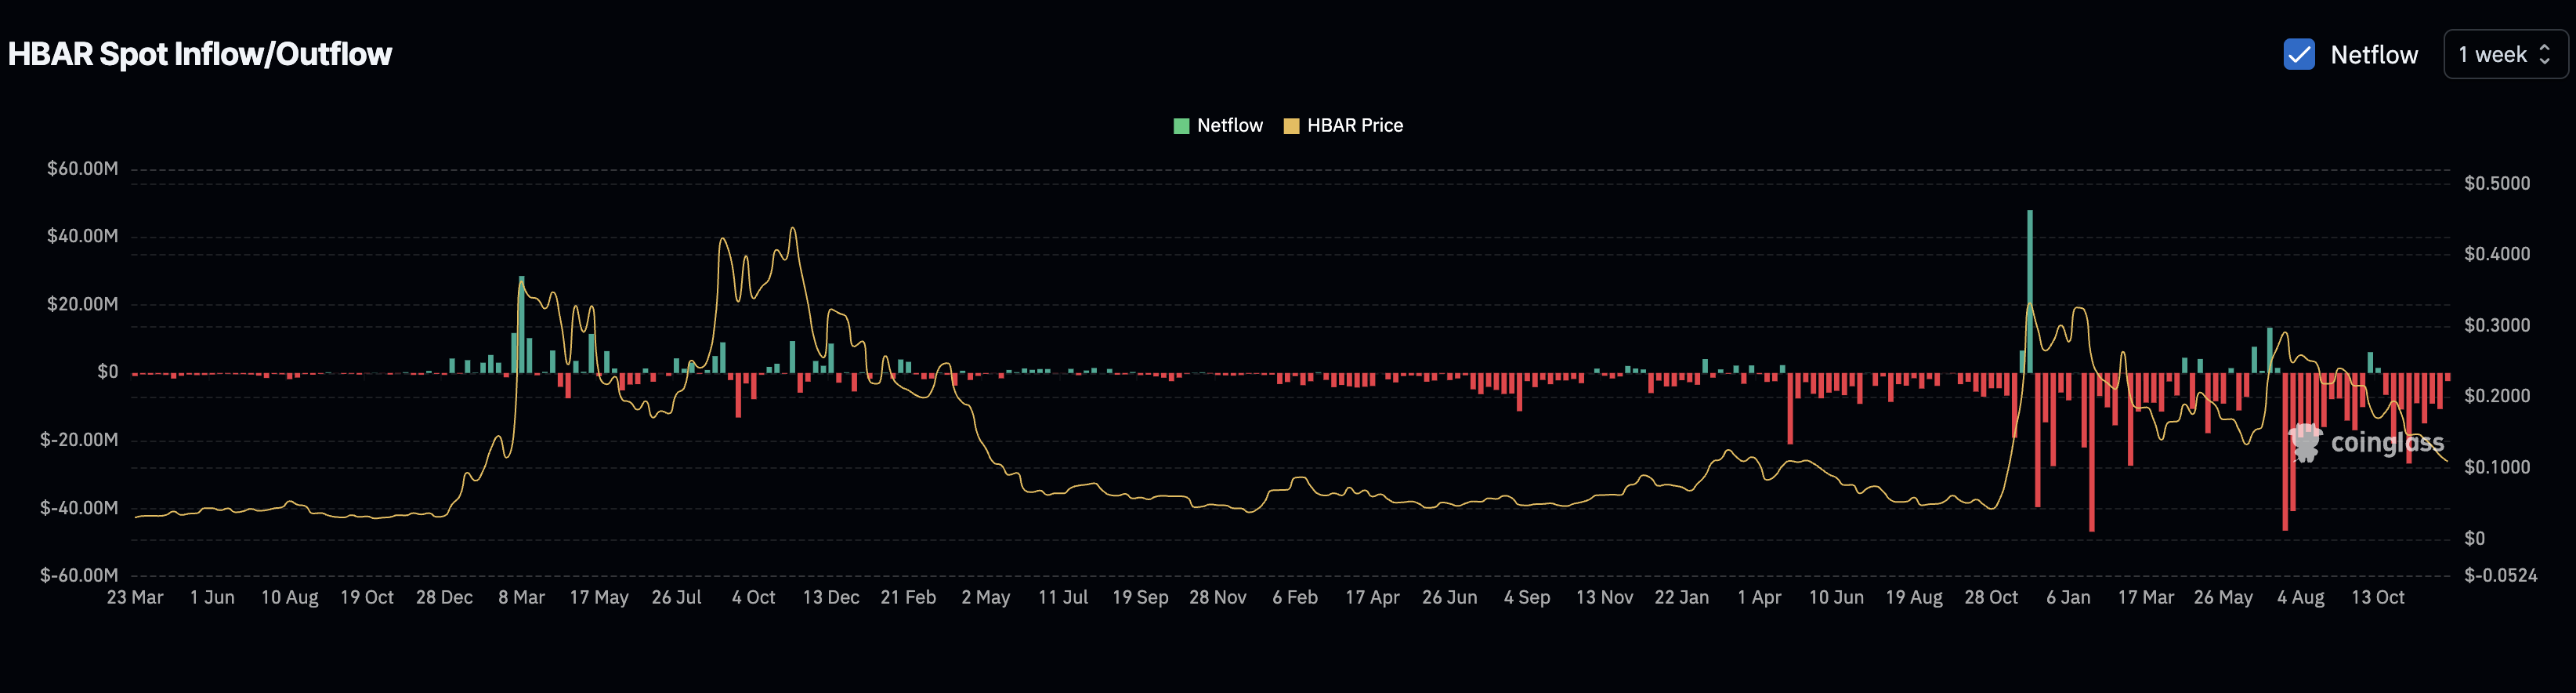
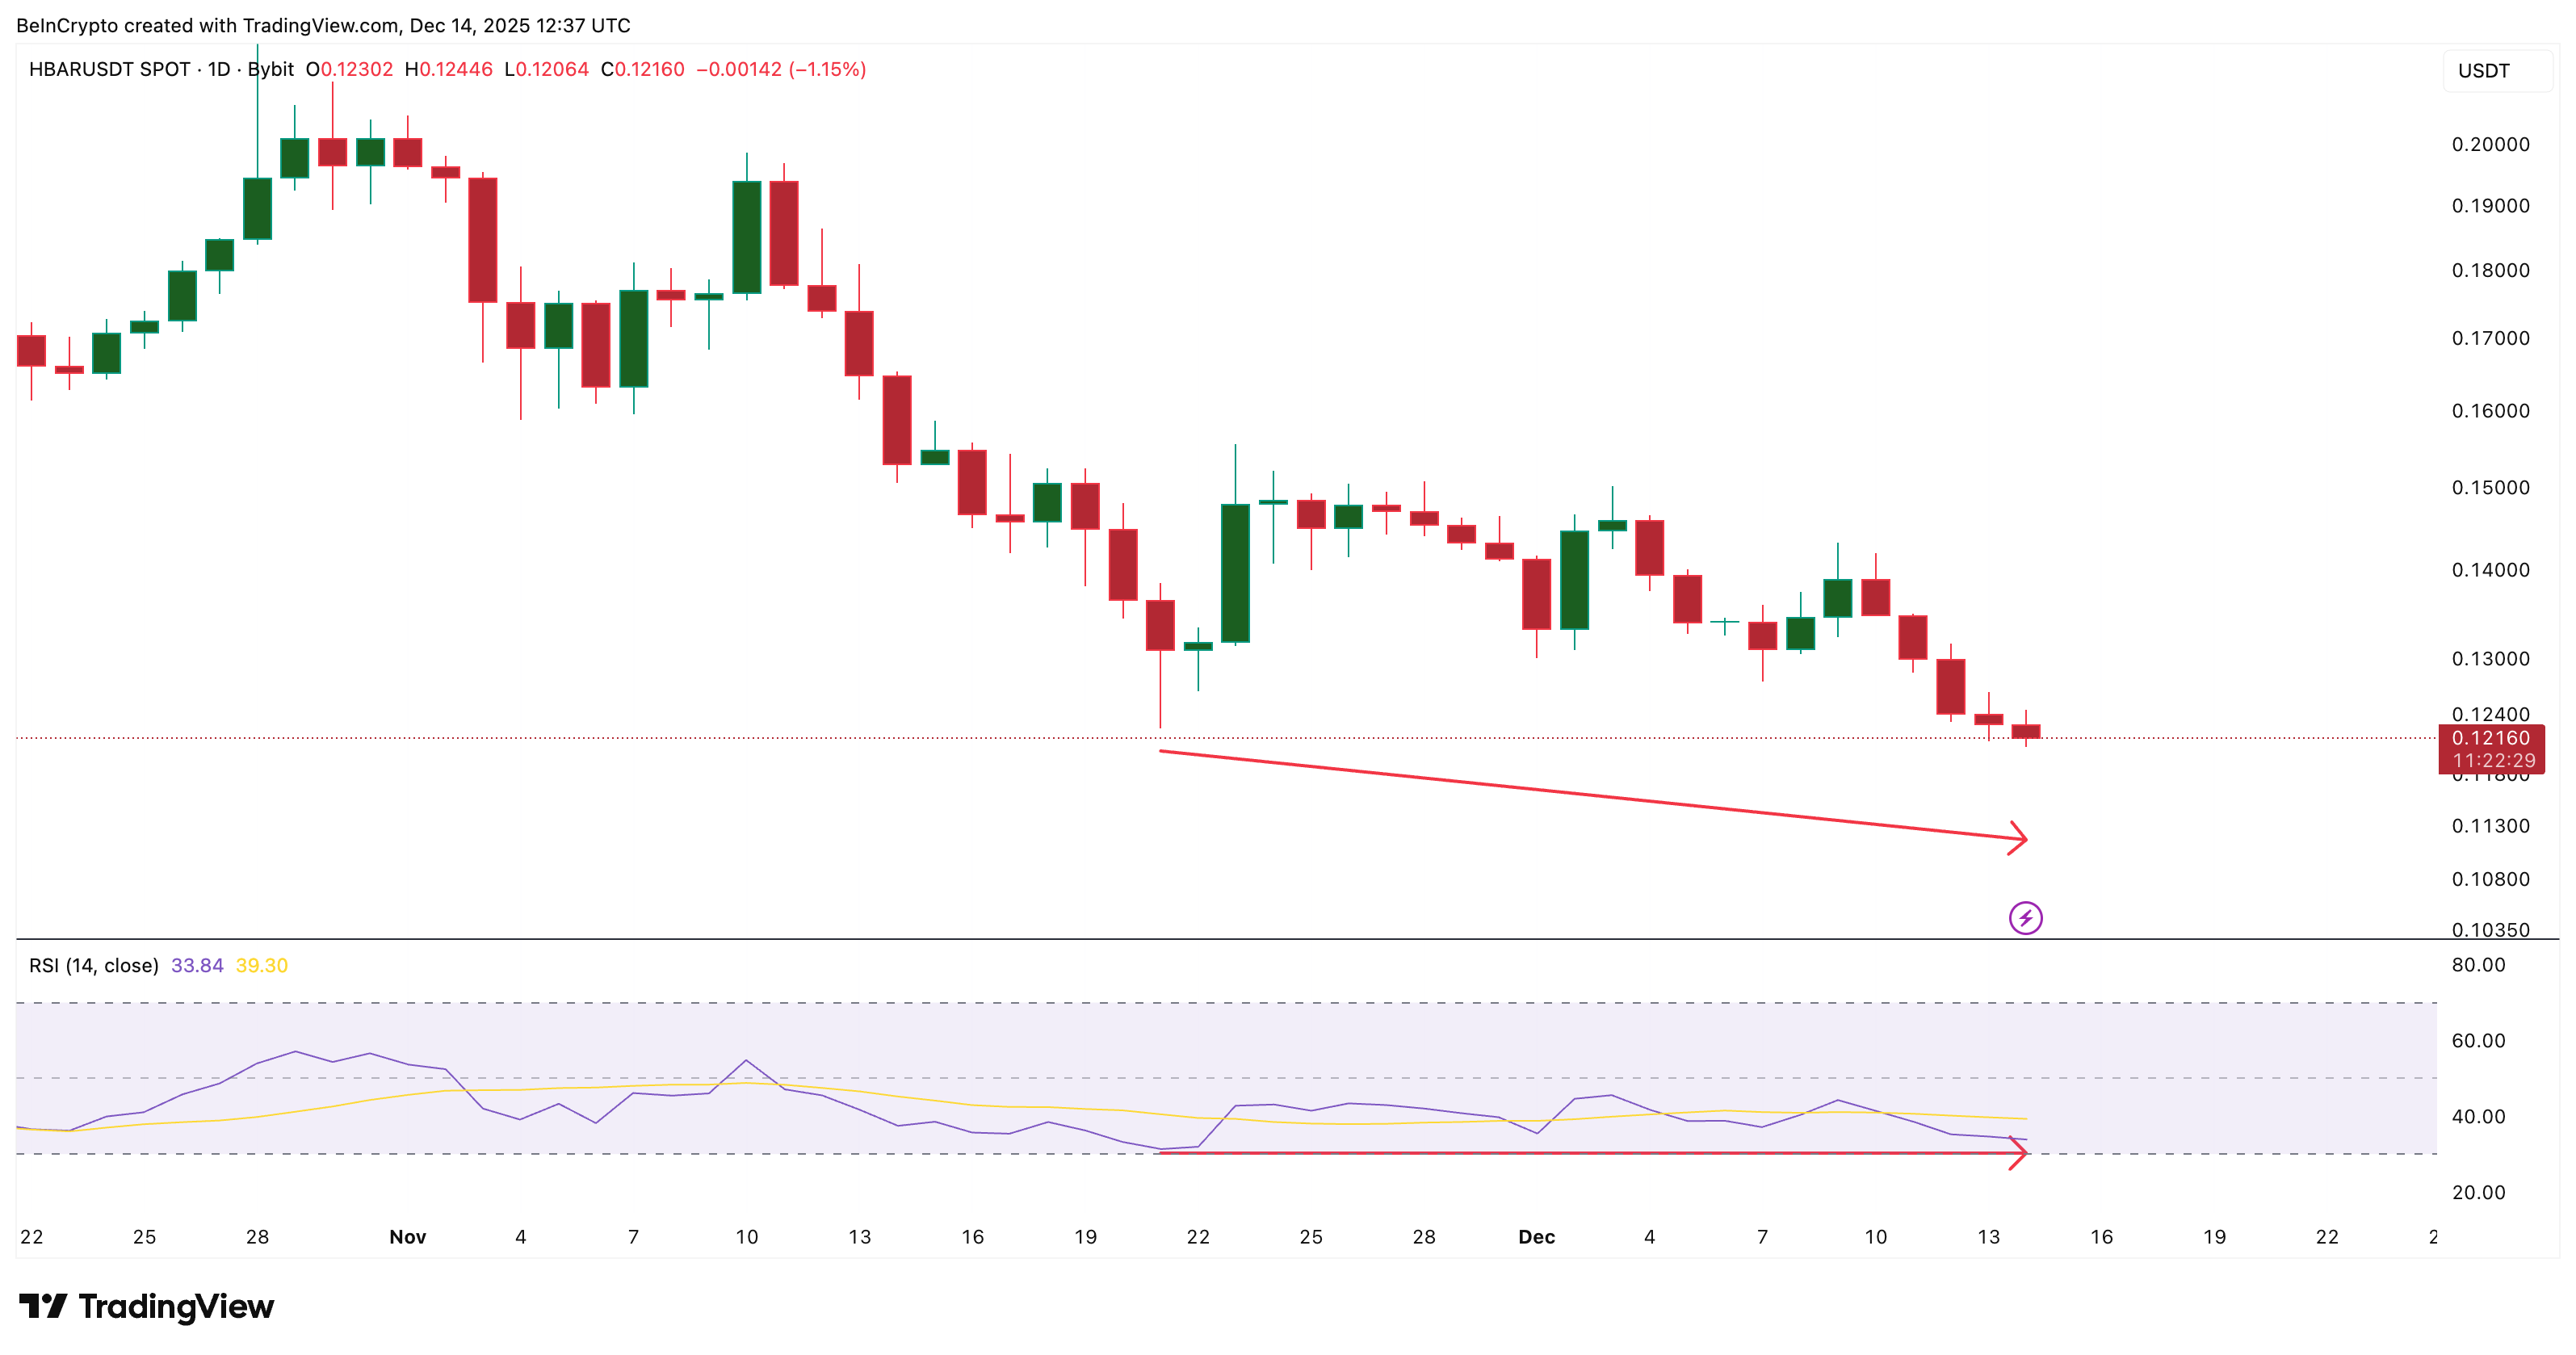
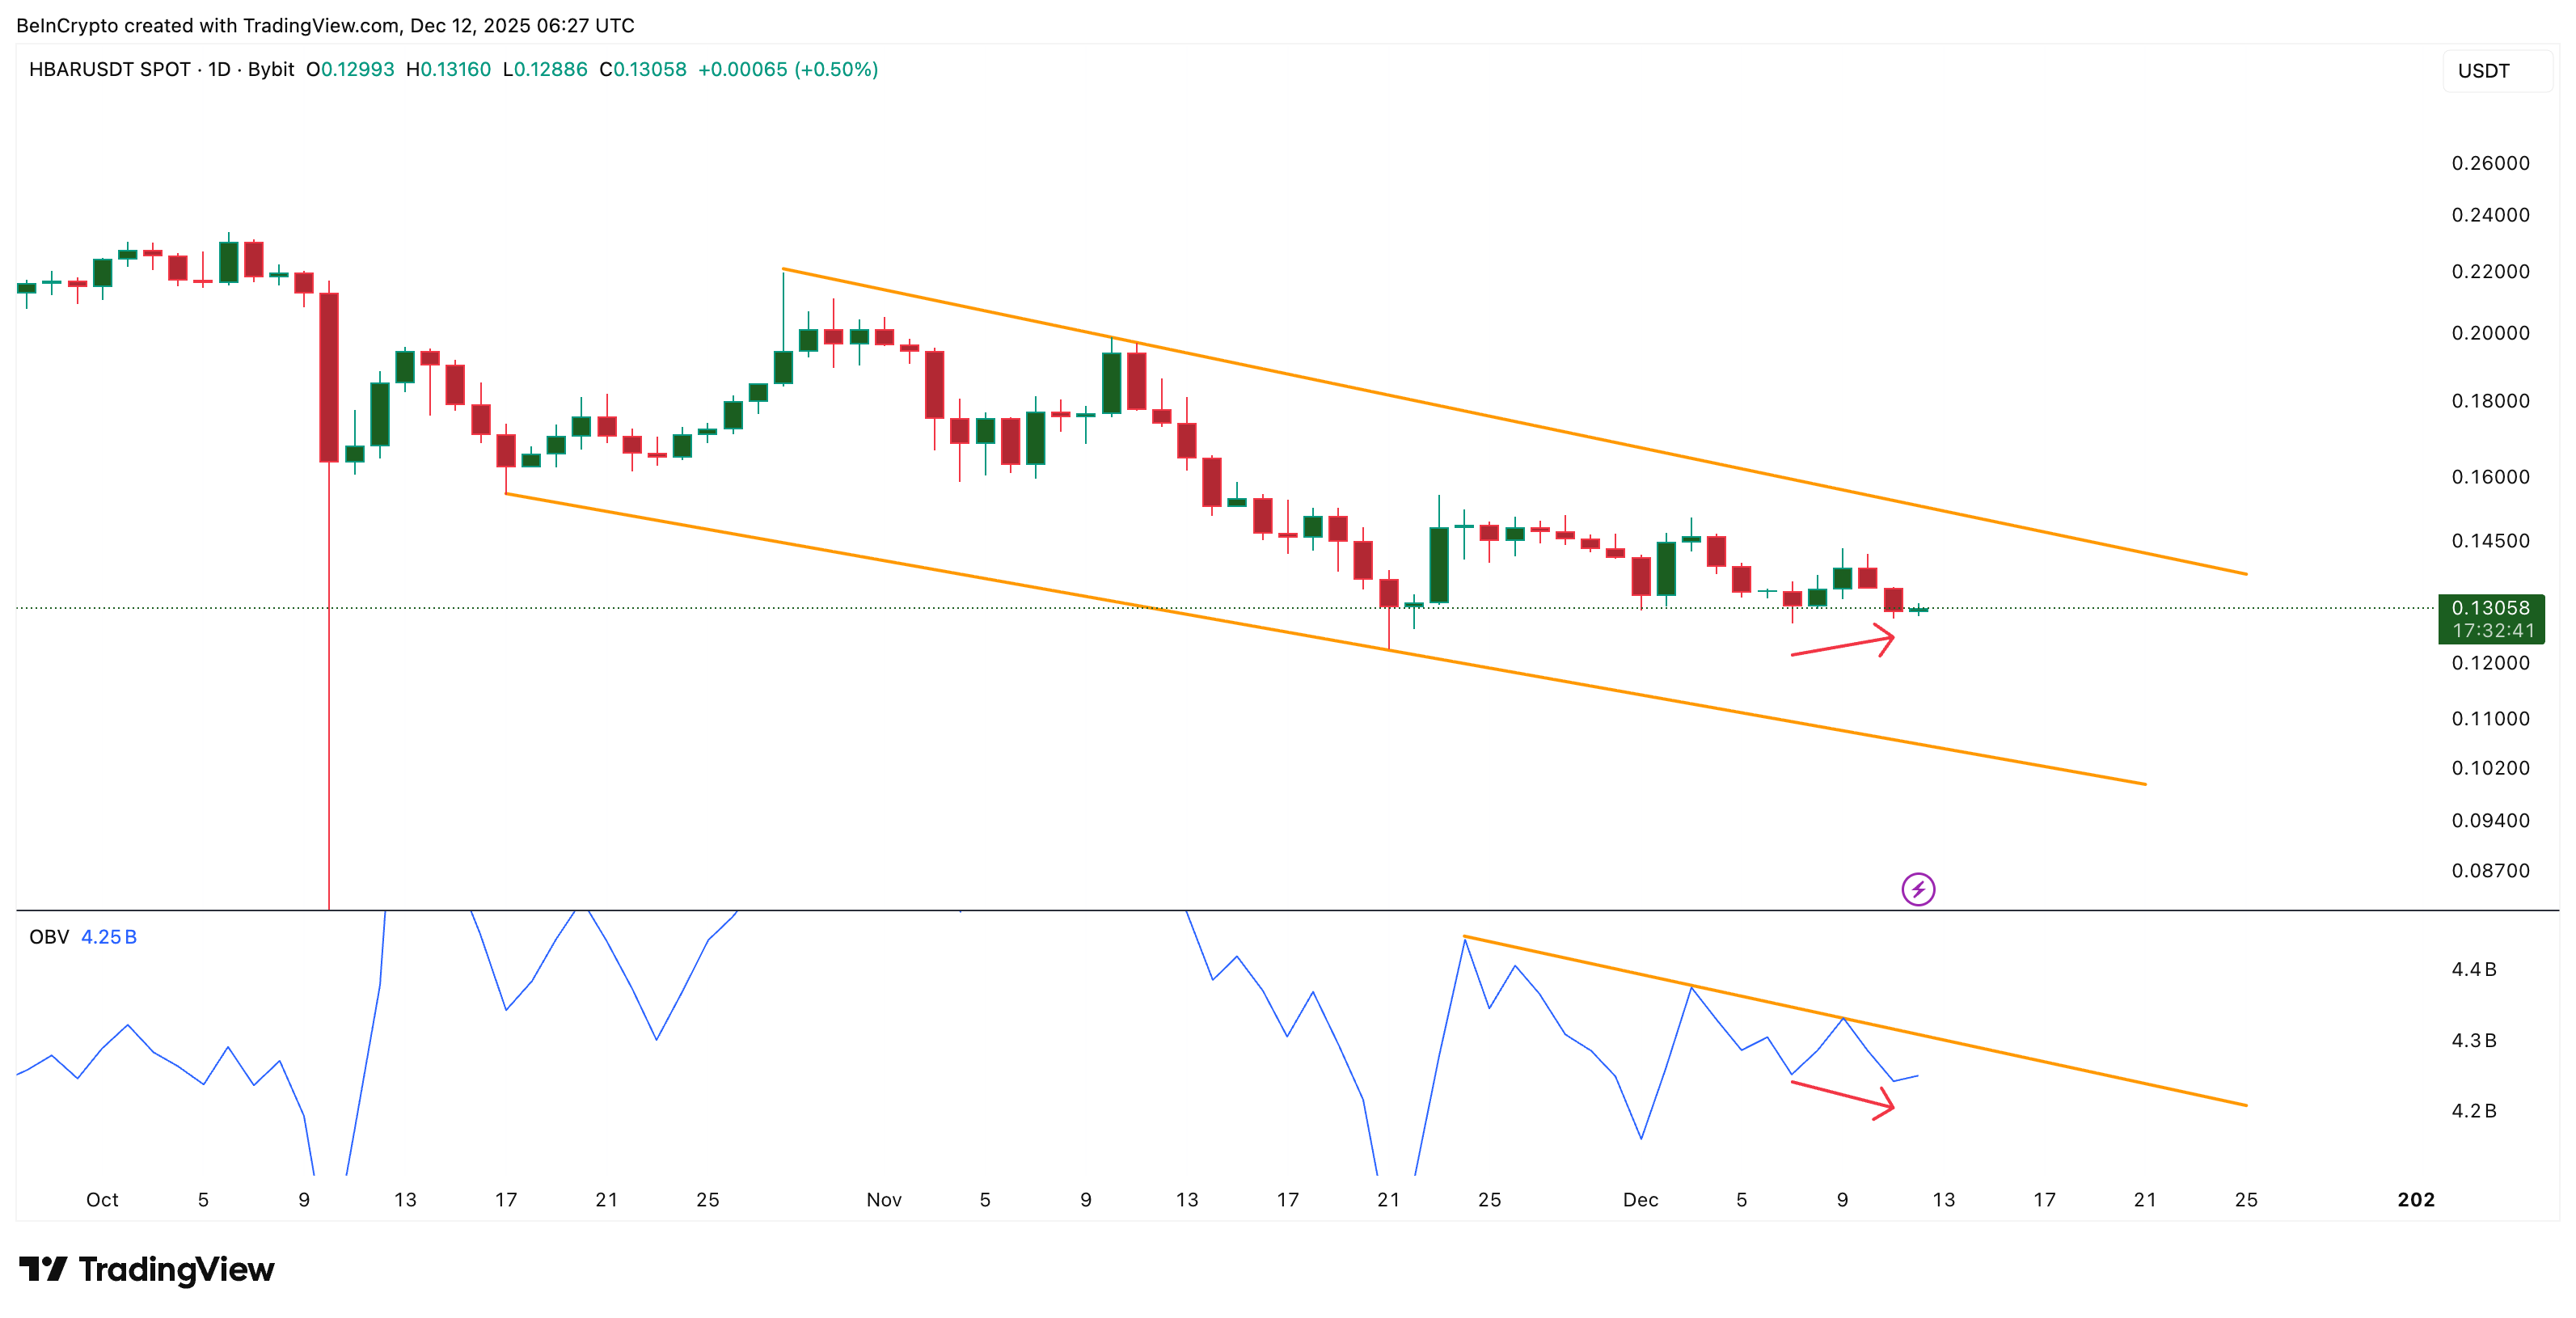
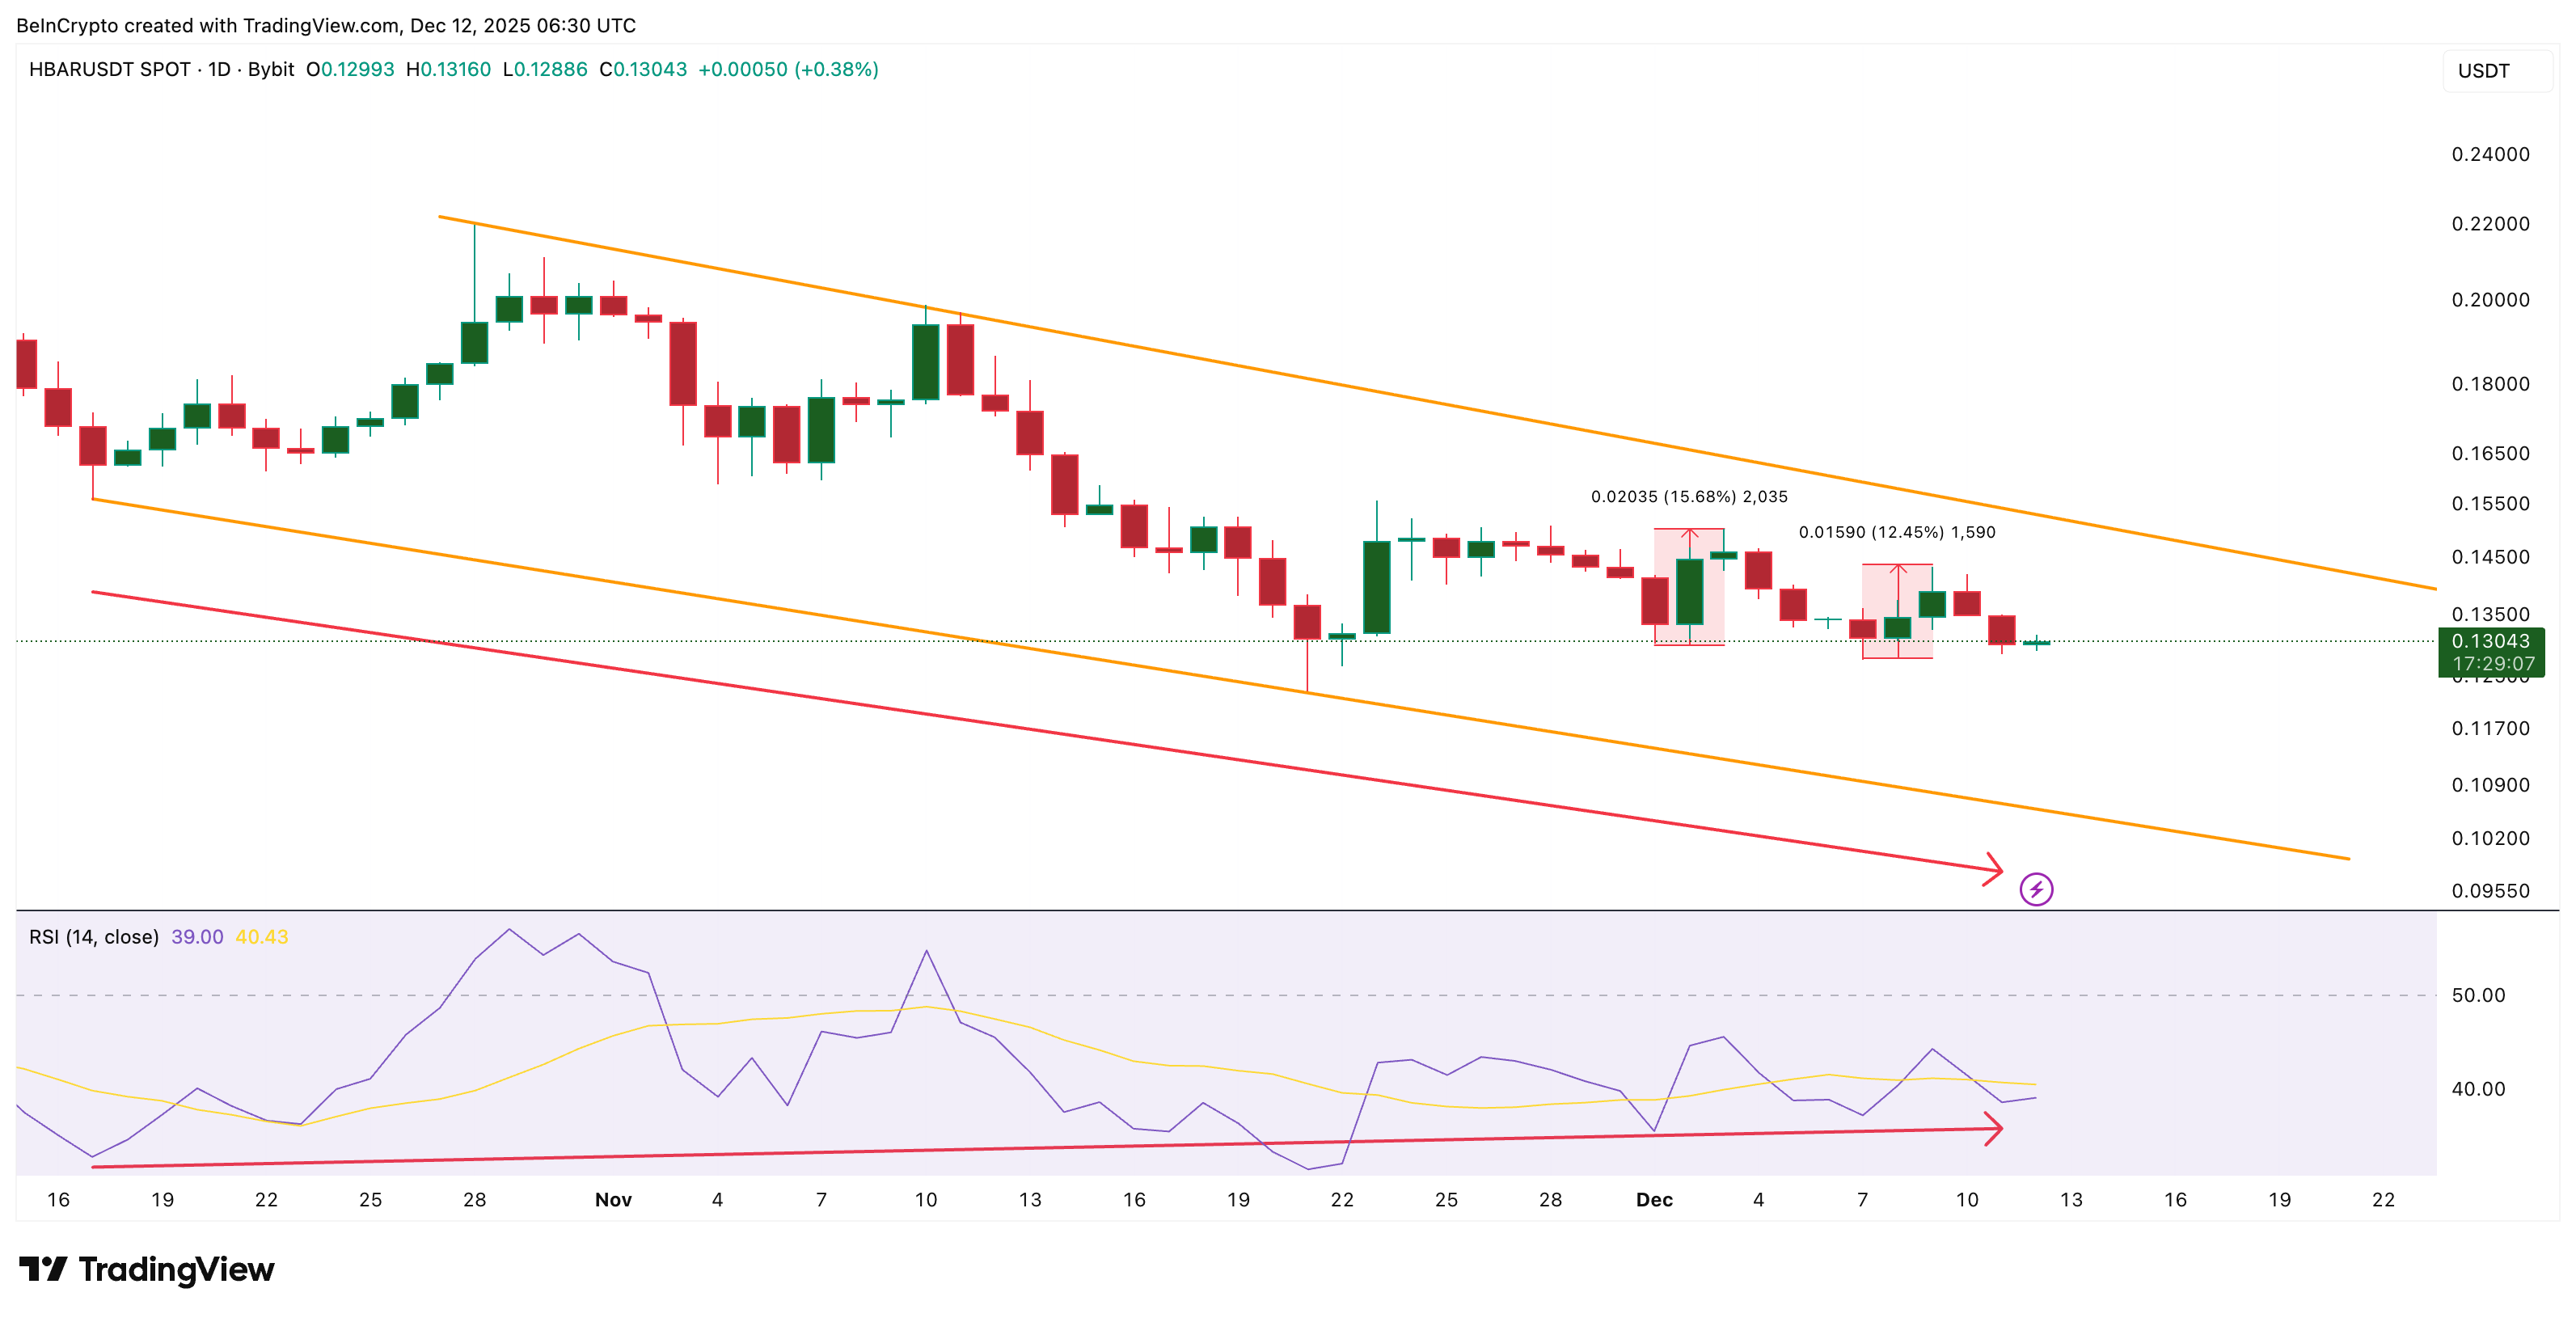
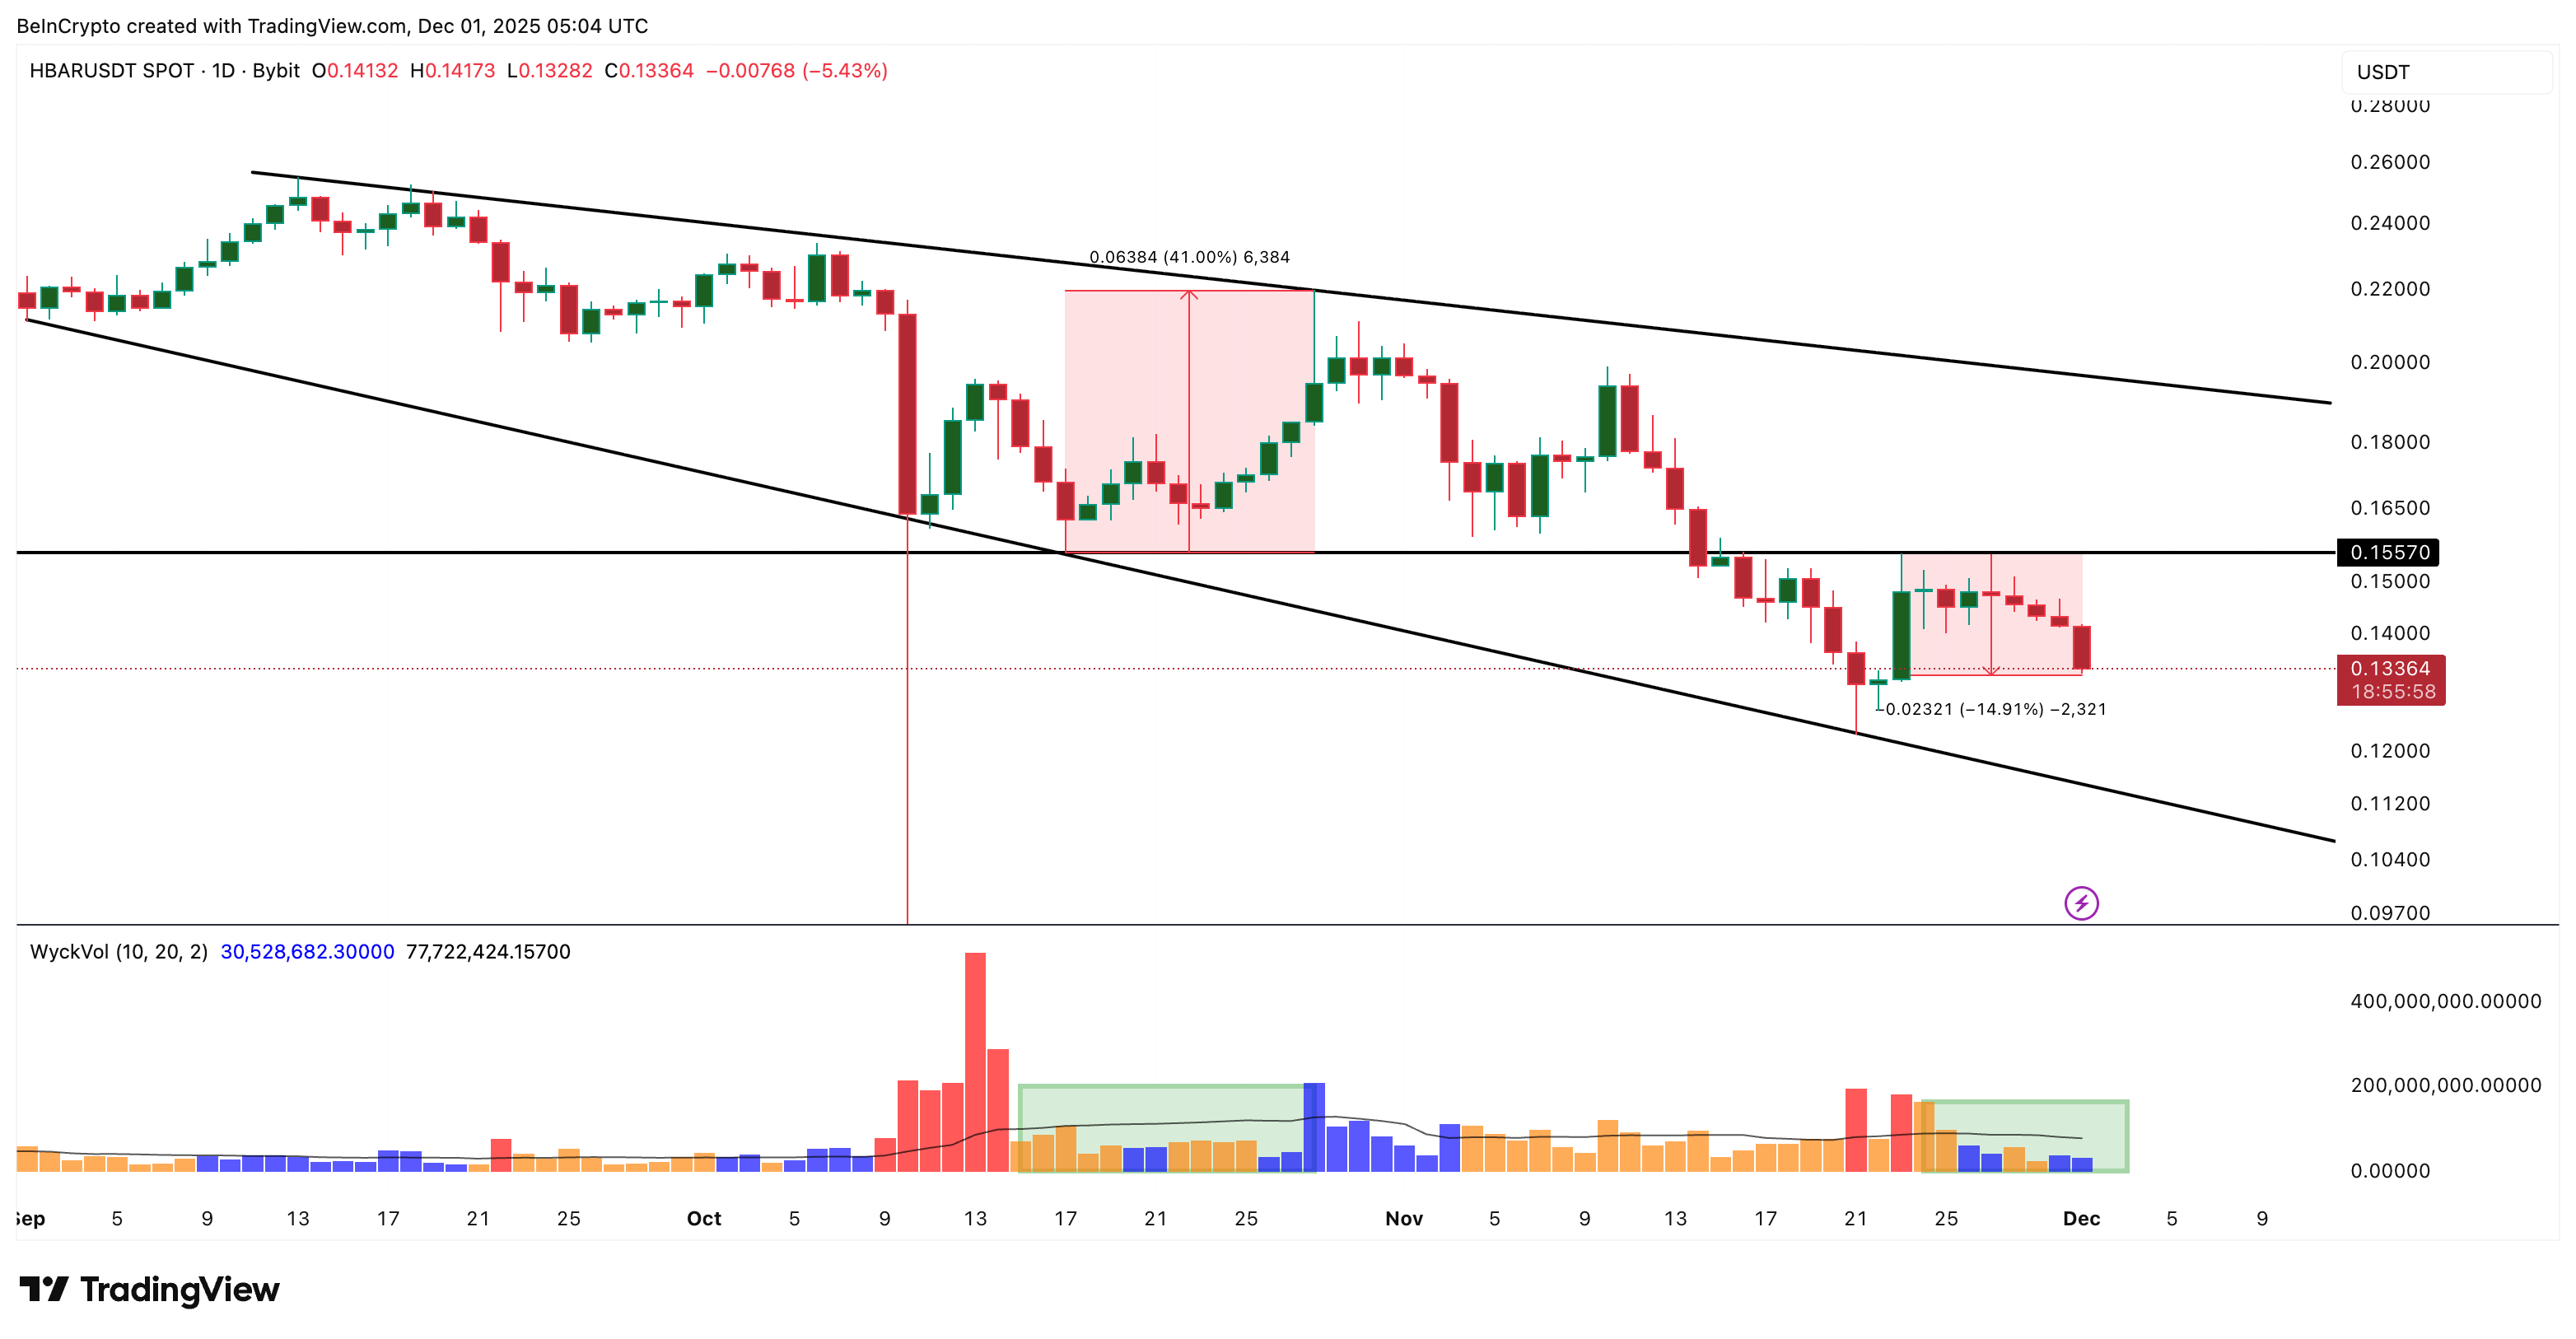
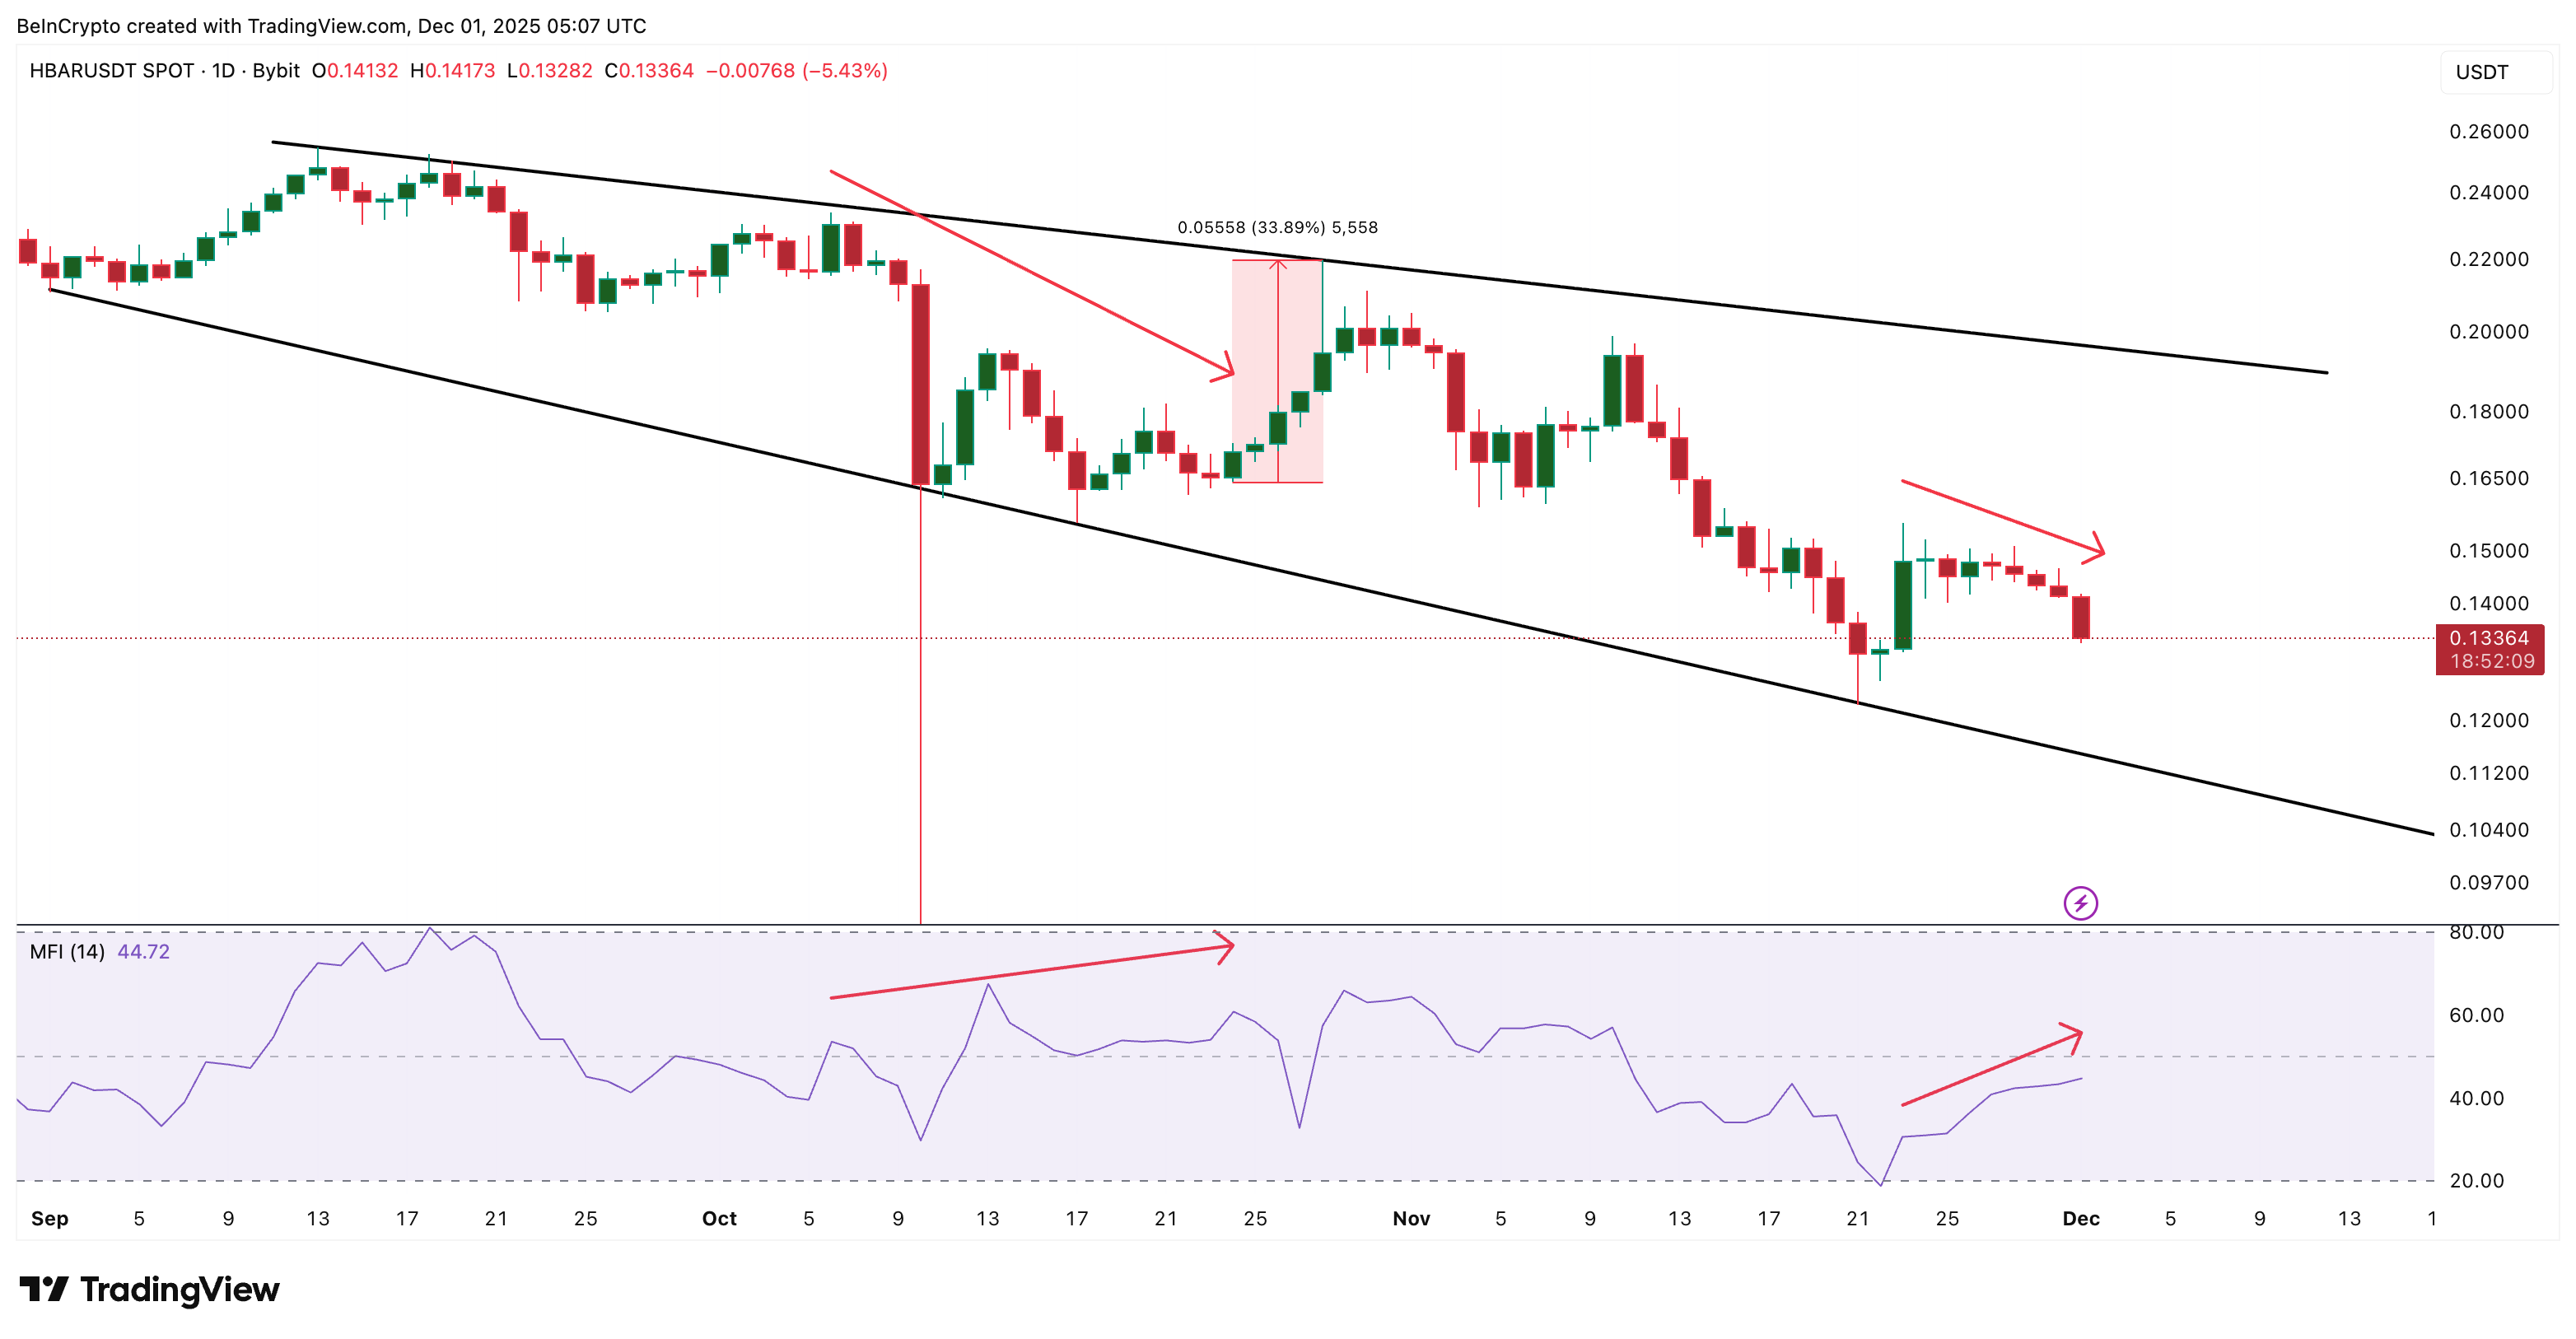
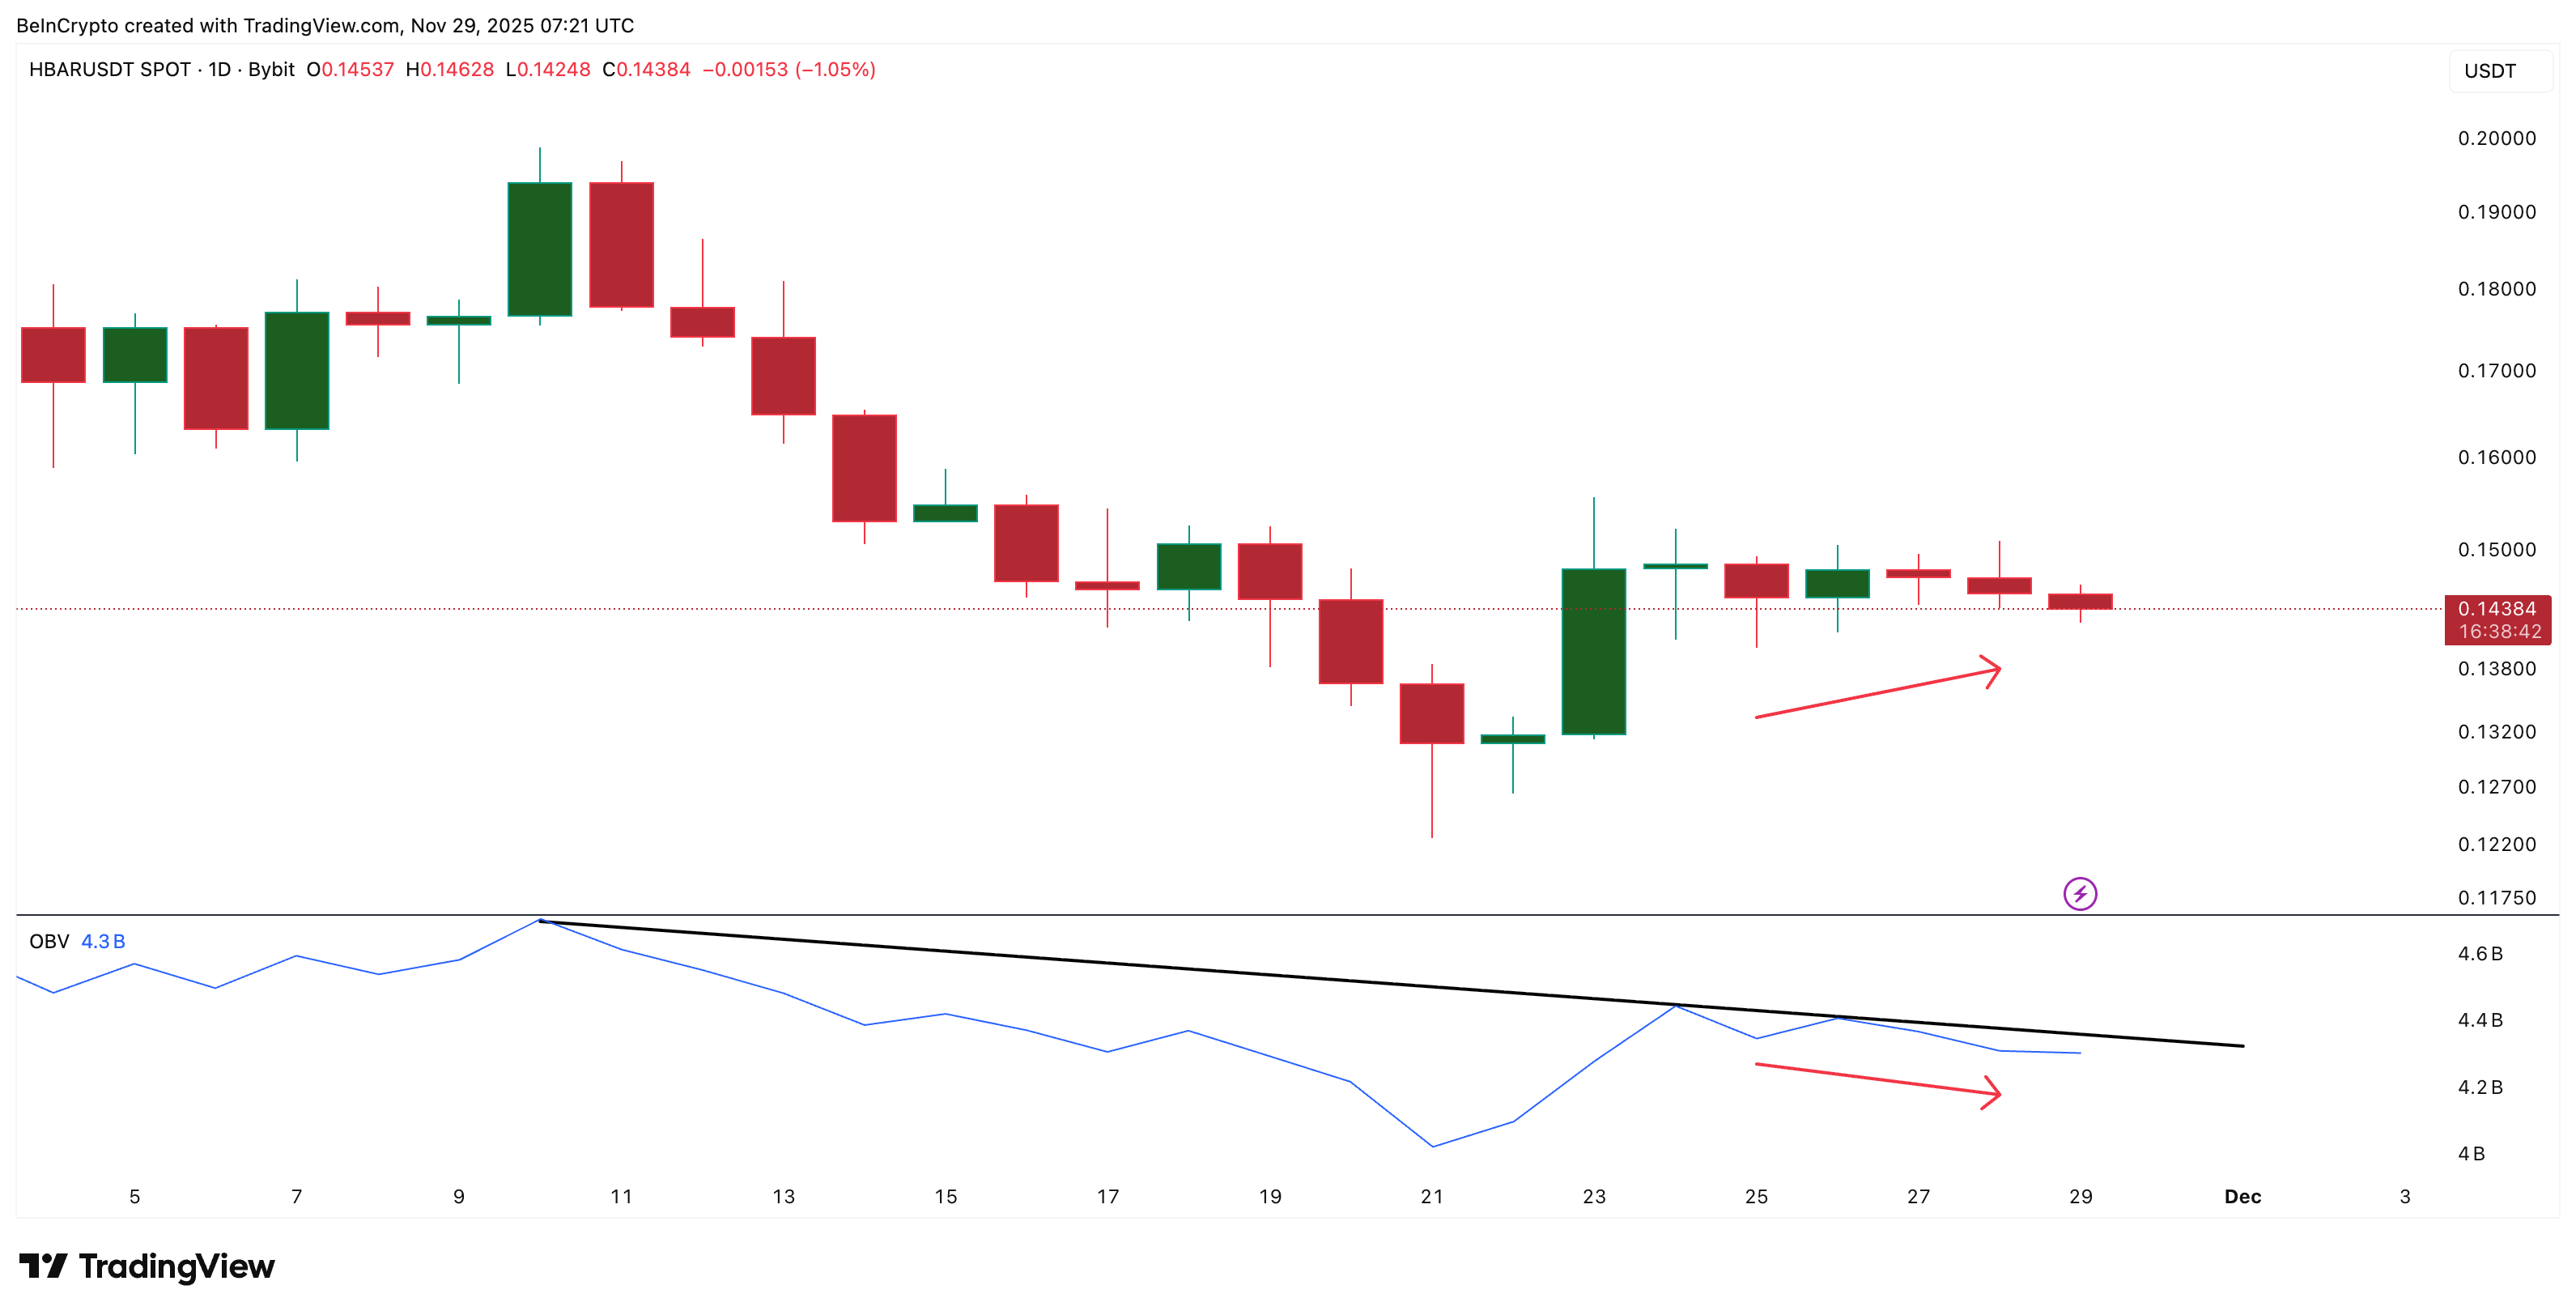
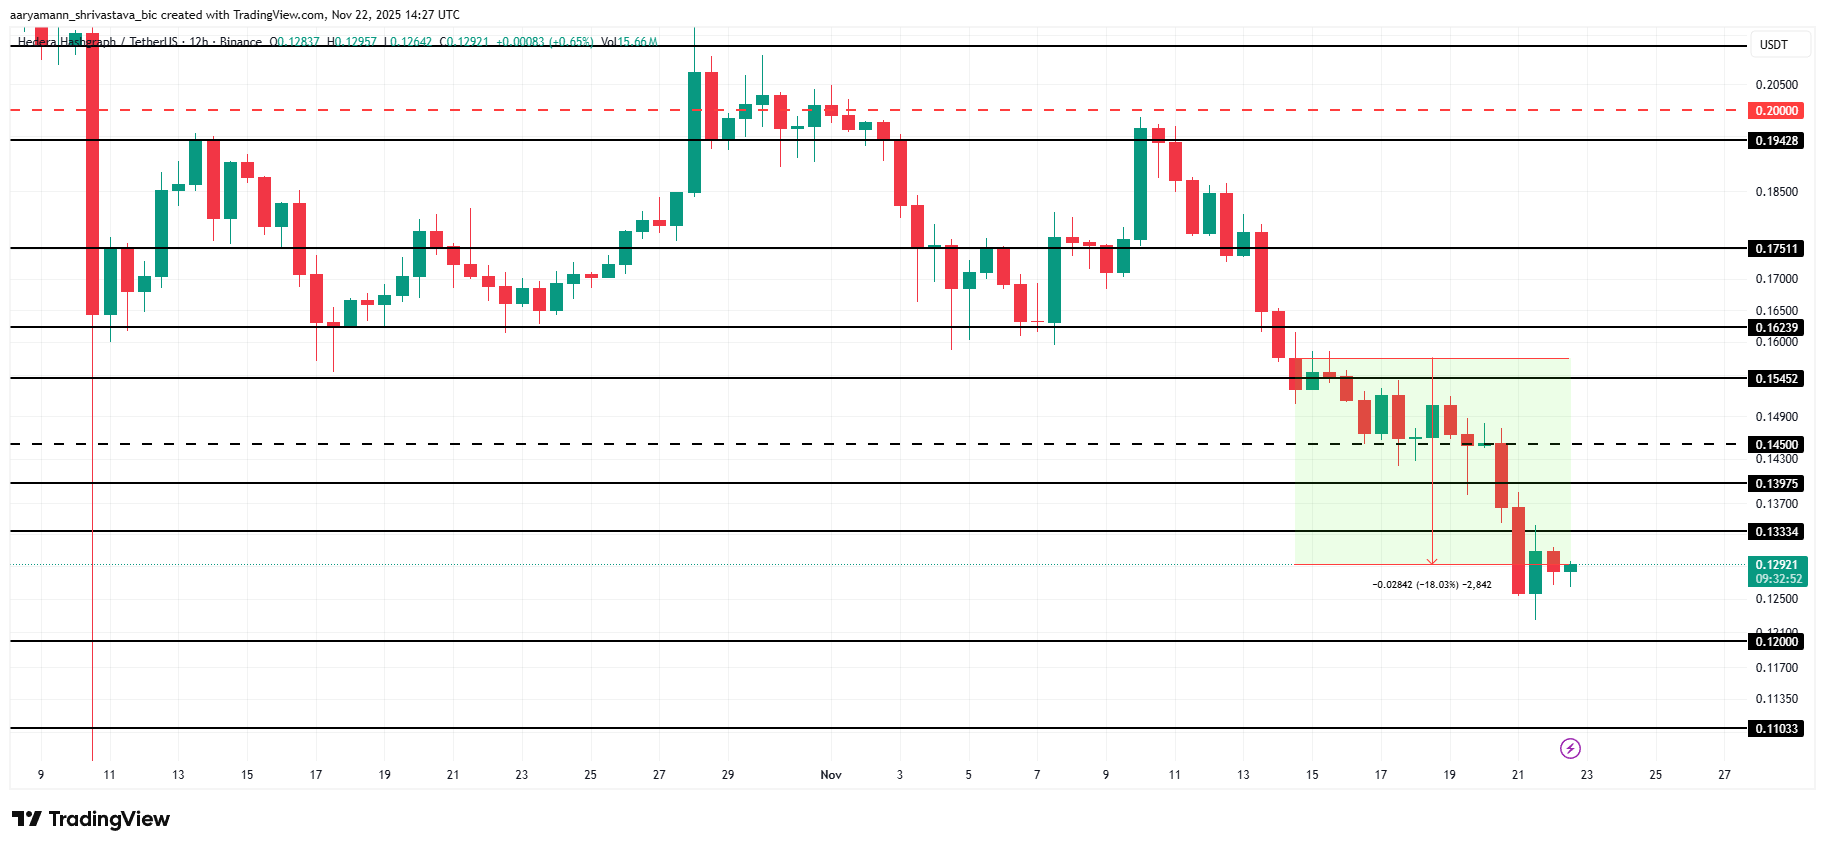
This is significant because the price is already trading within a descending channel, a bearish pattern. When buyers disappear during a downtrend, sellers need little force to push the price lower. The market becomes fragile.

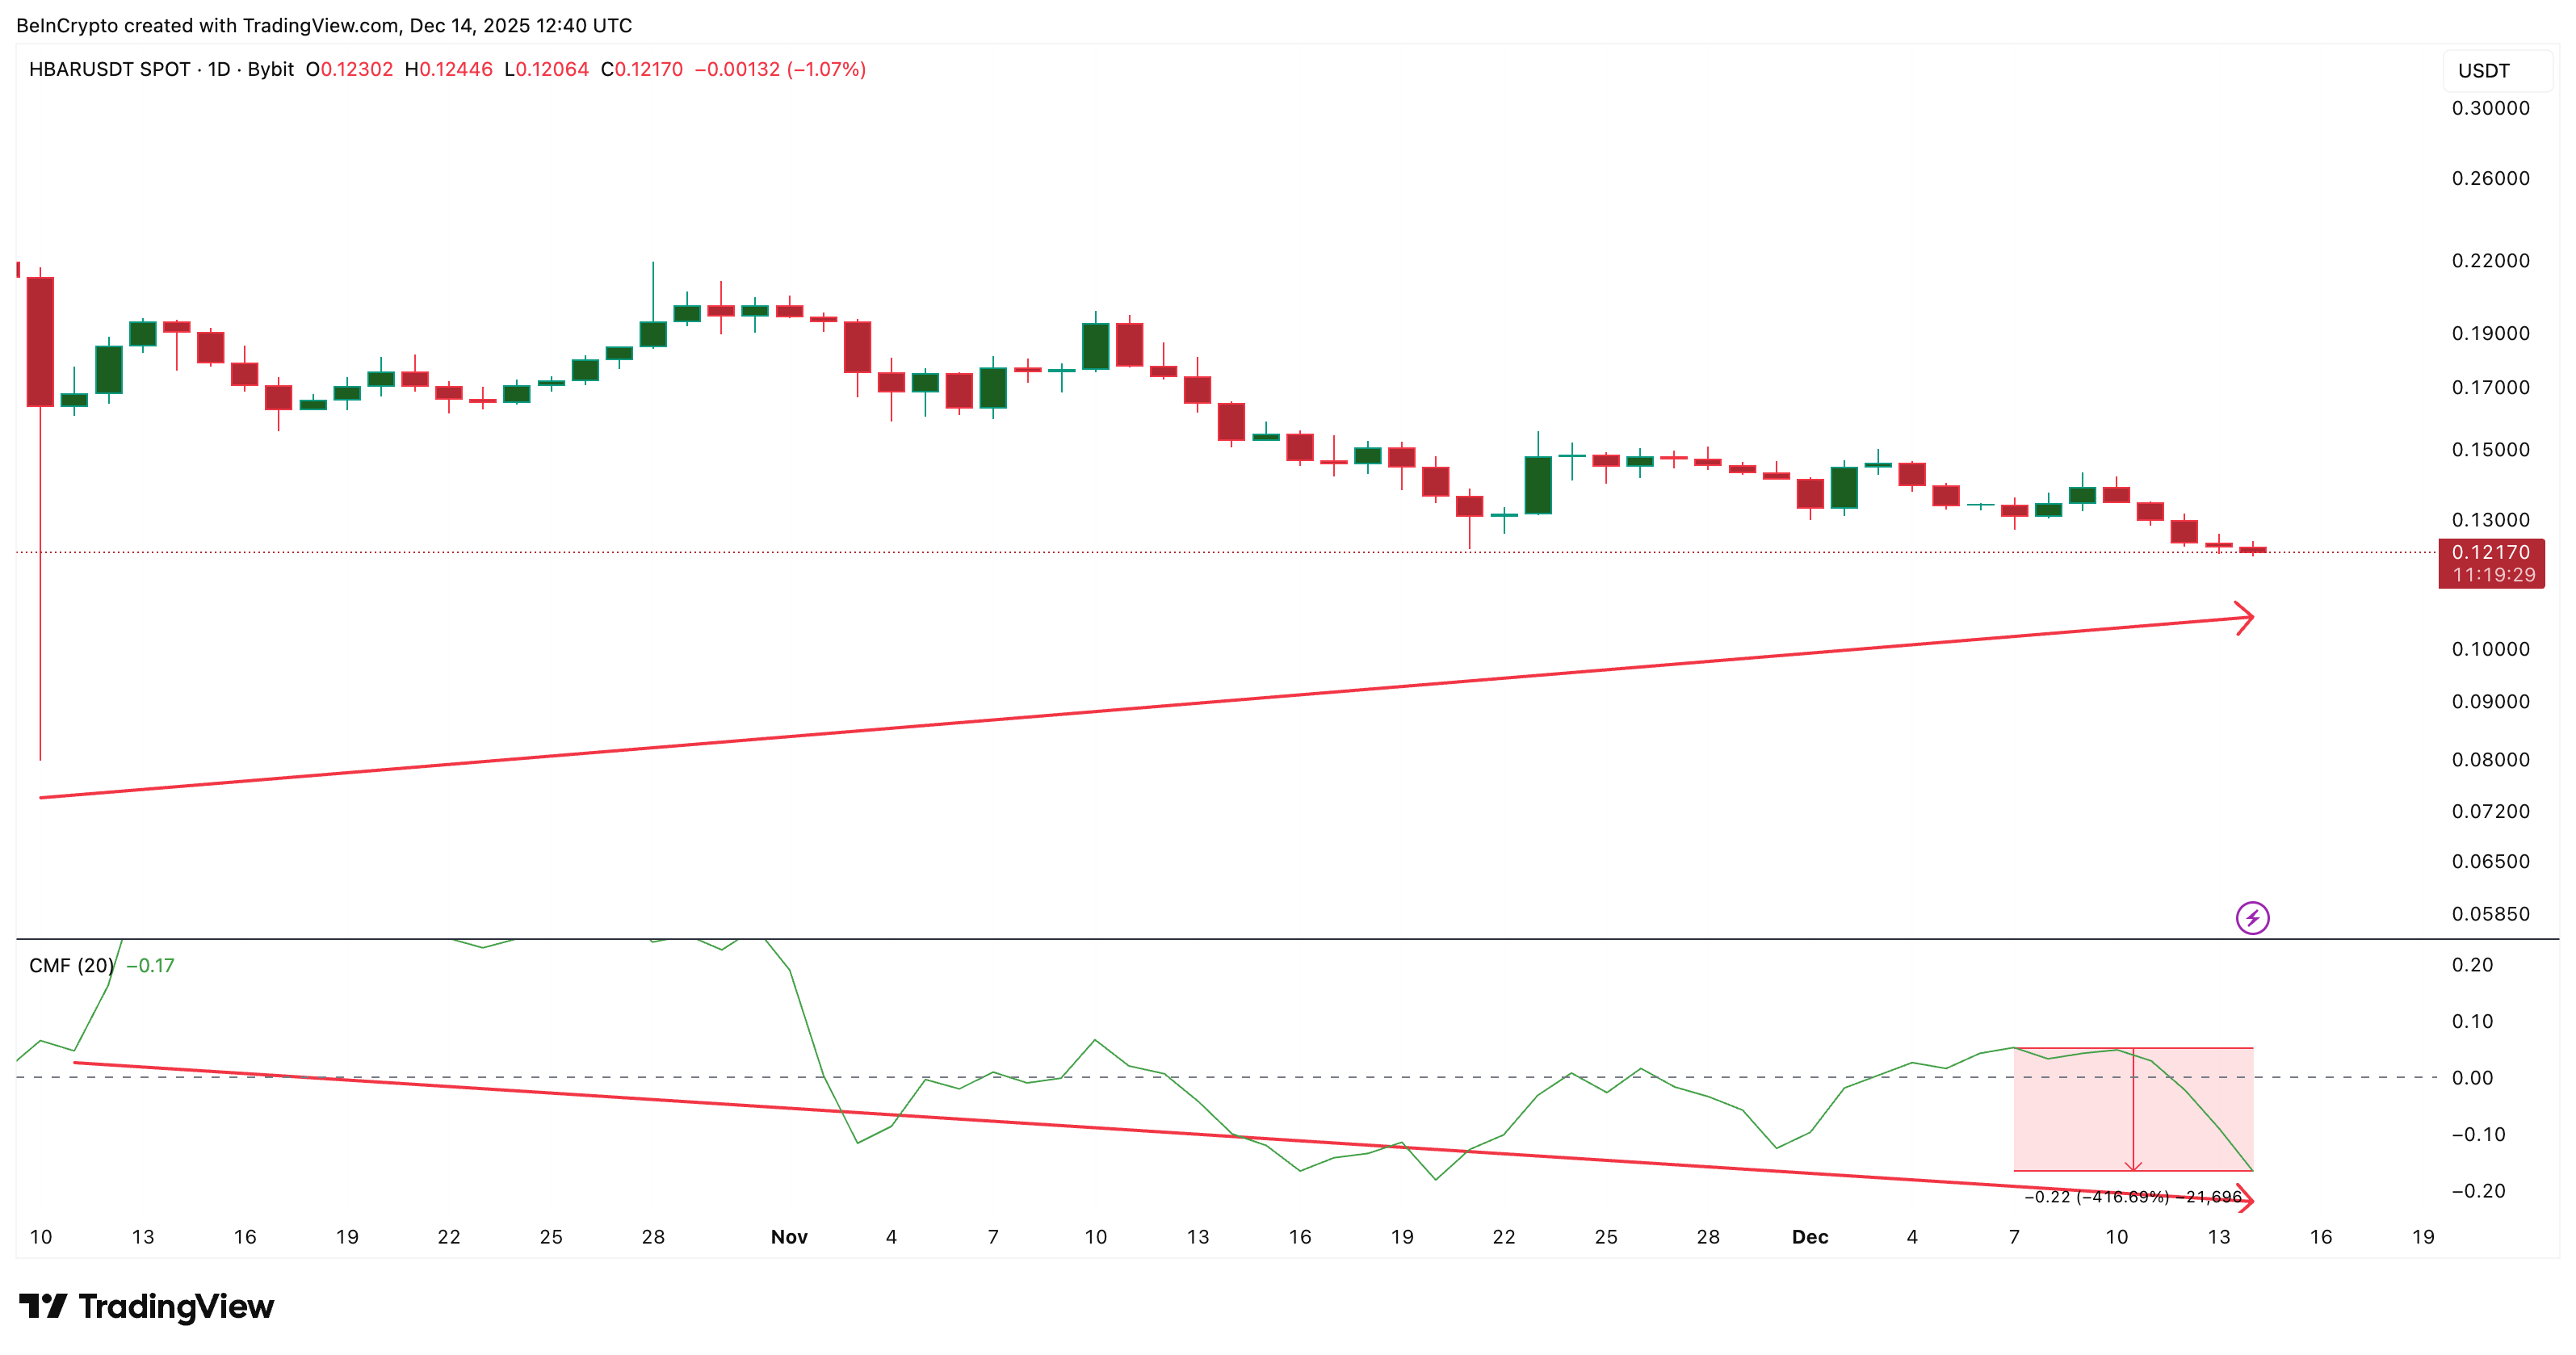
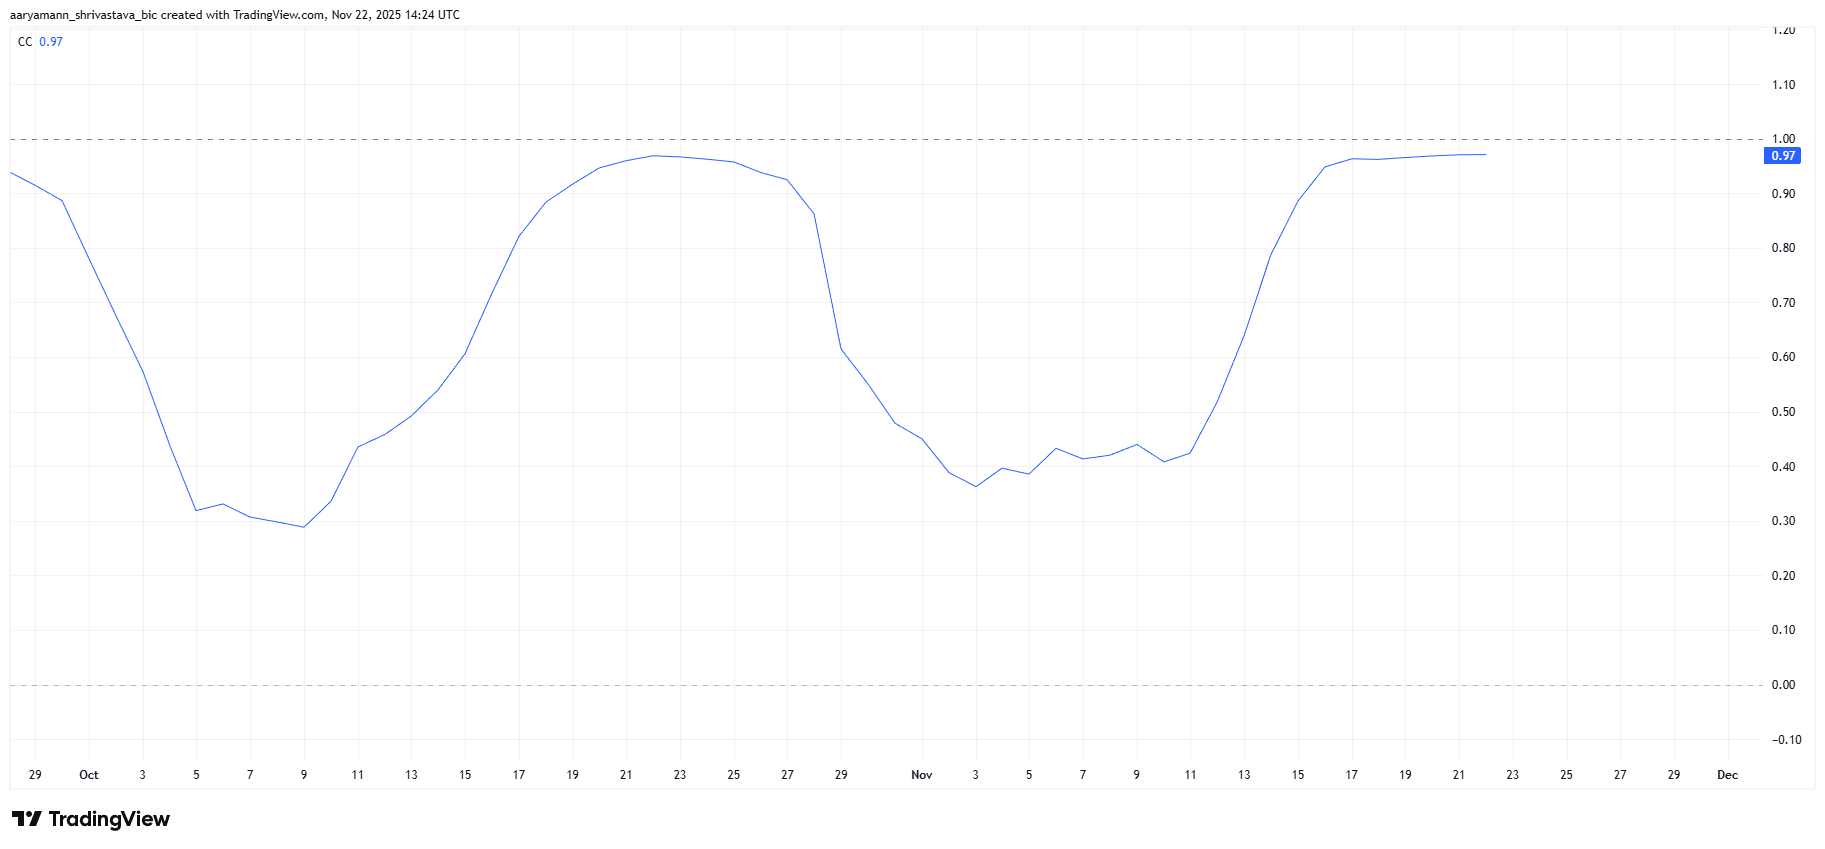
The Money Flow Index, or MFI, confirms this weakness. MFI tracks how much money is entering or leaving an asset using both price and volume. In HBAR’s case, MFI has been making lower lows along with price and has now slipped into oversold territory. Instead of bouncing, it keeps trending down.

Want more token insights like this? Sign up for Editor Harsh Notariya’s Daily Crypto Newsletter here.

No Dip Buying Visible
No Dip Buying Visible: TradingView

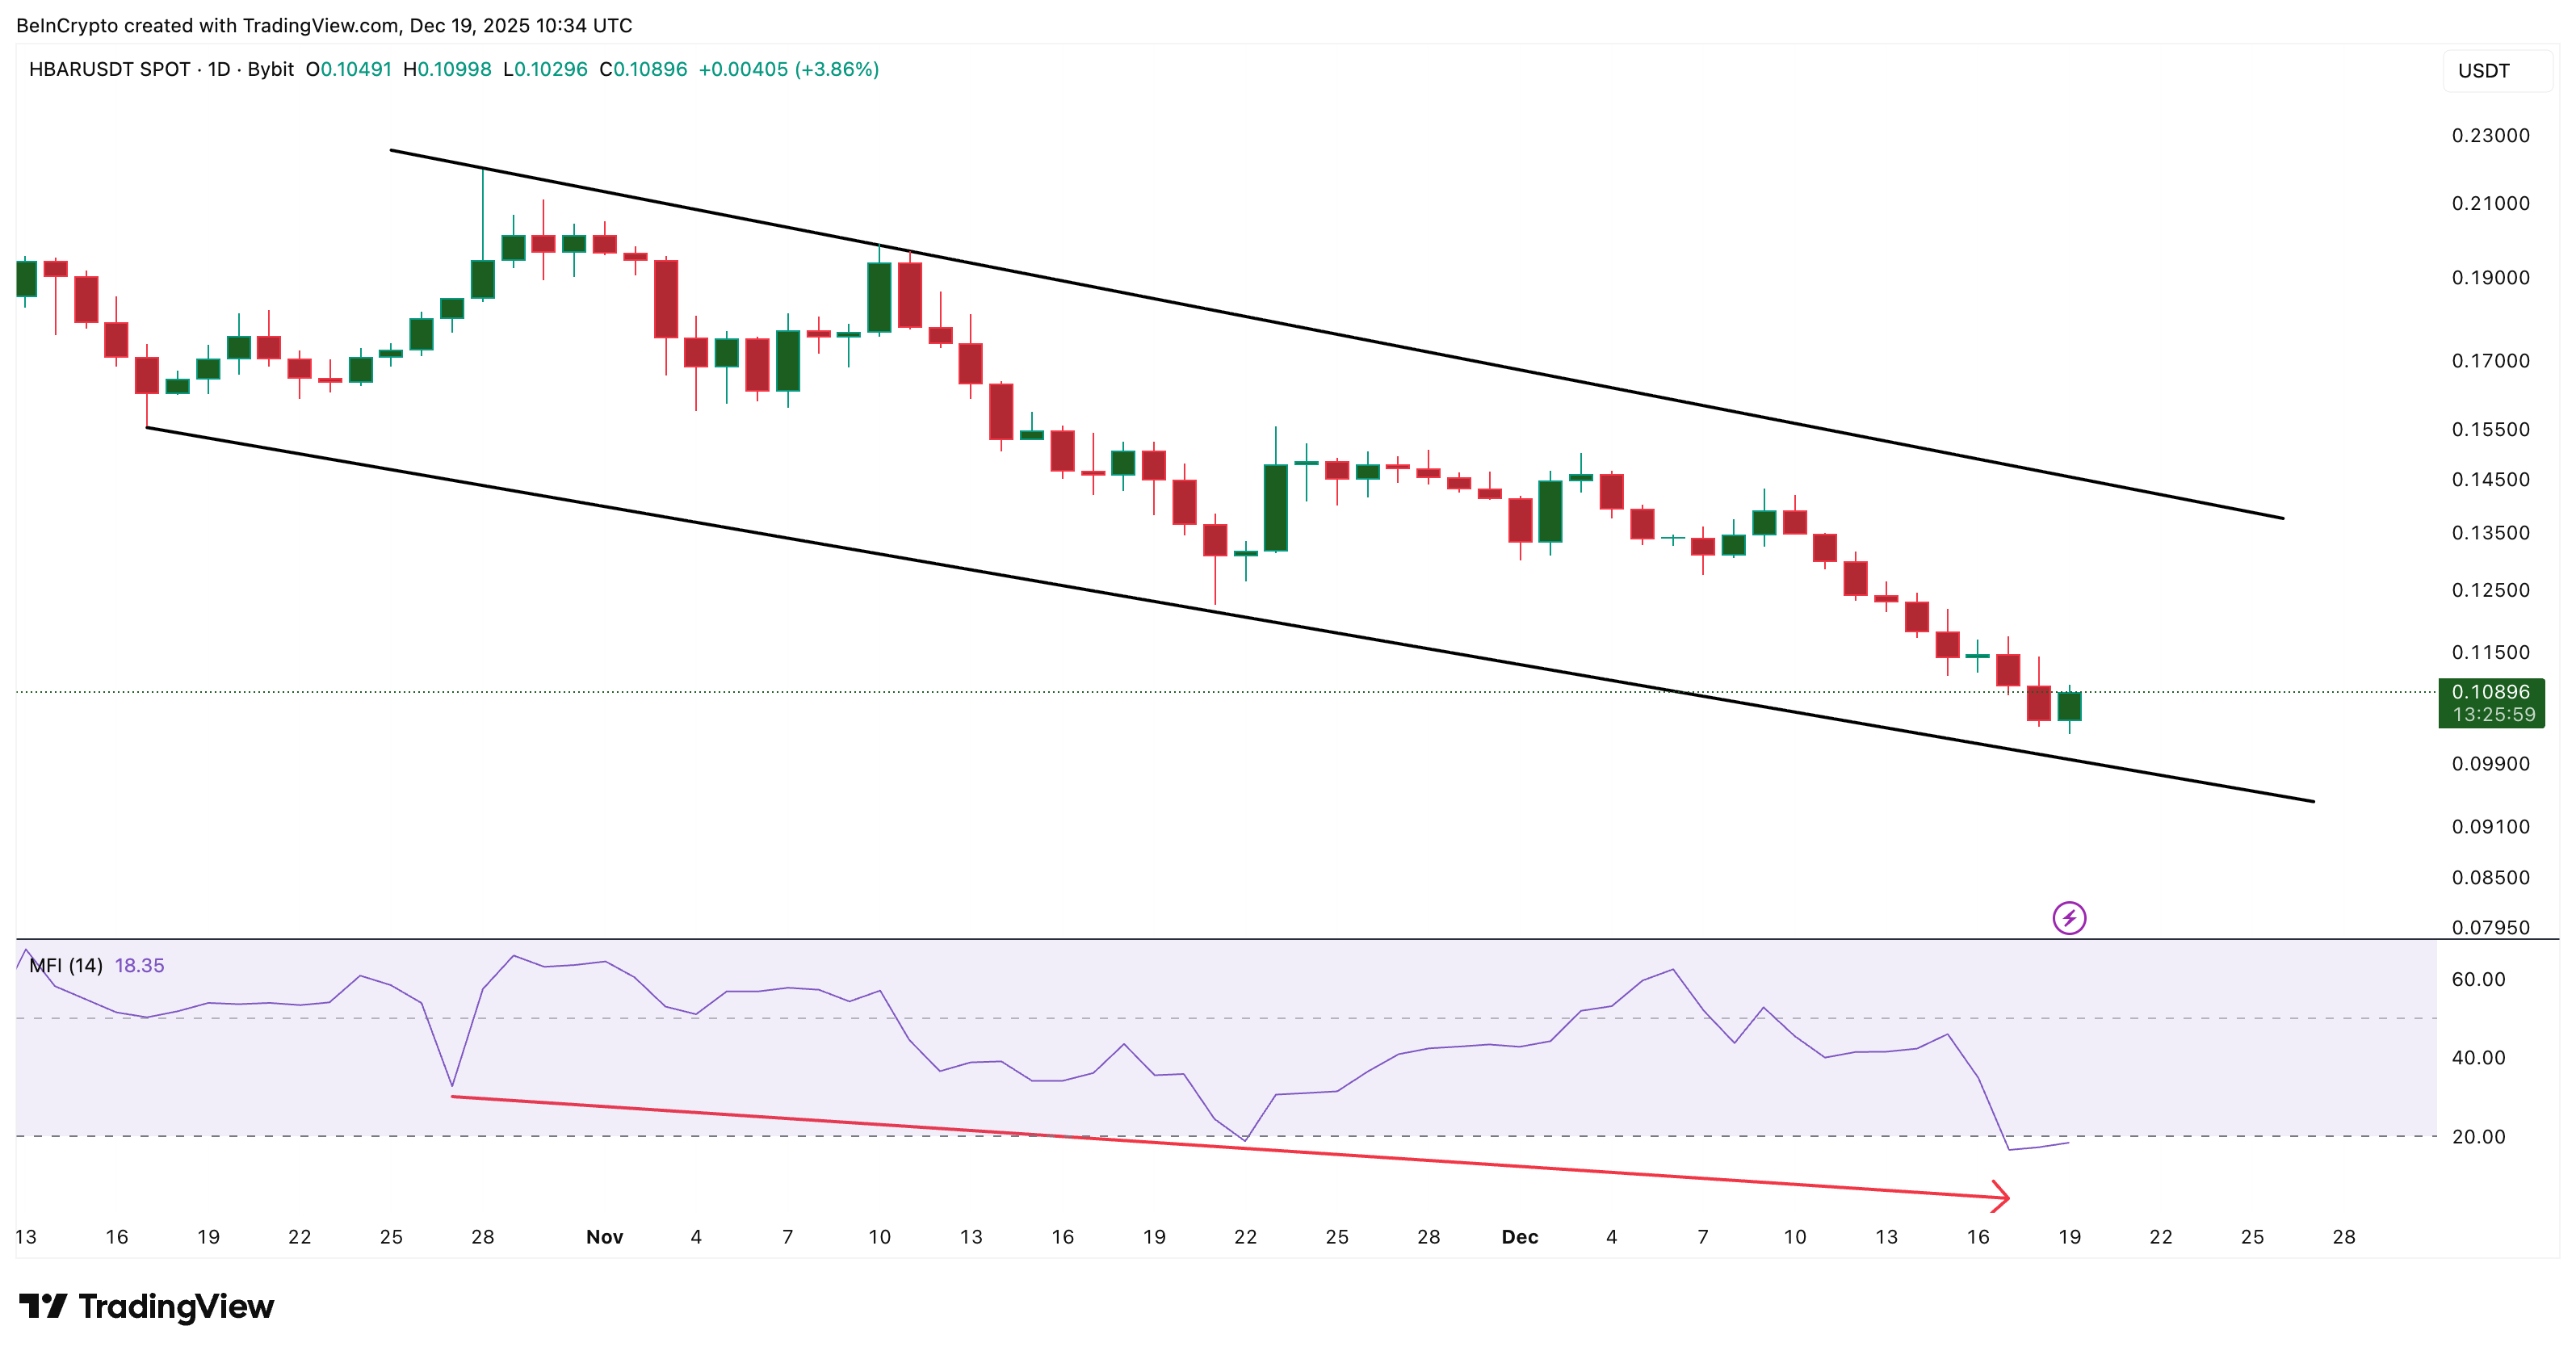
That indicates that dips are not being bought, suggesting minimal price-specific conviction.

Why the HBAR Price Breakdown Scenario Is Gaining Weight

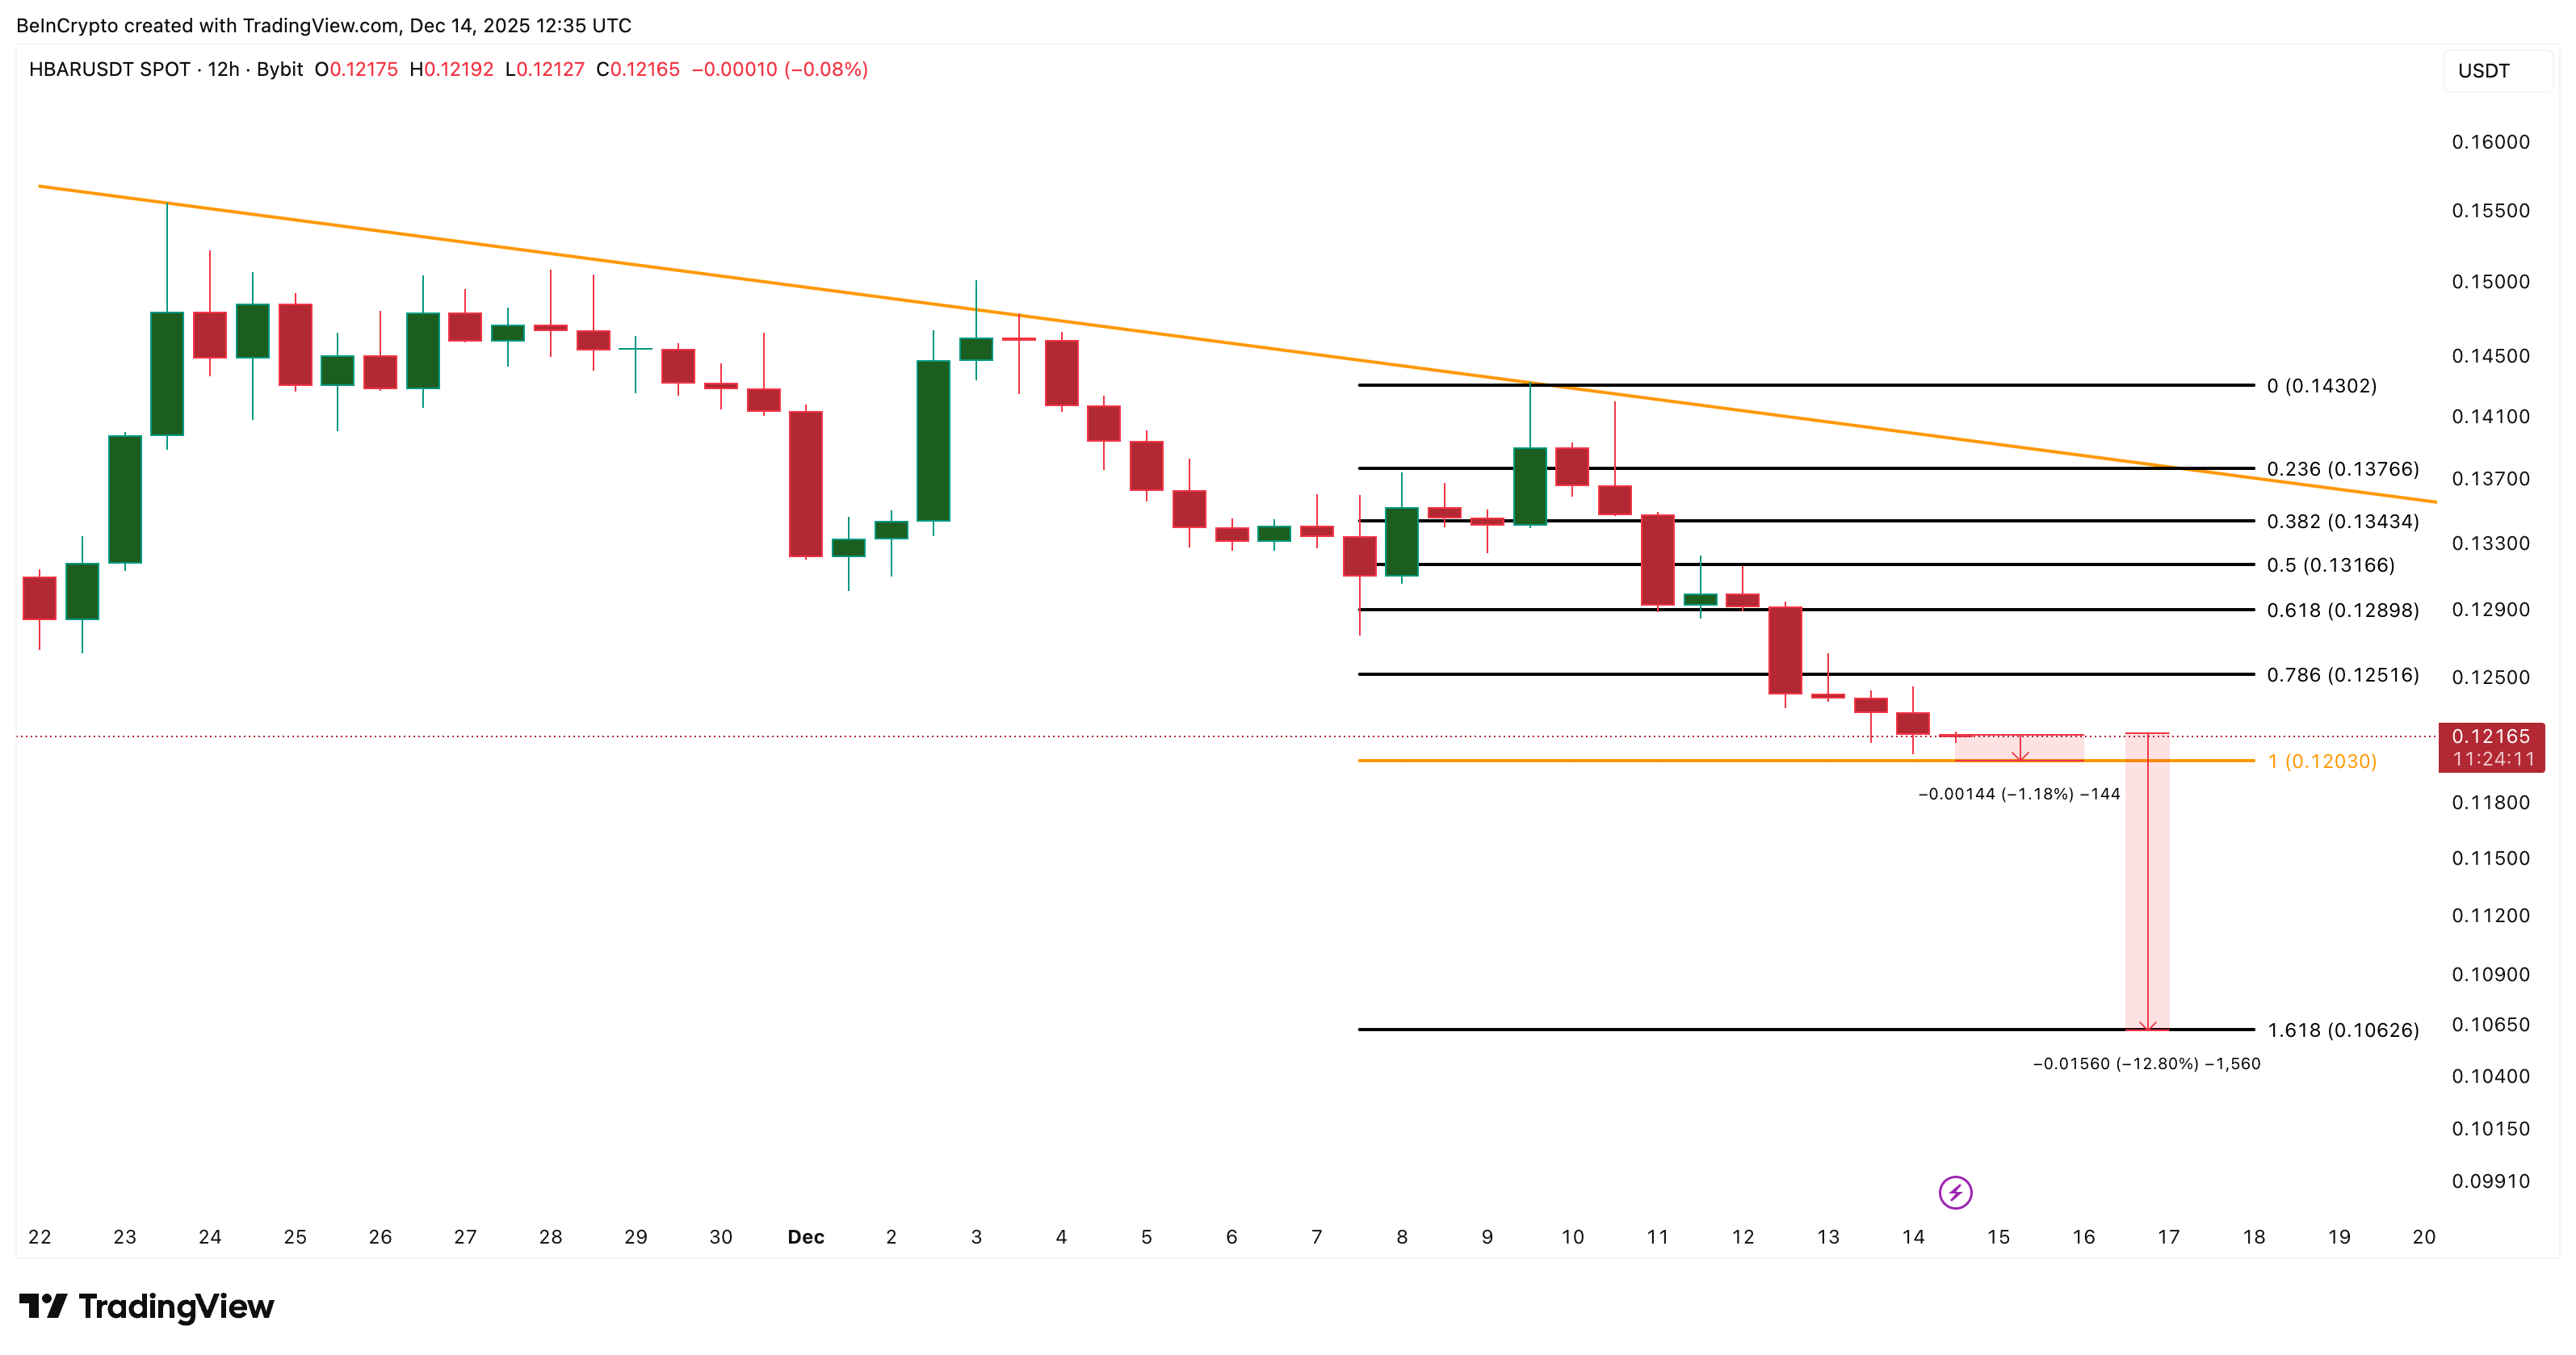
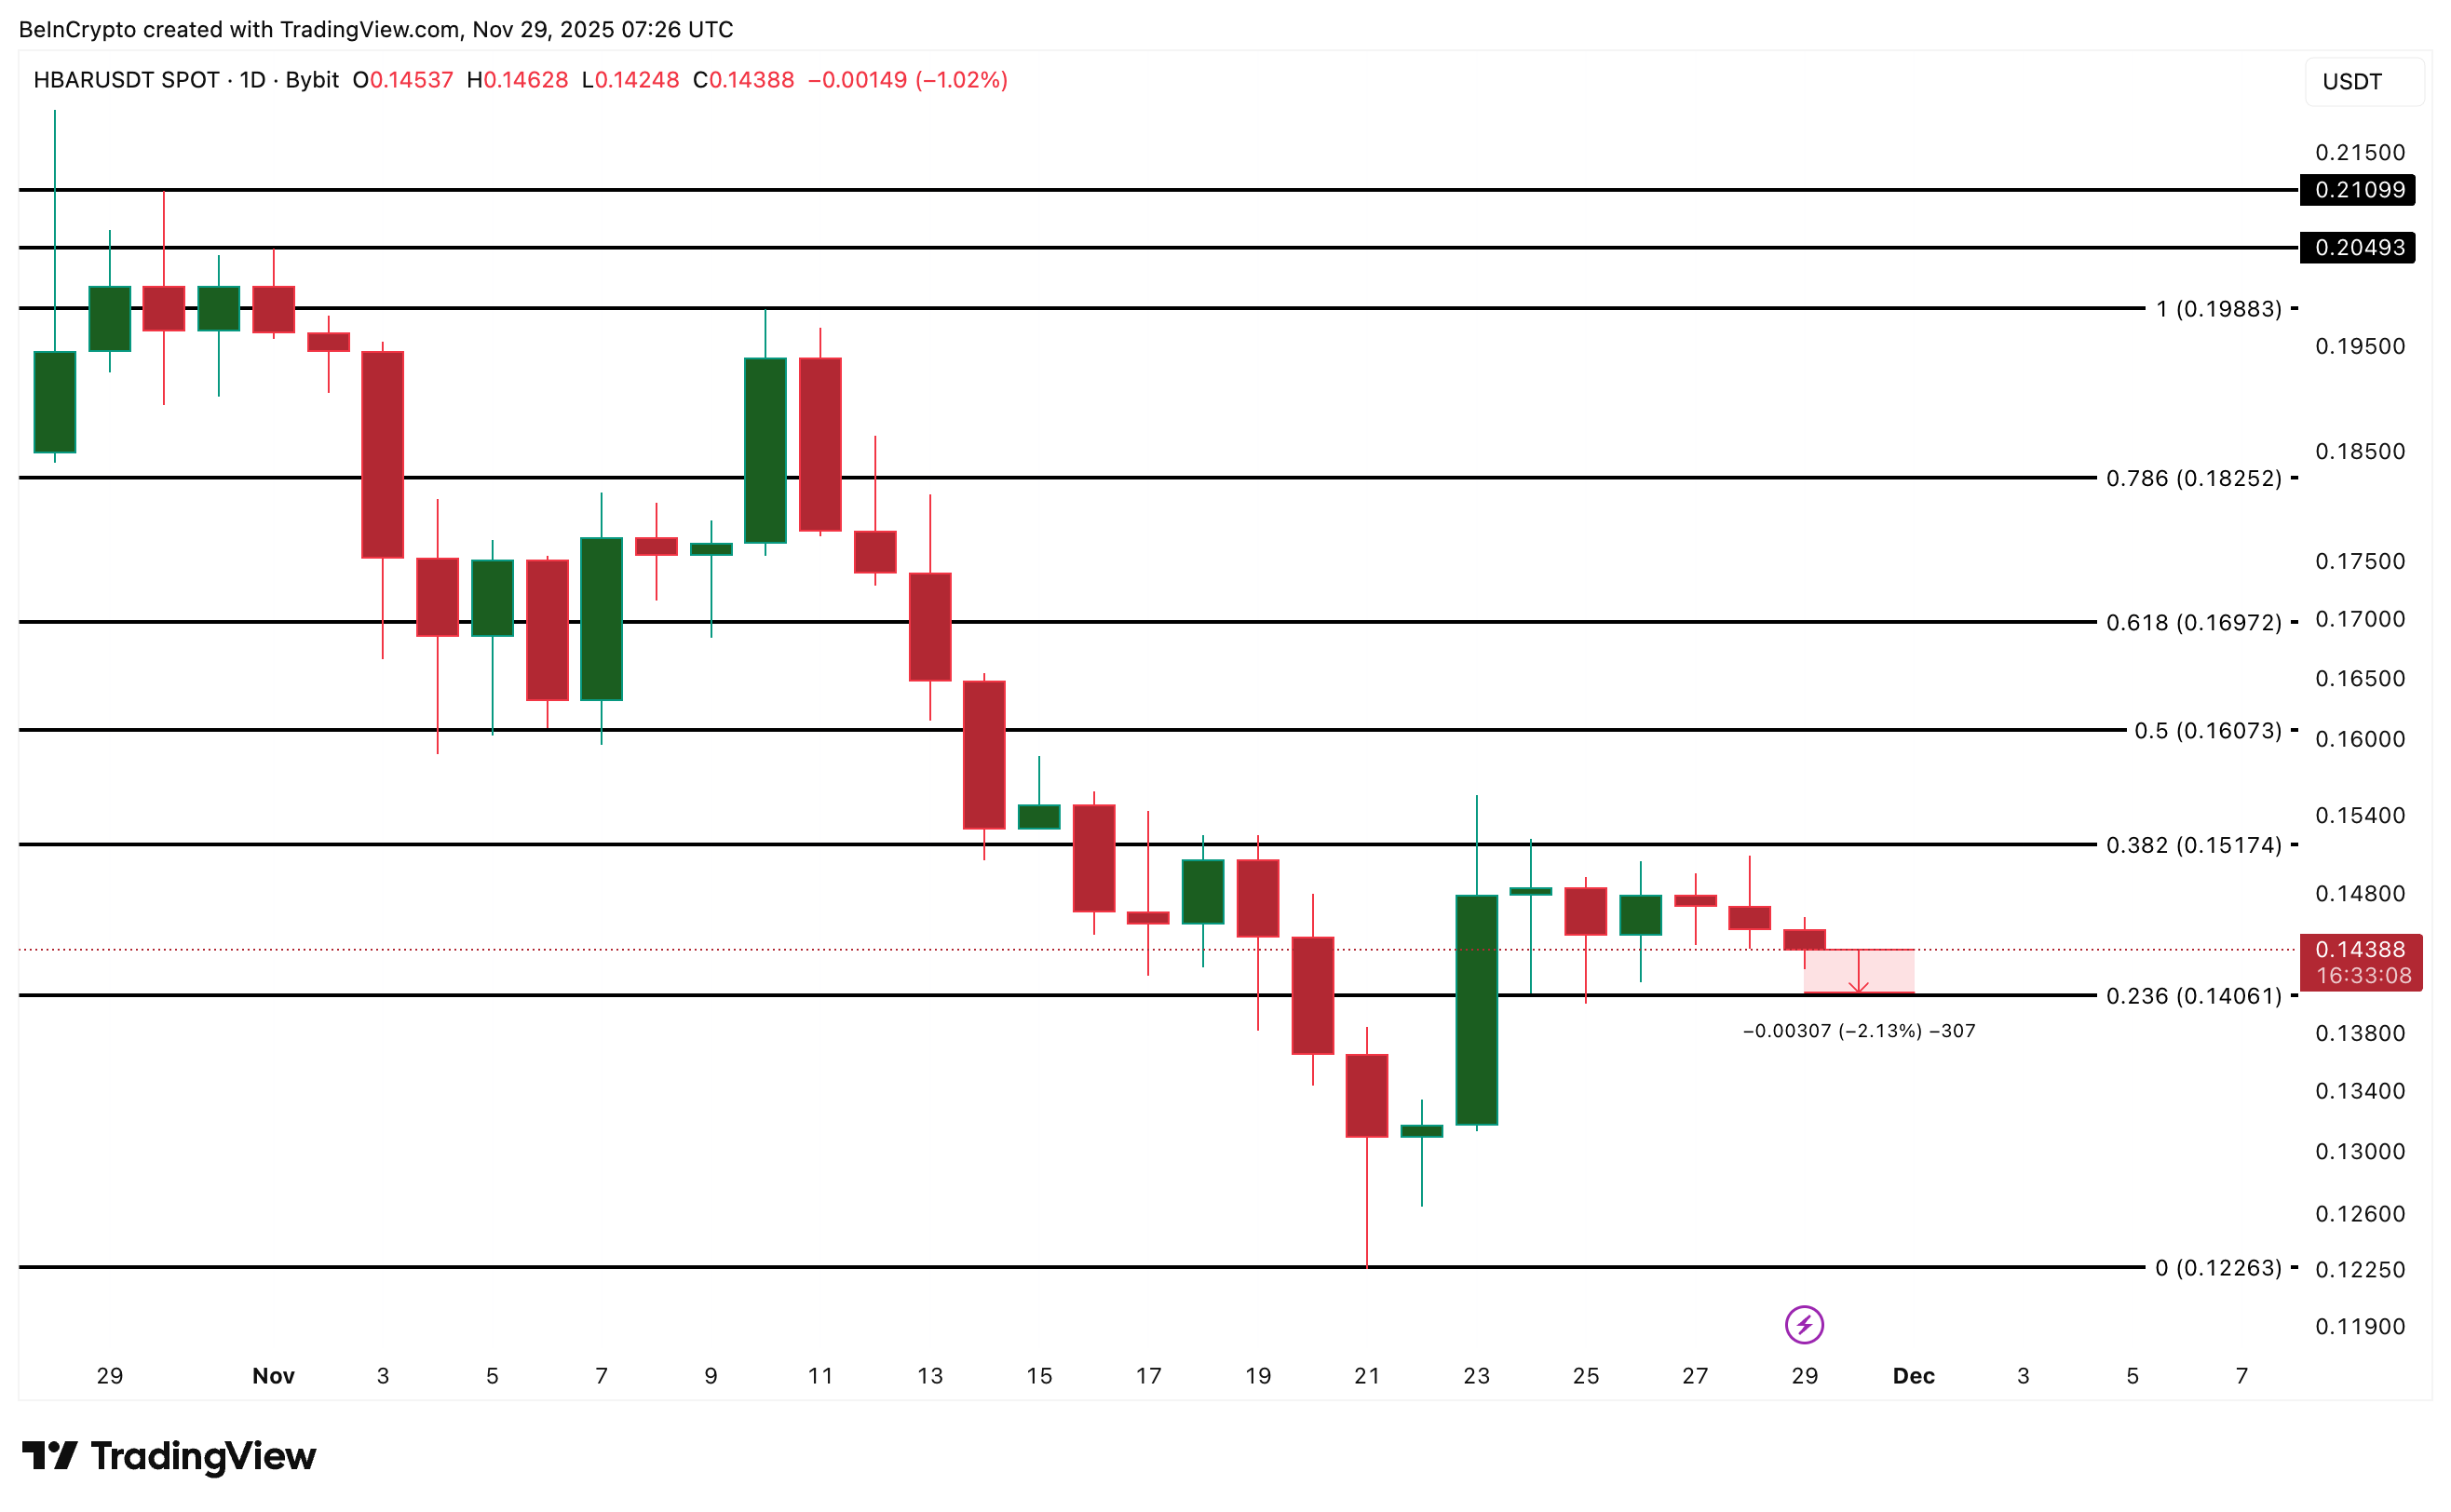
With weak spot demand and falling money flow, the HBAR price action becomes the final judge.

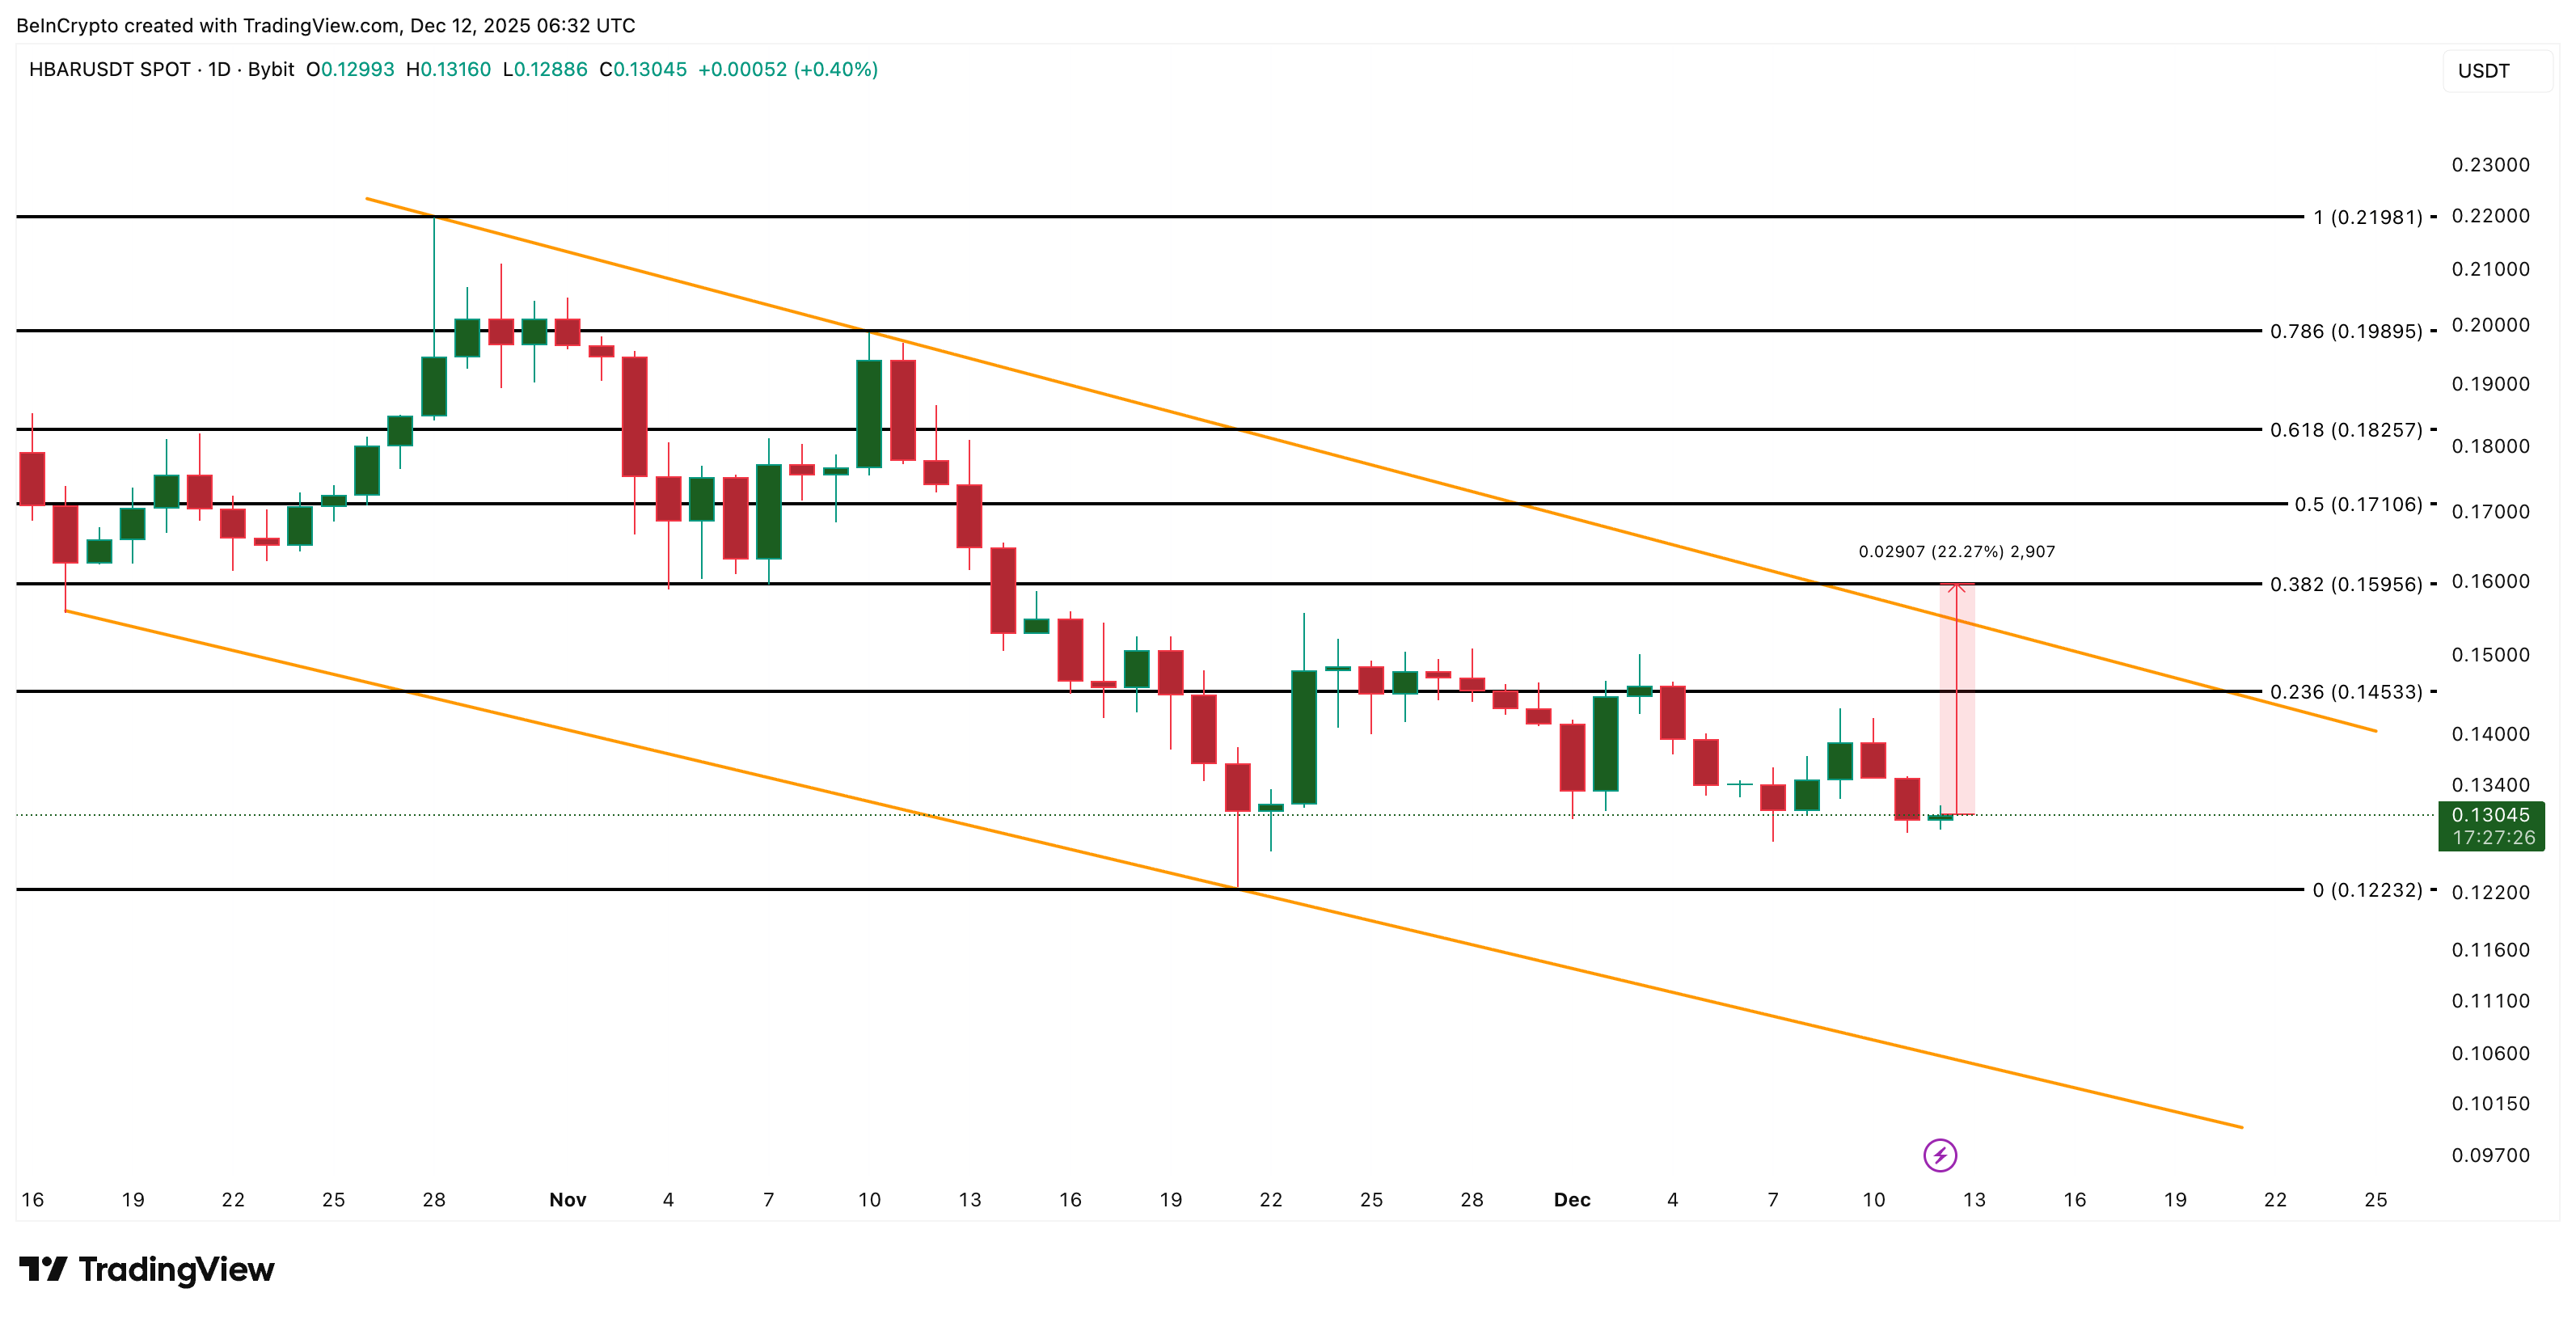
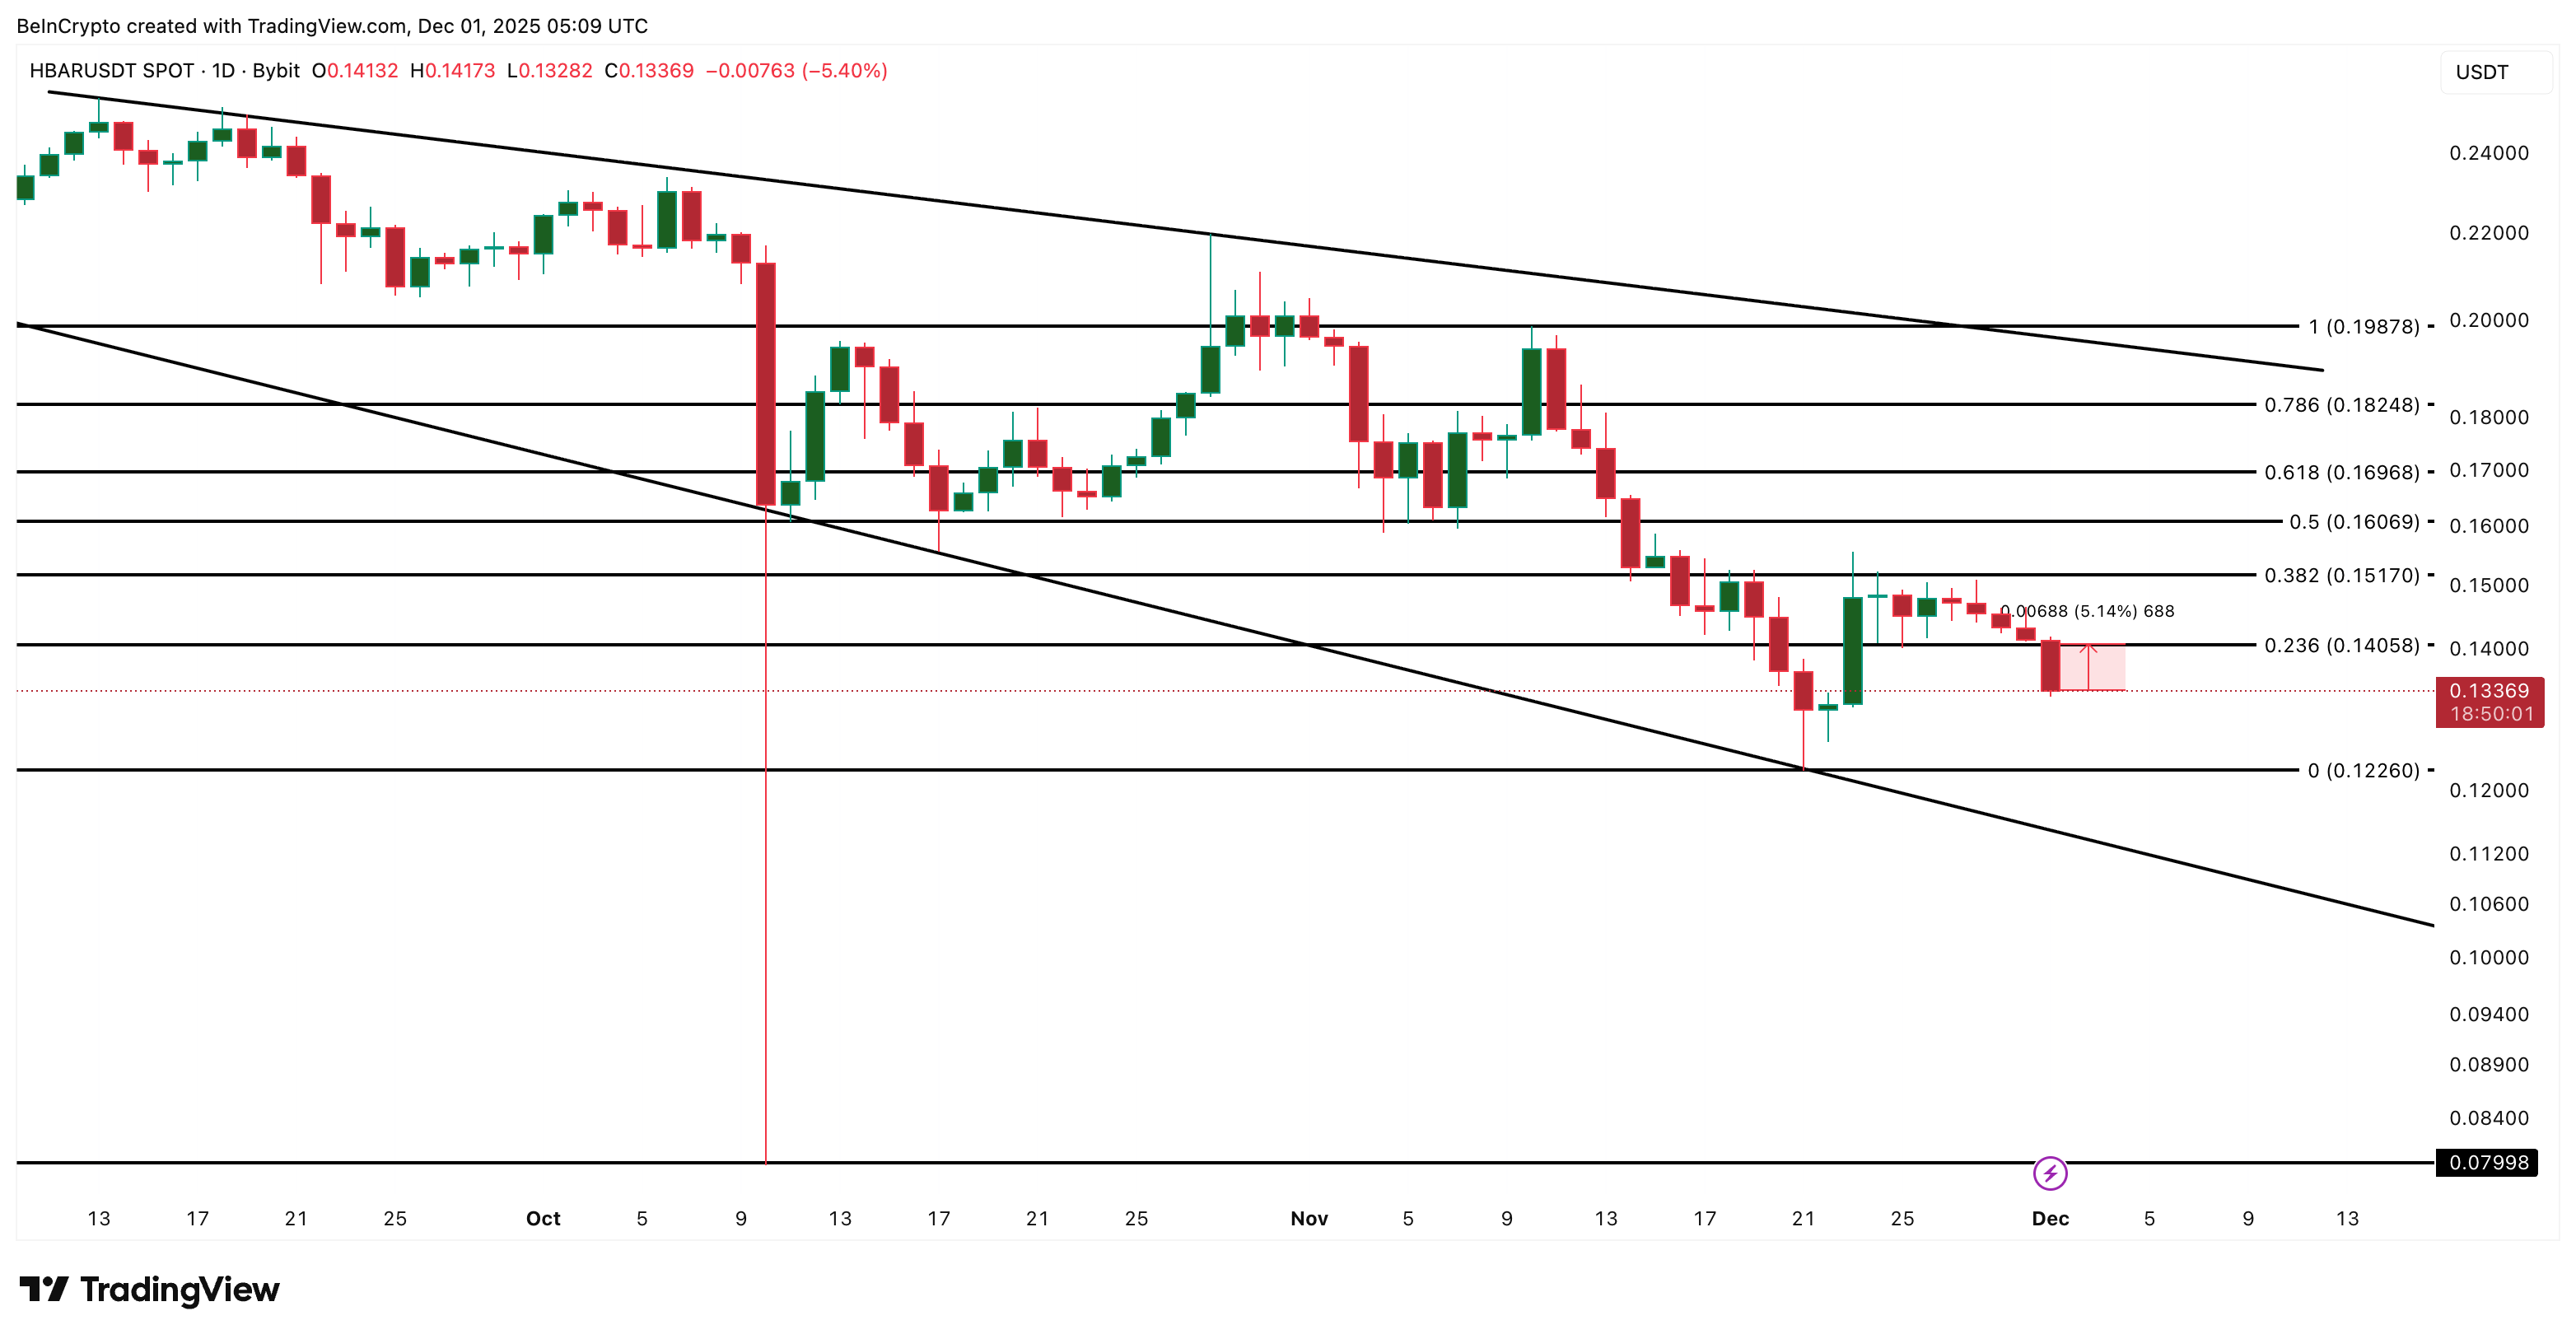
HBAR is sitting near the lower boundary of its descending channel. The first key level to watch is $0.106. If price loses this level on a daily close, the next downside target comes in near $0.095, which is about 12% lower than current levels. Reaching there would mean a confirmed bearish breakdown, bringing even $0.078 into the mix.

That move would confirm continuation of the downtrend rather than a temporary dip.

HBAR Price Analysis
HBAR Price Analysis: TradingView

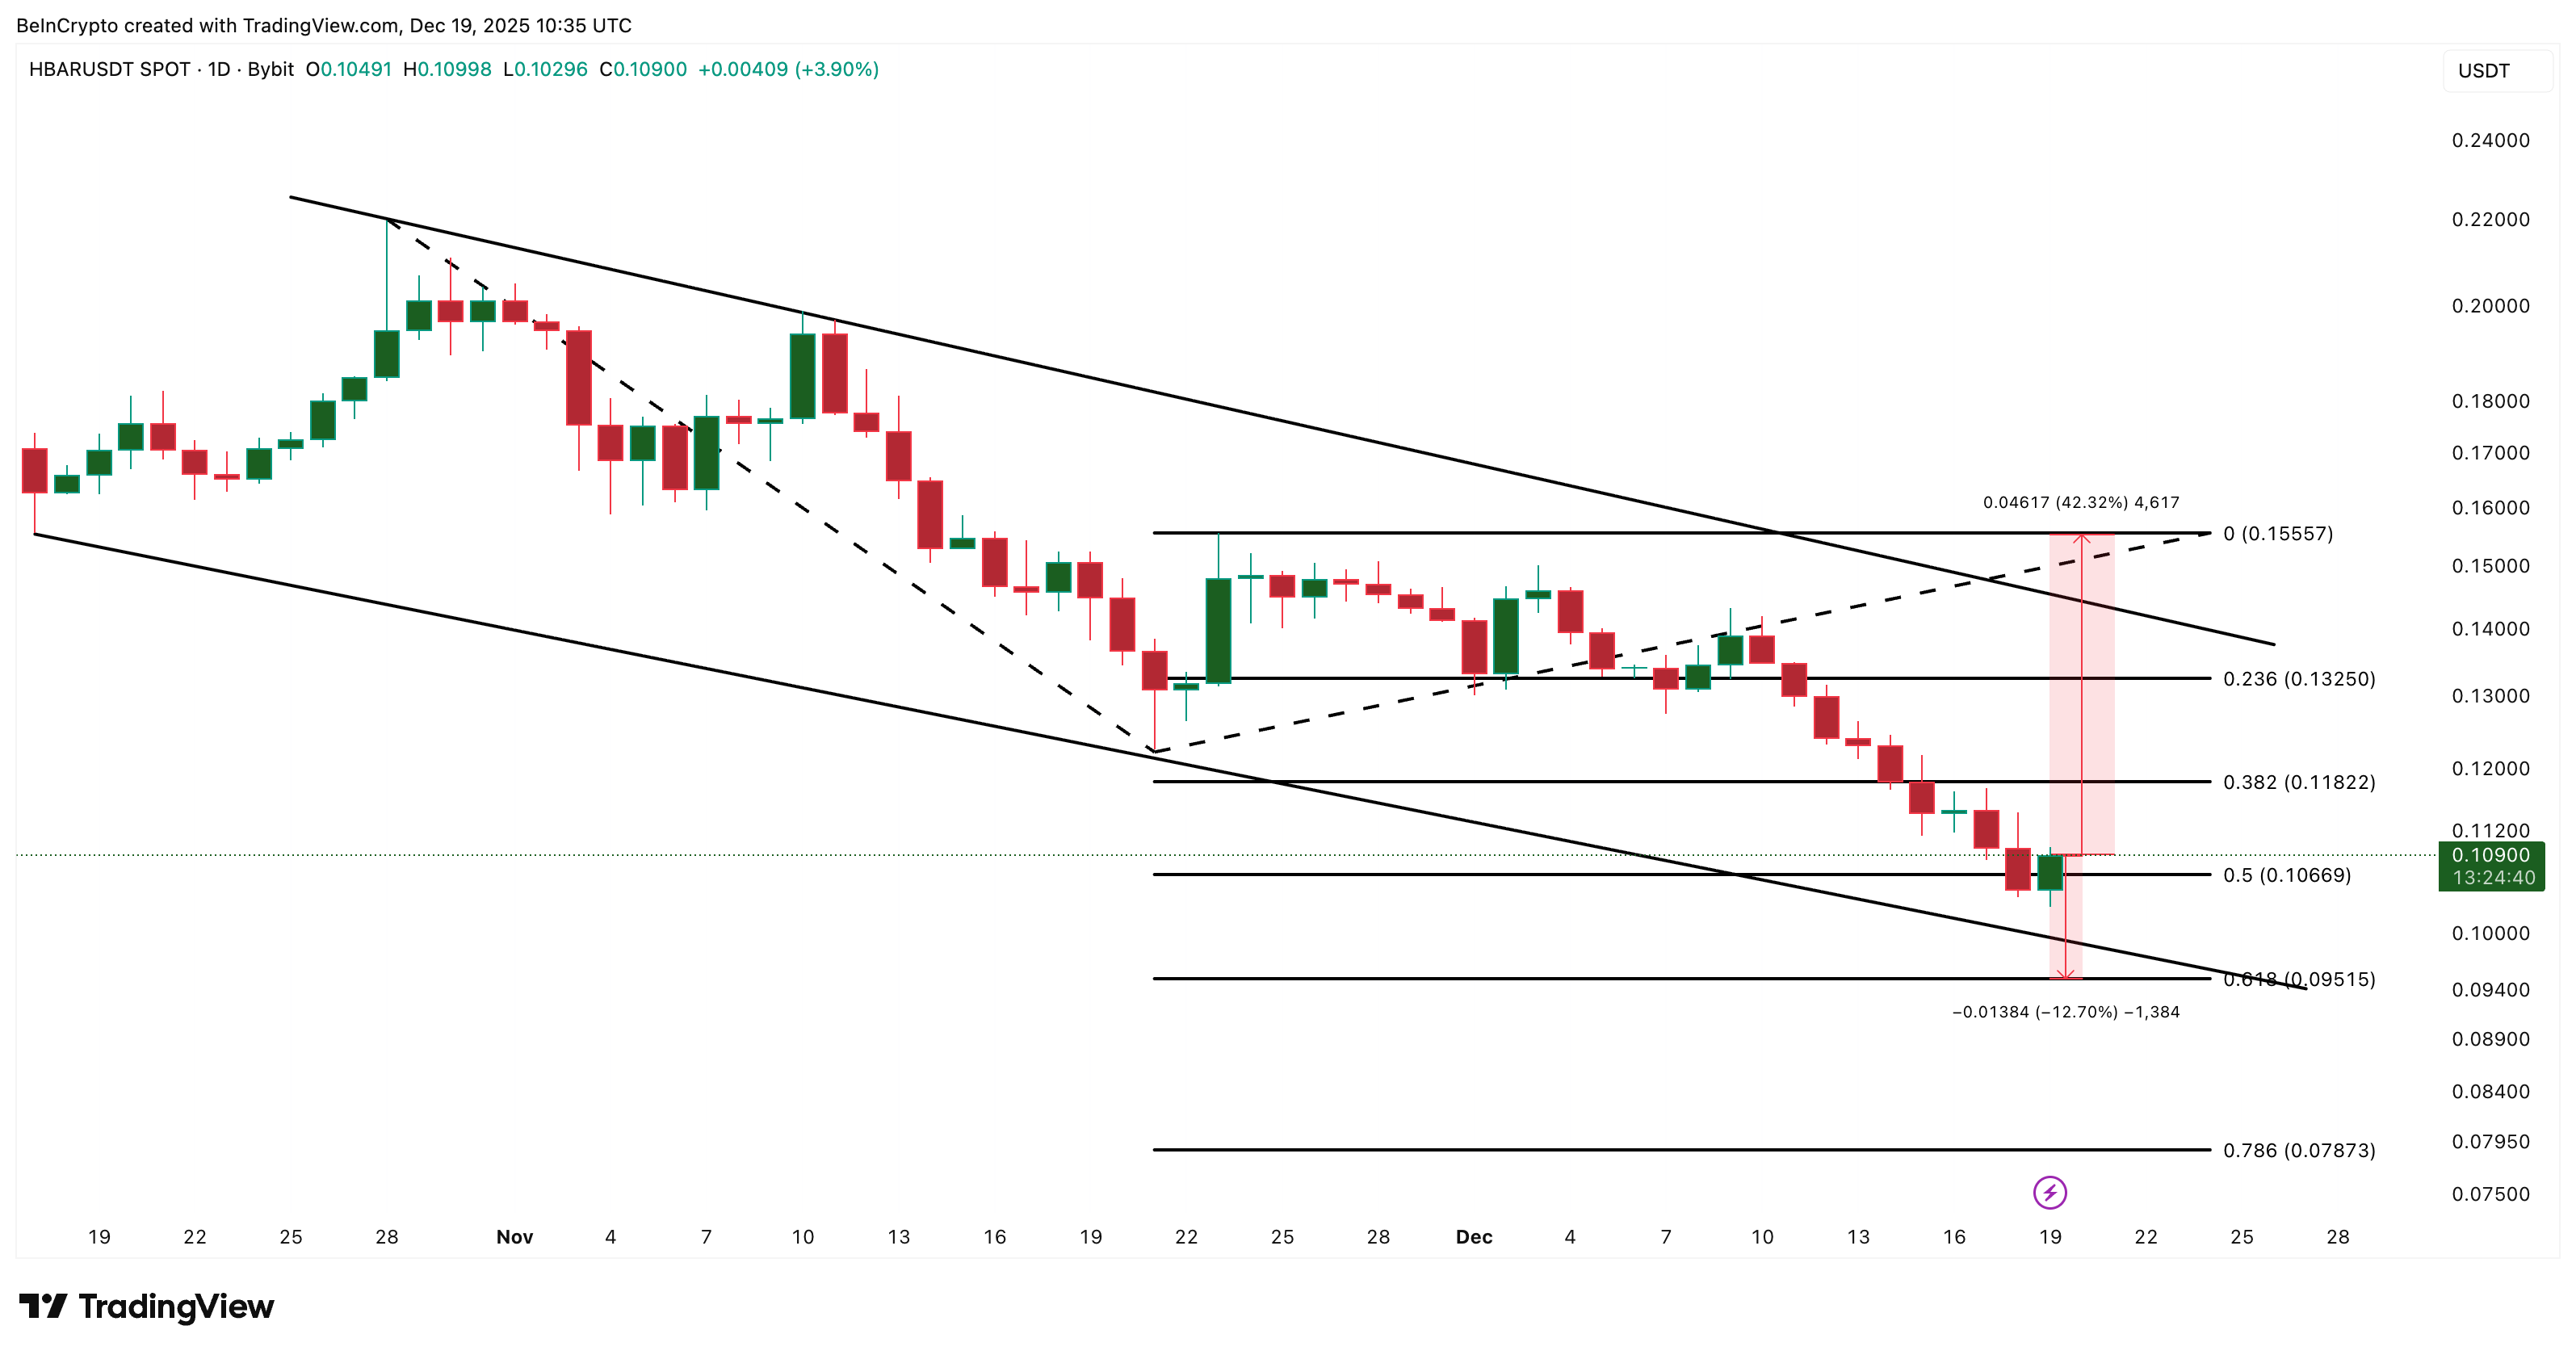
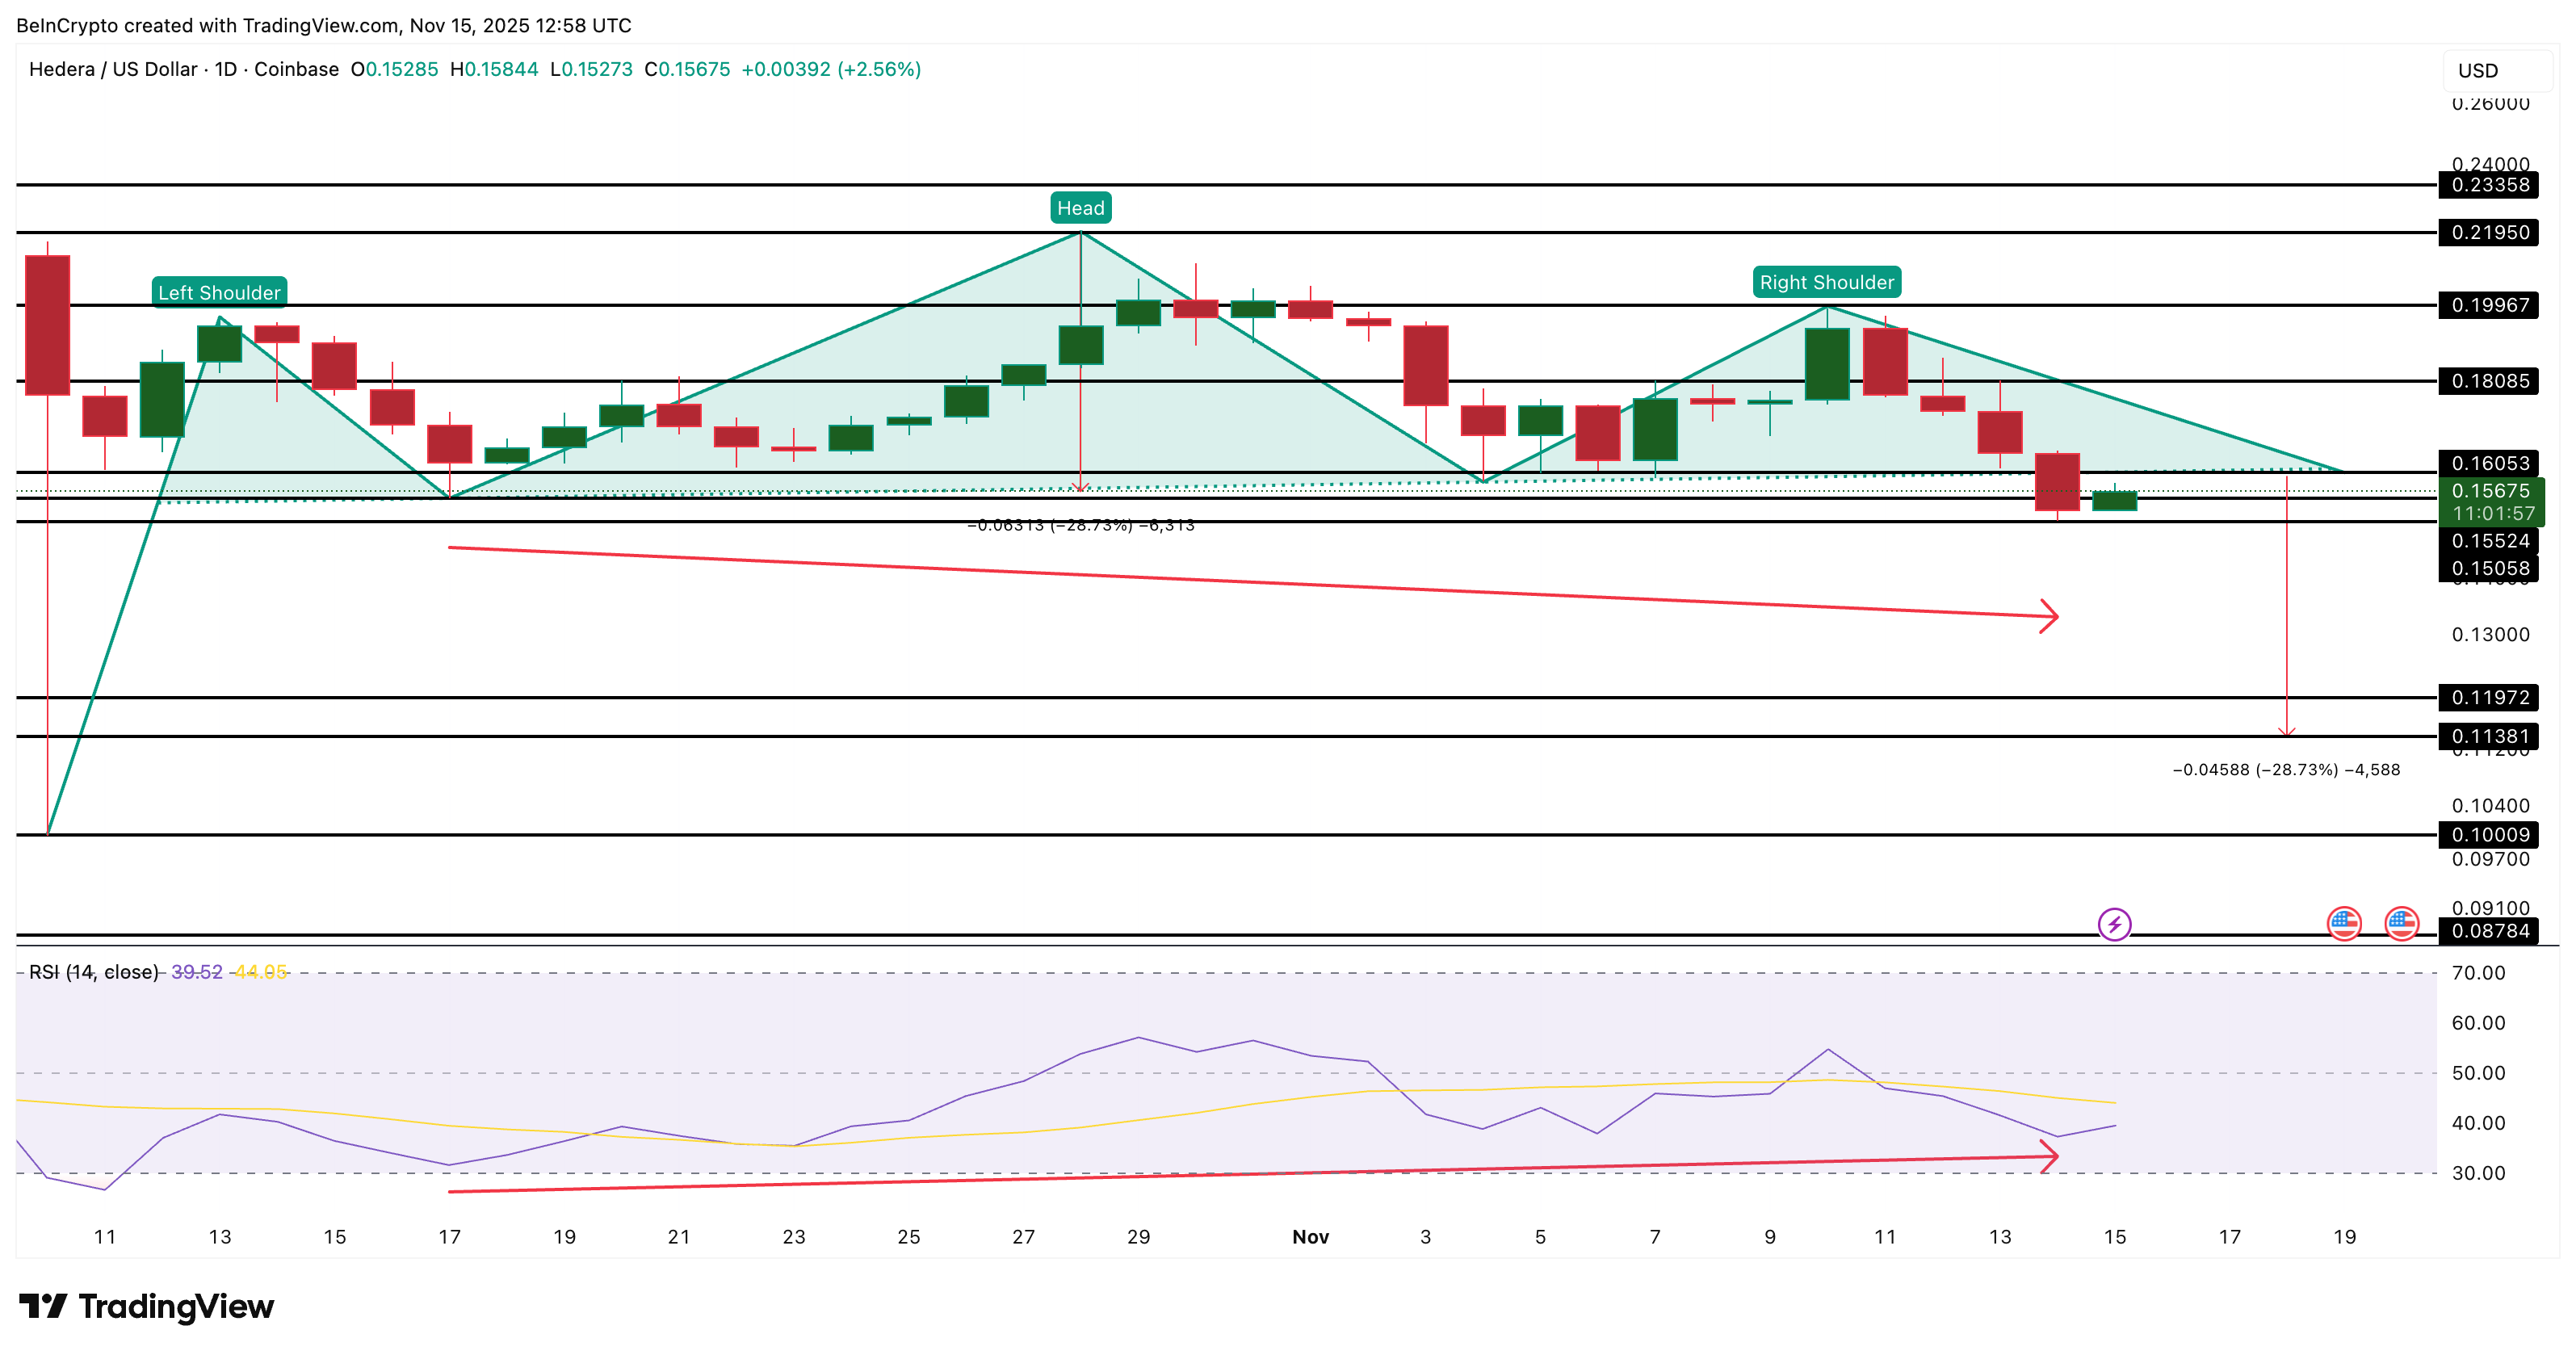
For the bearish case to break, HBAR would need a major shift. Price would have to reclaim several resistance zones and close near $0.155. Given the collapse in spot buying and the persistence of weak MFI, that outcome appears unlikely at present.

The conclusion is straightforward. With buyers largely gone, money flow falling, and price already trapped in a bearish structure, a breakdown is no longer just a risk. For now, it is the base case, or rather a likely outcome.

The post 90% of HBAR Buyers Are Gone — Is Price Breakdown Now the Base Case? appeared first on BeInCrypto.

  •  

HBAR Has One Bullish Play Left — Is It Enough to Avoid a 13% Breakdown?

HBAR is running out of time. The token is down nearly 2% over the past 24 hours and close to 10% for the week. In the process, HBAR price has broken several short-term support levels and is now hovering near $0.12.

This level is critical. HBAR is barely 1% above a breakdown zone that could drag the price toward $0.10. That move would translate into a 12% to 13% decline from current levels. But one bullish signal is still holding the structure together. If it fails, the downside could accelerate.

Big Money Stepping Away Weakens the Setup

The main source of pressure comes from how large HBAR holders are behaving.

This is visible through the Chaikin Money Flow (CMF), which tracks whether big money is entering or exiting an asset by combining price movement with trading volume. When CMF is above zero, large buyers are active. When it falls below zero, the distribution is taking place.

For HBAR, CMF has deteriorated sharply. Since December 7, CMF has dropped by more than 400% and moved deep into negative territory. Earlier pullbacks still saw CMF stay positive, meaning buyers absorbed selling pressure. This time, that support is gone.


Big Money Dumping HBAR
Big Money Dumping HBAR: TradingView

Want more token insights like this? Sign up for Editor Harsh Notariya’s Daily Crypto Newsletter here.

There is also a clear bearish divergence. Between October 10 and December 14, the HBAR price formed higher lows, while the CMF formed lower lows. This shows that recent price stability was not backed by strong demand from large players.

In simple terms, price tried to hold up while big money quietly exited. That imbalance makes the HBAR price vulnerable.

One Bullish Signal Is Still Holding the Floor

Despite the weak big-money picture, one momentum indicator is still flashing a bullish sign.

That indicator is the Relative Strength Index (RSI), which measures the strength and speed of recent price moves. It helps identify when selling pressure may be getting exhausted. Readings near 30 usually suggest oversold conditions.

On HBAR’s daily chart, RSI has formed a bullish divergence. Between November 21 and December 14, the HBAR price made a lower low, while the RSI made a higher low. This is a classic bullish divergence and often appears as a trend reversal sign.

P.S. The HBAR price is in a clear downtrend, losing over 48% in the 3-month horizon.

Bullish Divergence In Play: TradingView

This tells us sellers are still pushing prices lower, but with less force each time. The decline continues, but the seller-driven momentum behind it is weakening. At the moment, this RSI divergence is the only bullish play HBAR has left.

HBAR Price Breaks Down or Turns the Tide?

Price action defines the final outcome. HBAR is trading below a descending trend line that has capped every rally for weeks. At the same time, price is sitting on a trend-based Fibonacci support near $0.12. That line acts as the base of the descending triangle pattern, completed by the descending trendline.

This zone is the last line of defense.

If $0.12 breaks decisively, the next major support sits near $0.10. That move would confirm a 12% to 13% breakdown and extend the bearish trend.

HBAR Price Analysis
HBAR Price Analysis: TradingView

To stabilize, the HBAR price must reclaim $0.13. That level lines up with a key Fibonacci retracement zone and would signal buyers stepping back in.

A stronger shift would only come above $0.13. That would place the price back above the descending trend line and reset the structure from bearish to neutral.

The post HBAR Has One Bullish Play Left — Is It Enough to Avoid a 13% Breakdown? appeared first on BeInCrypto.

  •  

Hedera Whales Pick Up 3.4 Billion HBAR Despite the Dip — What Are They Seeing?

HBAR price is flat today after a sharp monthly drop of nearly 29%. It is still down about 6% over the past week. The trend looks weak, but the deeper picture is more complex. Retail demand is soft, yet whales have added significantly over the past two days.

This mix of weakness and accumulation suggests a base may be forming even though the price action still looks weak.

Weak Demand Meets Heavy Accumulation?

HBAR is still moving inside a falling wedge. A wedge is usually a bullish structure because it shows sellers losing strength over time. But inside that wedge, something weaker appeared. Between December 7 and December 11, the HBAR price made a higher low while the On-Balance Volume (OBV) made a lower low.

Weak Retail Support: TradingView

Want more token insights like this? Sign up for Editor Harsh Notariya’s Daily Crypto Newsletter here.

OBV is a cumulative volume tool that tracks whether money is flowing in or out of a token. When price makes a higher low but OBV drops, buyers do not have enough strength to support the bounce. That creates a bearish divergence even inside a bullish pattern.

Whales, however, are acting very differently. Accounts holding at least 10 million HBAR increased from 136.54 to 149.49. Accounts with at least 100 million HBAR rose from 40.65 to 73.62. Using only the minimum thresholds, whales added about 3.42 billion HBAR in under 48 hours. At the current price, this stash is worth at least $445 million.

HBAR Whales In Action
HBAR Whales In Action: Hedera Watch

OBV tracks traded volume on exchanges; large off-exchange transfers or OTC/custody moves may not appear in OBV, so OBV can miss some whale activity and is a better representation of retail interest.

This contradiction sets the stage for the next section, because whales are likely reacting to a deeper signal.

A Repeated Signal That Whales May Be Watching

Between October 17 and December 11, the price made a lower low while the RSI (Relative Strength Index) made a higher low. RSI measures the speed of buying and selling. When price falls, but RSI rises, it forms a standard bullish divergence. This kind of divergence is linked with trend reversals.

This same divergence appeared before earlier bounces. On December 1 and December 7, the pattern showed up, and HBAR moved 15%, and 12% from the lows. Each move stalled at resistance, but this time the divergence shows up alongside massive whale accumulation. That combination makes the current reversal attempt more meaningful than the previous ones inside the wedge.

RSI Divergence
RSI Divergence: TradingView

If the caps that stopped the earlier rallies break, the divergence can shift the broader structure from bearish to bullish. That may be what whales are positioning for.

The Most Critical HBAR Price Levels

The HBAR price needs a daily close above $0.159. This level wasn’t breached during the previous bounces. A breakout above it also breaks the wedge’s upper trend line and opens room for a move toward $0.198 and $0.219.

If price weakens again, $0.122 is the line to watch. A drop below it sends HBAR back to the wedge’s lower boundary. That line is weak because it has only two touch points. A break below it delays any recovery and signals that sellers still control the broader trend.

HBAR Price Analysis
HBAR Price Analysis: TradingView

Right now, OBV shows weak demand, RSI shows a bullish setup, and whales have added about 3.42 billion HBAR at the lows. If HBAR can clear $0.159, the whale accumulation becomes a major tailwind instead of a background signal.

The post Hedera Whales Pick Up 3.4 Billion HBAR Despite the Dip — What Are They Seeing? appeared first on BeInCrypto.

  •  

HBAR Drops 6% as Market Weakens, Yet 3 Early Rebound Clues Appear

HBAR price is down about 6% in the past 24 hours, underperforming an already weak crypto market. Even with this pressure, the chart is flashing a rare mix of three early rebound clues that most mid-caps are not showing right now.

If the broader market steadies, HBAR could be one of the first to move, especially if it protects a key support level discussed later.

Accumulation Signs Build Beneath the Decline

HBAR has moved inside a broad falling wedge since early September. This pattern often turns bullish when sellers lose control near the lower boundary, and that shift first appeared around November 21.

The first clue comes from the changing volume behavior. HBAR’s activity follows a Wyckoff-style color pattern: red shows sellers in control, yellow shows sellers gaining control, blue marks buyers gaining control, and green shows buyers fully in control.

Since HBAR peaked at $0.155 on November 23 and fell nearly 15%, the bars have shifted from heavy red to a blend of yellow and blue. That blend is a classic sign of seller exhaustion and early tug-of-war. The last time this mix showed up — between October 15 and October 28 — HBAR climbed 41% right after.

Buyer-Seller Indecision Builds
Buyer-Seller Indecision Builds: TradingView

Want more token insights like this? Sign up for Editor Harsh Notariya’s Daily Crypto Newsletter here.

A second clue appears in the MFI (Money Flow Index), which tracks buying and selling pressure using both price and volume. Between November 23 and December 1, the HBAR price kept making lower highs while MFI made higher highs. That divergence shows dips are being quietly bought. A similar divergence formed between October 6 and October 24 and led to a 33% jump once it completed.

HBAR Dips Are Being Bought
HBAR Dips Are Being Bought: TradingView

The third clue comes from steady spot ETF demand. The Canary HBAR Spot ETF has posted positive weekly inflows in four of the last five weeks, with more than $80 million in cumulative inflows. Inflows are smaller than late October, but they remain positive even as price falls — meaning broader demand has not vanished.

HBAR ETF Flow
HBAR ETF Flow: SoSo Value

Together, these three clues — shifting volume control, dip-buying pressure, and ongoing ETF inflows — show early accumulation forming beneath the surface.

Key HBAR Price Levels Decide Whether the Rebound Can Hold

The wedge’s lower boundary near $0.122 is the most important support for HBAR right now. Holding that area keeps the rebound case alive. Losing it exposes the next major zone near $0.079, which would flip the structure from “early accumulation” to a deeper slide.

HBAR Price Analysis
HBAR Price Analysis: TradingView

For strength, HBAR needs to reclaim $0.140 first, a 5% rebound from the current level. That would show that buyers are finally overpowering the sell-side pressure. If $0.140 breaks, the next major level sits at $0.155. Clearing $0.155 opens the path toward $0.169 and even $0.182 if the crypto market improves.

The post HBAR Drops 6% as Market Weakens, Yet 3 Early Rebound Clues Appear appeared first on BeInCrypto.

  •  

HBAR Price Near a Range Break — And the Next Move Could Hurt Bulls

HBAR is down almost 31% over the past month, even after posting a sharp 27% rebound between November 21 and 23. That bounce still keeps about 11% of gains on the weekly chart, but the move has stalled again.

The token has spent almost a full week trading between two close price levels, and that tight range now looks ready to break. Key signs are now flashing. However, the signals suggest that the break might not favor the bulls.

Momentum Signals Turn Against Hedera

HBAR’s momentum weakened right after the rebound. Between November 23 and November 26, the price formed a lower high while the RSI made a higher high.

The RSI, or Relative Strength Index, measures momentum. When momentum rises, but the chart prints a lower high, it creates a hidden bearish divergence, which often signals that the downtrend can continue.

HBAR Faces A Bearish Risk
HBAR Faces A Bearish Risk: TradingView

Want more token insights like this? Sign up for Editor Harsh Notariya’s Daily Crypto Newsletter here.

HBAR’s broader trend still shows a 31% drop over the past month, so the setup fits the pattern.

Volume data points the same way. OBV, or On-Balance Volume, tracks whether real buyers or sellers dominate.

HBAR’s OBV remains stuck under a descending trendline, and between November 25 and 28, the price made a higher low, but OBV made a lower low.

This is a bearish divergence, indicating fading buyer strength, even as the candles attempt to stabilize. As long as OBV trades under the trendline, pressure stays on the downside.

Volume Weakens
Volume Weakens: TradingView

Both divergences reinforce each other. They explain why the rebound from November 21 to 23 could not build follow-through and why the current range looks unstable.

With momentum fading and buyer pressure weakening at the same time, the market may try to extend the previous downtrend.

HBAR Price Levels: One Range, Two Outcomes

The HBAR price has been moving between $0.151 on the upside and $0.140 on the downside for almost a week. That’s the same tight range mentioned earlier.

Momentum signals now show that this range is close to breaking.

If $0.140 gives way, the chart opens a move toward $0.122, which is the most recent support zone. A clean candle close below $0.140 confirms the breakdown and wipes out what remains of the weekly rebound.

For the bearish setup to fail, the entire structure must shift. OBV needs to break above its descending trendline so that buyer pressure returns.

At the same time, HBAR must close above $0.151, a level it has not crossed since November 16.

HBAR Price Analysis
‘HBAR Price Analysis: TradingView

Until those conditions are met, the HBAR price remains at risk. The range may not hold if the broader market weakens again, and the next move could come quickly once the $0.140 line breaks or holds.

The post HBAR Price Near a Range Break — And the Next Move Could Hurt Bulls appeared first on BeInCrypto.

  •  

HBAR Price Falls 18% A Week After Losing Its Month-Long Support

Hedera has suffered a sharp decline over the past week, with its price falling to $0.130 after losing more than 18%. 

This drop is significant because HBAR broke below a crucial support level that had protected investors’ profits for more than a month. 

Hedera Is Following The King

Hedera’s correlation with Bitcoin currently sits at 0.97, one of its highest readings in months. This near-perfect correlation signals that HBAR is heavily mirroring Bitcoin’s price movement.

Such strong alignment becomes especially problematic during periods when BTC faces substantial pressure, as seen this past week.

With Bitcoin dropping to $84,408, HBAR has moved almost in lockstep. The high correlation has erased Hedera’s ability to move independently, making BTC’s decline one of the primary drivers behind the altcoin’s latest losses. 

Want more token insights like this? Sign up for Editor Harsh Notariya’s Daily Crypto Newsletter here.

HBAR Correlation To Bitcoin
HBAR Correlation To Bitcoin. Source: TradingView

Macro momentum indicators reinforce the bearish picture. The Chaikin Money Flow is sitting near an eight-month low, signaling heavy capital outflows from HBAR.

CMF measures buying and selling pressure, and a deeply negative reading indicates that investors are withdrawing funds at an accelerated pace.

These persistent outflows add pressure to the already declining price trend. As liquidity exits the asset, selling intensifies and recovery efforts weaken.

Unless inflows return, HBAR may continue facing difficulty in regaining upward momentum.

HBAR CMF
HBAR CMF. Source: TradingView

HBAR Price Can Bounce Back

HBAR is down 18% this week after slipping below the crucial $0.162 support level, which had held strong for more than a month.

Losing that support has exposed the altcoin to deeper declines and increased volatility as bearish sentiment grows.

Given that macro conditions have not improved, HBAR could drop to $0.120 from its current price of $0.129.

A fall below $0.120 may trigger additional losses, sending the price toward $0.110 as selling pressure builds.

HBAR Price Analysis.
HBAR Price Analysis. Source: TradingView

If bullish momentum returns, HBAR may attempt a recovery. A move above $0.133 would be the first step toward stabilizing the trend.

Breaking past $0.145 could open the path to $0.154 and higher, invalidating the bearish outlook and restoring investor confidence.

The post HBAR Price Falls 18% A Week After Losing Its Month-Long Support appeared first on BeInCrypto.

  •  

HBAR Price Breakdown Was Expected — The Bear Trap Risk Was Not

HBAR is down almost 11% in the past week, and yesterday it finally broke below its neckline, completing the head and shoulders pattern we projected on November 13. Despite the breakdown, the last 24 hours have been surprisingly flat.

And while the structure still points toward lower levels, early signs suggest that traders betting on deeper downside may be walking into a bear trap instead. Here is why.


Selling Rises and Shorts Pile Up — But The Setup Isn’t That Simple

HBAR’s spot flows show a sharp shift in behaviour after the breakdown. On November 14, HBAR recorded –4.03 million in net outflows, meaning more tokens were leaving exchanges as buyers accumulated.

Today, after the pattern breakdown confirmed, flows flipped to +420,790 HBAR.

Sellers Are Back Post Breakdown
Sellers Are Back Post Breakdown: Coinglass

Want more token insights like this? Sign up for Editor Harsh Notariya’s Daily Crypto Newsletter here.

That is a 110% swing from negative to positive netflow — a clear sign that sellers have stepped in aggressively after the pattern break.

The derivatives market shows an even stronger tilt. On Bitget’s liquidation map alone, short exposure is $16.71 million, while long exposure is $6.09 million. This means shorts now control 73% of all leveraged positions — about 2.7 times more than longs.

HBAR Shorts Dominate The Map
HBAR Shorts Dominate The Map: Coinglass

This kind of crowded positioning often fuels the conditions for a bear trap risk, where price briefly reverses upward and forces shorts to close their positions at a loss.

The HBAR price breakdown has occurred, yes — but this positioning makes it dangerous to assume the move will continue uninterrupted.


One Move Could Drive HBAR Price Rebound, Hitting Short Liquidations

The price chart contains the key reason a bear trap is possible. While HBAR broke below the neckline, the follow-through has been weak. At the same time, the Relative Strength Index (RSI) — a metric that measures price momentum to show if an asset is oversold or overbought — is showing a notable pattern.

Between October 17 and November 14, the price made a lower low, while RSI formed a higher low. This is a bullish RSI divergence, and it often appears just before a short-term reversal attempt.

If the divergence plays out, the first trigger is a move back above $0.160, which is exactly where the neckline sits. Reclaiming this level puts a large block of short positions at risk.

The liquidation map shows that shorts begin getting squeezed as the price rises above this zone.

HBAR Price Analysis: TradingView

A push above $0.180 would confirm the trap is fully in place and force even deeper short liquidations, giving HBAR room for a stronger rebound. However, the trap only works if buyers hold key support levels.

If HBAR drops below $0.155, the divergence weakens and the downtrend regains control. In that case, the head and shoulders projection remains valid, opening the way toward the earlier bearish target near $0.113.

The post HBAR Price Breakdown Was Expected — The Bear Trap Risk Was Not appeared first on BeInCrypto.

  •