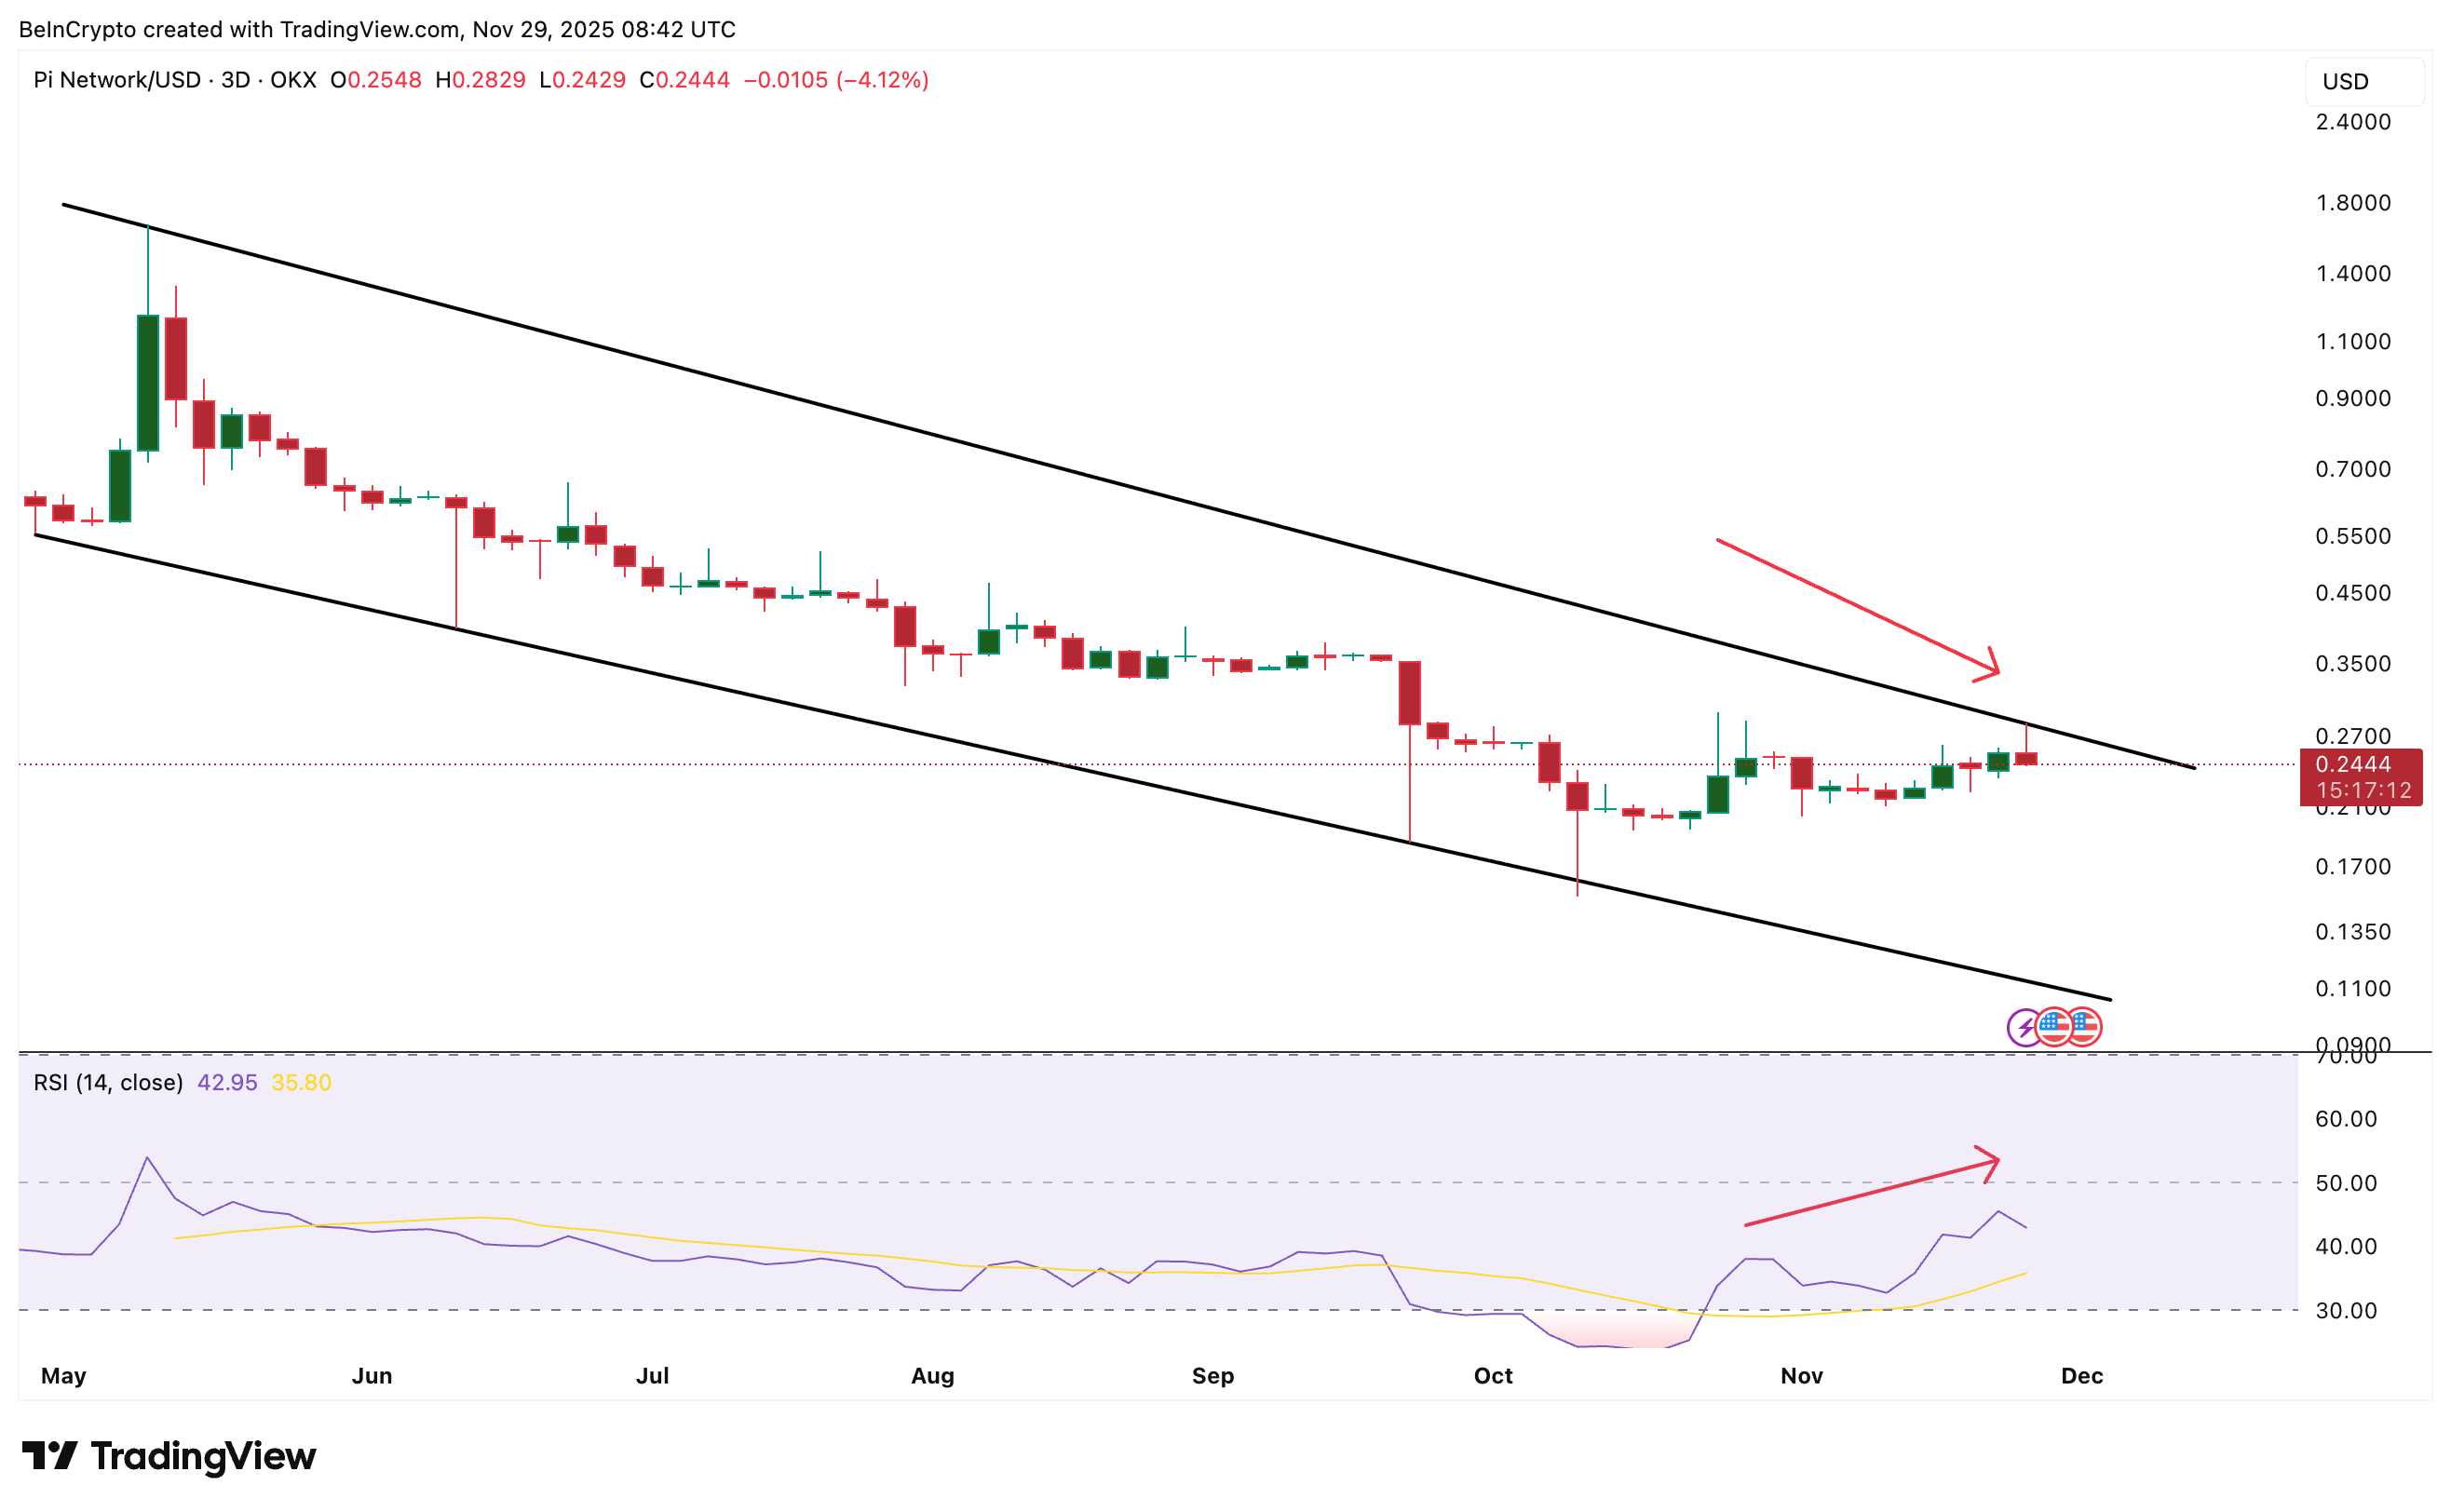
Pi Coin’s Decline Continues, Yet the Data Tells a More Complex Story
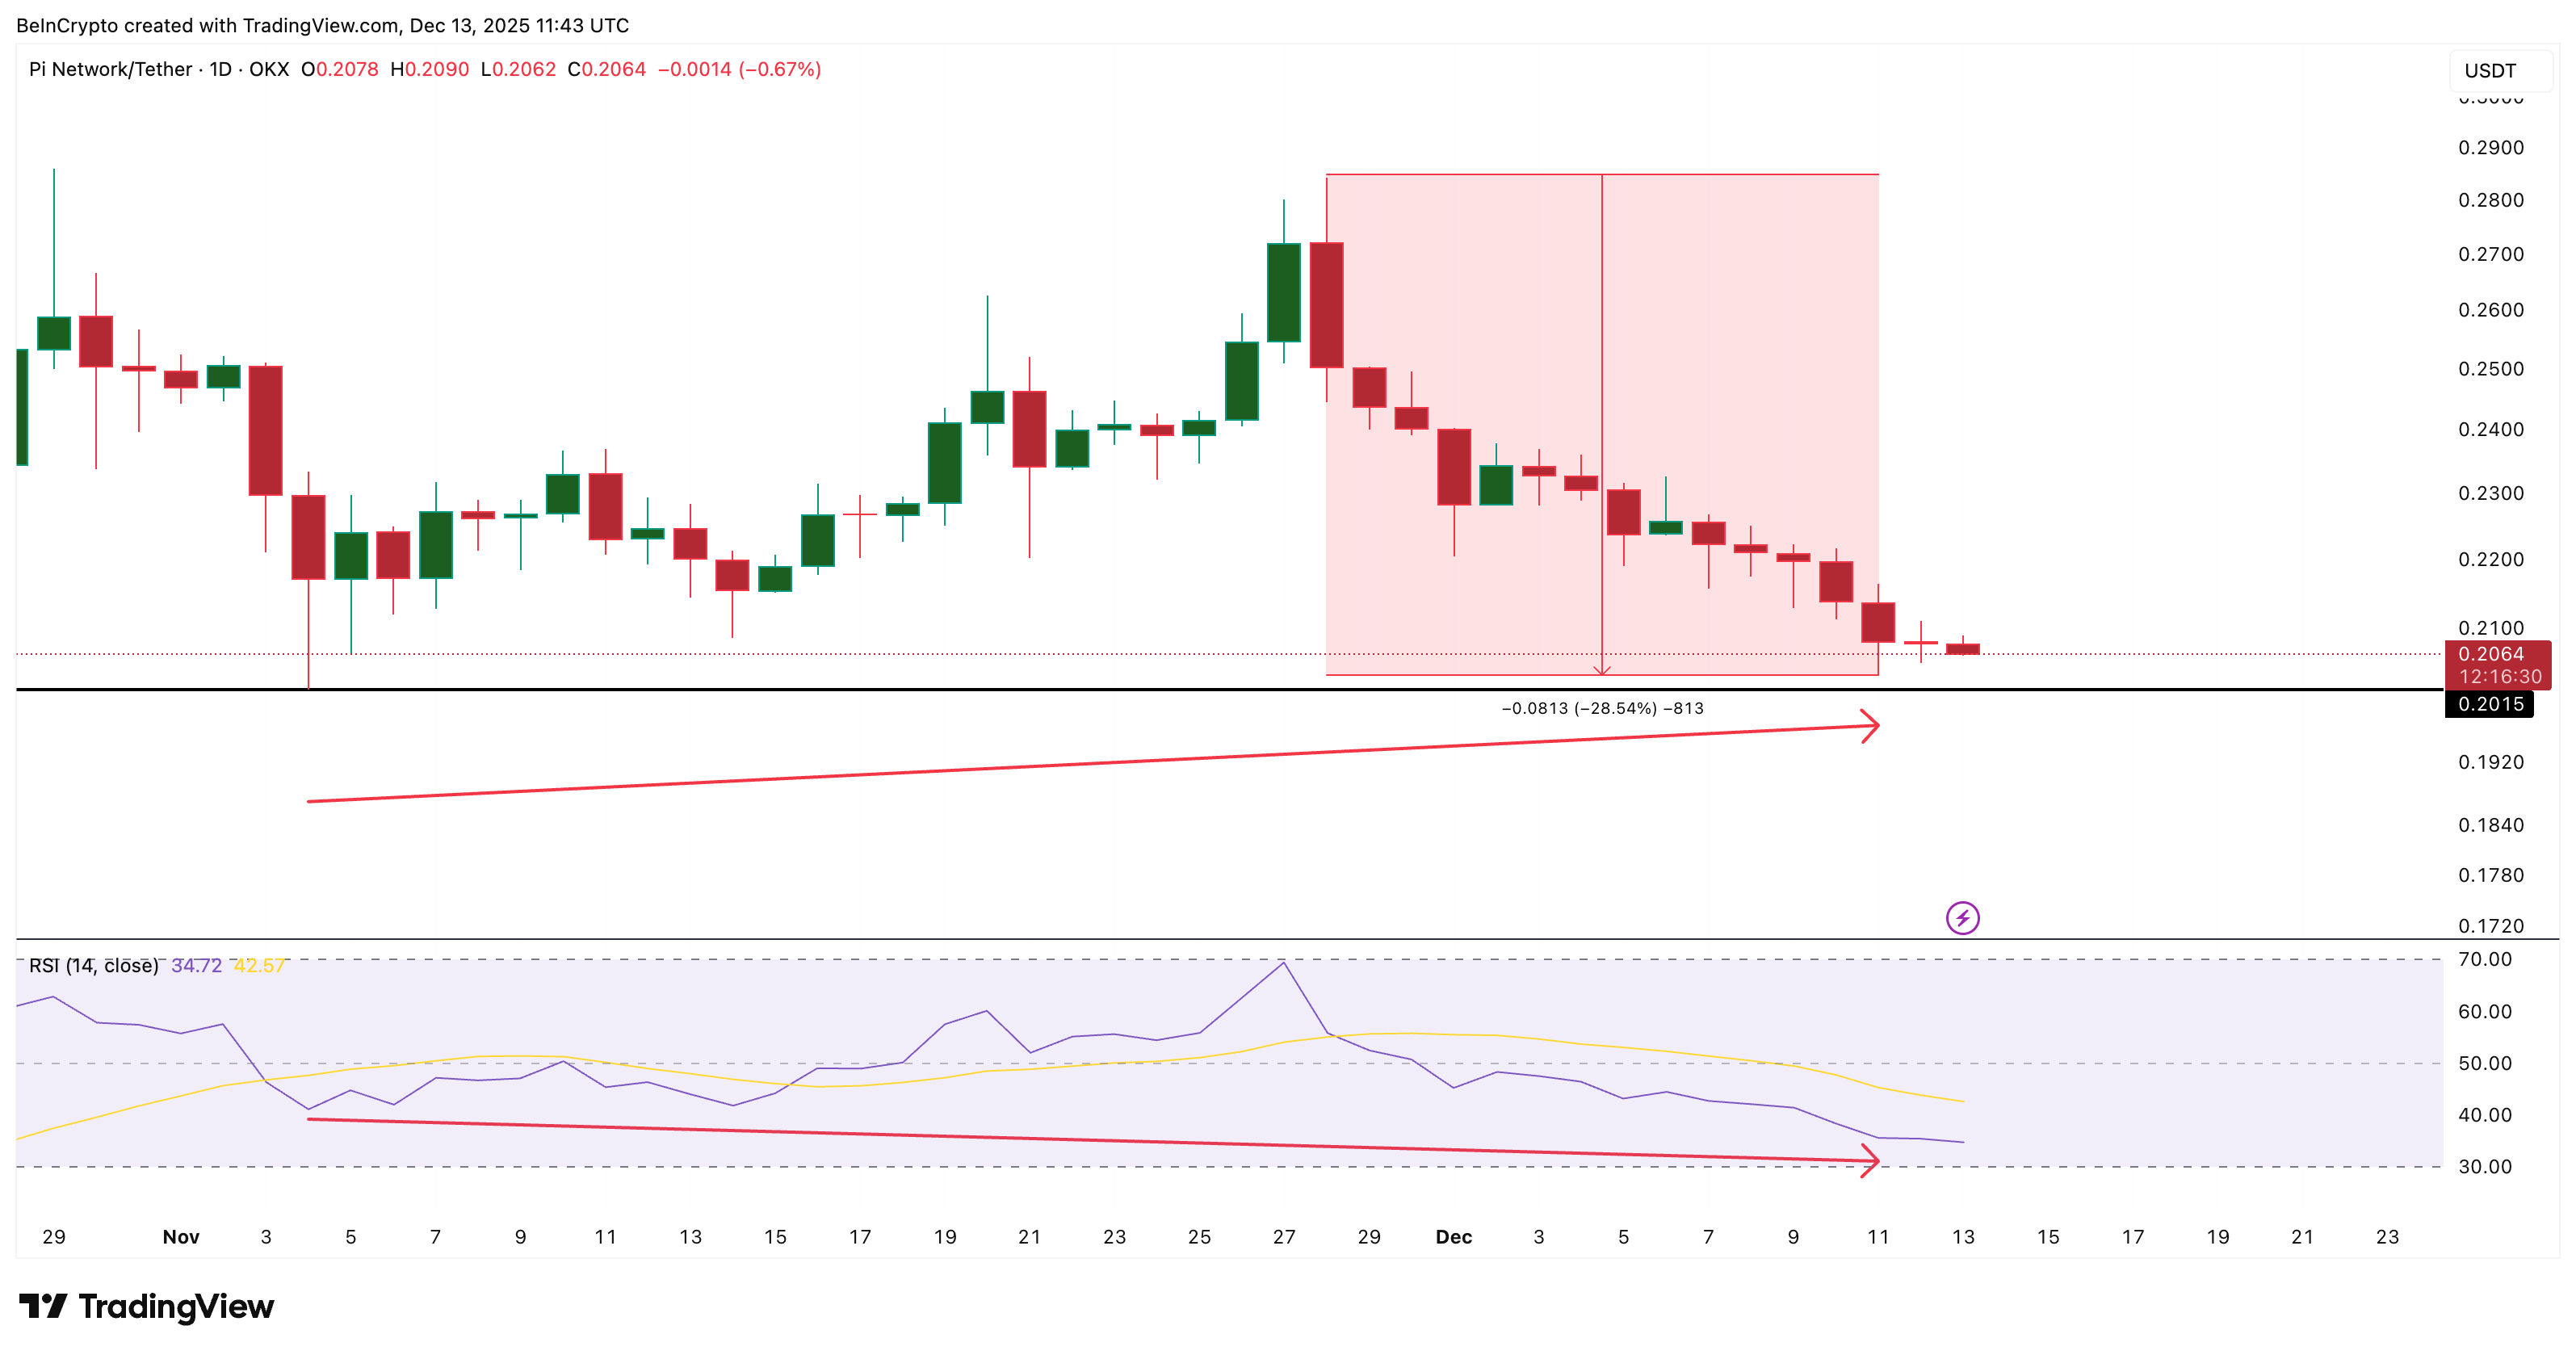
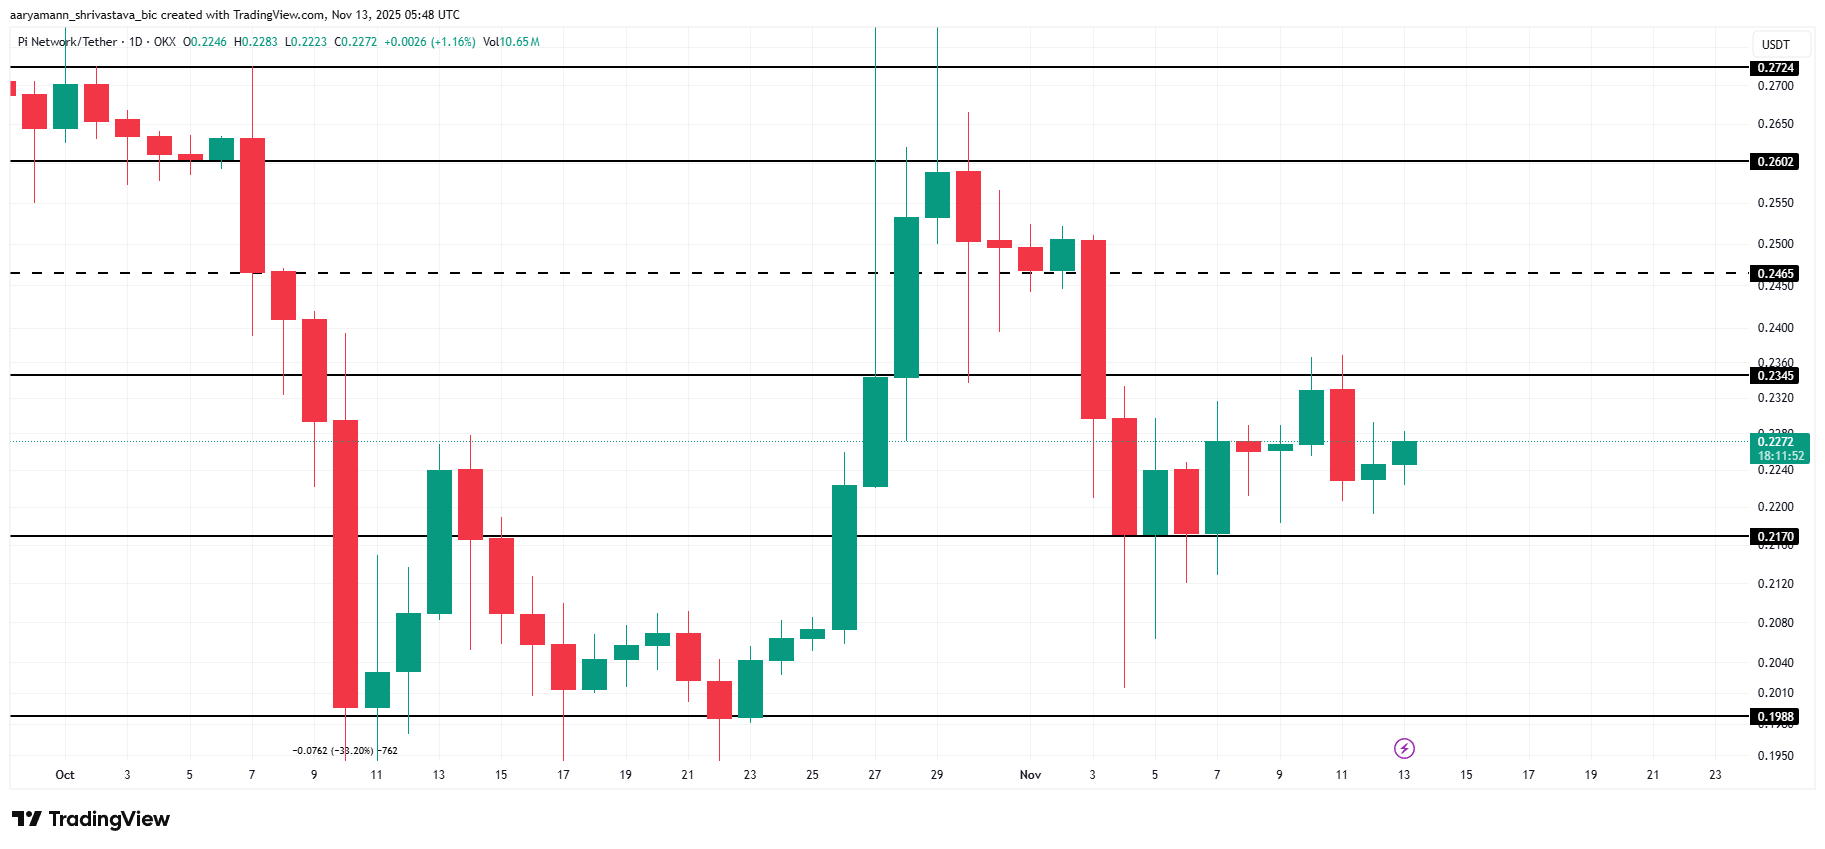
Pi Coin has extended its decline for a third straight week, falling sharply from its recent local top. The altcoin has struggled amid weak investor support and broader market hesitation.
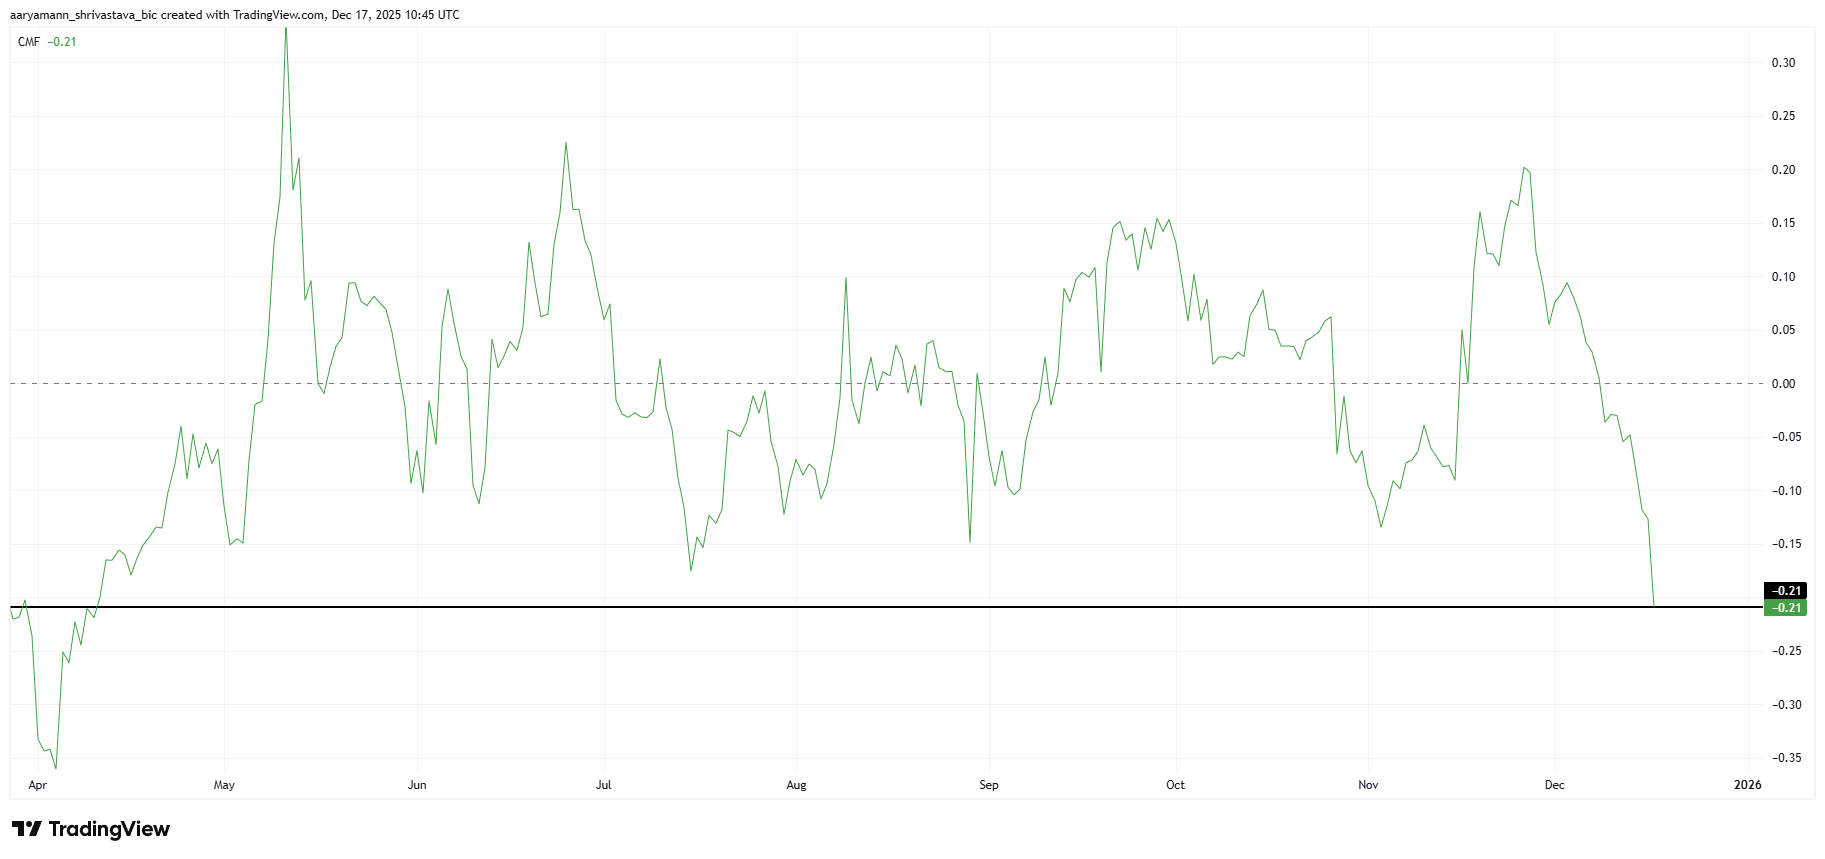
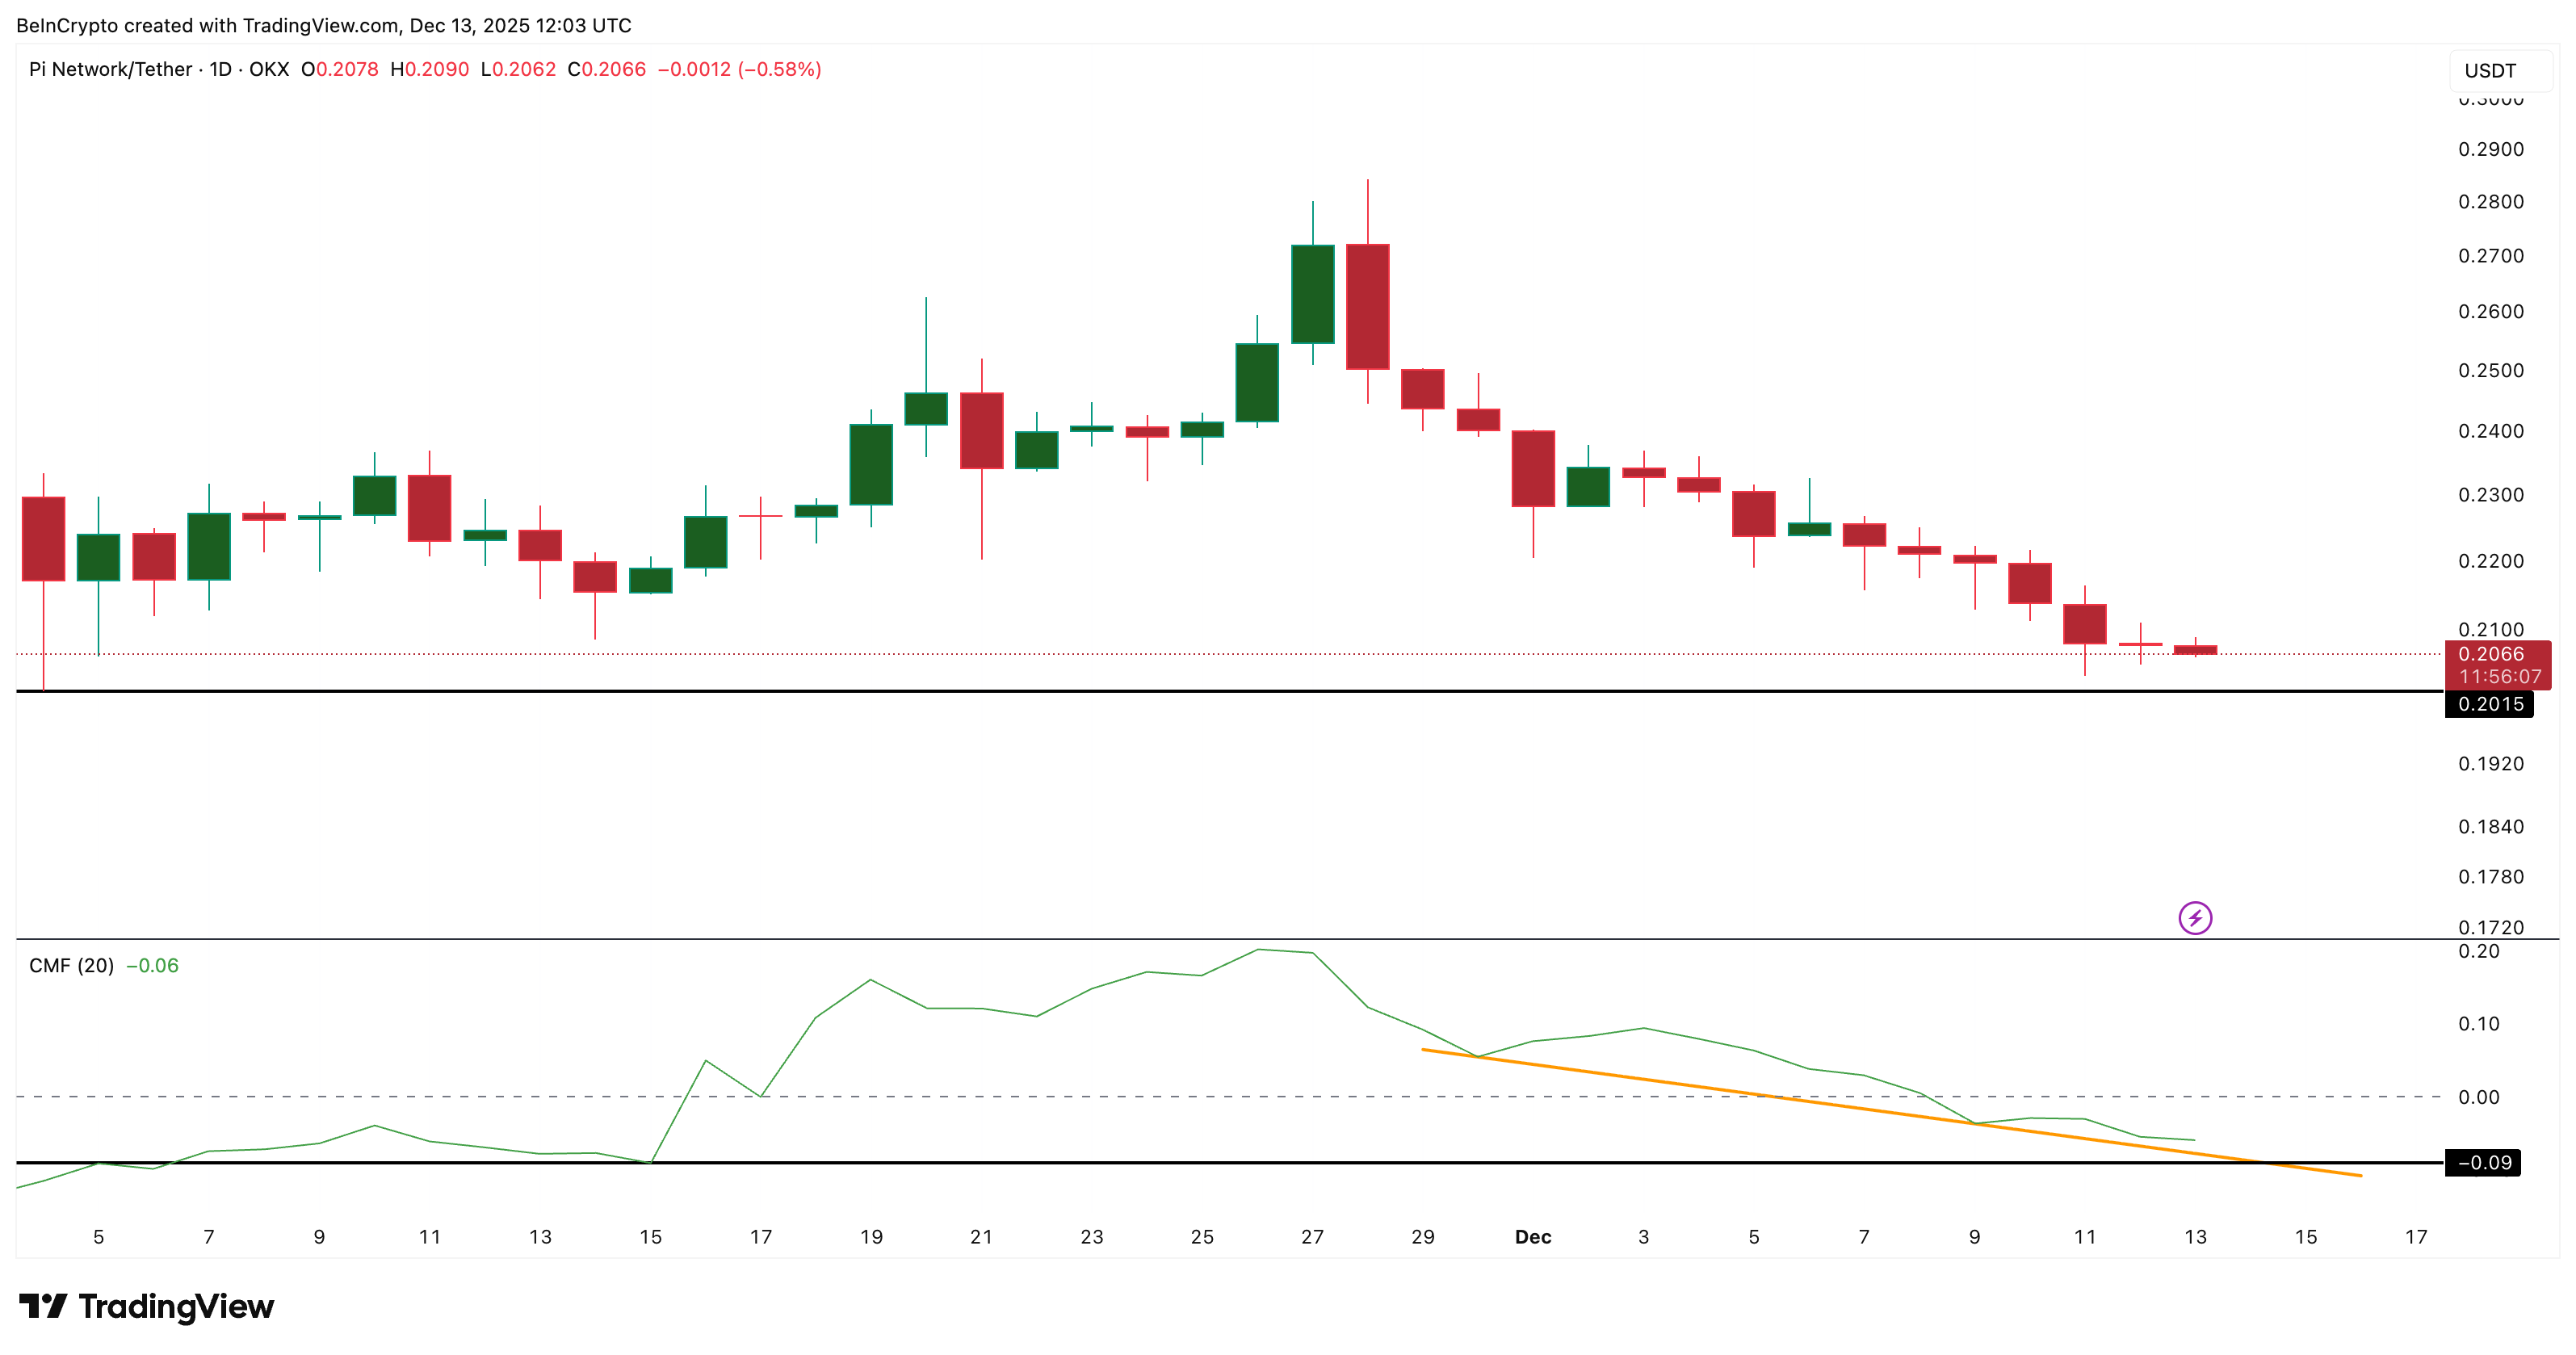
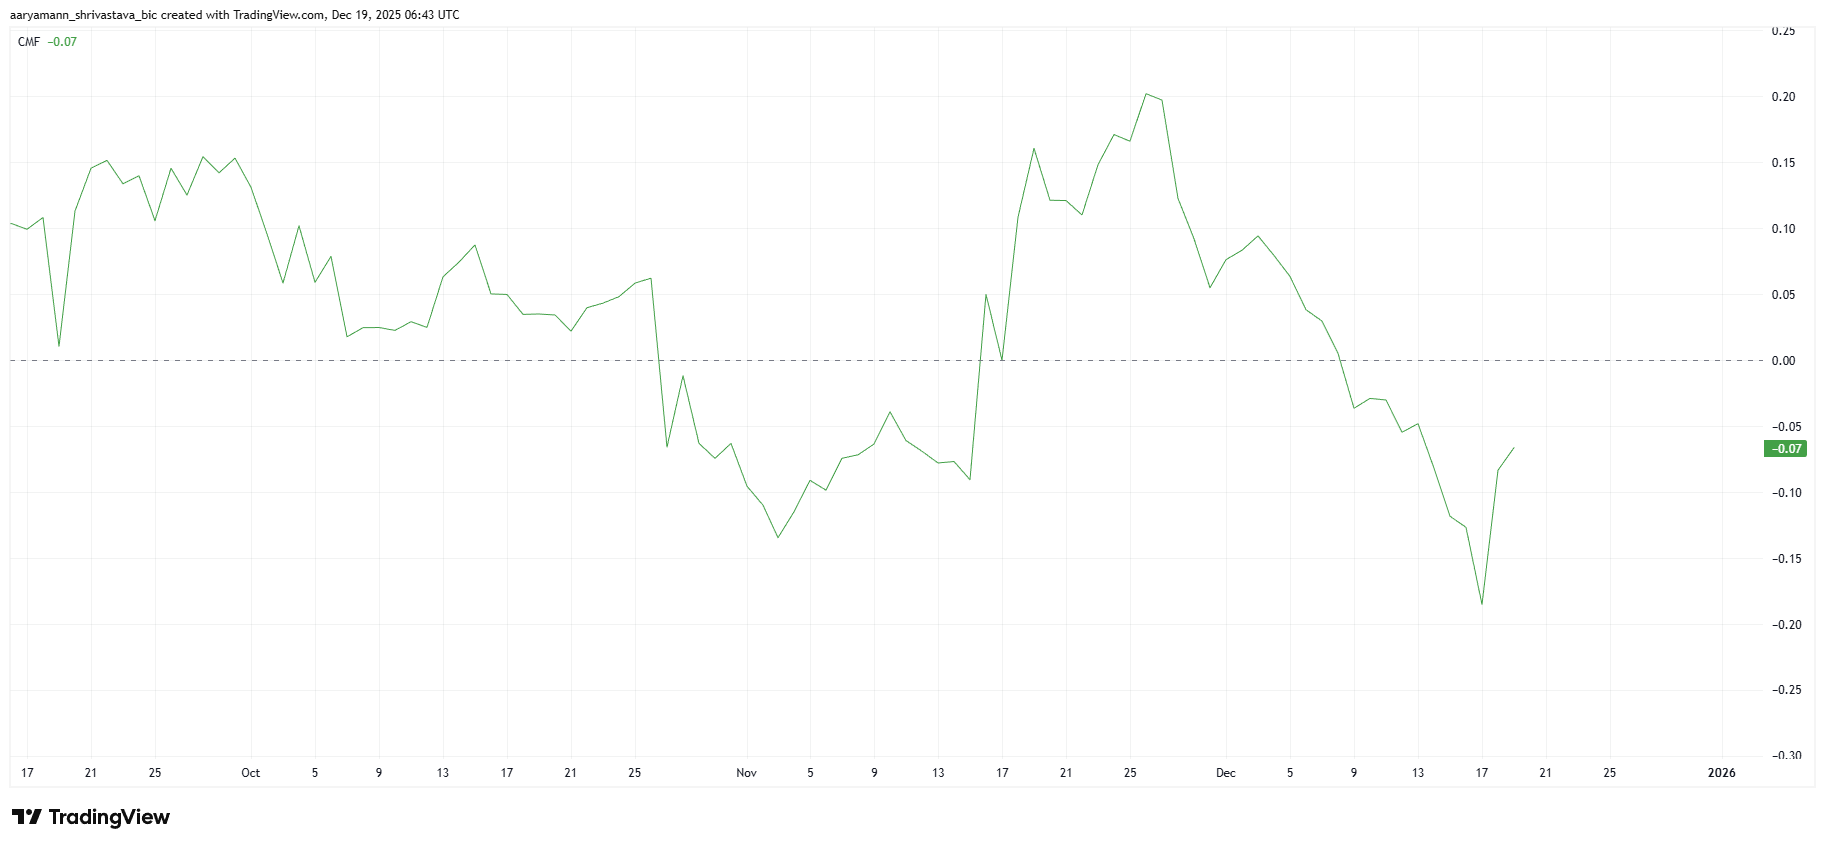
While selling pressure dominated earlier sessions, on-chain signals now suggest at least one key factor may be improving.
Pi Coin Holders Are Capitalizing
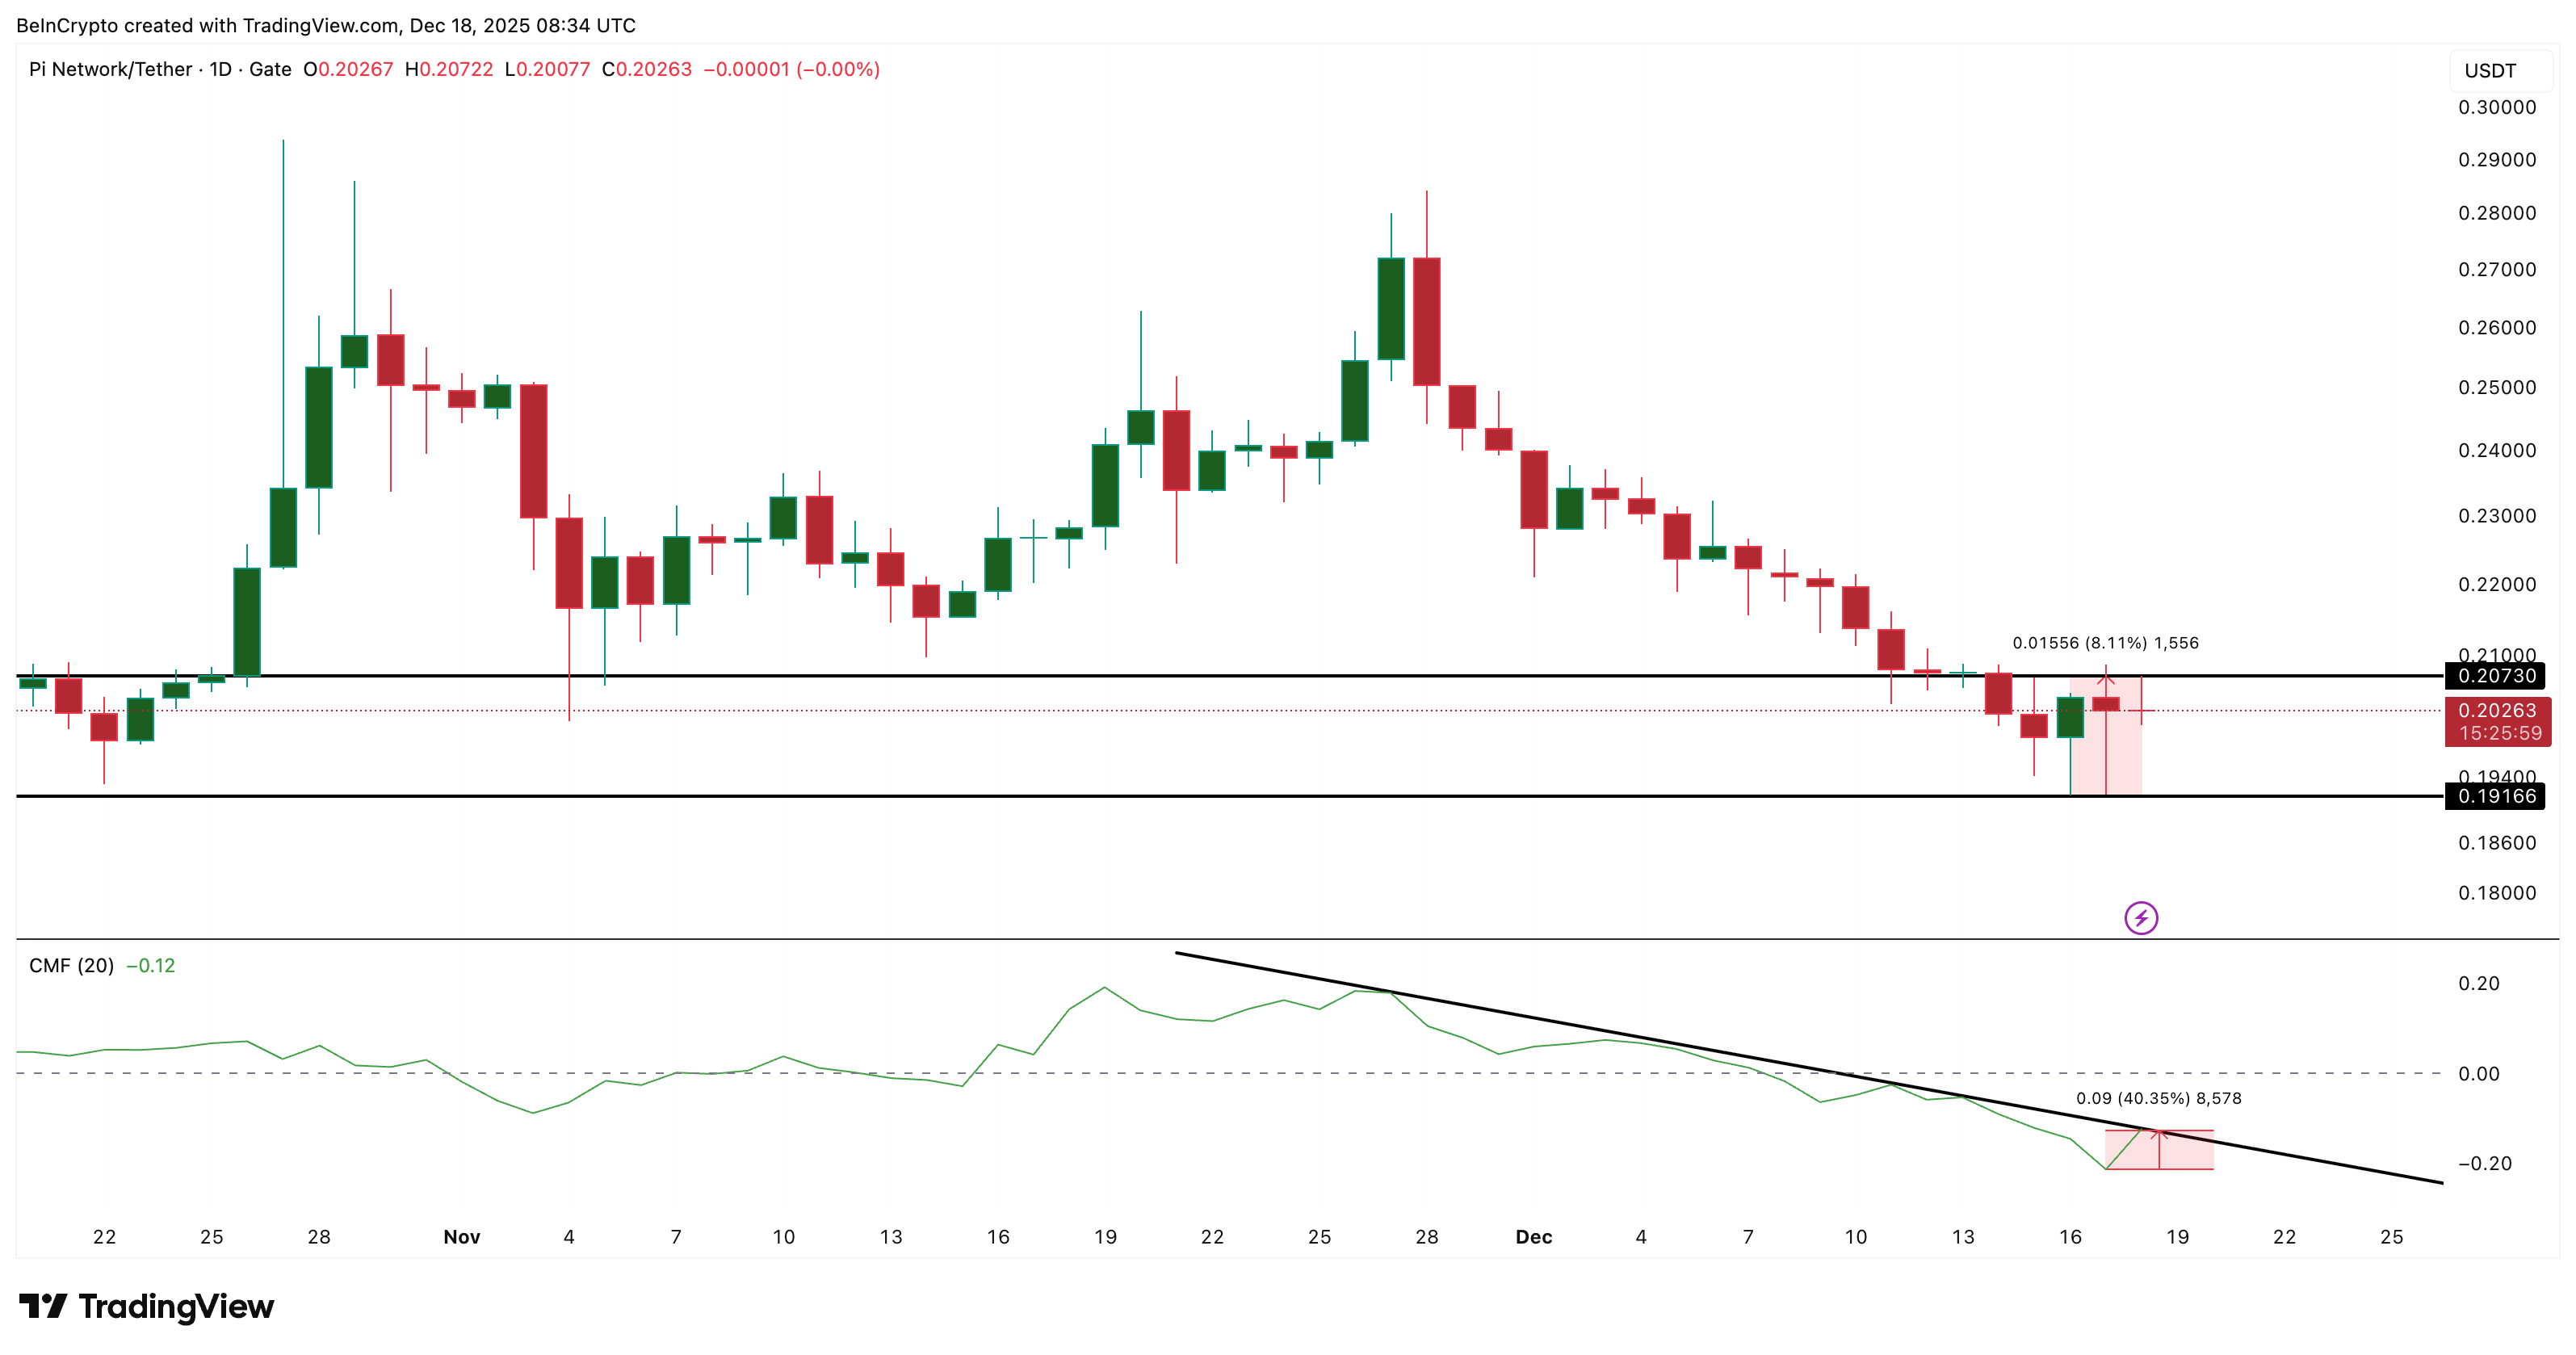
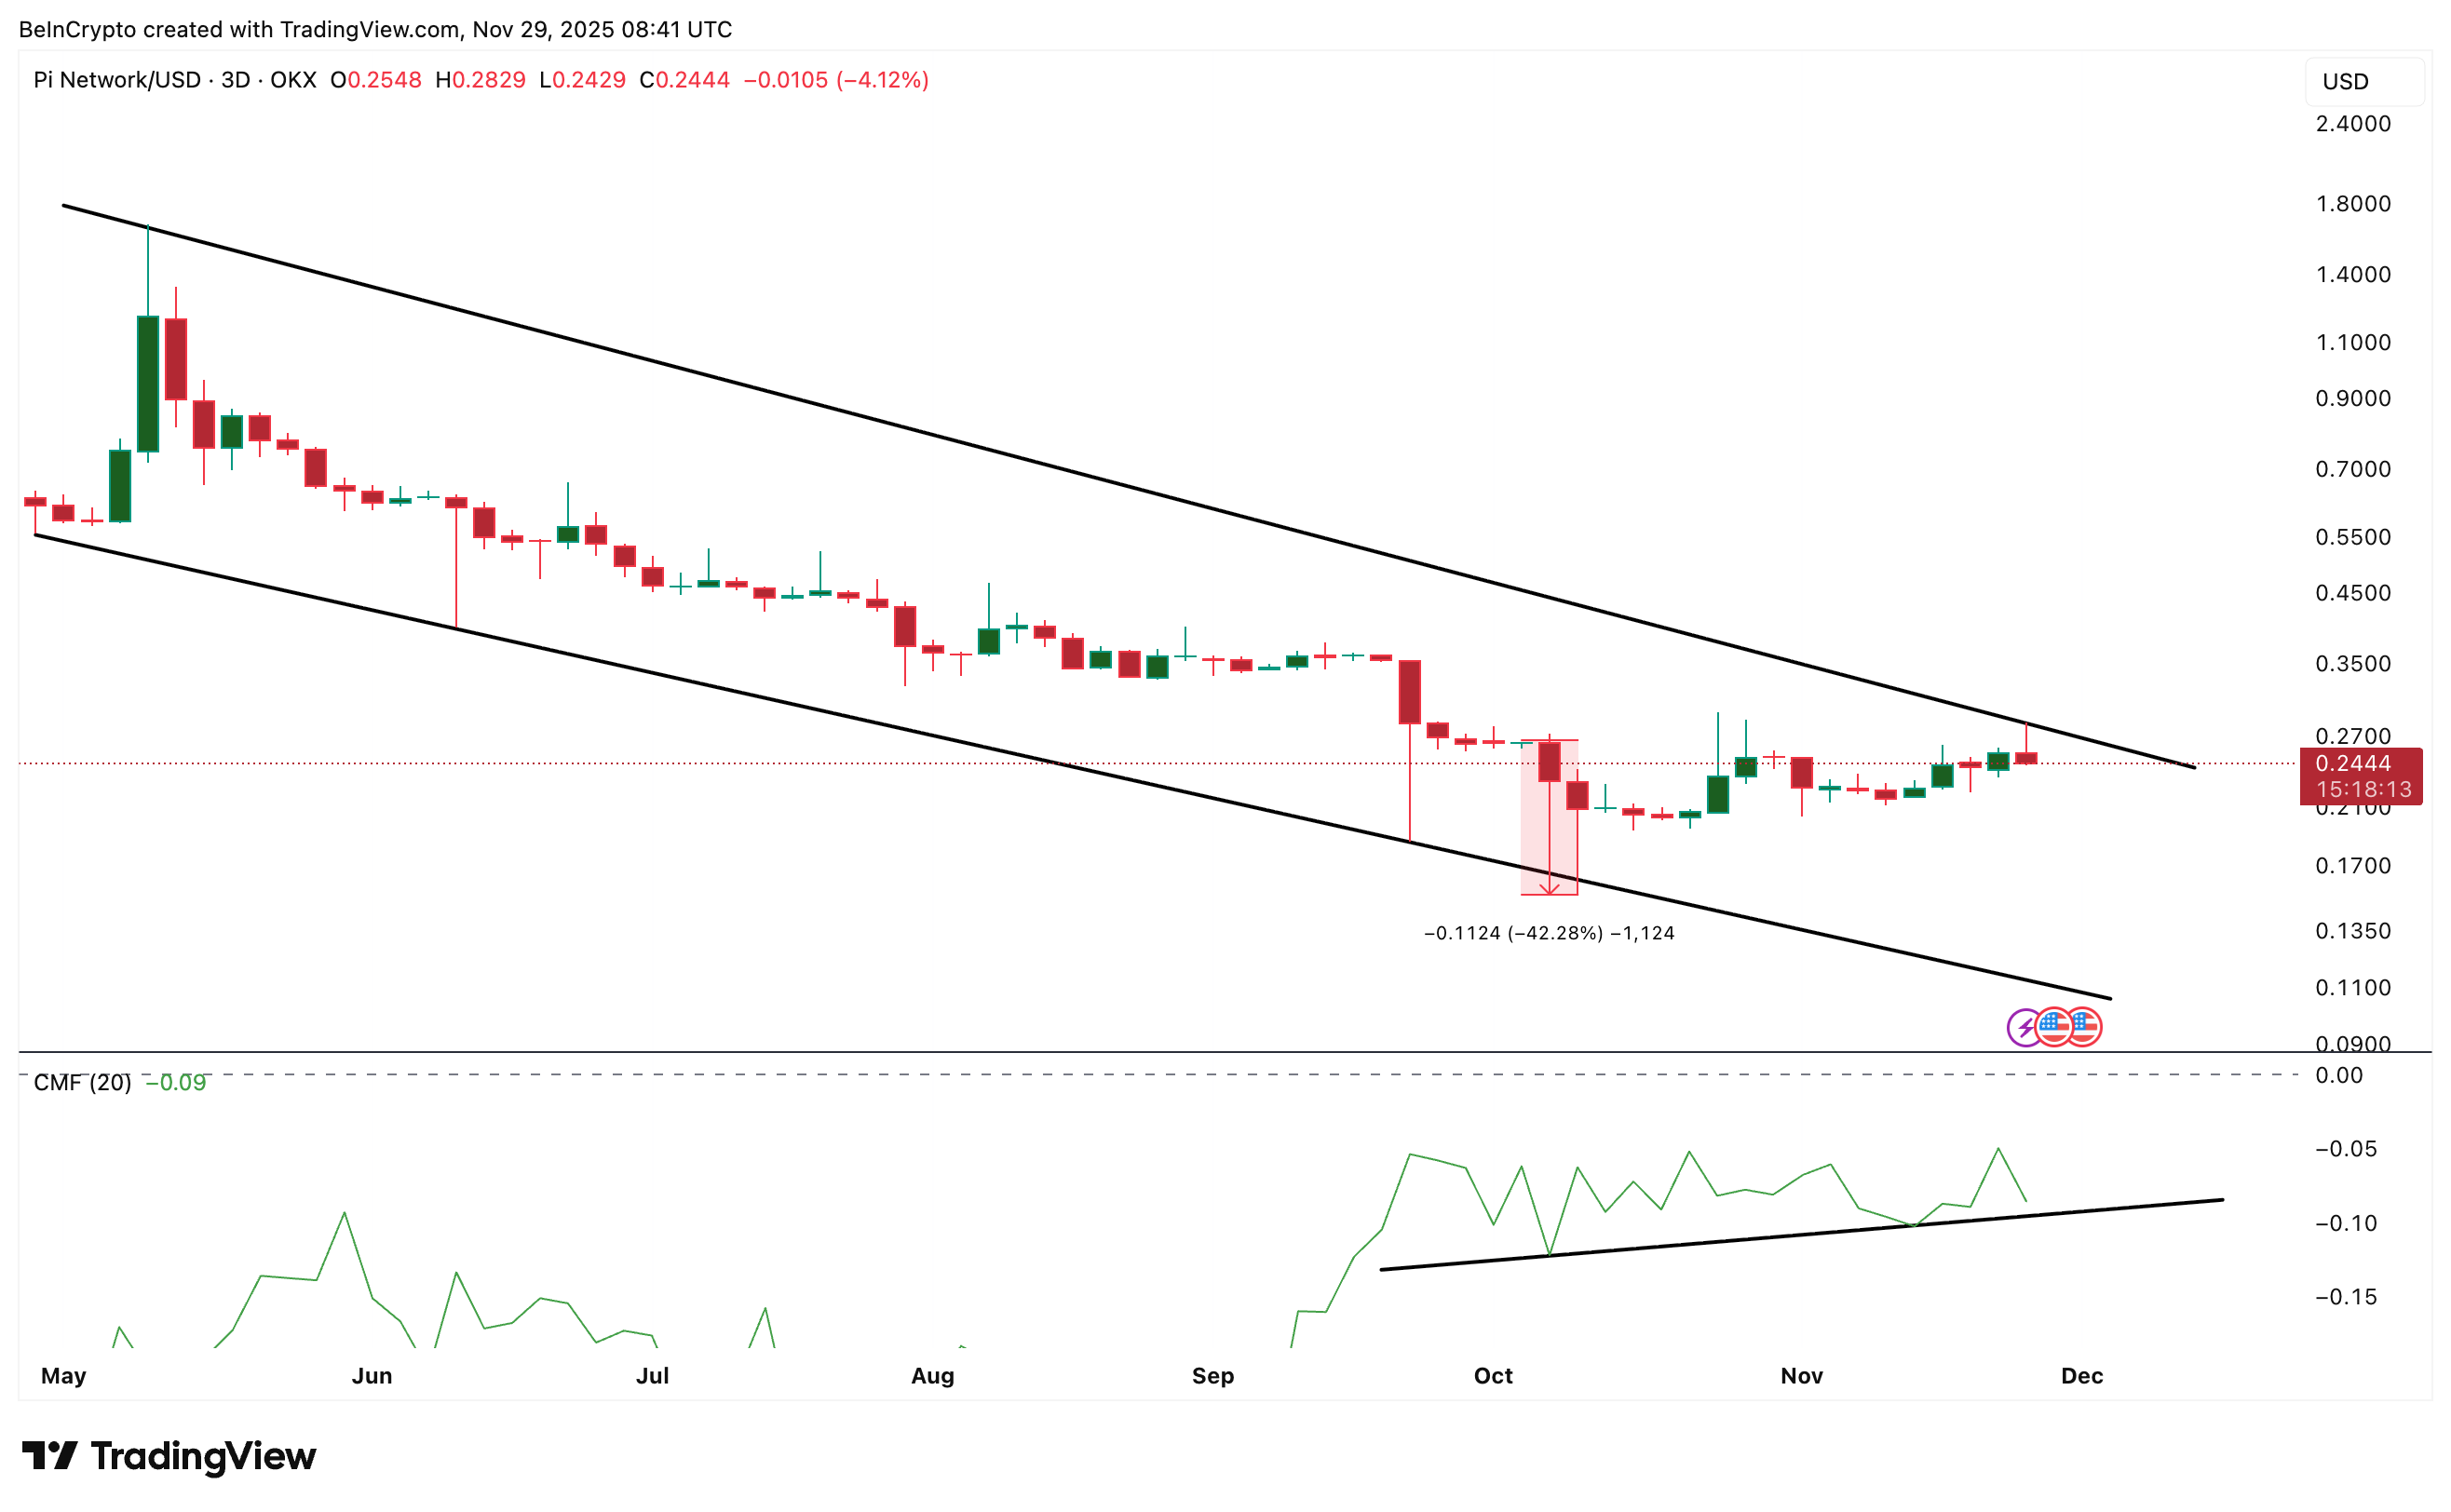
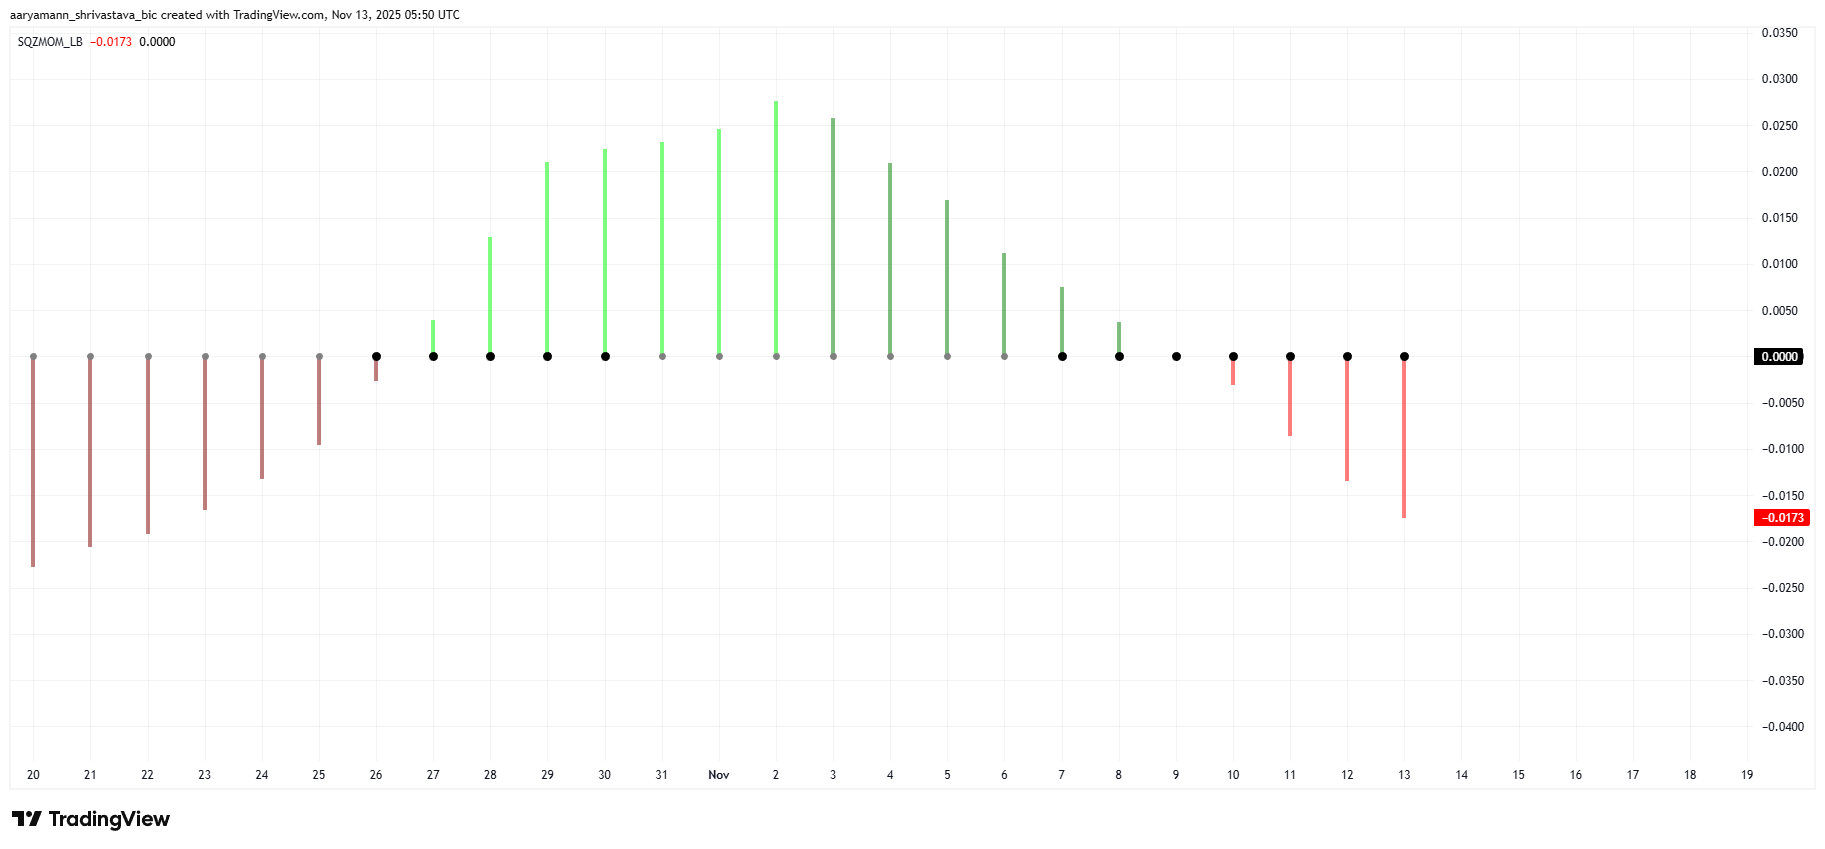
The Chaikin Money Flow has shown a gradual uptick over the past few days. This shift indicates capital is slowly returning to Pi Coin. Investors appear to be adjusting their stance, likely viewing current prices as attractive accumulation zones.
Rising CMF readings often reflect improving conviction. Fresh inflows are critical for any recovery attempt, as sustained buying helps absorb sell pressure. If this trend continues, Pi Coin could gain the momentum needed to stabilize and attempt a short-term rebound.
Want more token insights like this? Sign up for Editor Harsh Notariya’s Daily Crypto Newsletter here.
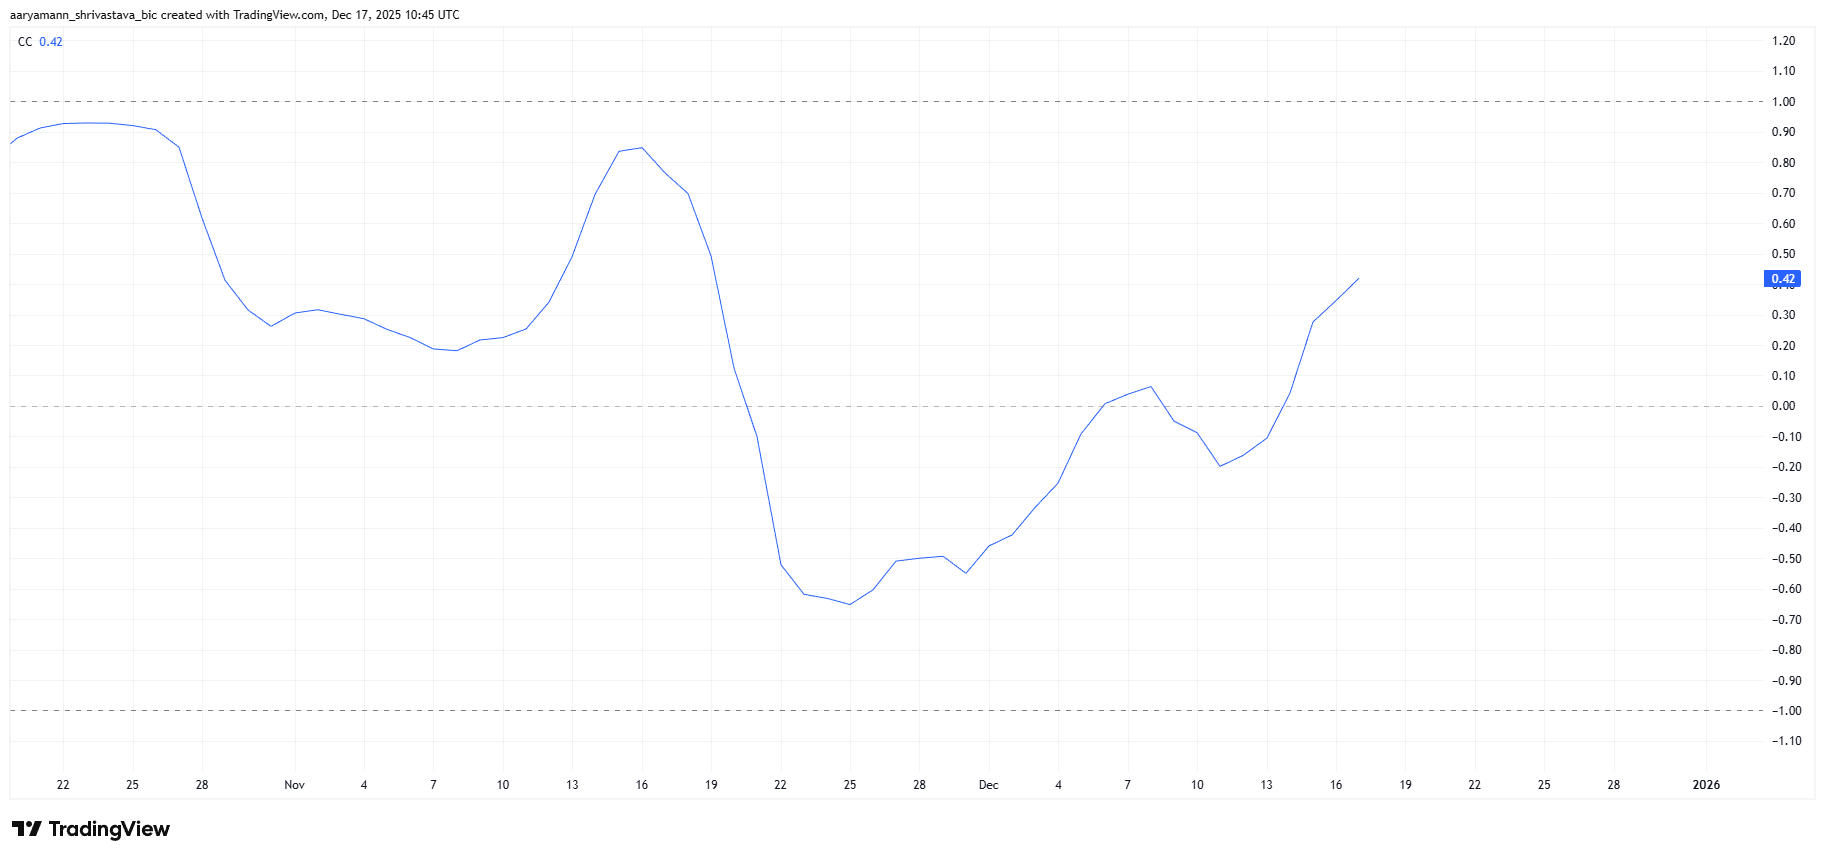
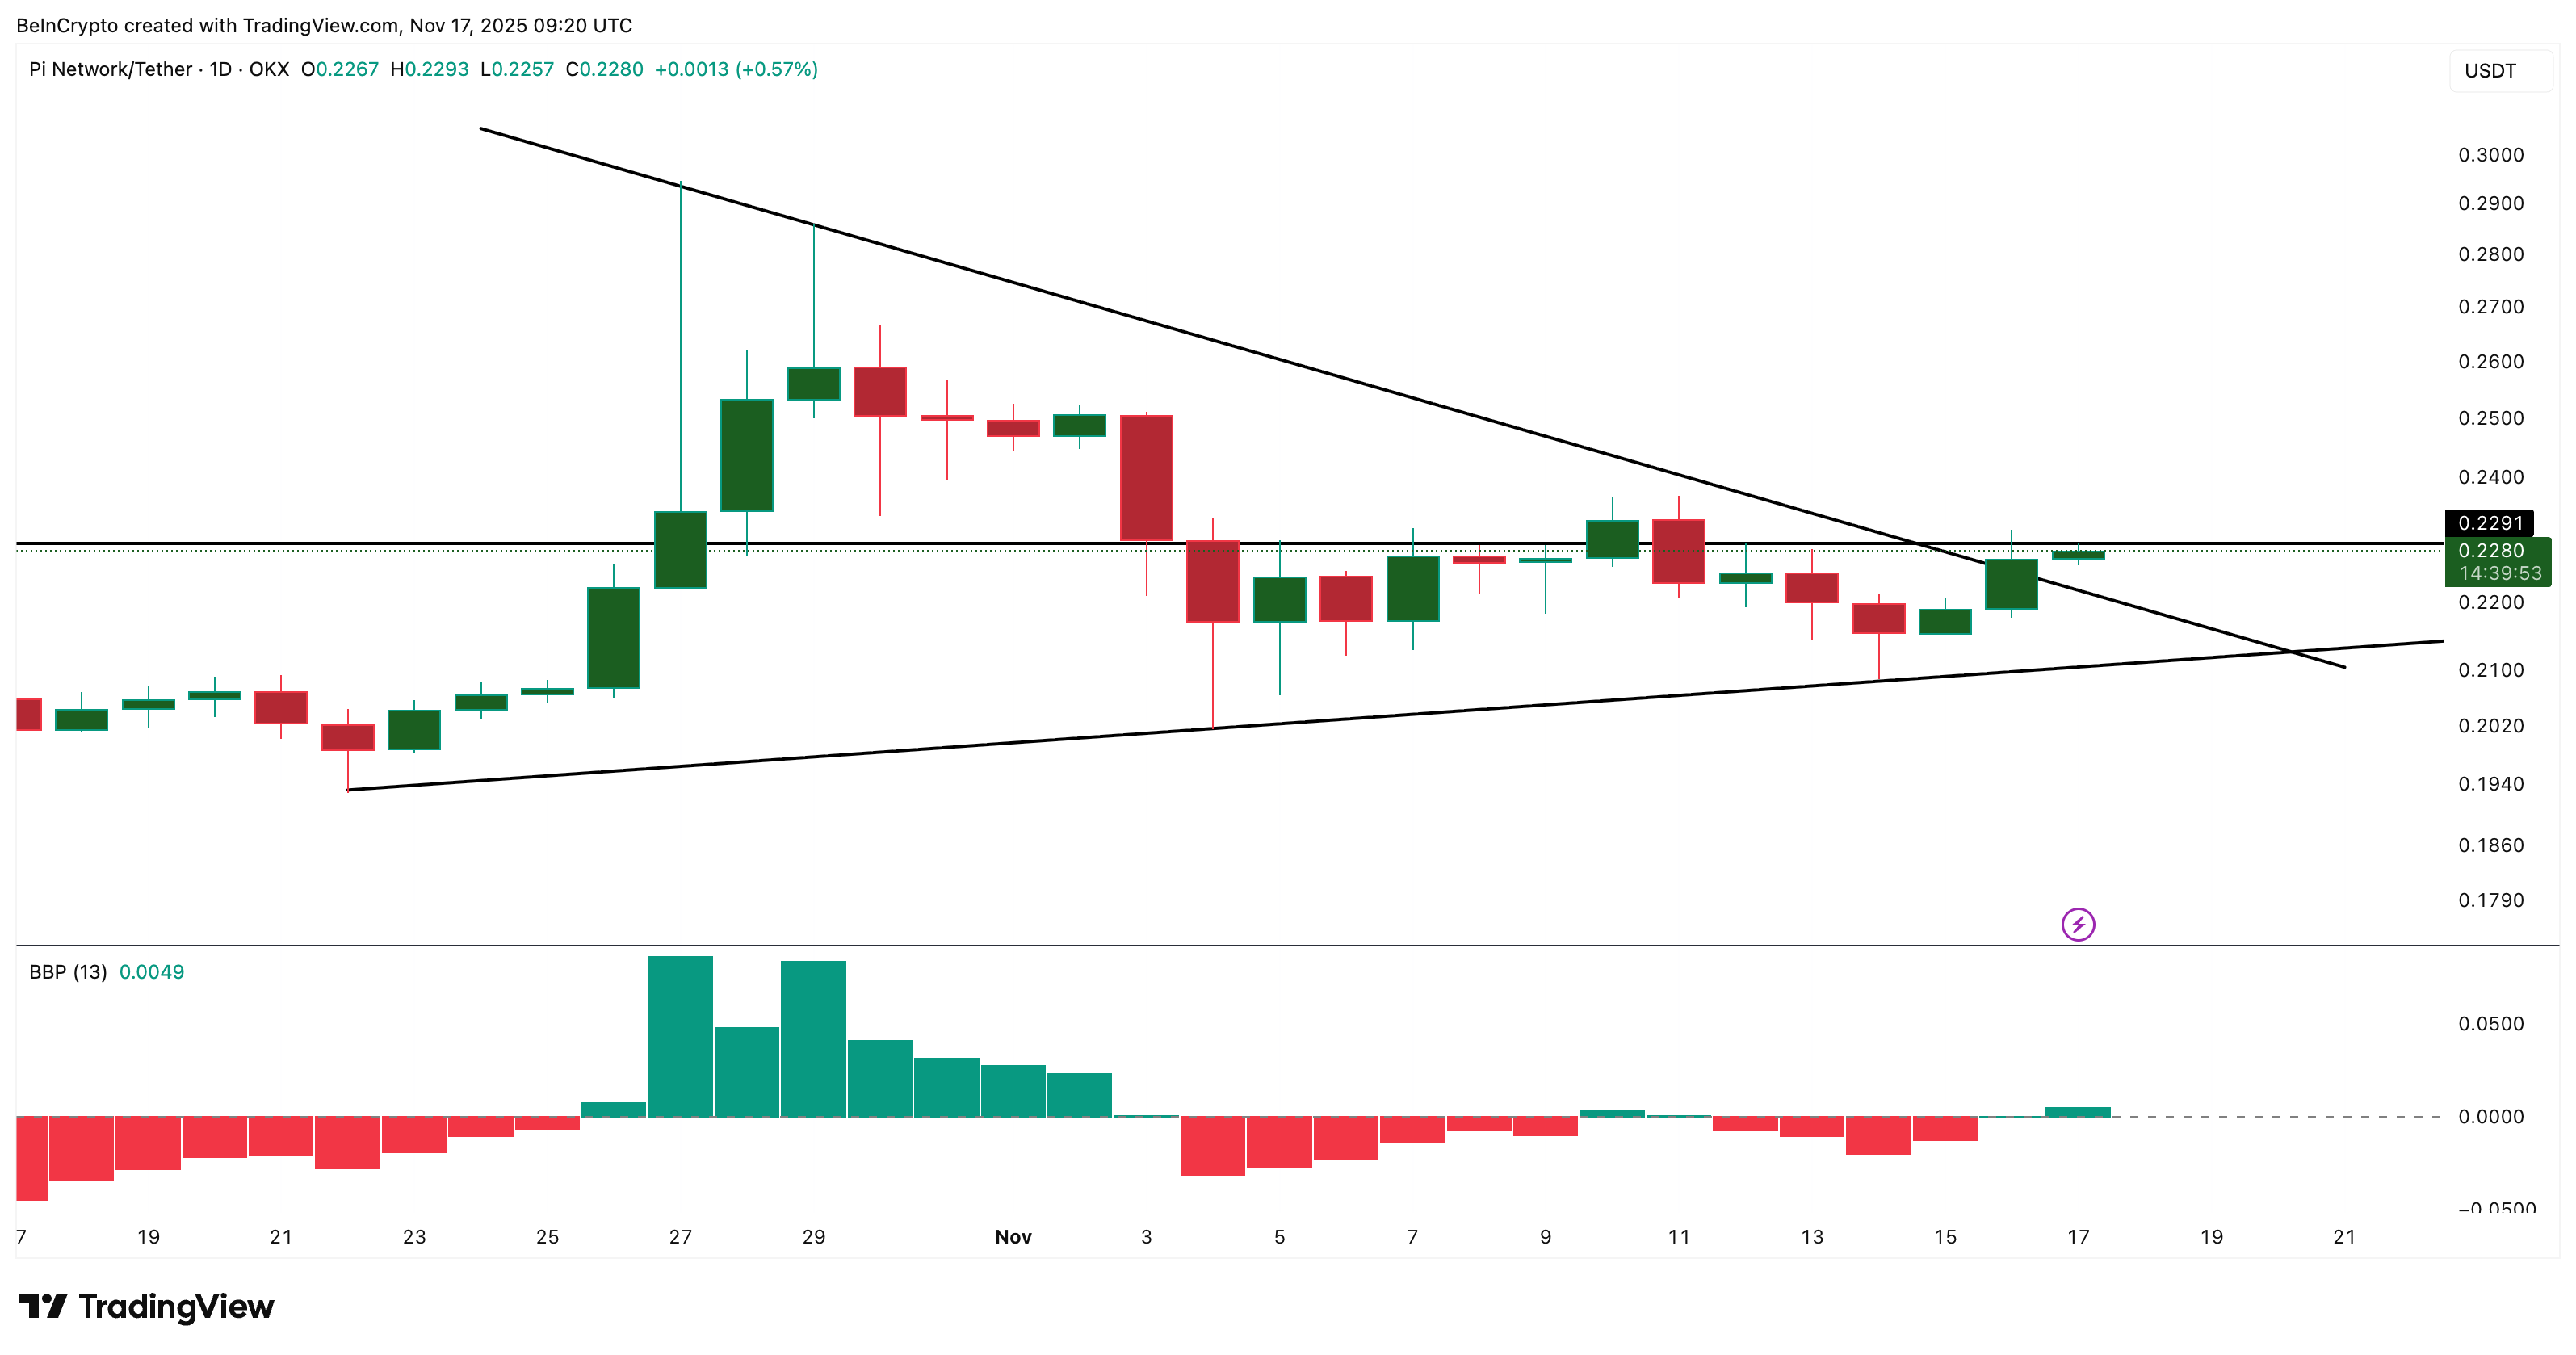
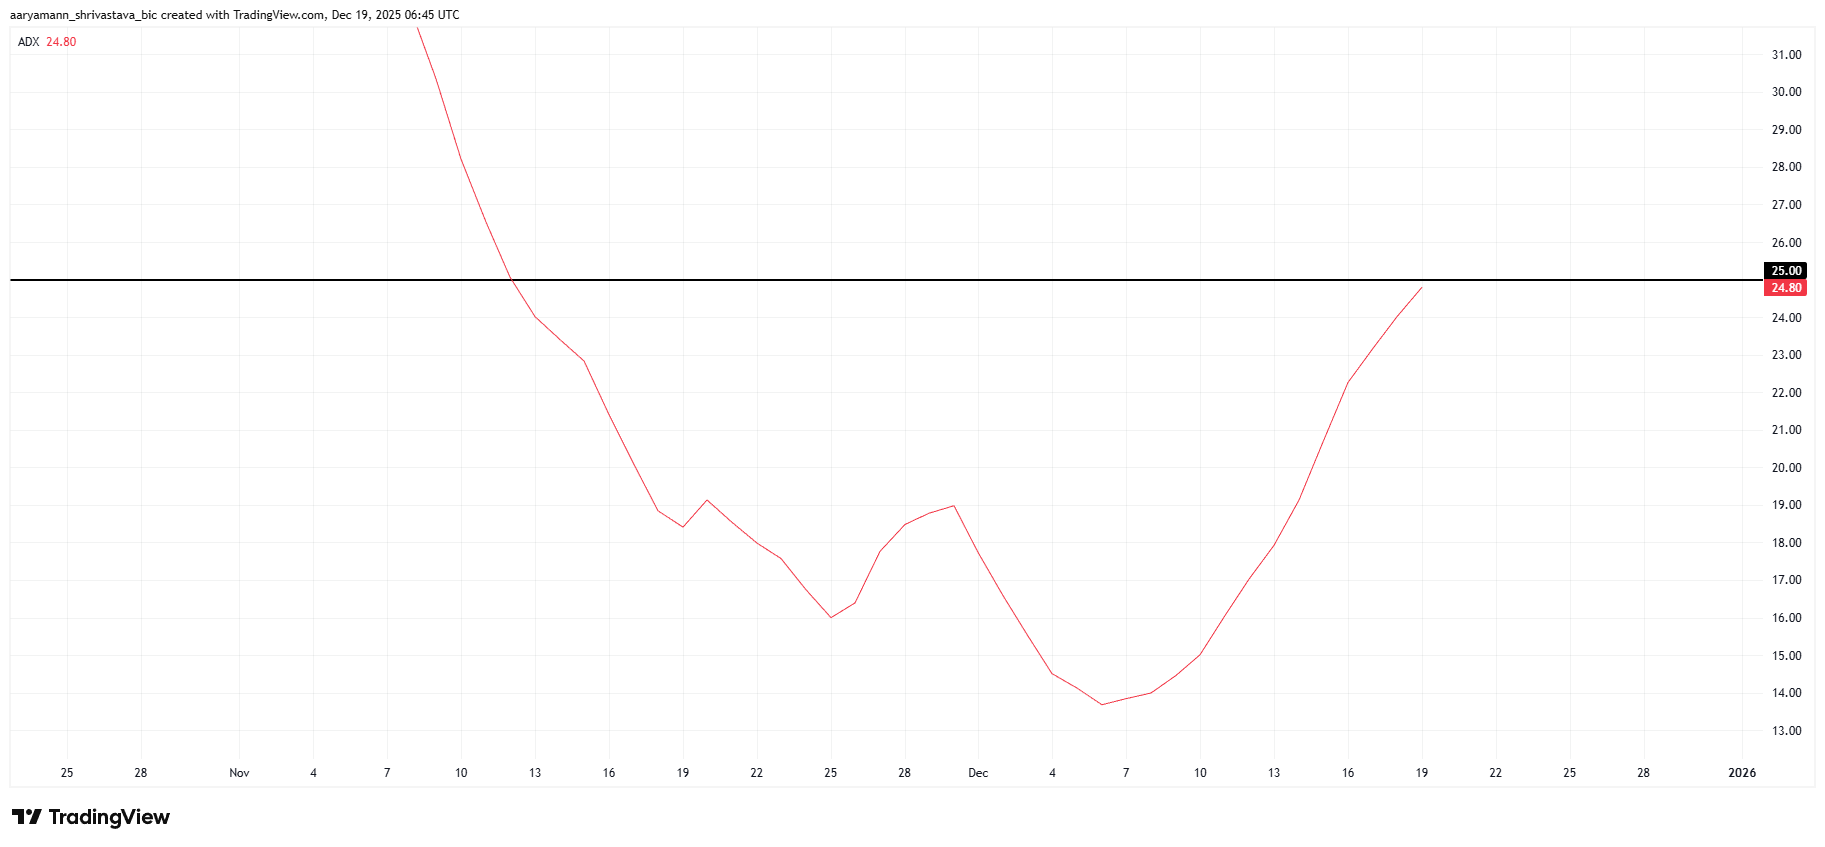
Despite improving inflows, macro indicators remain mixed. The average directional index shows the recent downtrend is close to strengthening. A move above the 25.0 threshold would confirm dominant bearish momentum, reinforcing control by sellers.
However, failure to cross this level would signal weakening trend strength. In such a scenario, selling pressure could fade. This would give Pi Coin room to recover, especially if buying interest continues to increase alongside supportive market conditions.
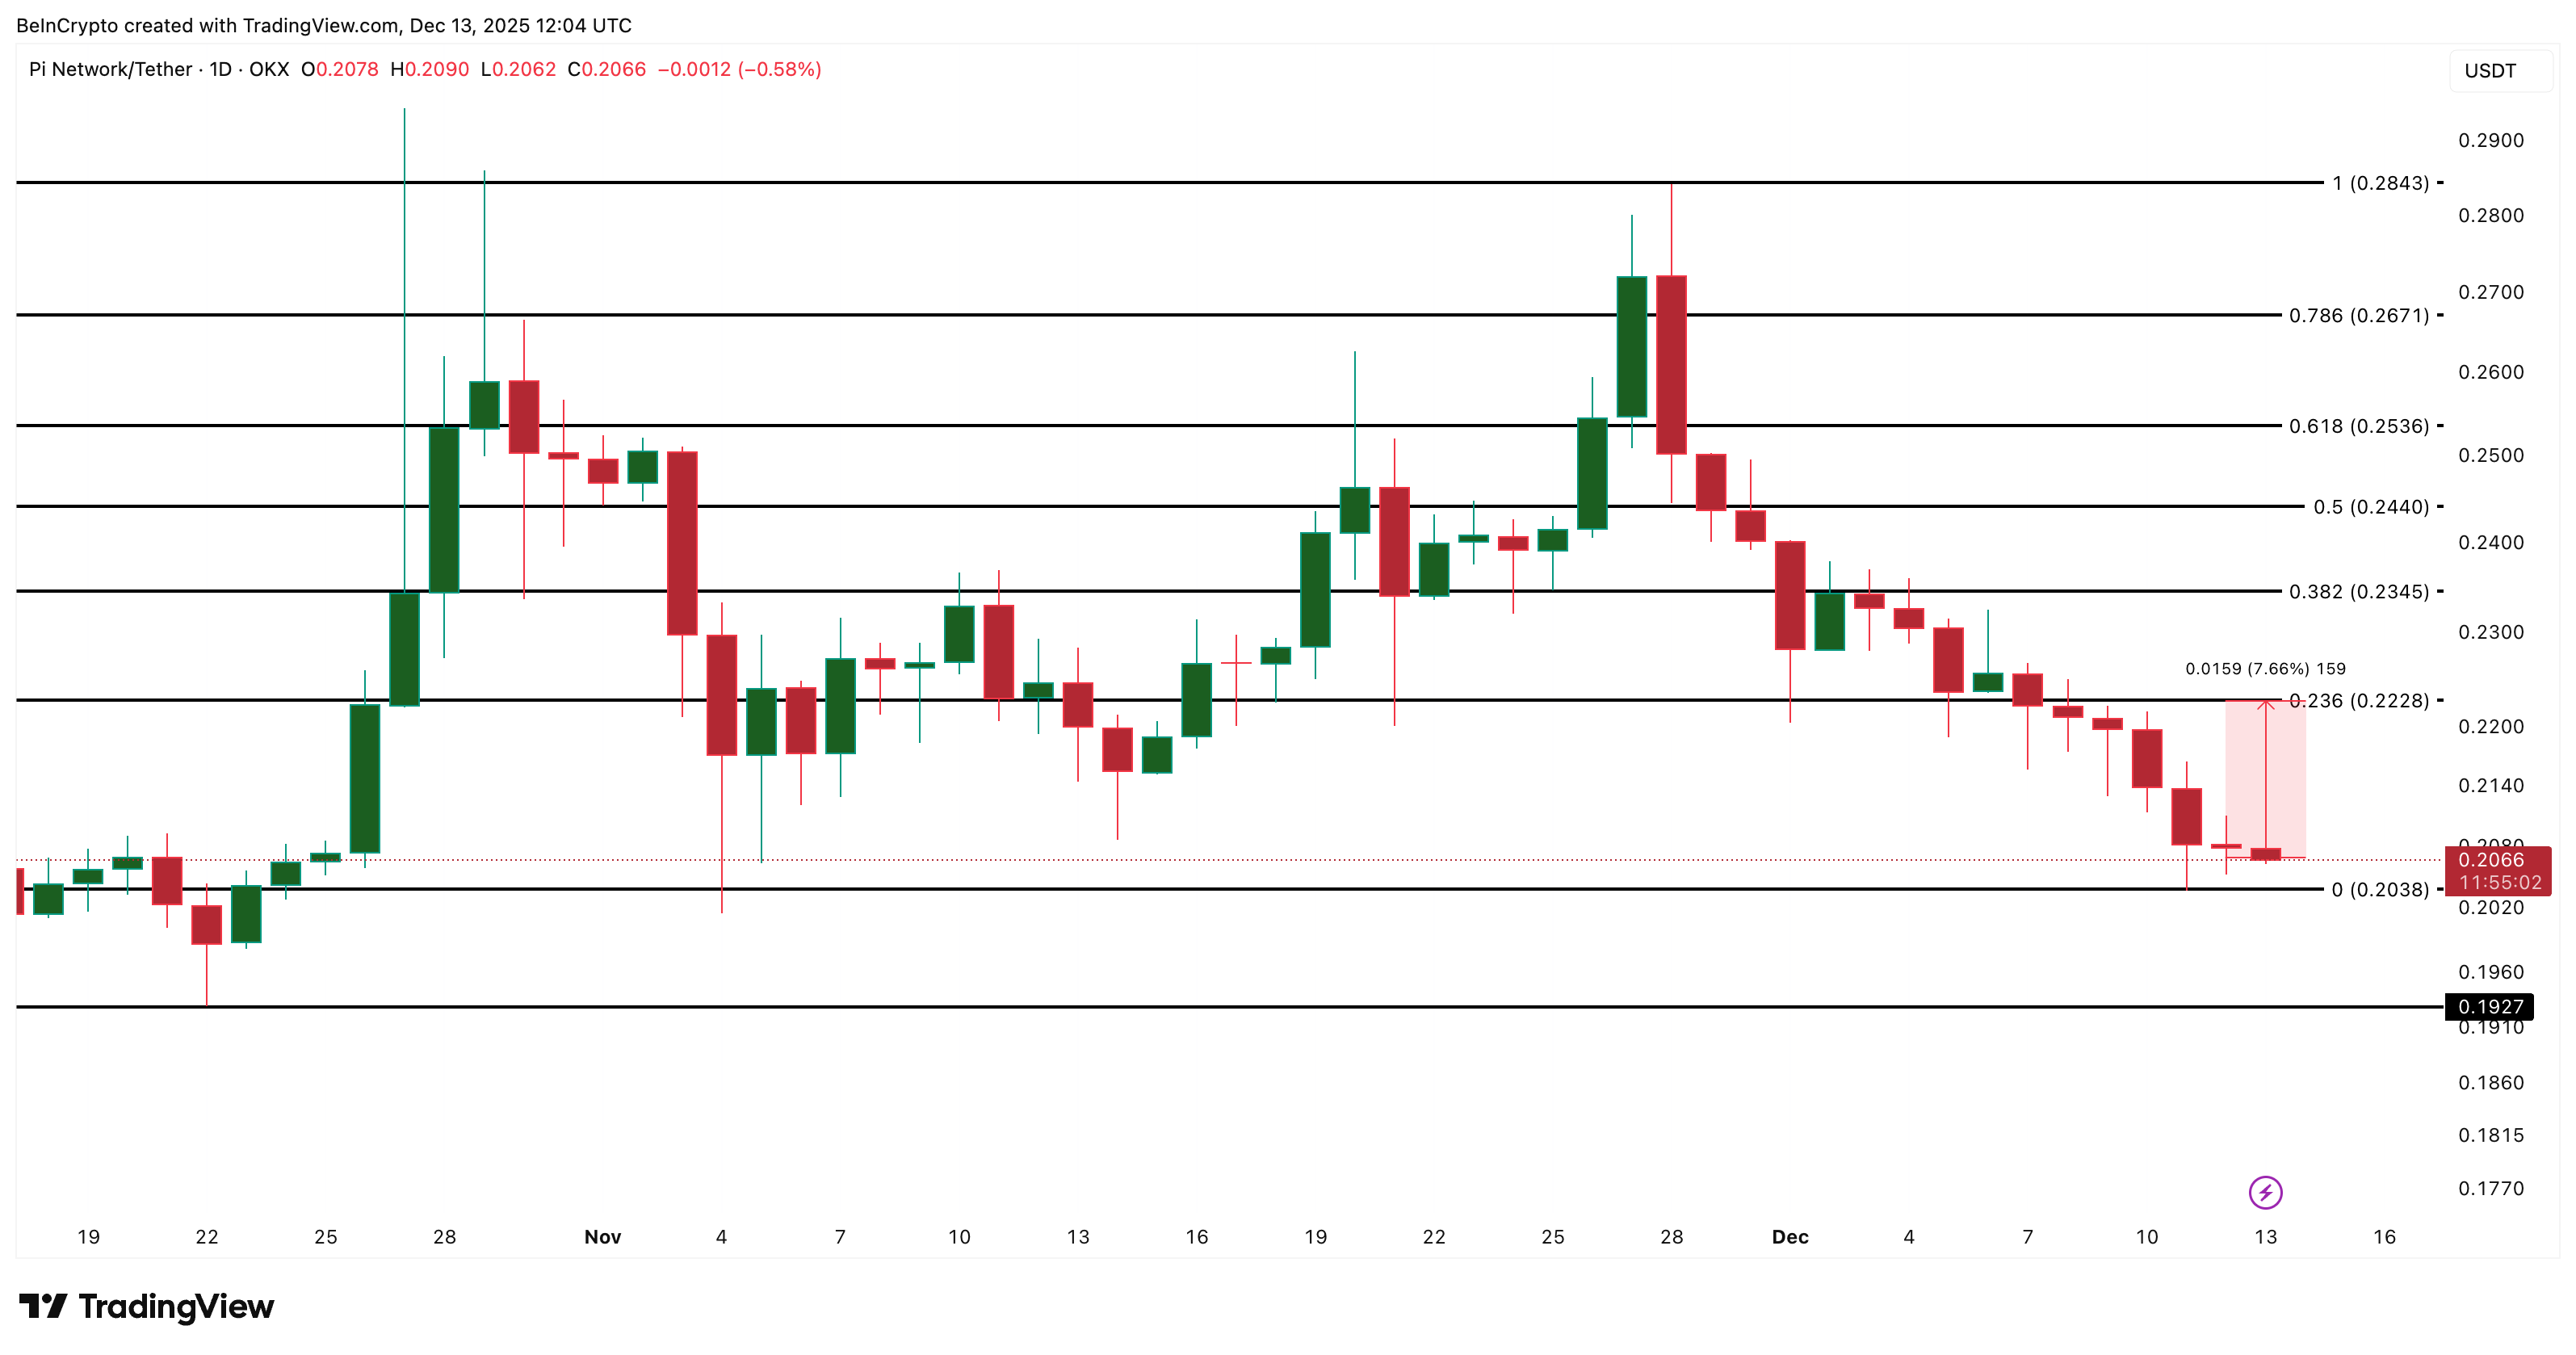
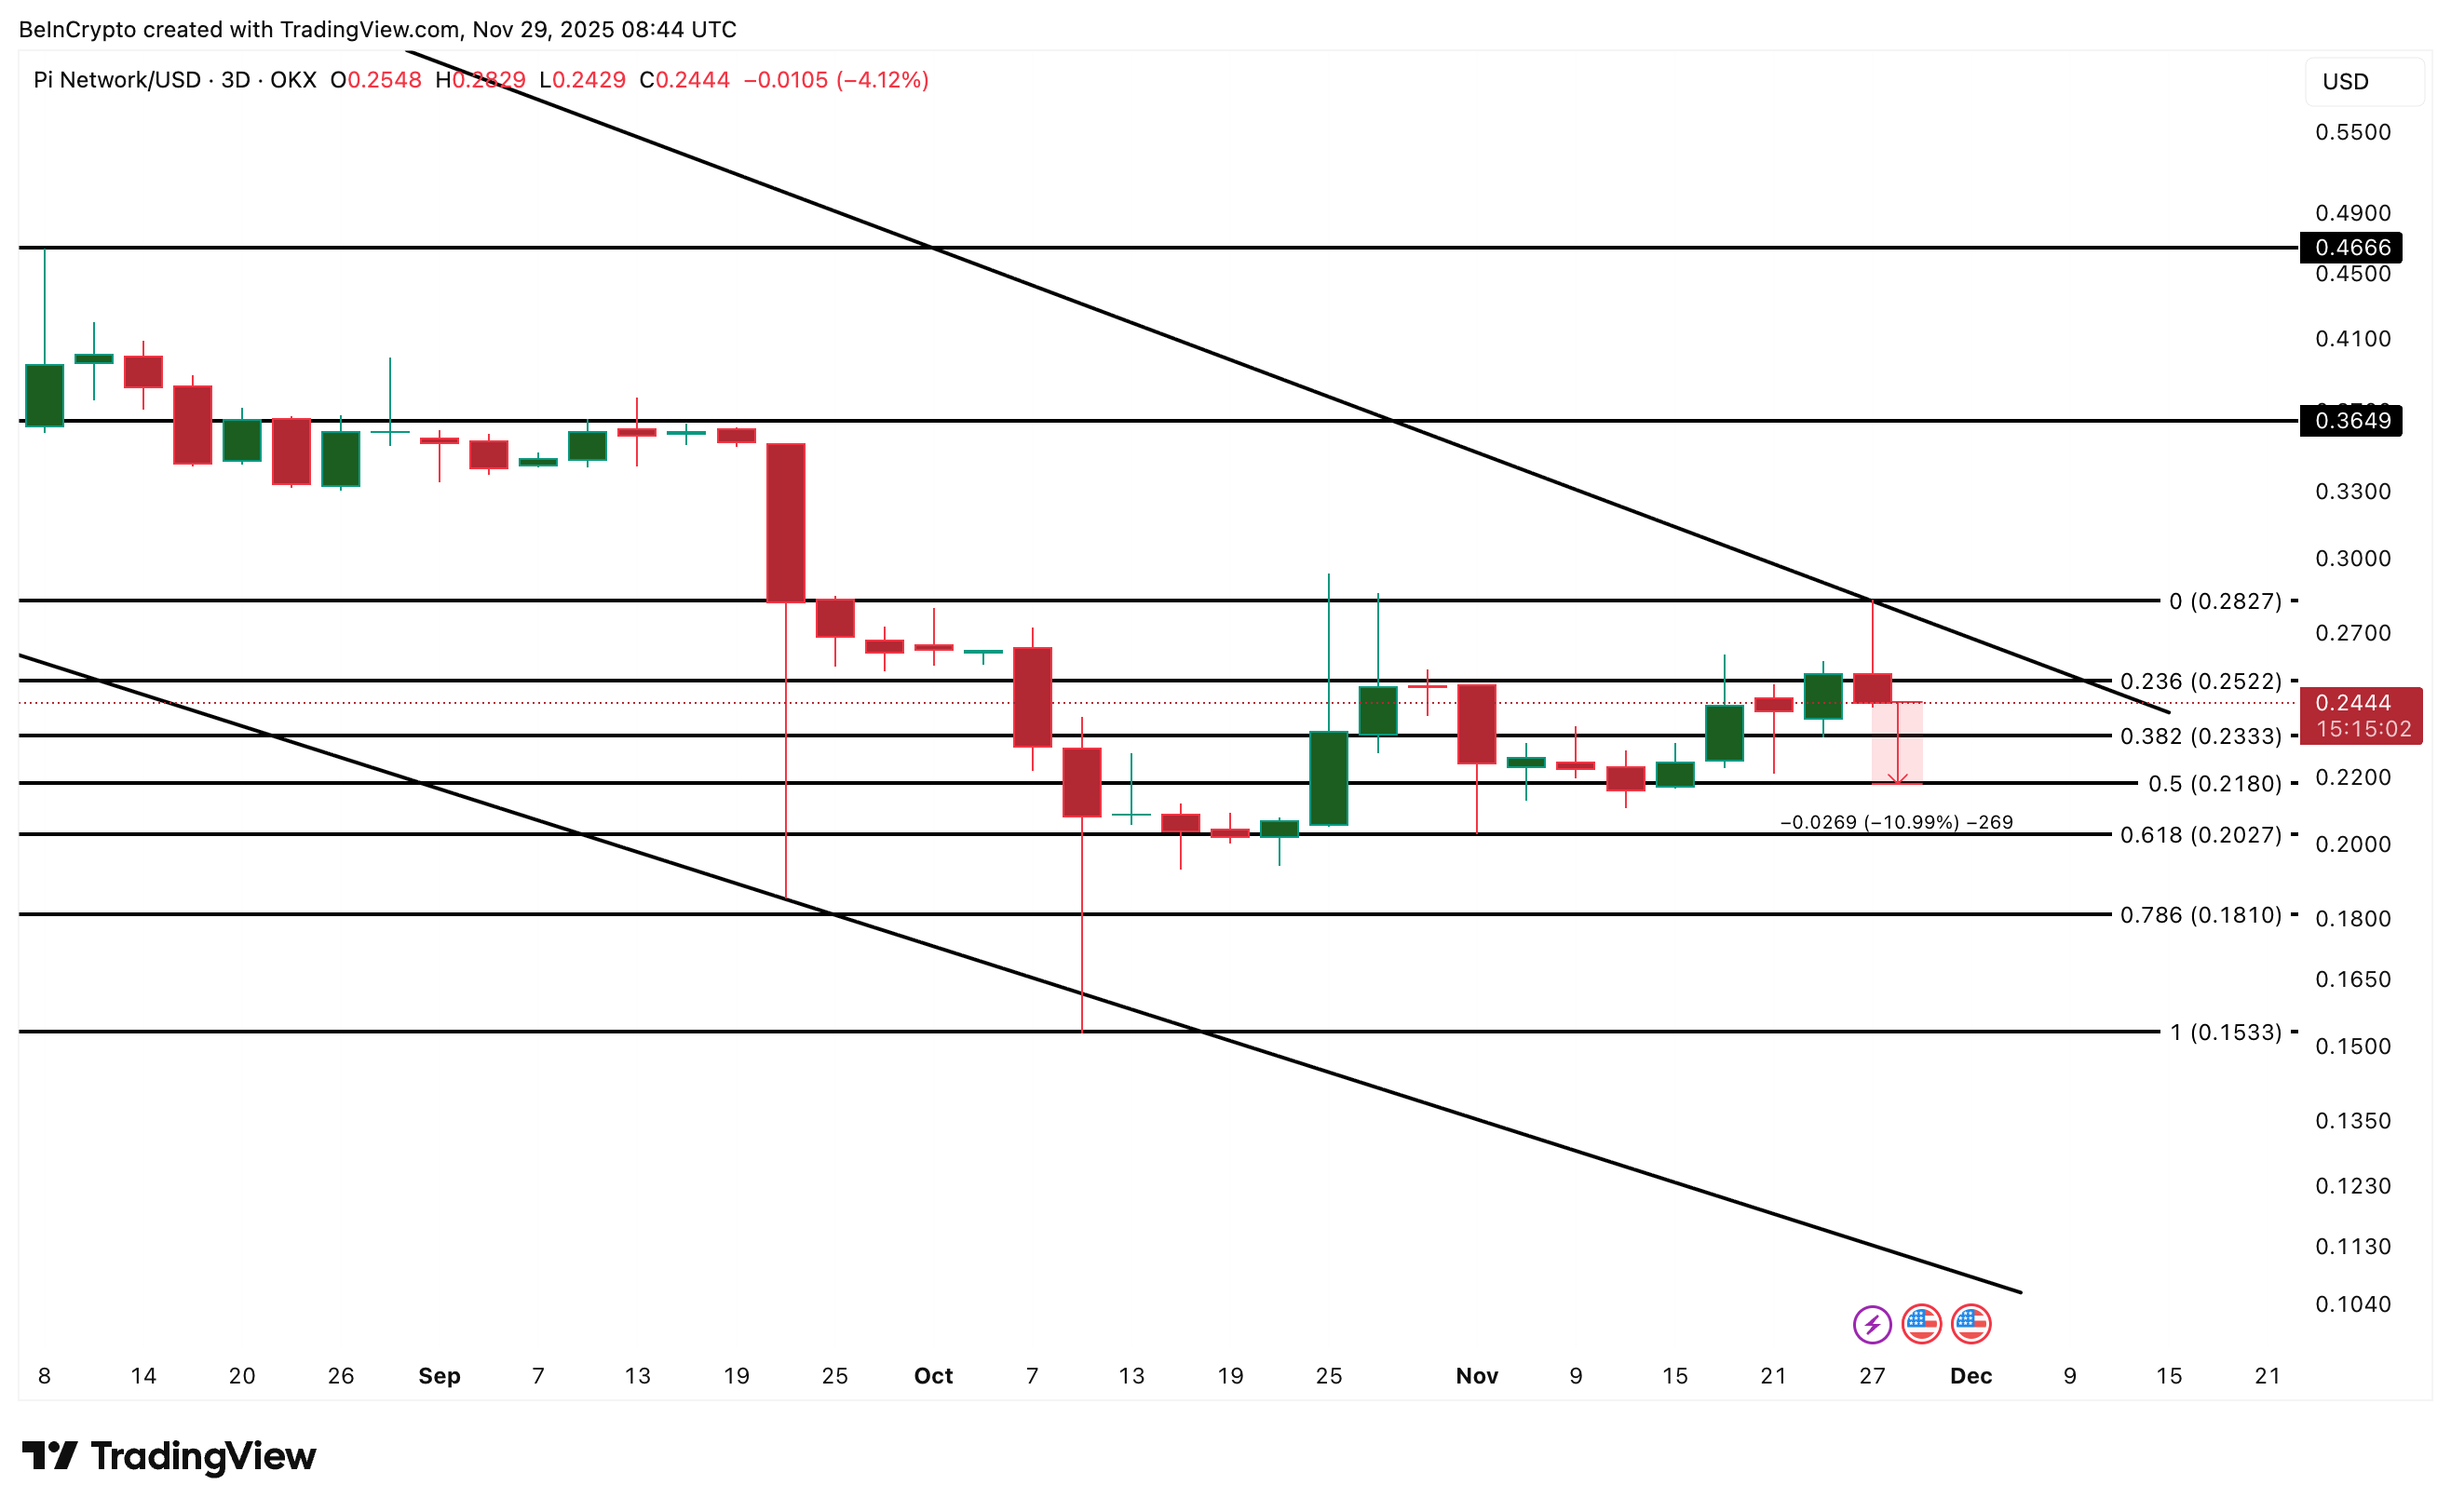
PI Price Could End Up Rangebound
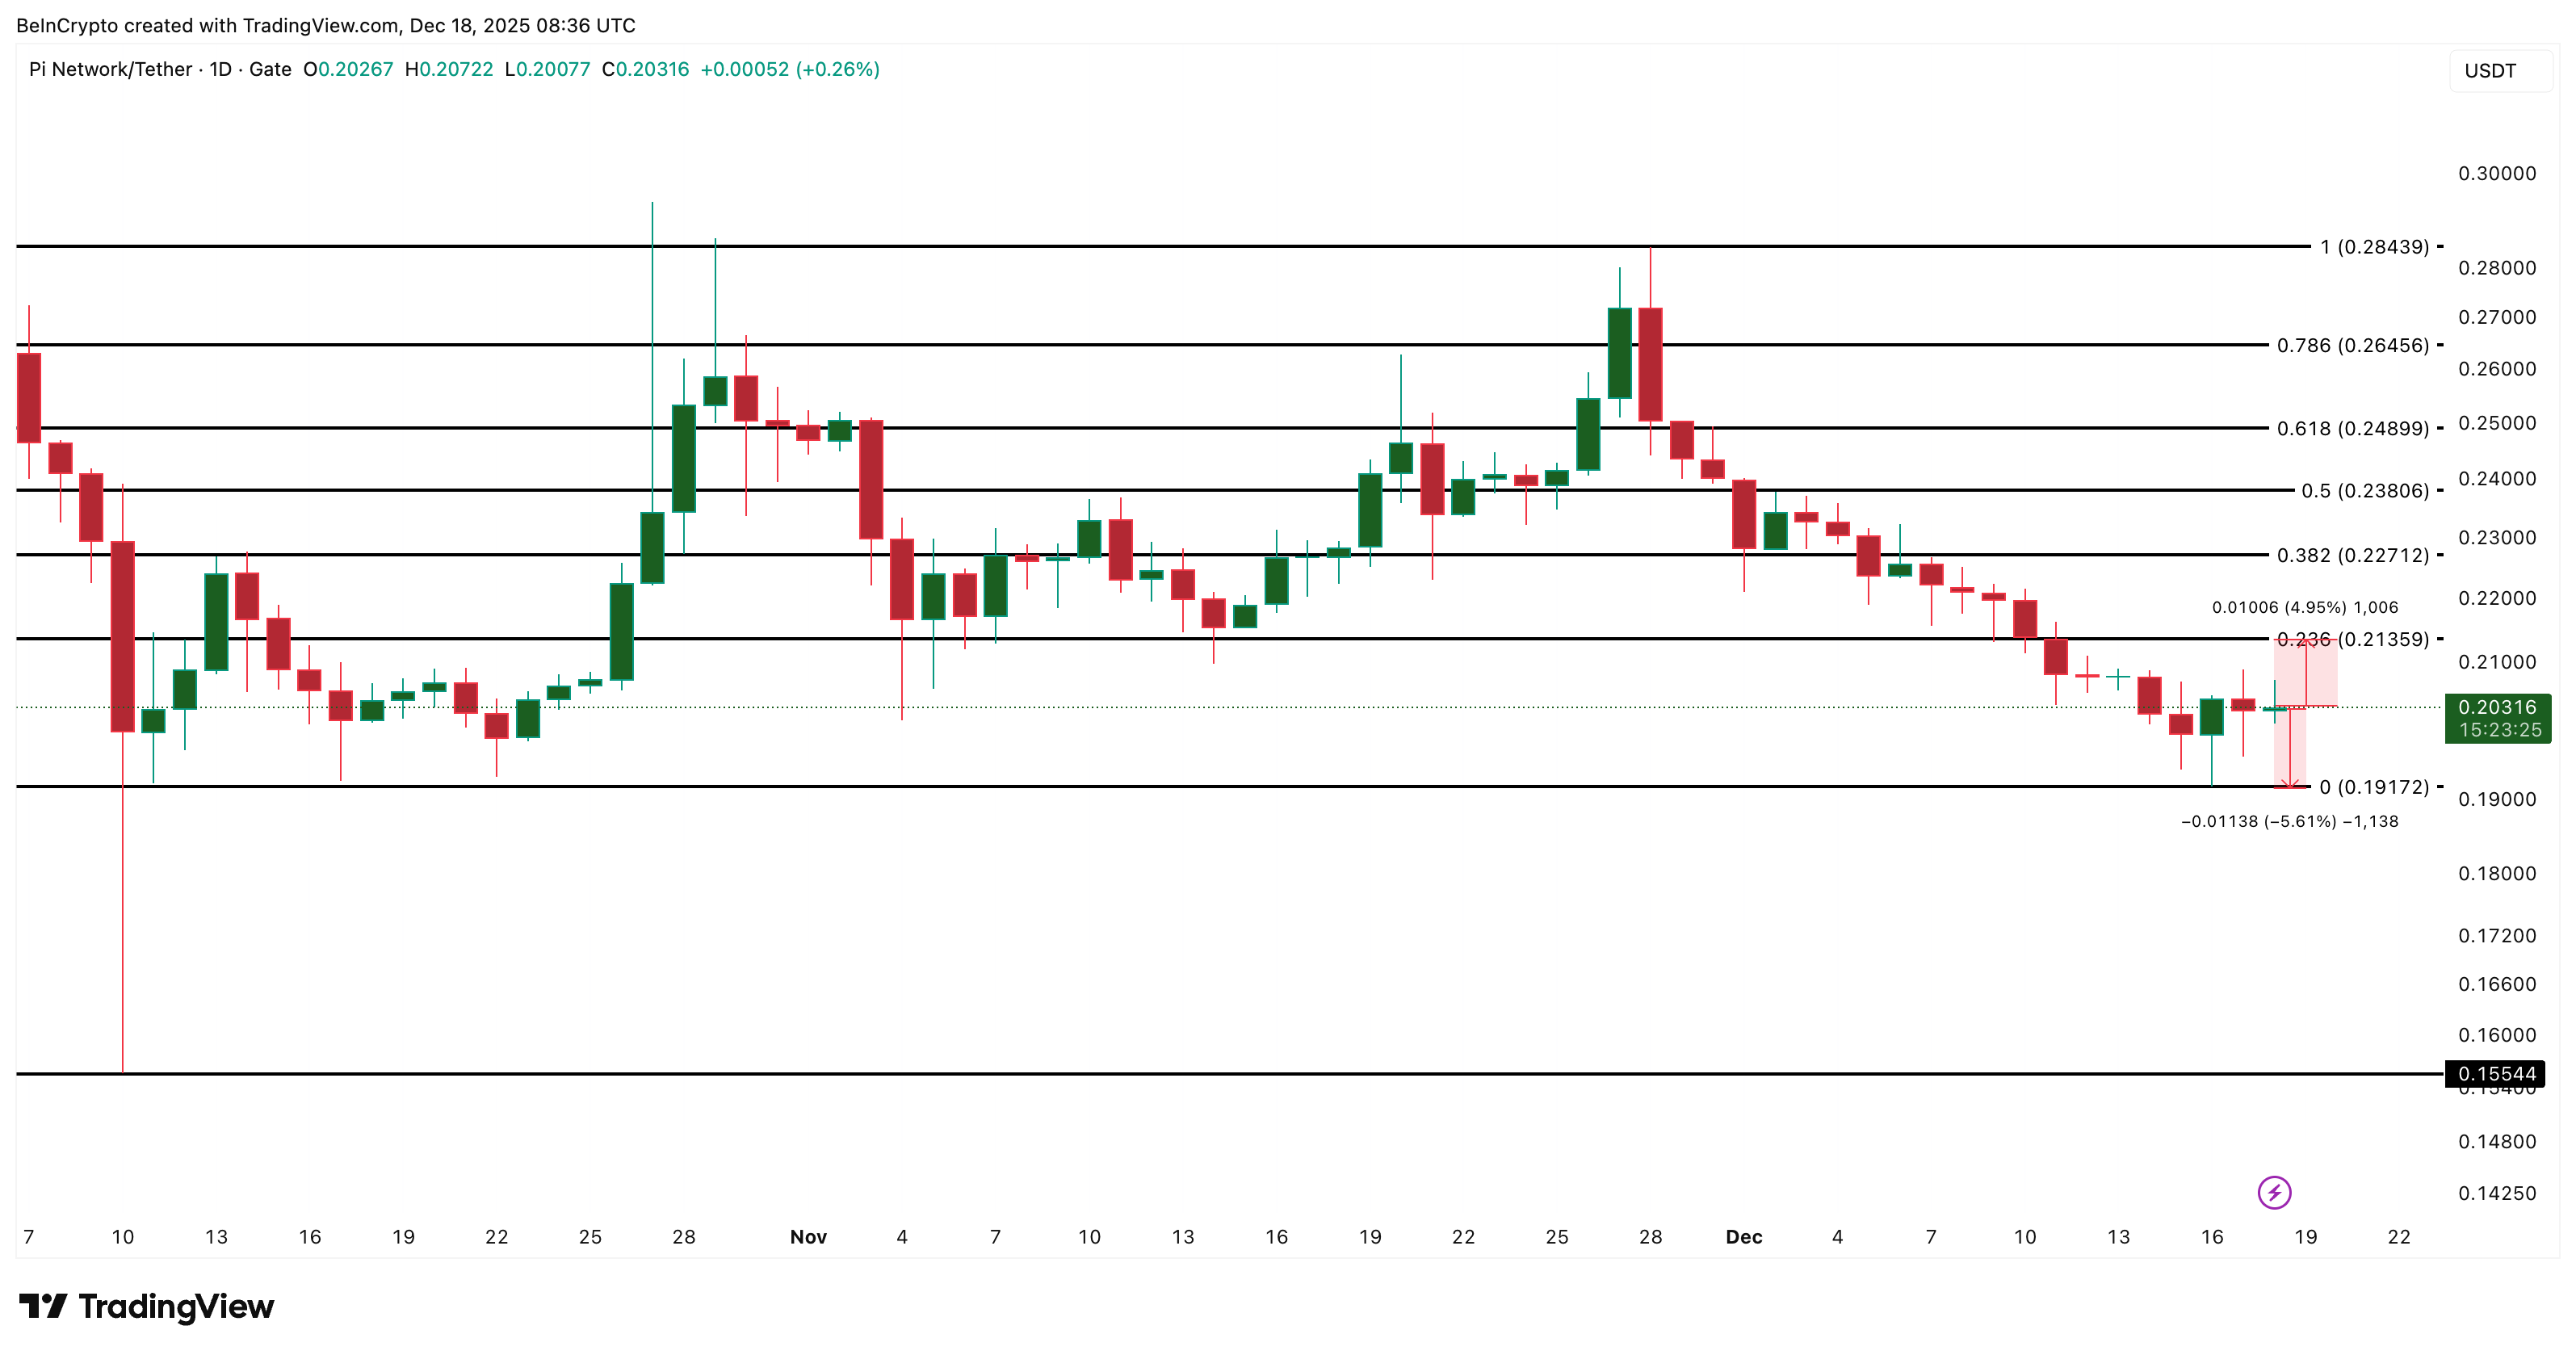
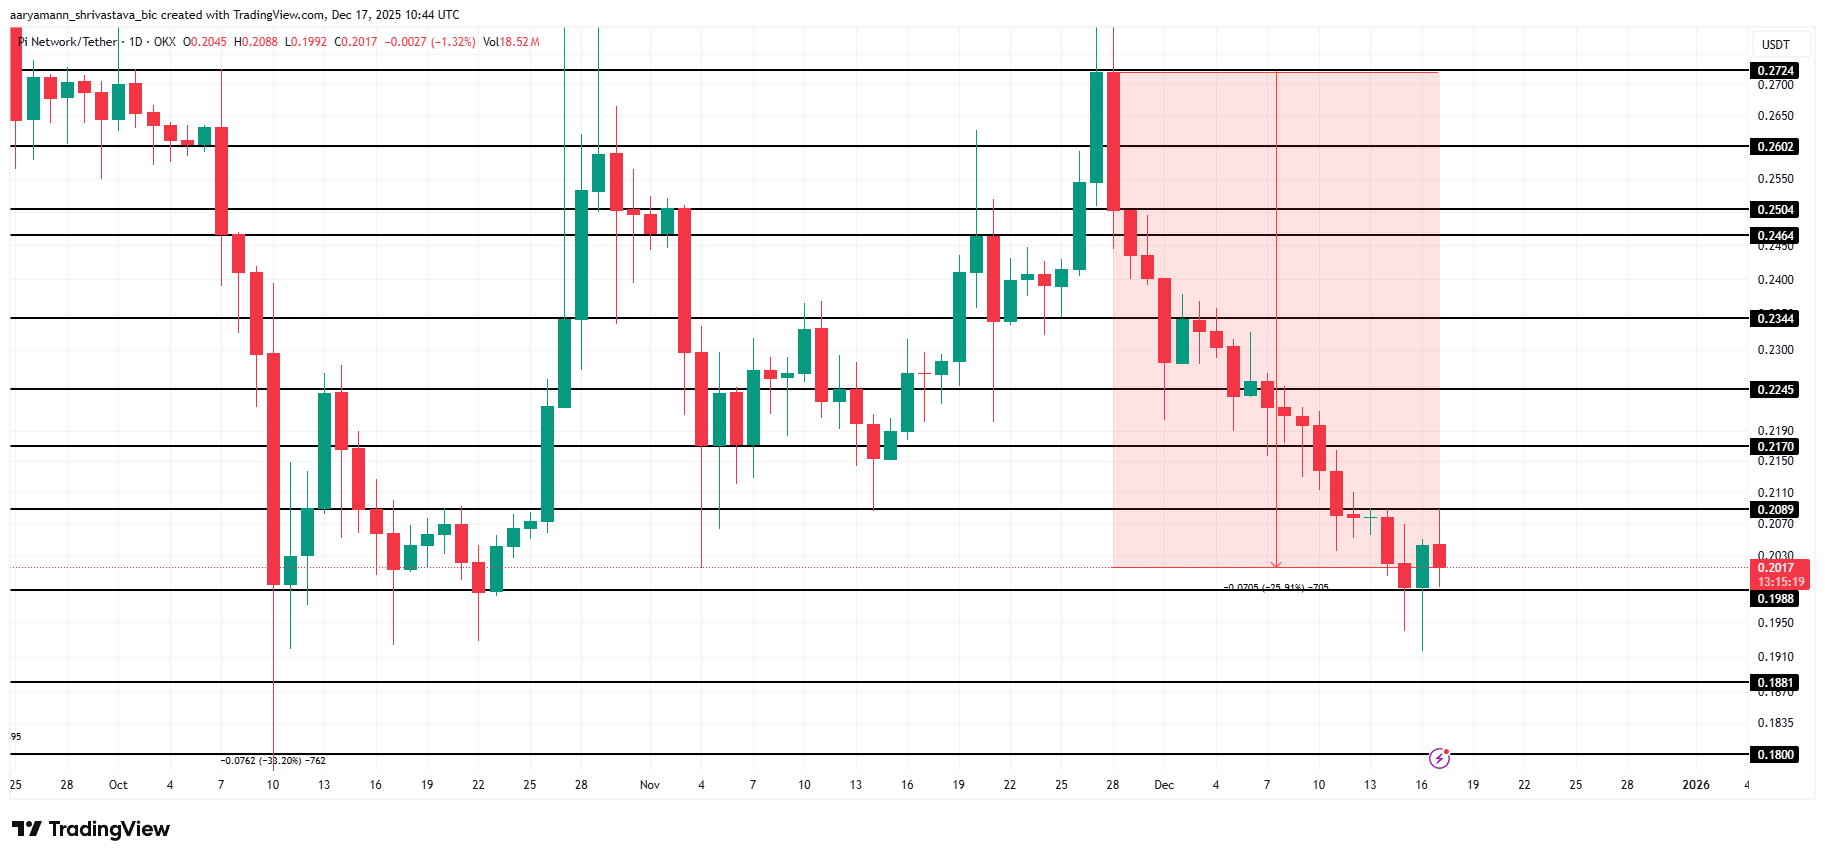
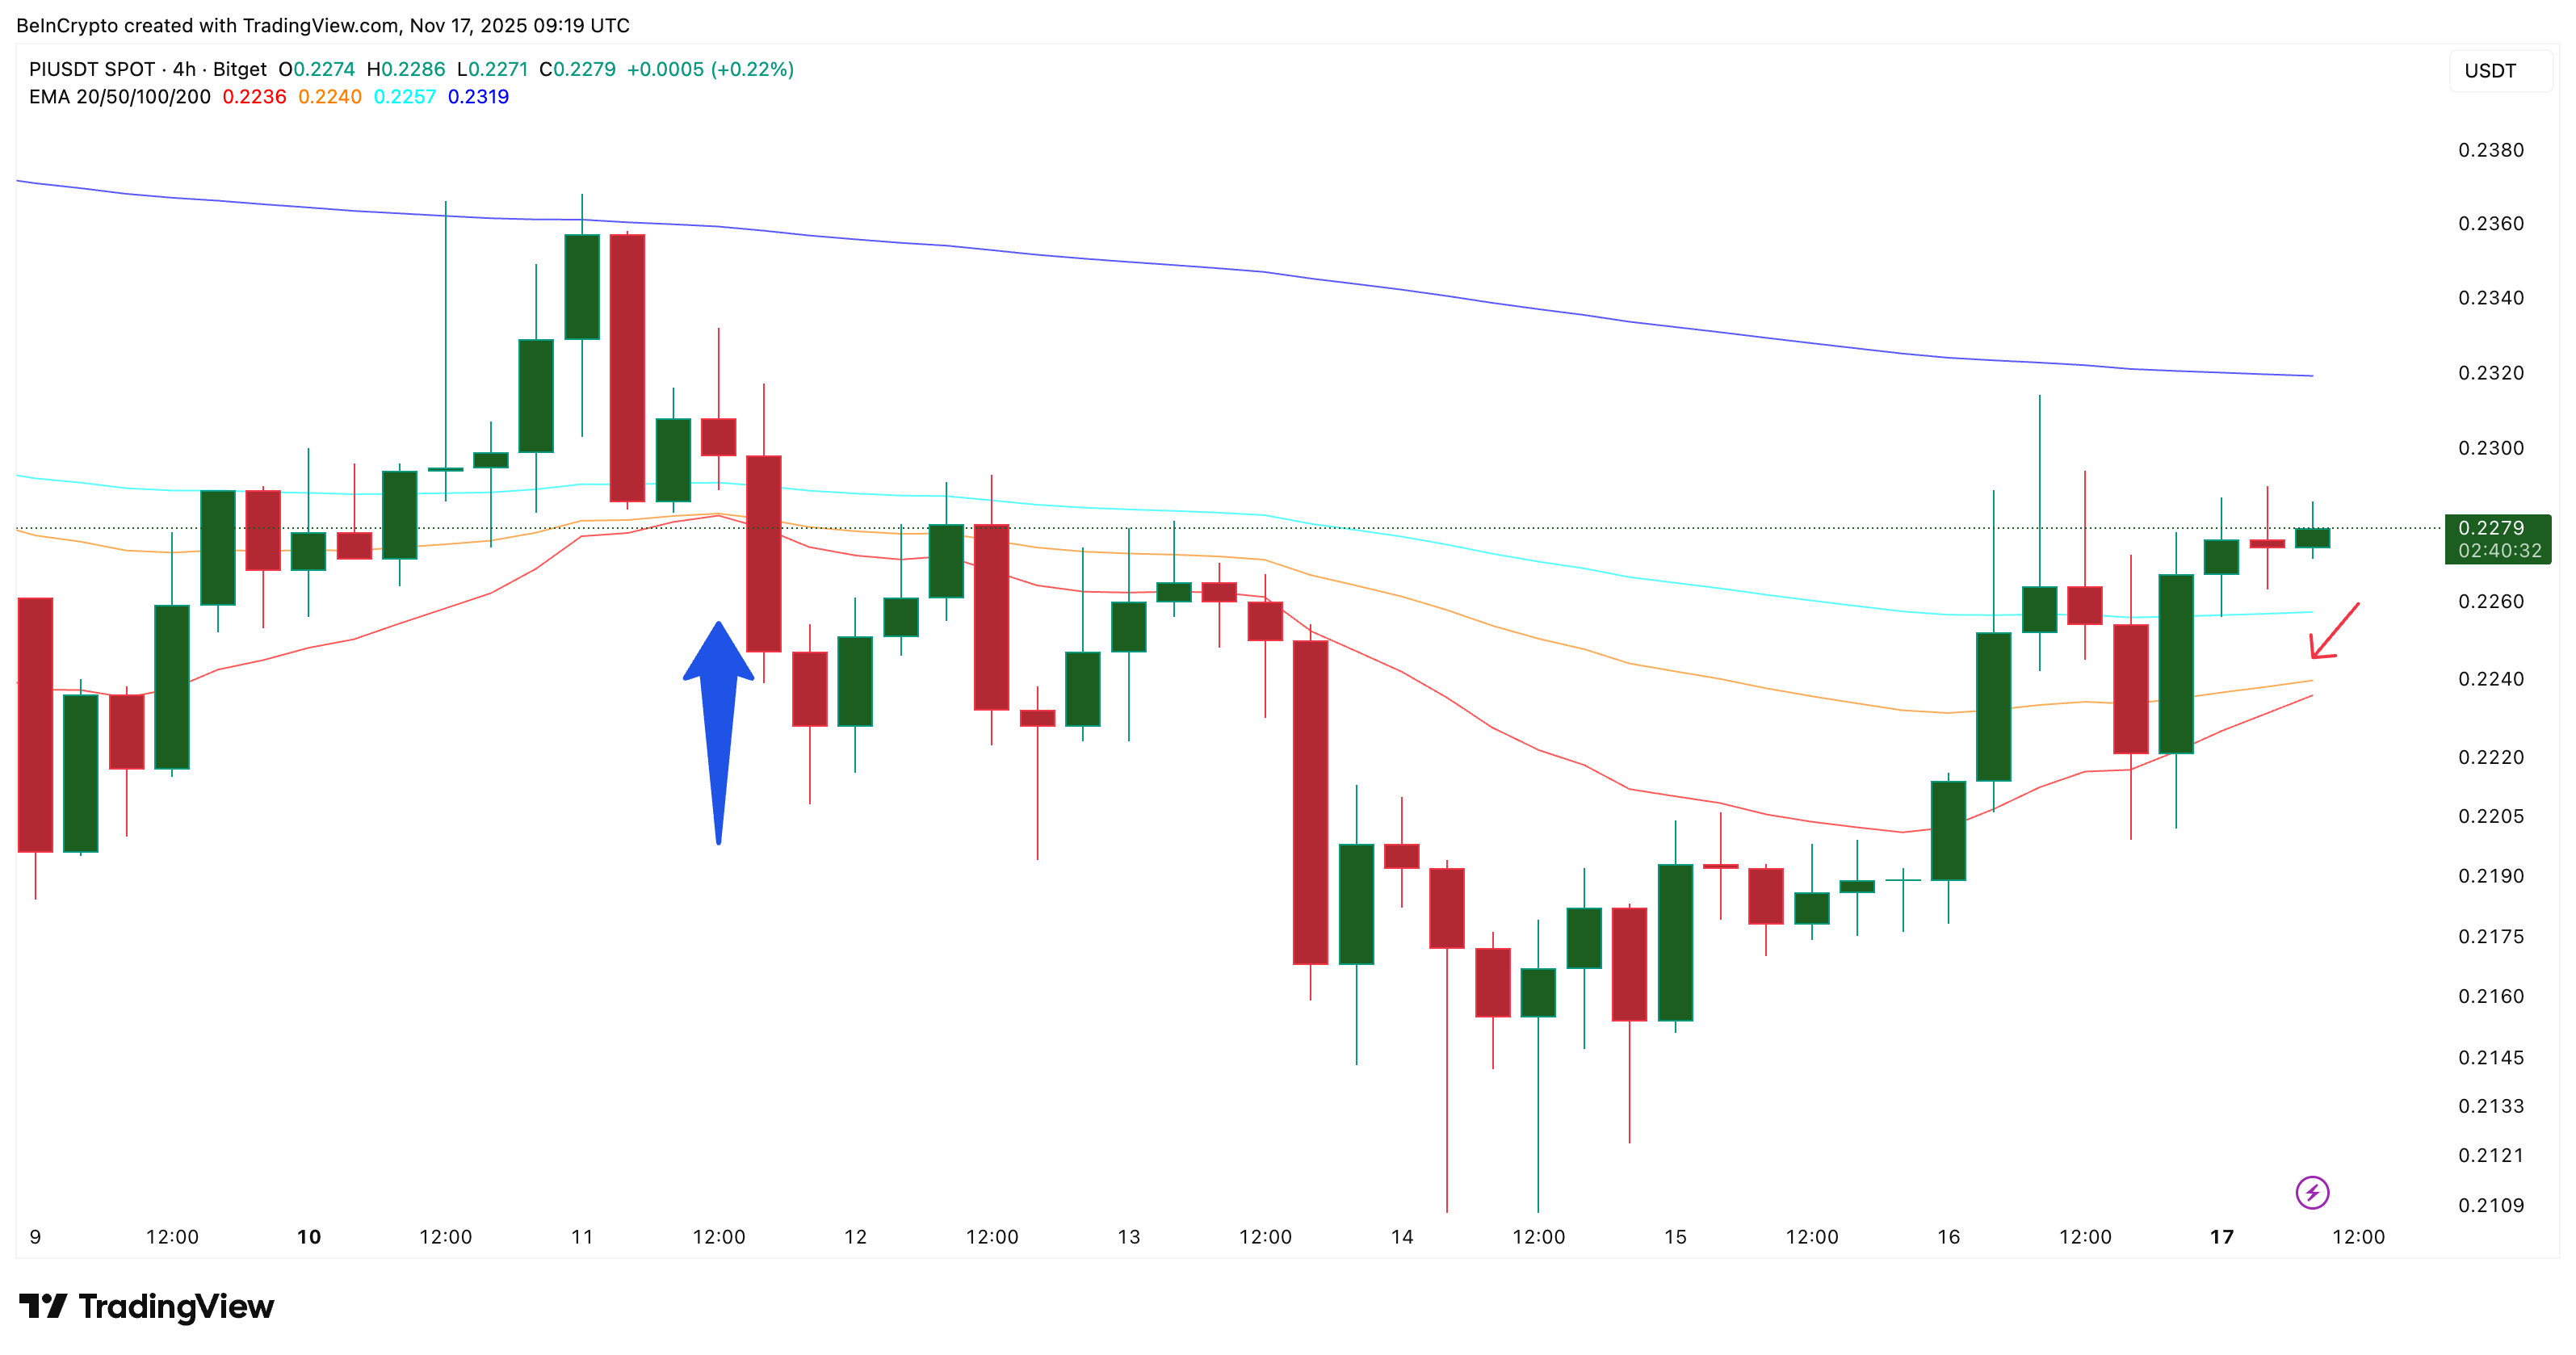
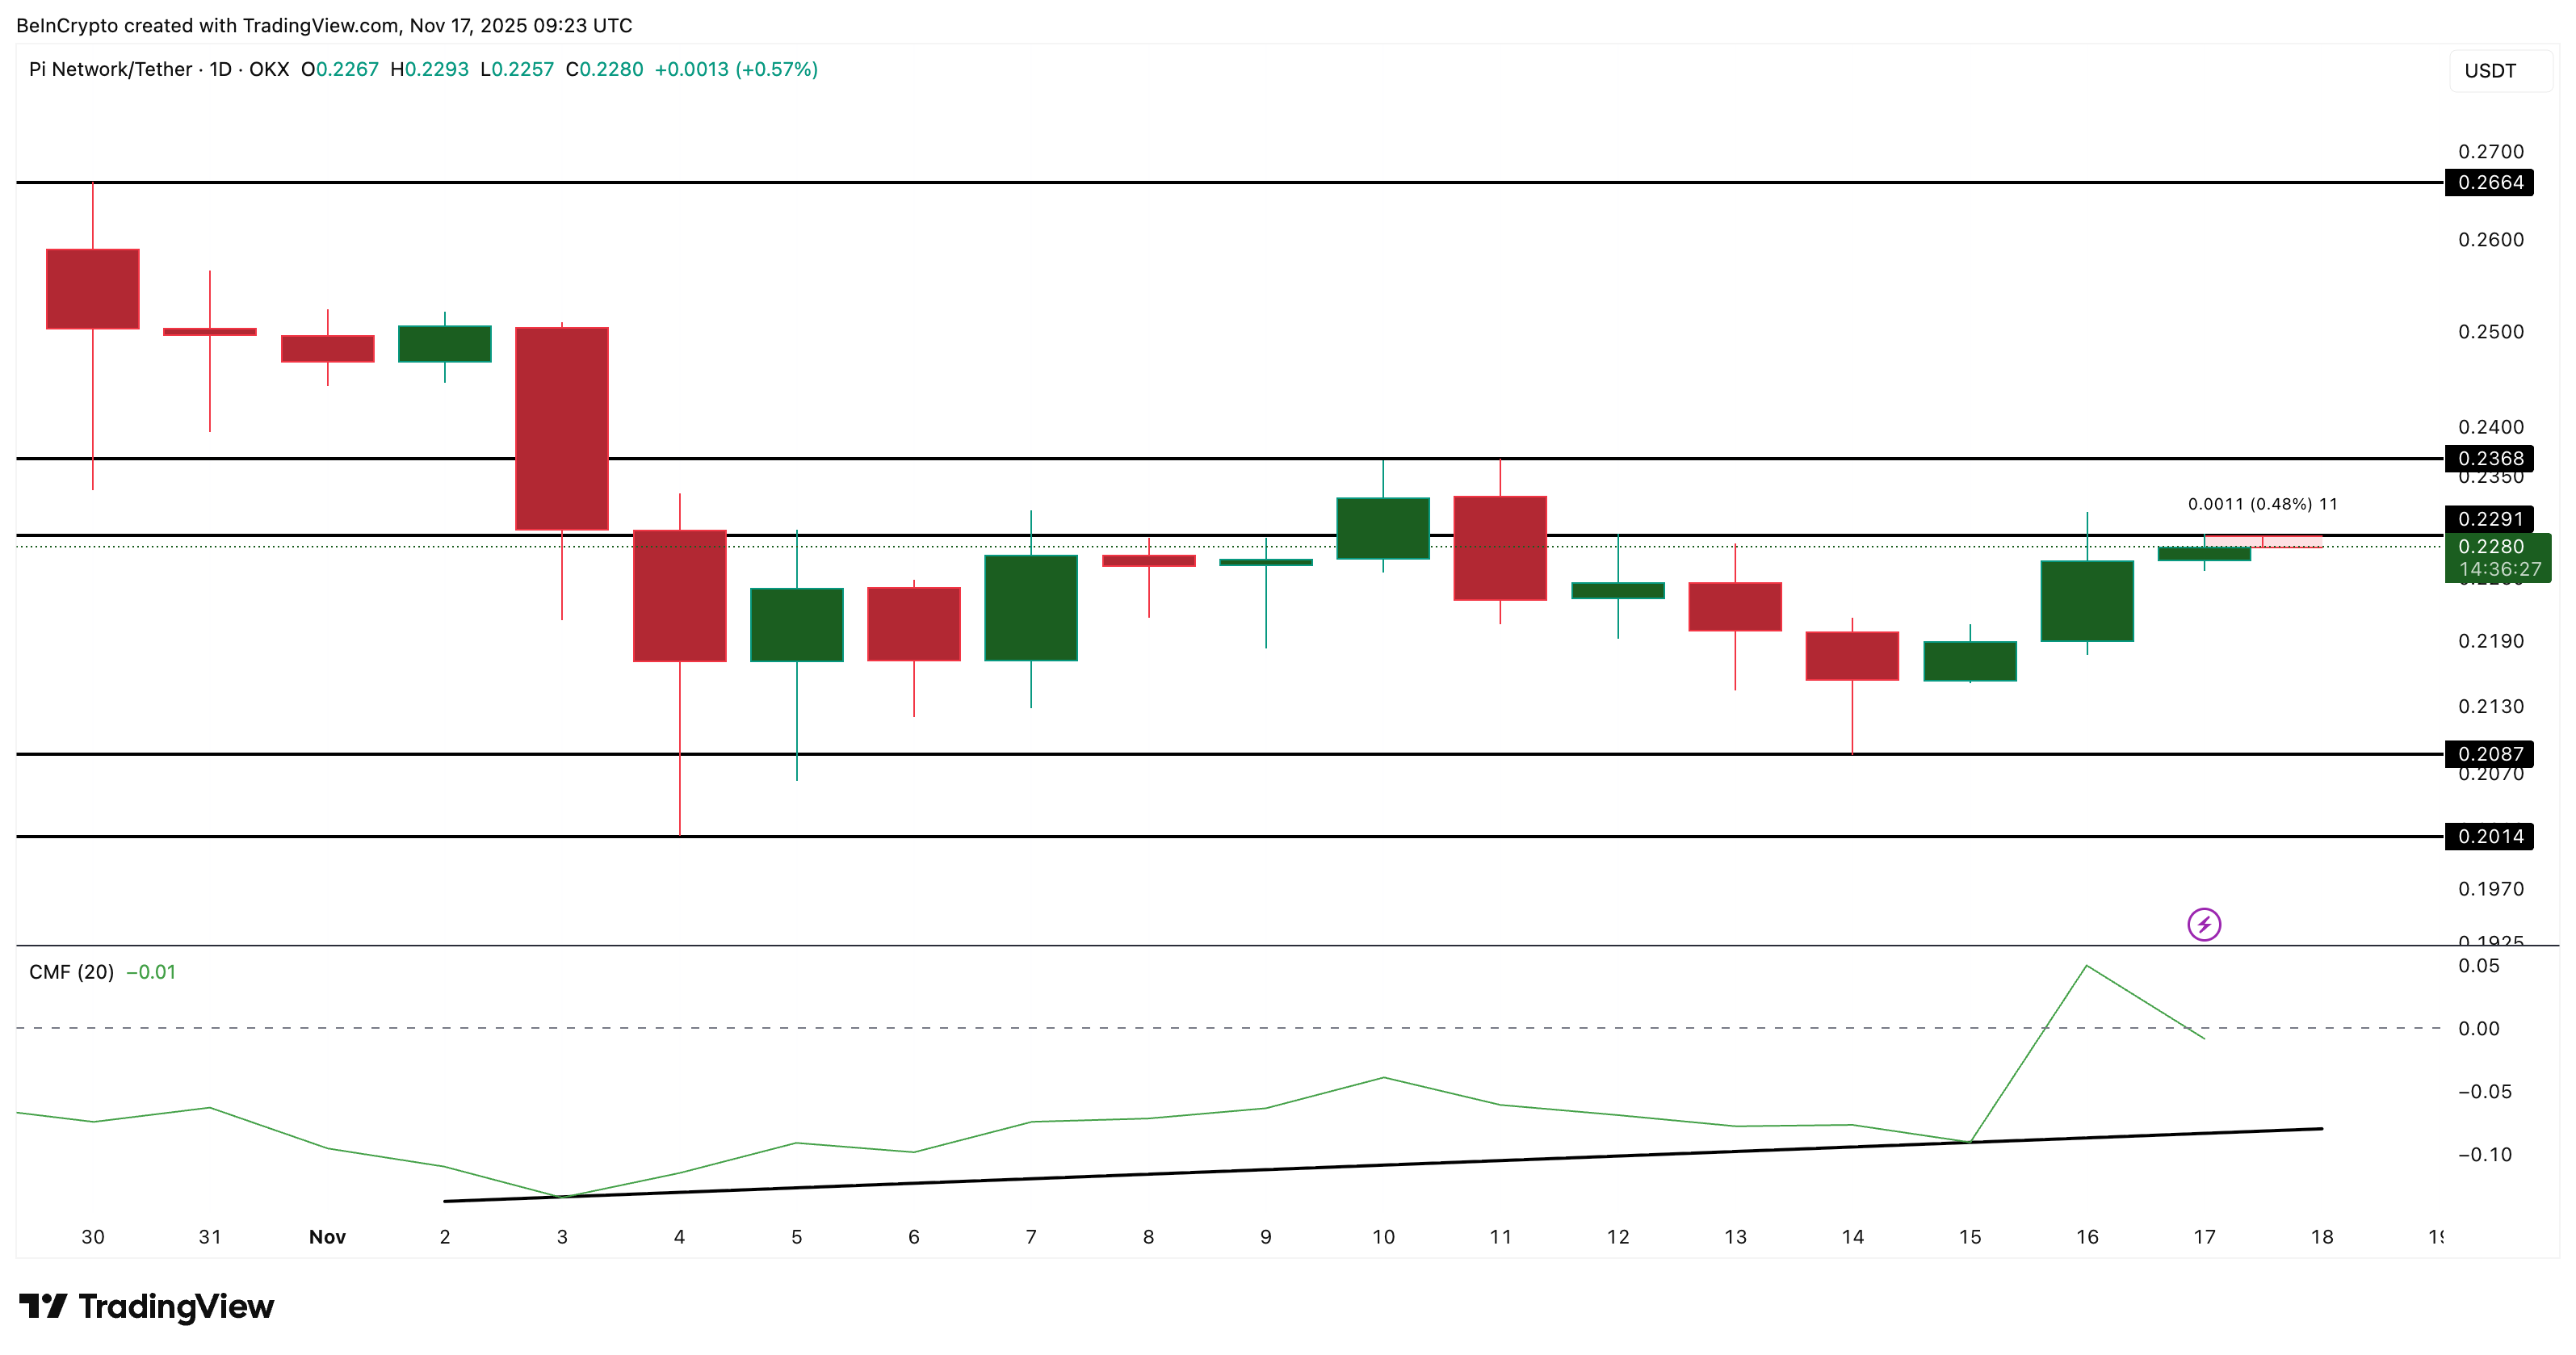
Pi Coin trades near $0.203 at the time of writing, holding above the $0.198 support and below the $0.208 resistance. The token remains down about 28% from its $0.284 local top. Price action suggests consolidation rather than a decisive move.
If the downtrend strengthens, Pi Coin may remain range-bound between $0.198 and $0.208. This structure would limit upside potential and delay recovery. Prolonged consolidation could further test investor patience during ongoing market uncertainty.
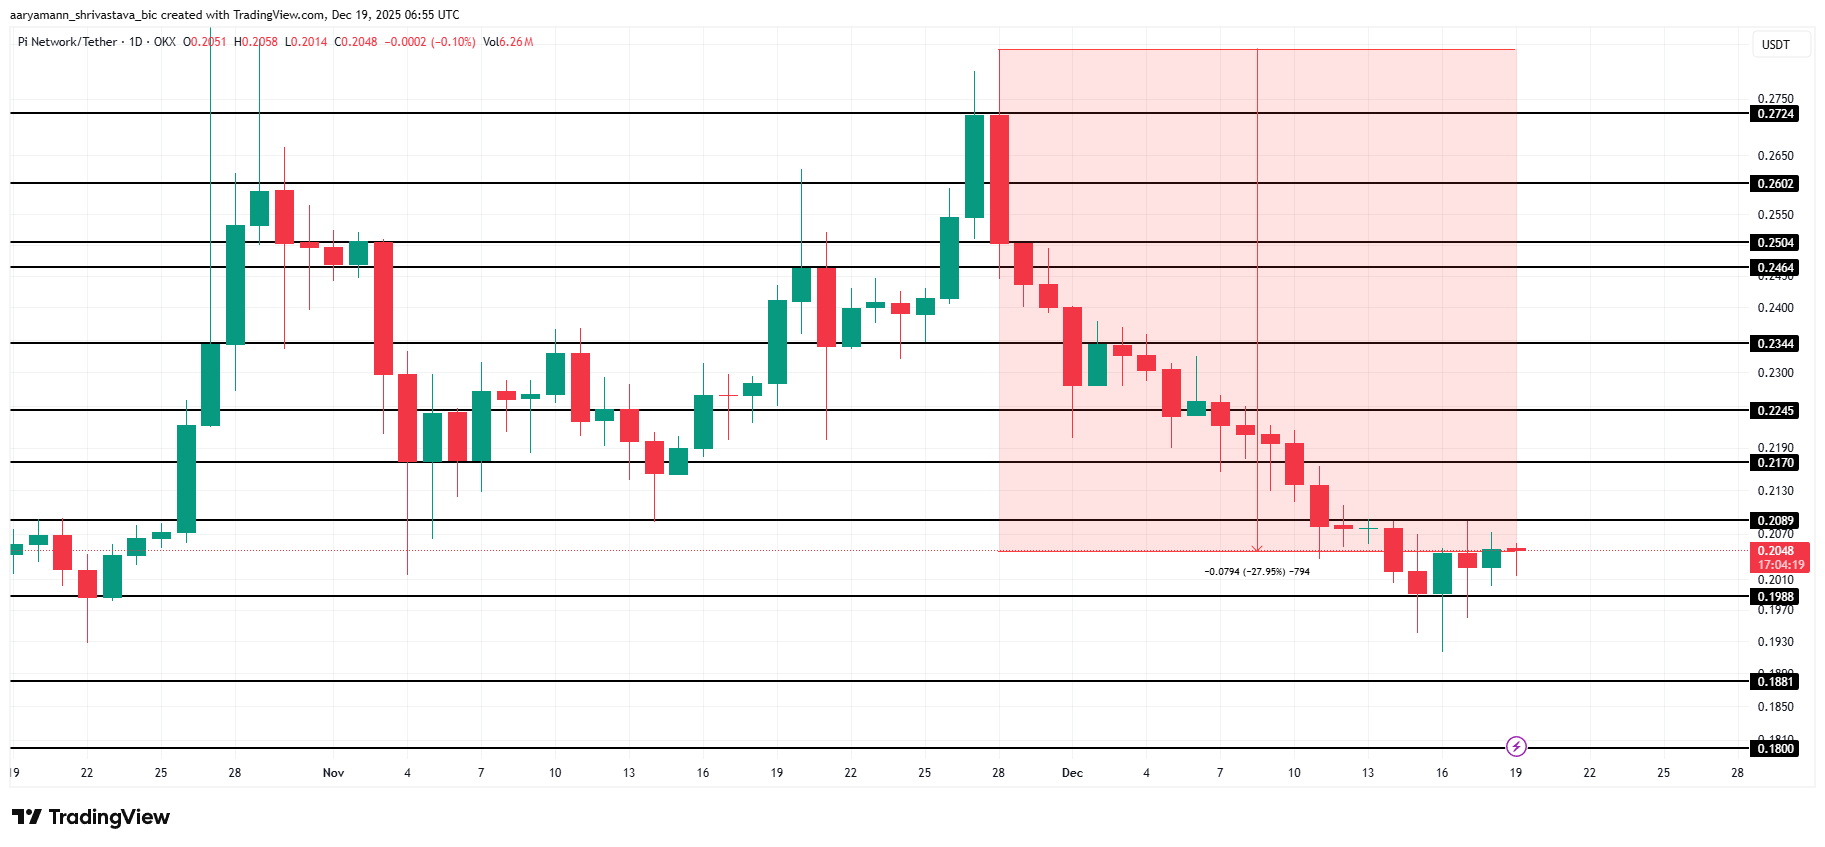
A bullish scenario depends on sustained capital inflows. Continued accumulation could help Pi Coin reclaim $0.208 as support. A successful breakout may drive price toward $0.217, with further upside to $0.224. Such a move would invalidate the bearish thesis.
The post Pi Coin’s Decline Continues, Yet the Data Tells a More Complex Story appeared first on BeInCrypto.