Reading view

Cardano Price Sends a Clear Warning After Back-to-Back Breakdowns— $0.25 Now in Focus

Cardano price is trading near its weakest levels of the year. The token is down roughly 24% over the past 30 days and about 5% over the past 24 hours, hovering close to its yearly low near $0.37. What makes this move stand out is not just the size of the drop, but the structure behind it.

In the span of just two months, Cardano has completed two separate bearish continuation breakdowns, putting fresh pressure on the chart and raising the risk of a deeper move.


Two Bearish Breakdowns in Two Months Signal Structural Weakness

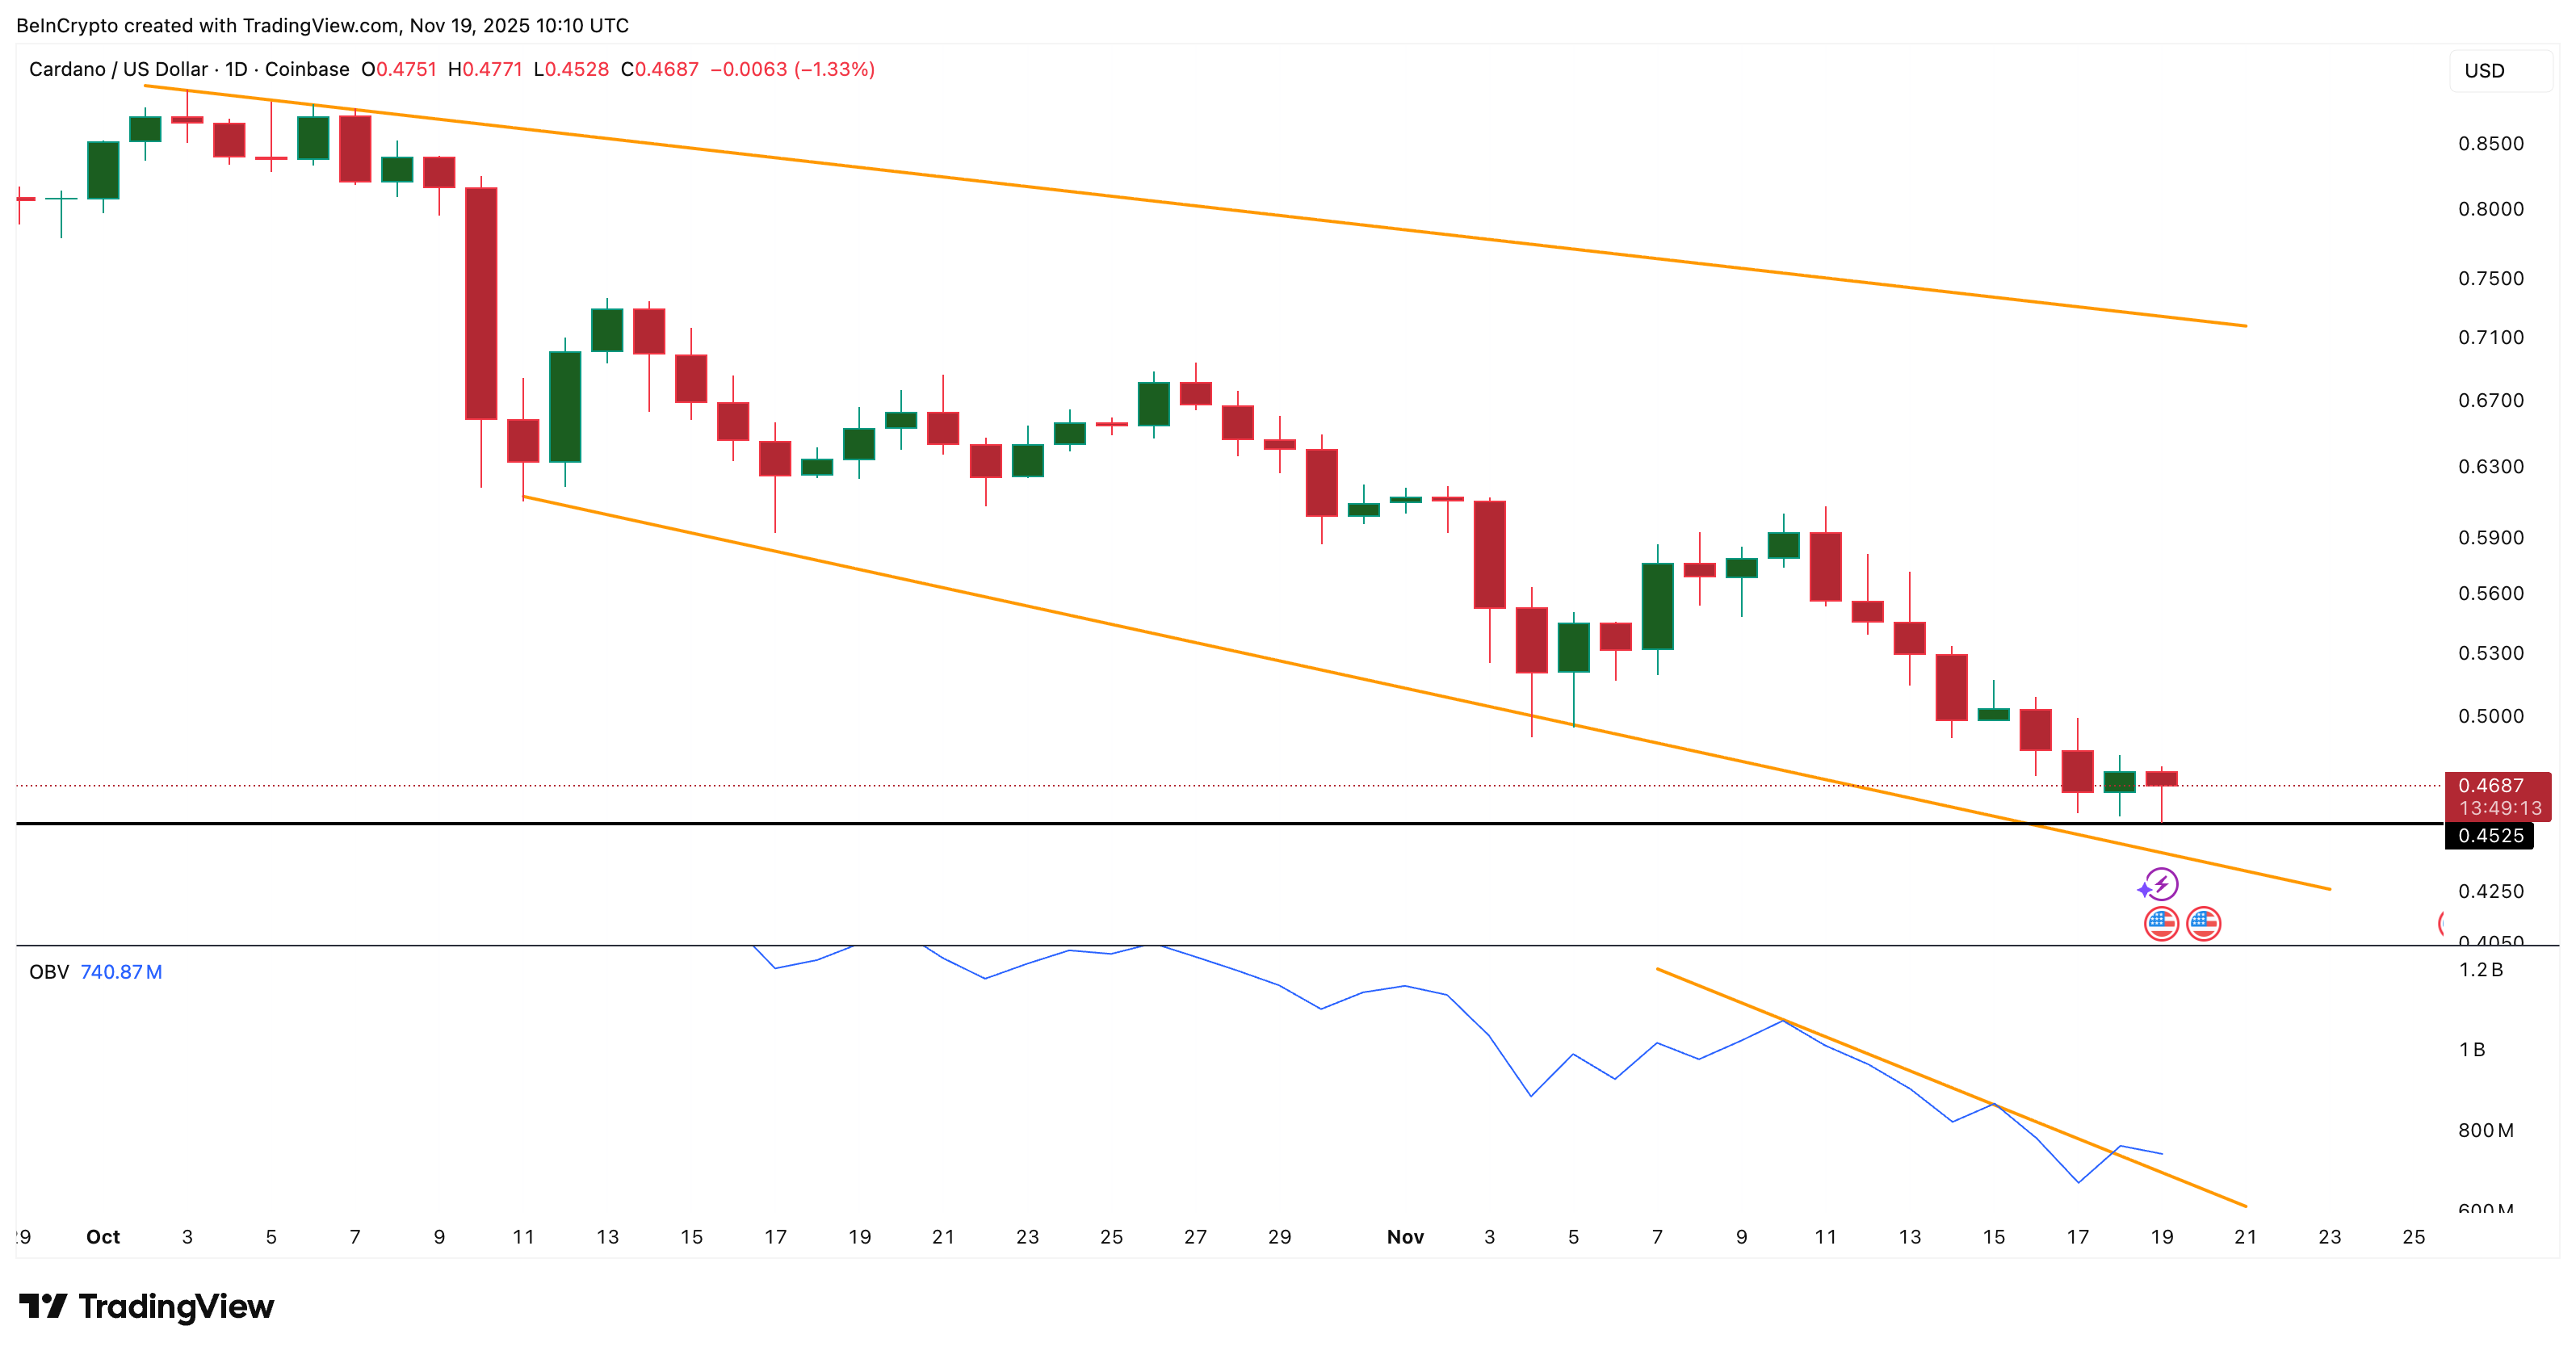
The first breakdown formed in early November. ADA built a bearish flag through late October, then broke down around November 11. That move led to a sharp decline, with the price falling roughly 38% from the flag’s high.

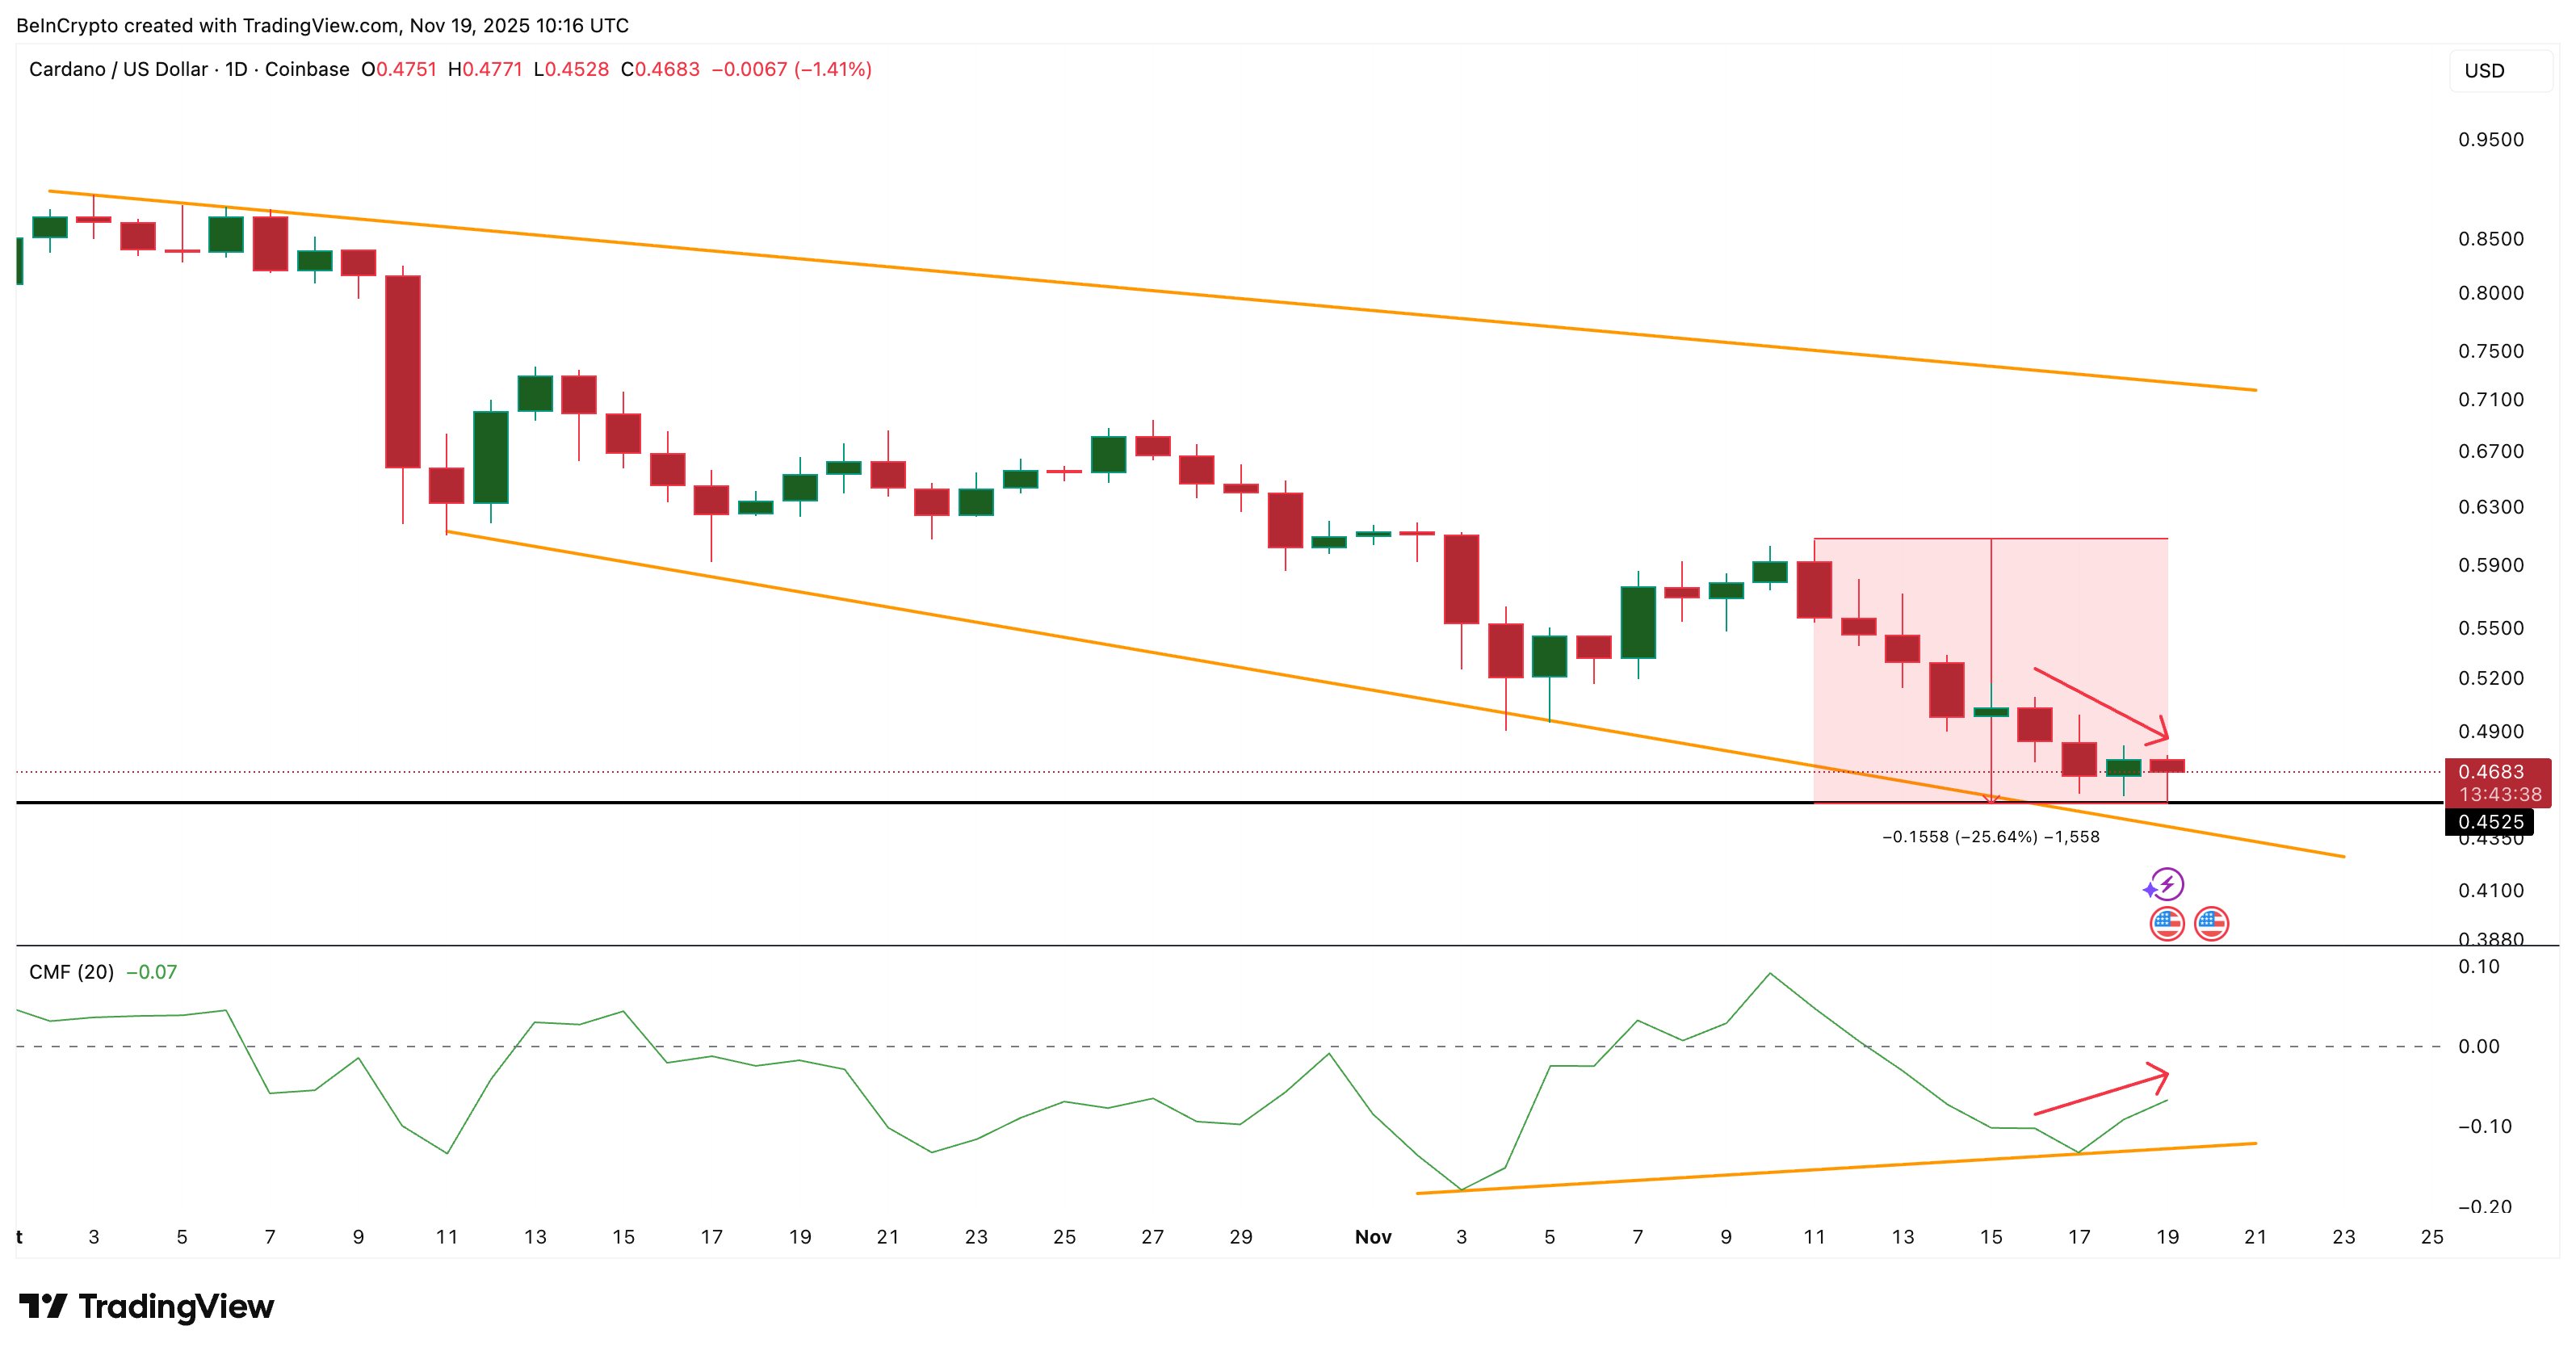
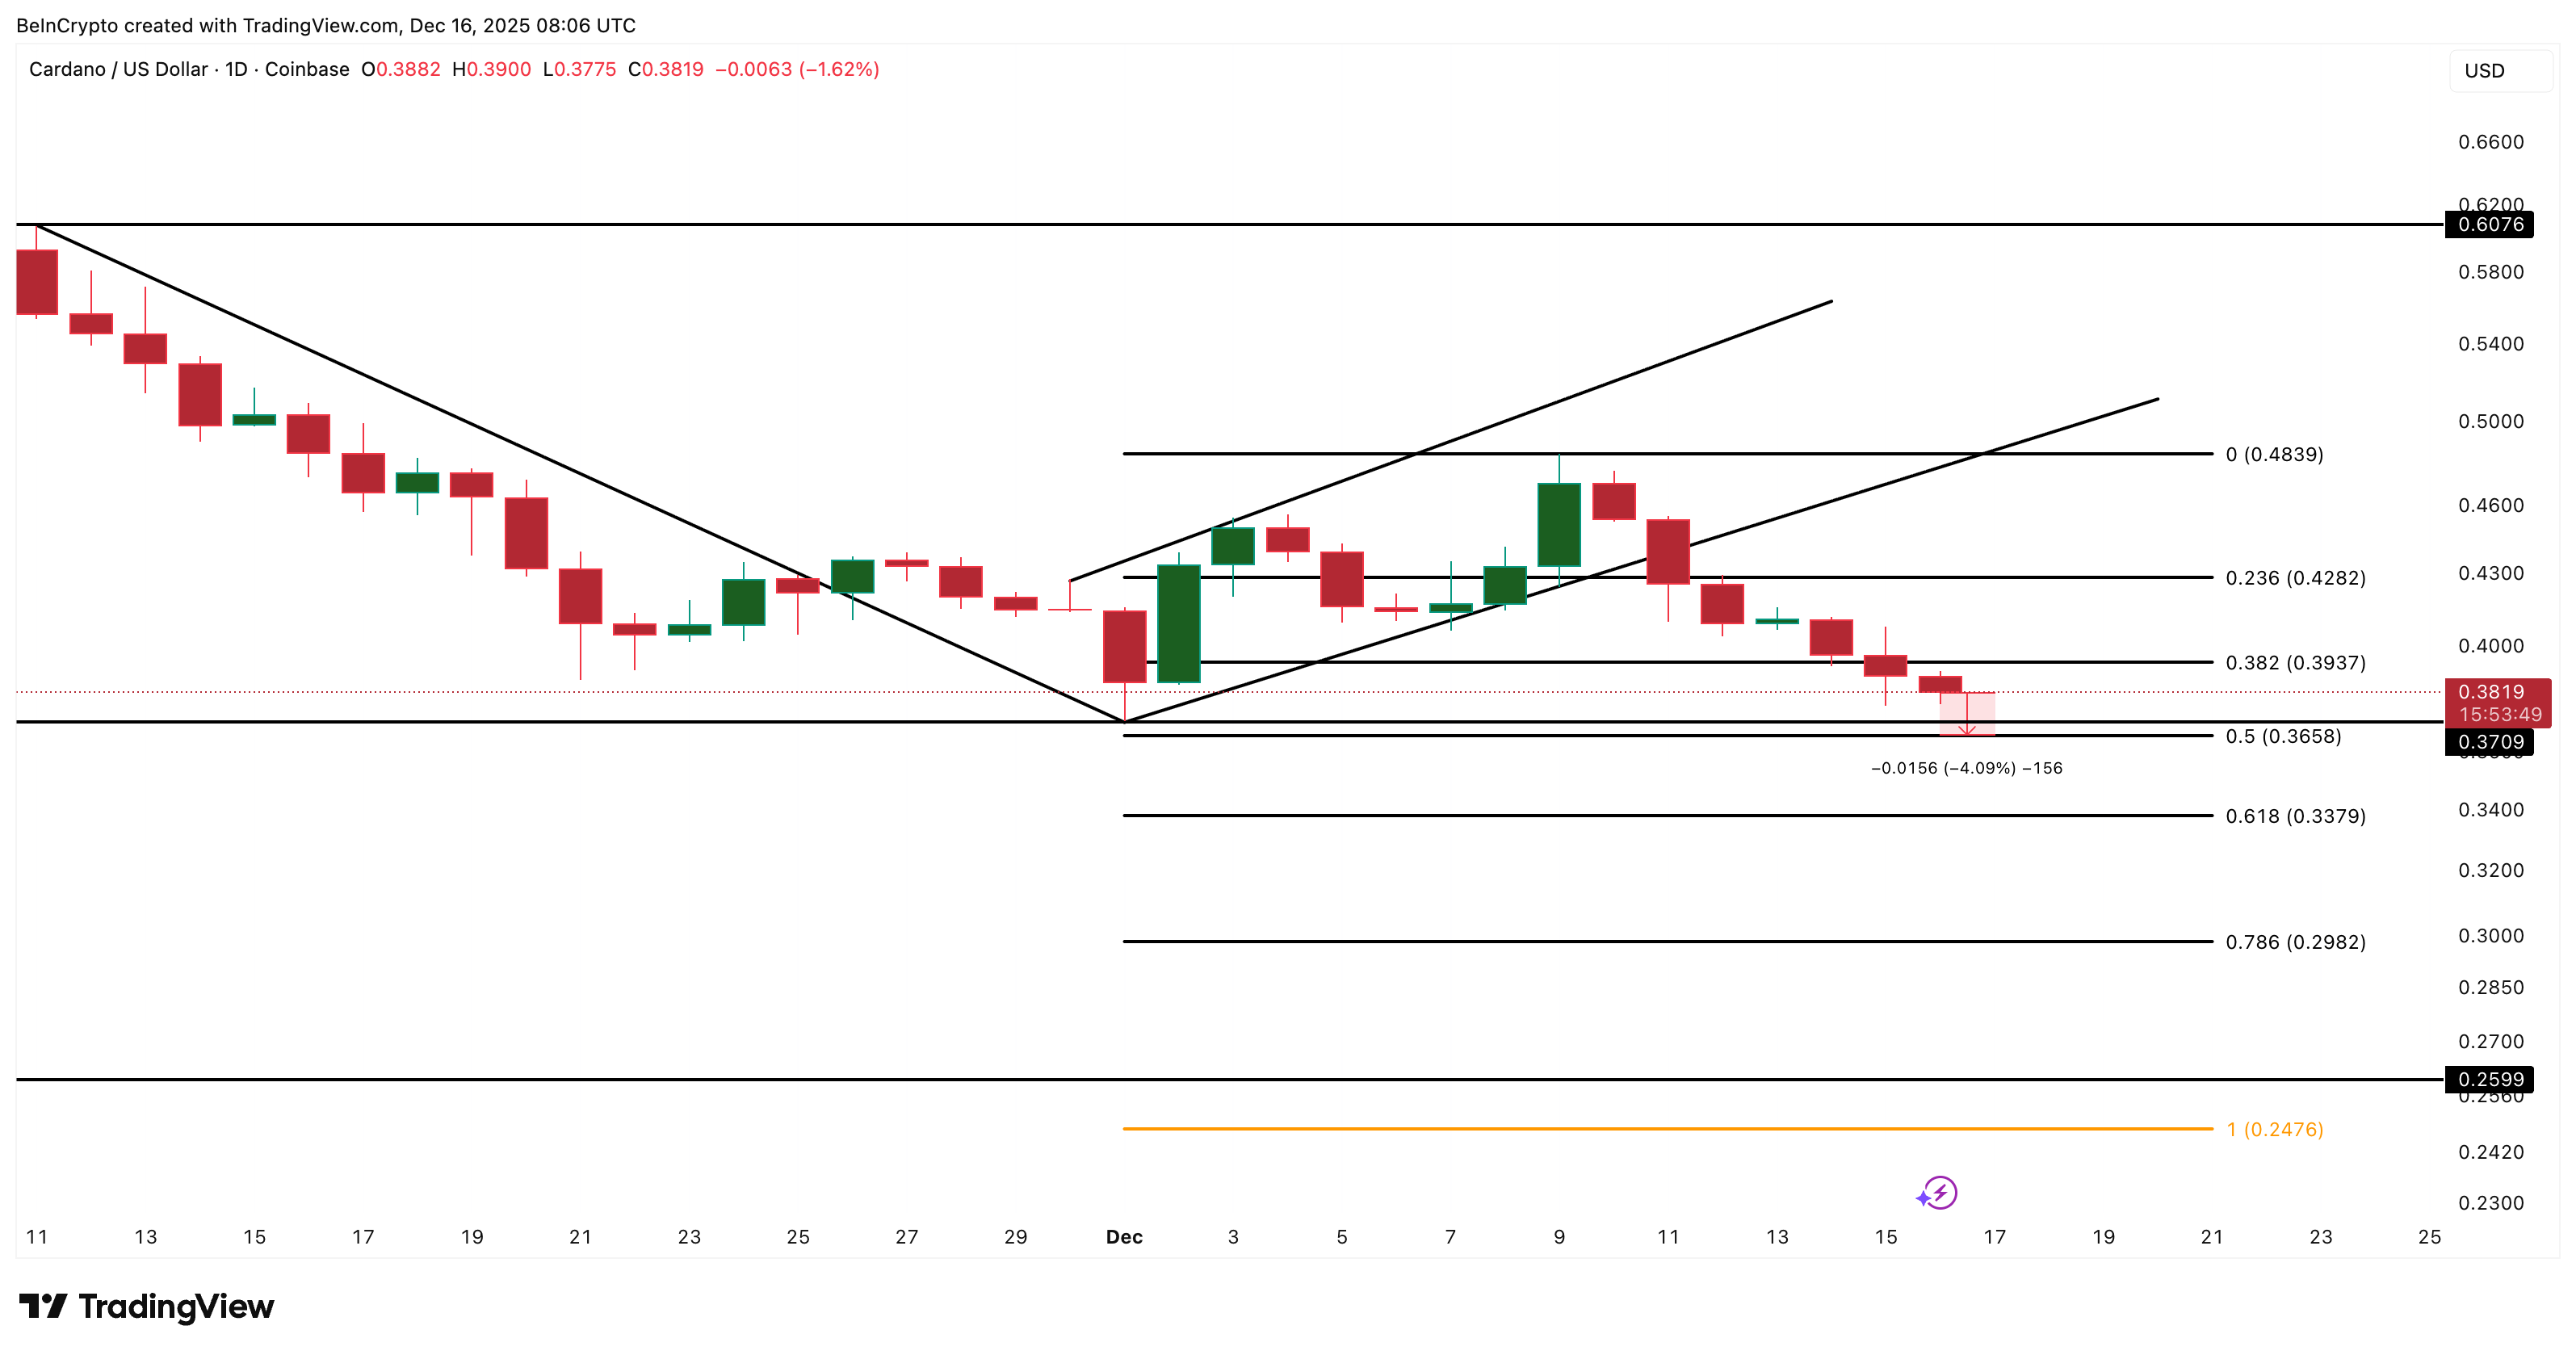
After a brief consolidation, Cardano repeated the pattern. A second bearish flag developed through late November and early December. On December 11, ADA broke down again, confirming a second continuation move in just two months.

Want more token insights like this? Sign up for Editor Harsh Notariya’s Daily Crypto Newsletter here.

Price Breakdown Highlighted
Price Breakdown Highlighted: TradingView

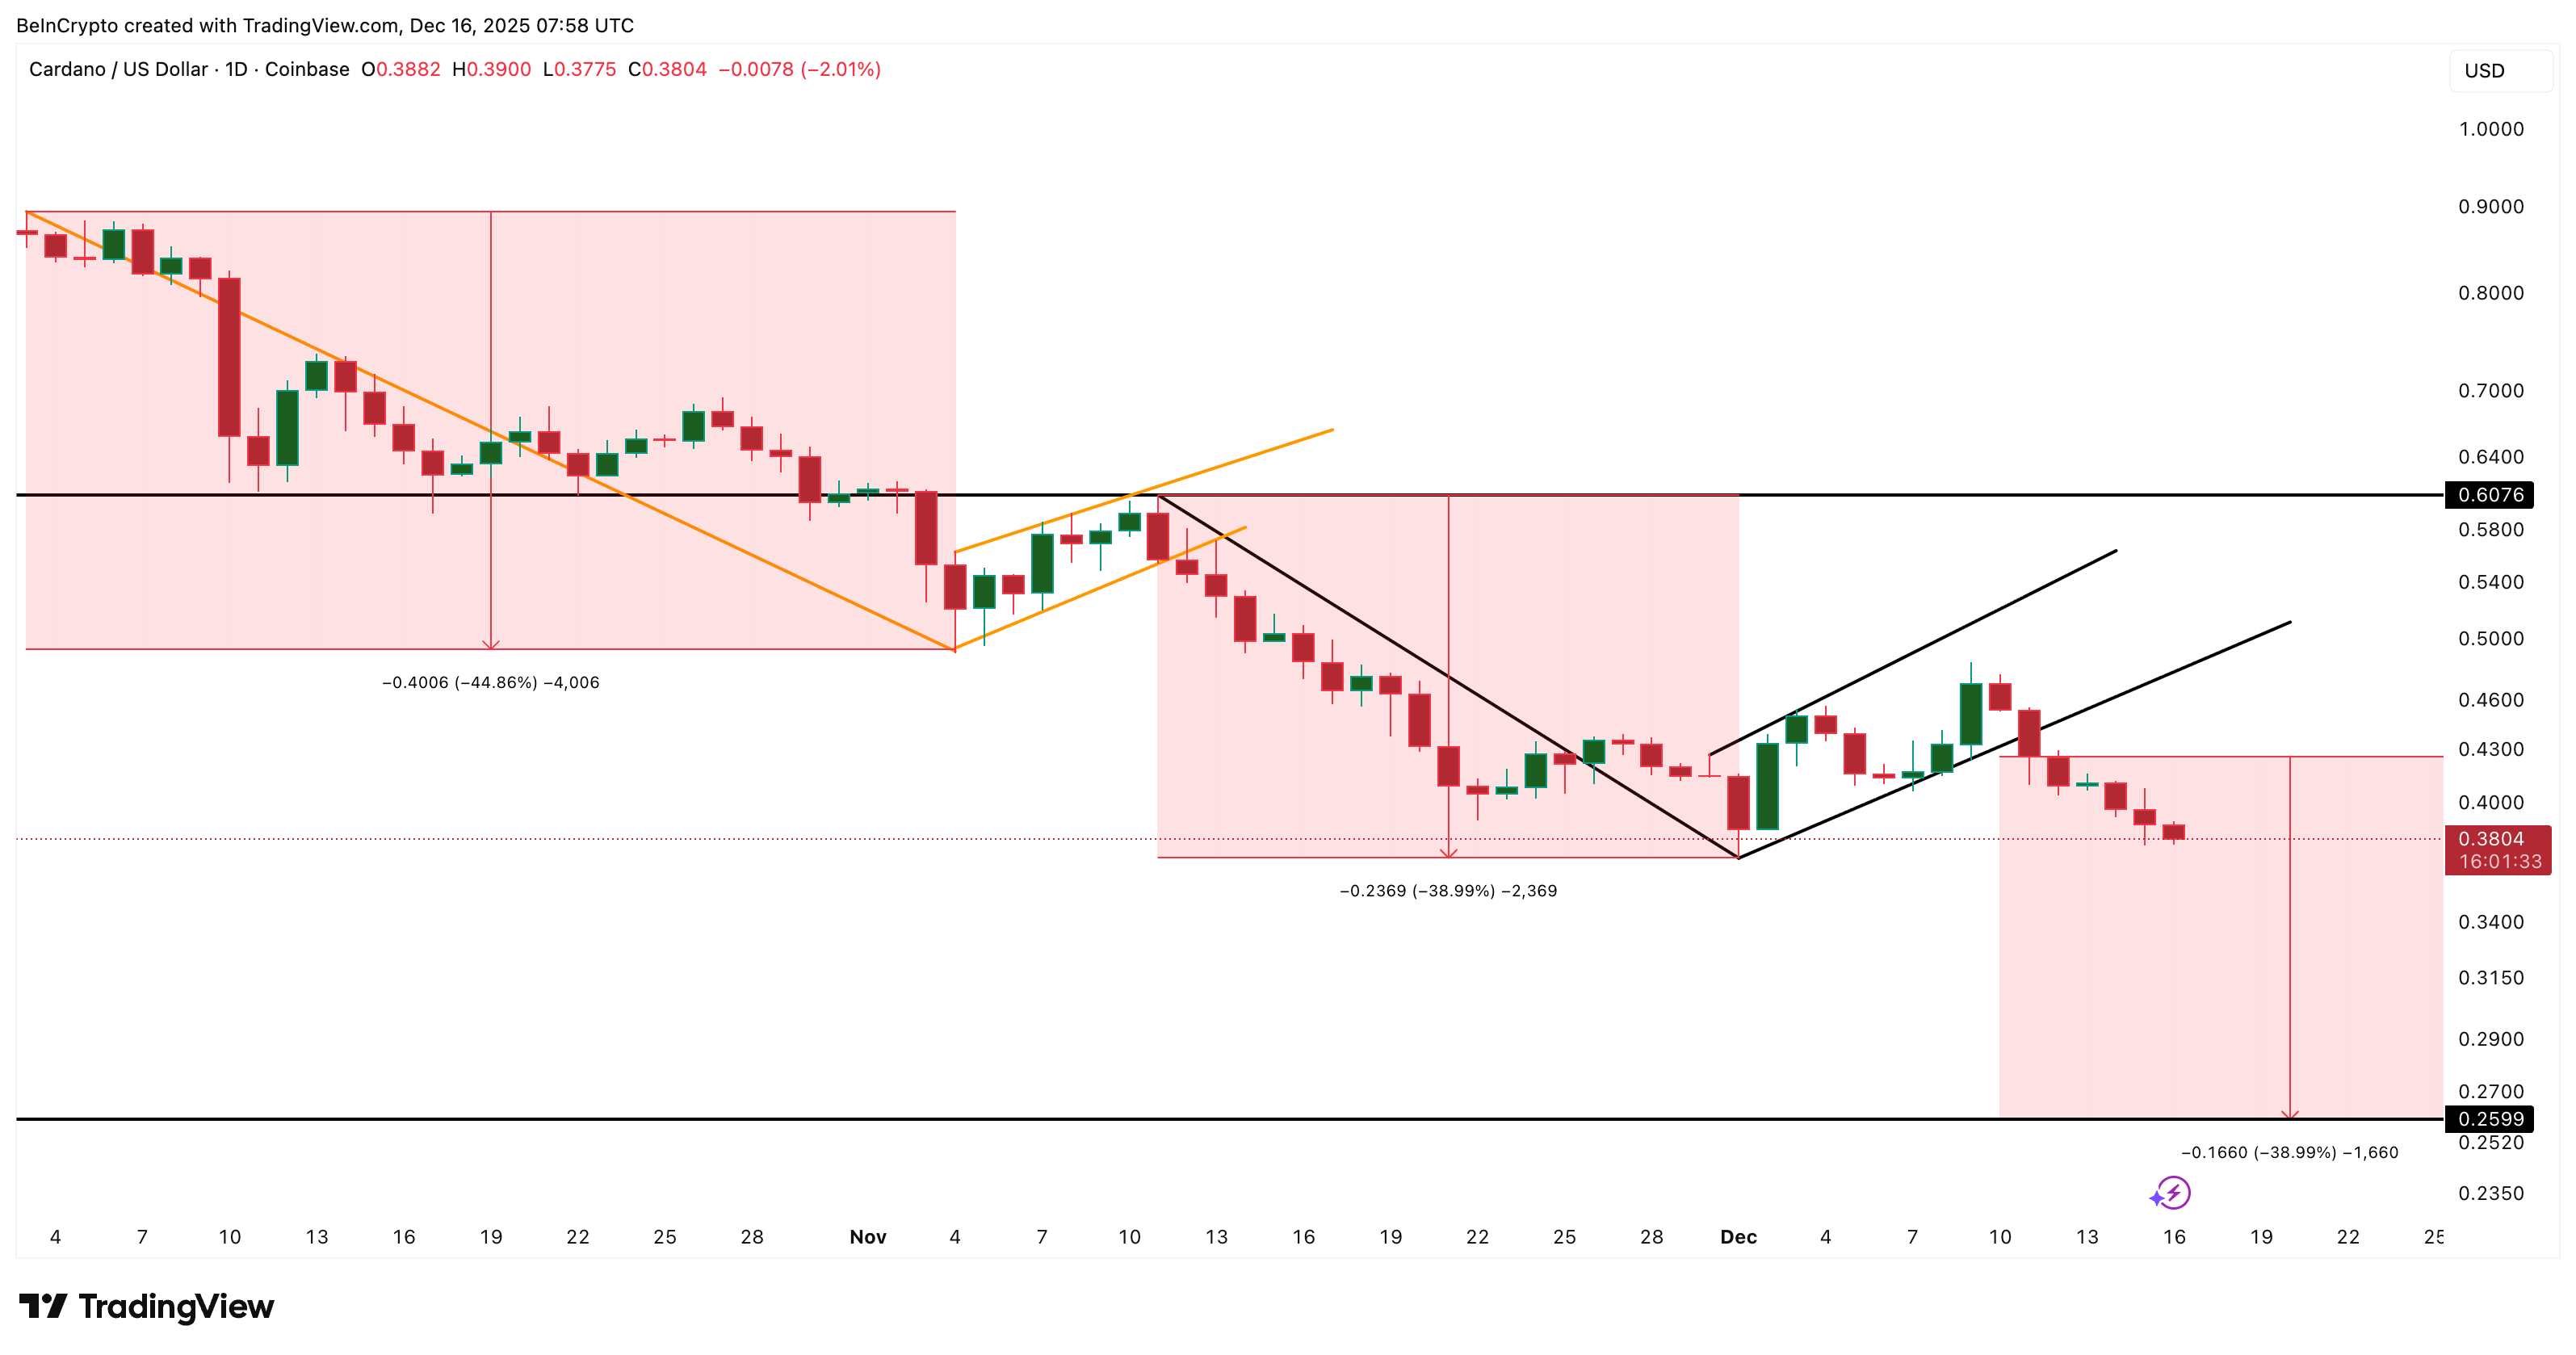
When markets print repeated bearish continuation patterns without meaningful recovery, it signals sustained seller control rather than panic selling. If the current breakdown follows the same measured-move logic as the first, downside targets begin clustering near the $0.25 zone.


Why This Weakness Itself Could Limit Further Damage

Despite the bearish structure, there are two factors that slightly soften the downside risk.

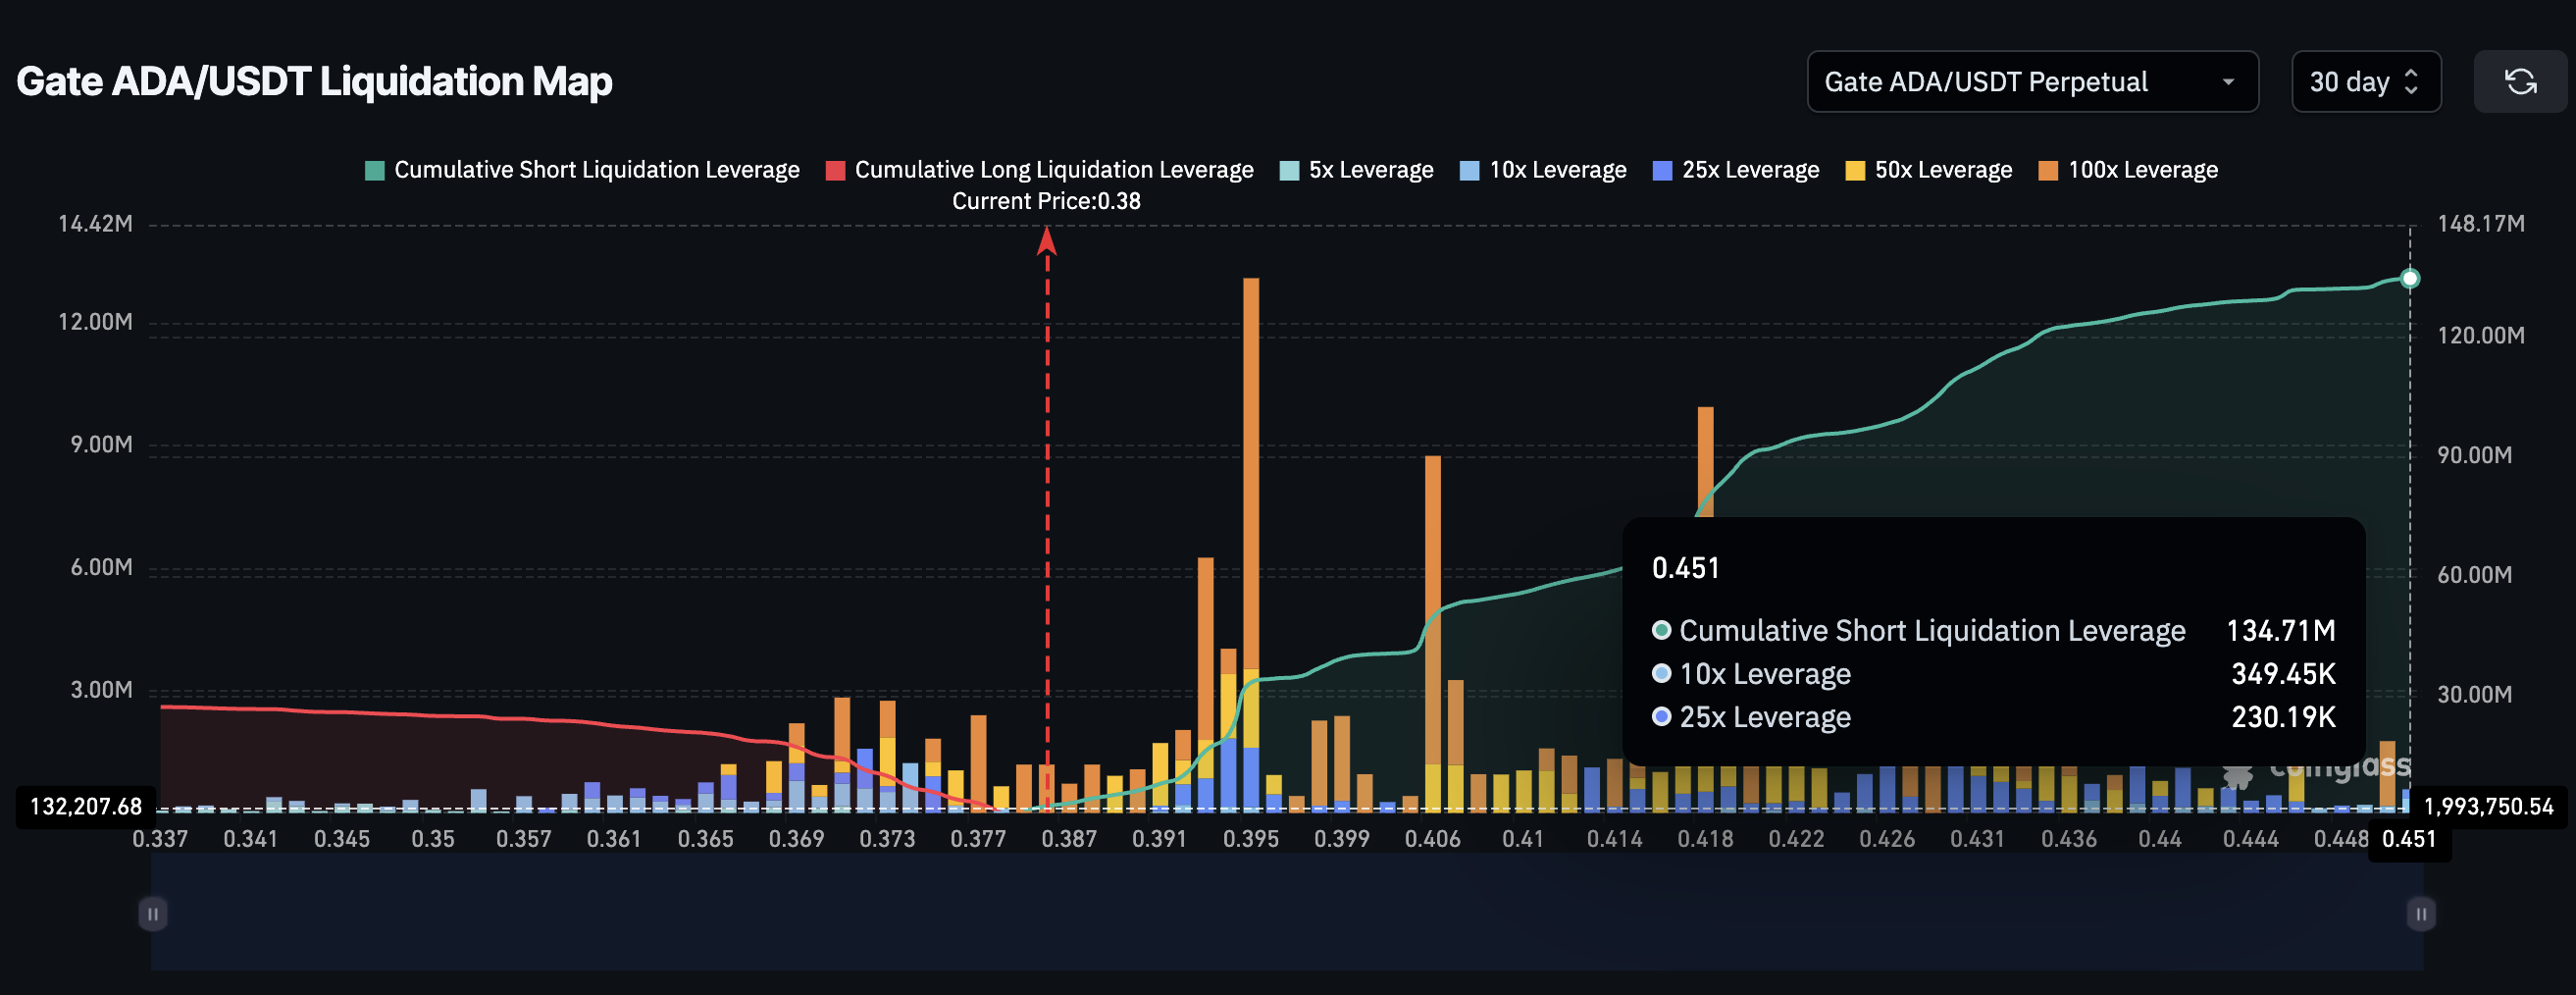
First, derivatives positioning is already skewed heavily bearish. Gate’s liquidation data shows long leverage is thin, with only about $27 million in long positions, while short exposure sits near $135 million, 5x more. Most long liquidation clusters end around $0.36, meaning forced selling pressure drops sharply at that level. Fewer crowded longs reduces the chance of a liquidation cascade.

ADA Liquidation Map
ADA Liquidation Map: Coinglass

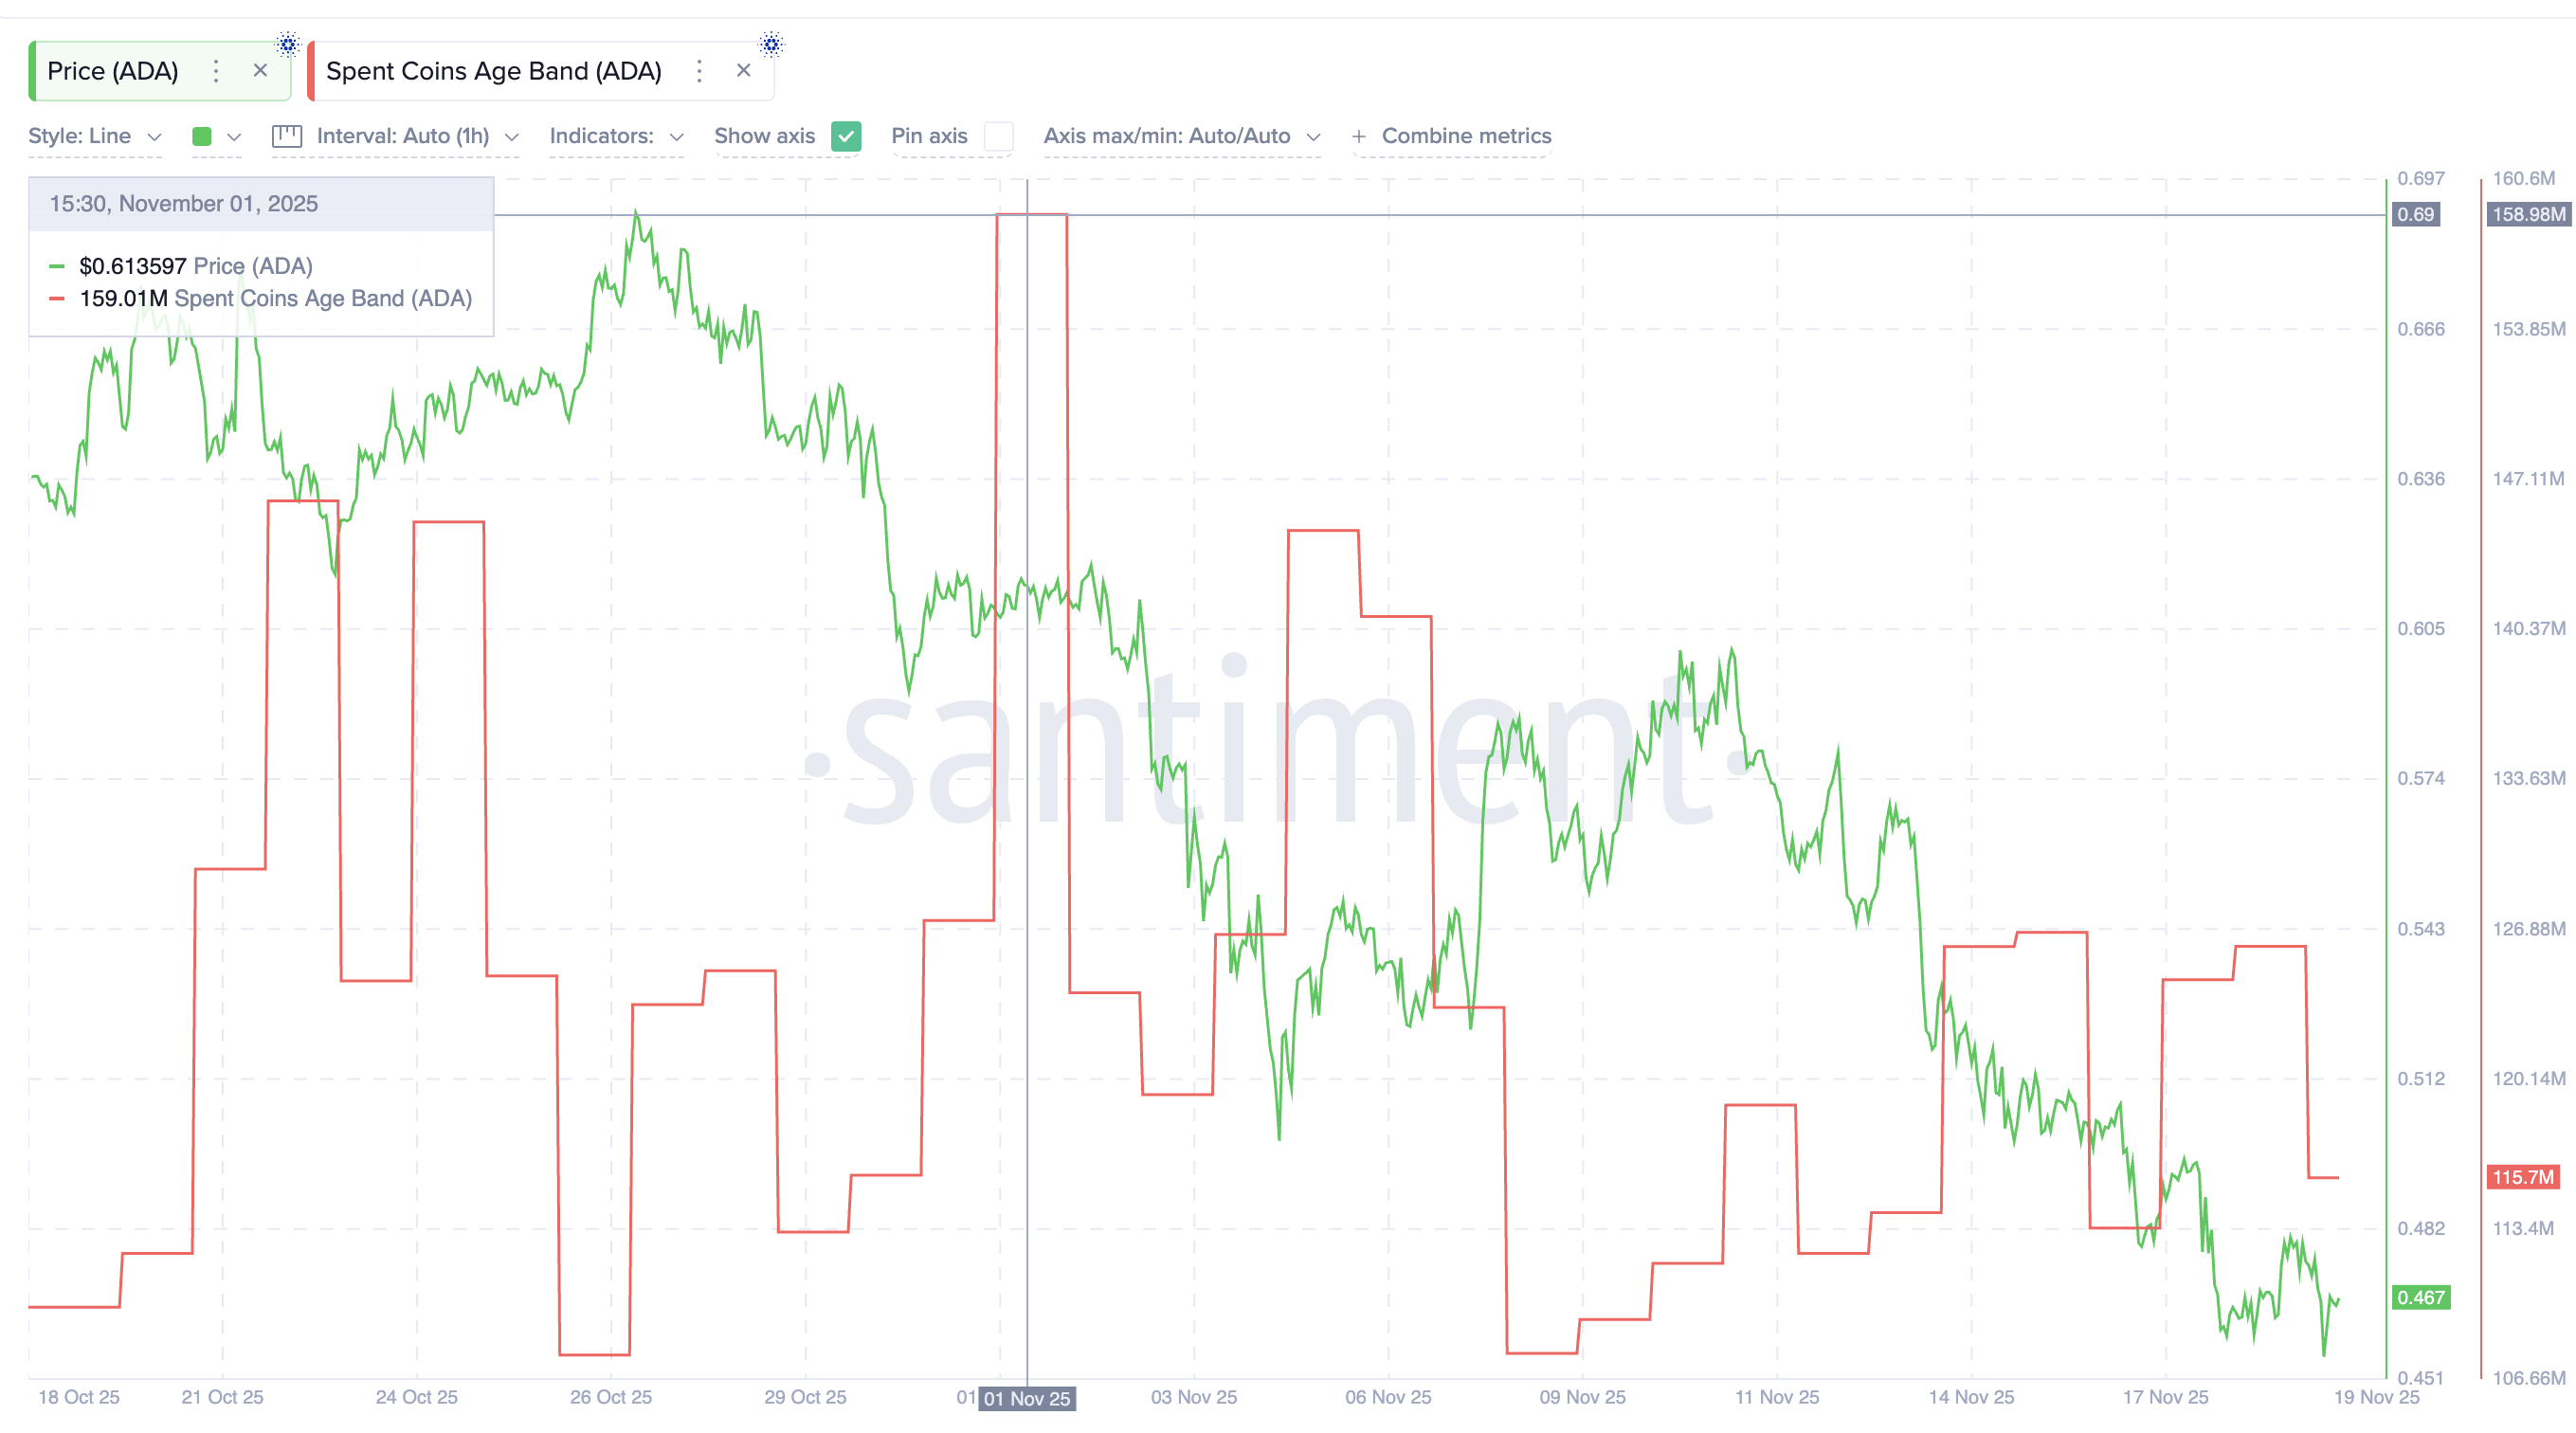
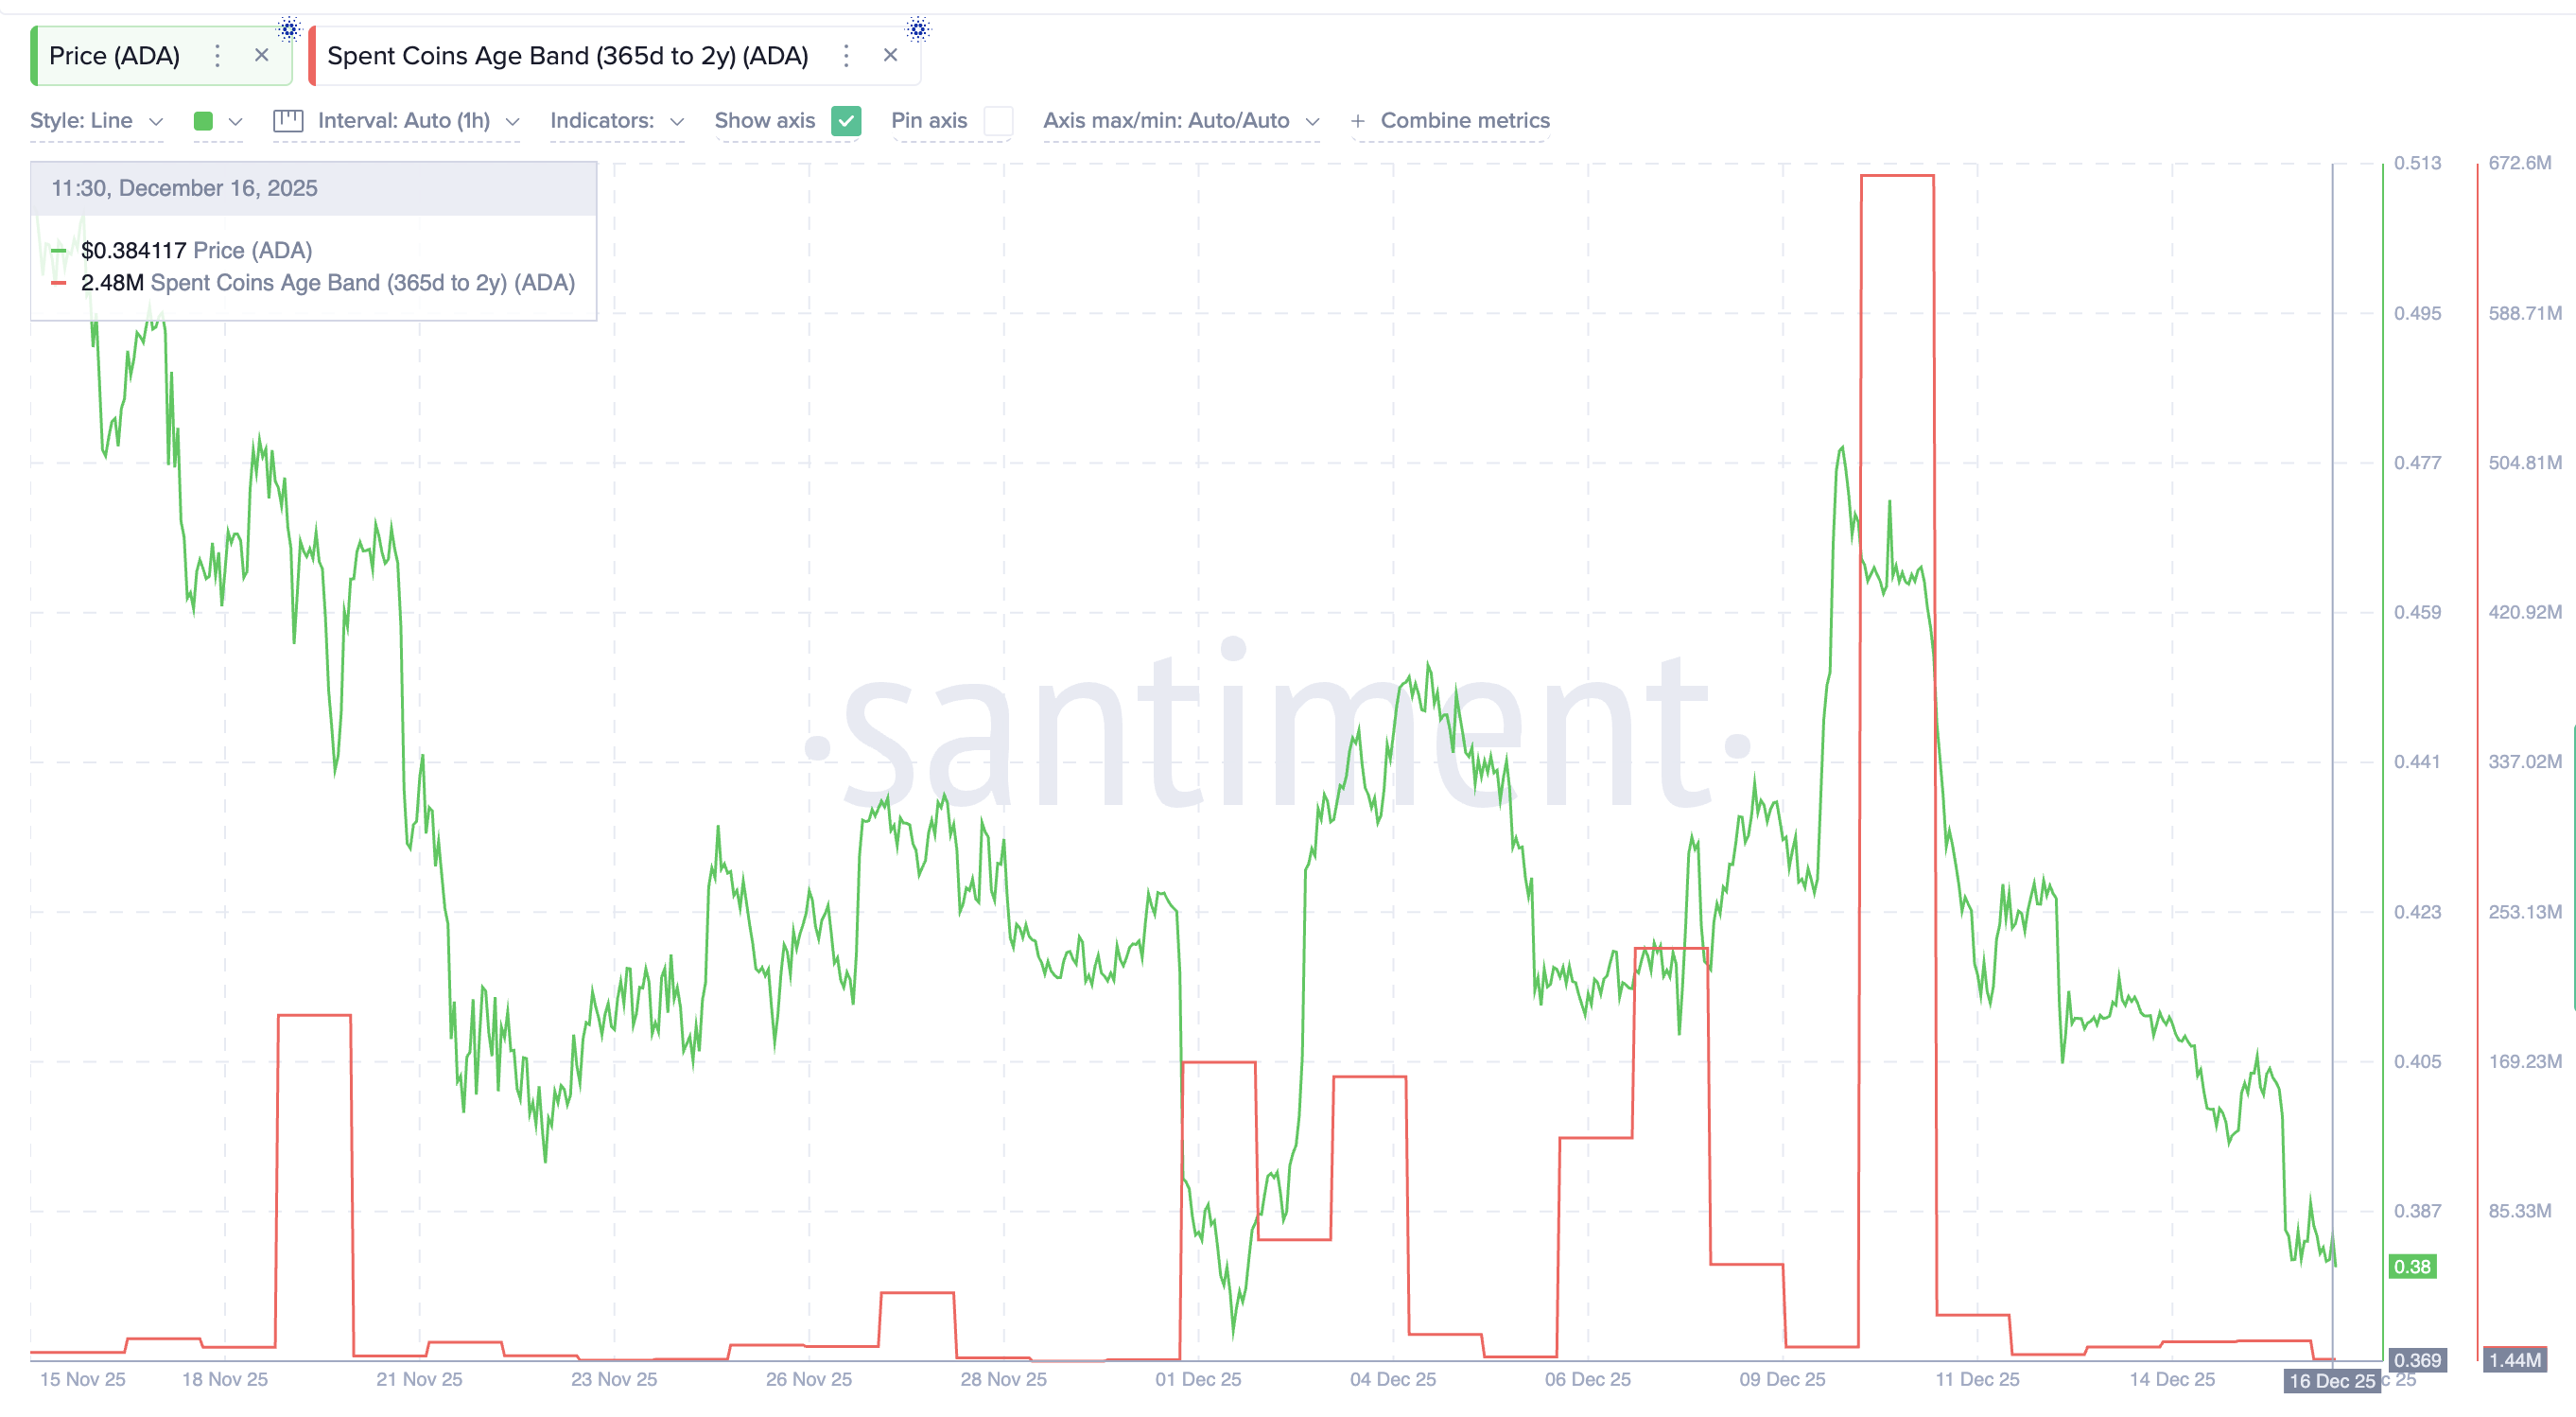
Second, long-term holder behavior has stabilized. The 1-year-to-2-year cohort, often viewed as higher-conviction holders, has sharply reduced spending, as seen via the Spent Coin metric, which groups coin movements by cohorts.

Coins moved by this group fell from 666.24 million ADA to just 2.48 million ADA since December 10, a decline of almost 99.6%. That suggests selling pressure from committed holders is drying up, even as the price remains weak.

Spent Coins Go Down
Spent Coins Go Down: Santiment

In simple terms, ADA’s weakness has scared off leverage and slowed long-term selling, which can act as a temporary brake during broader market stress.


Key ADA Price Levels to Watch

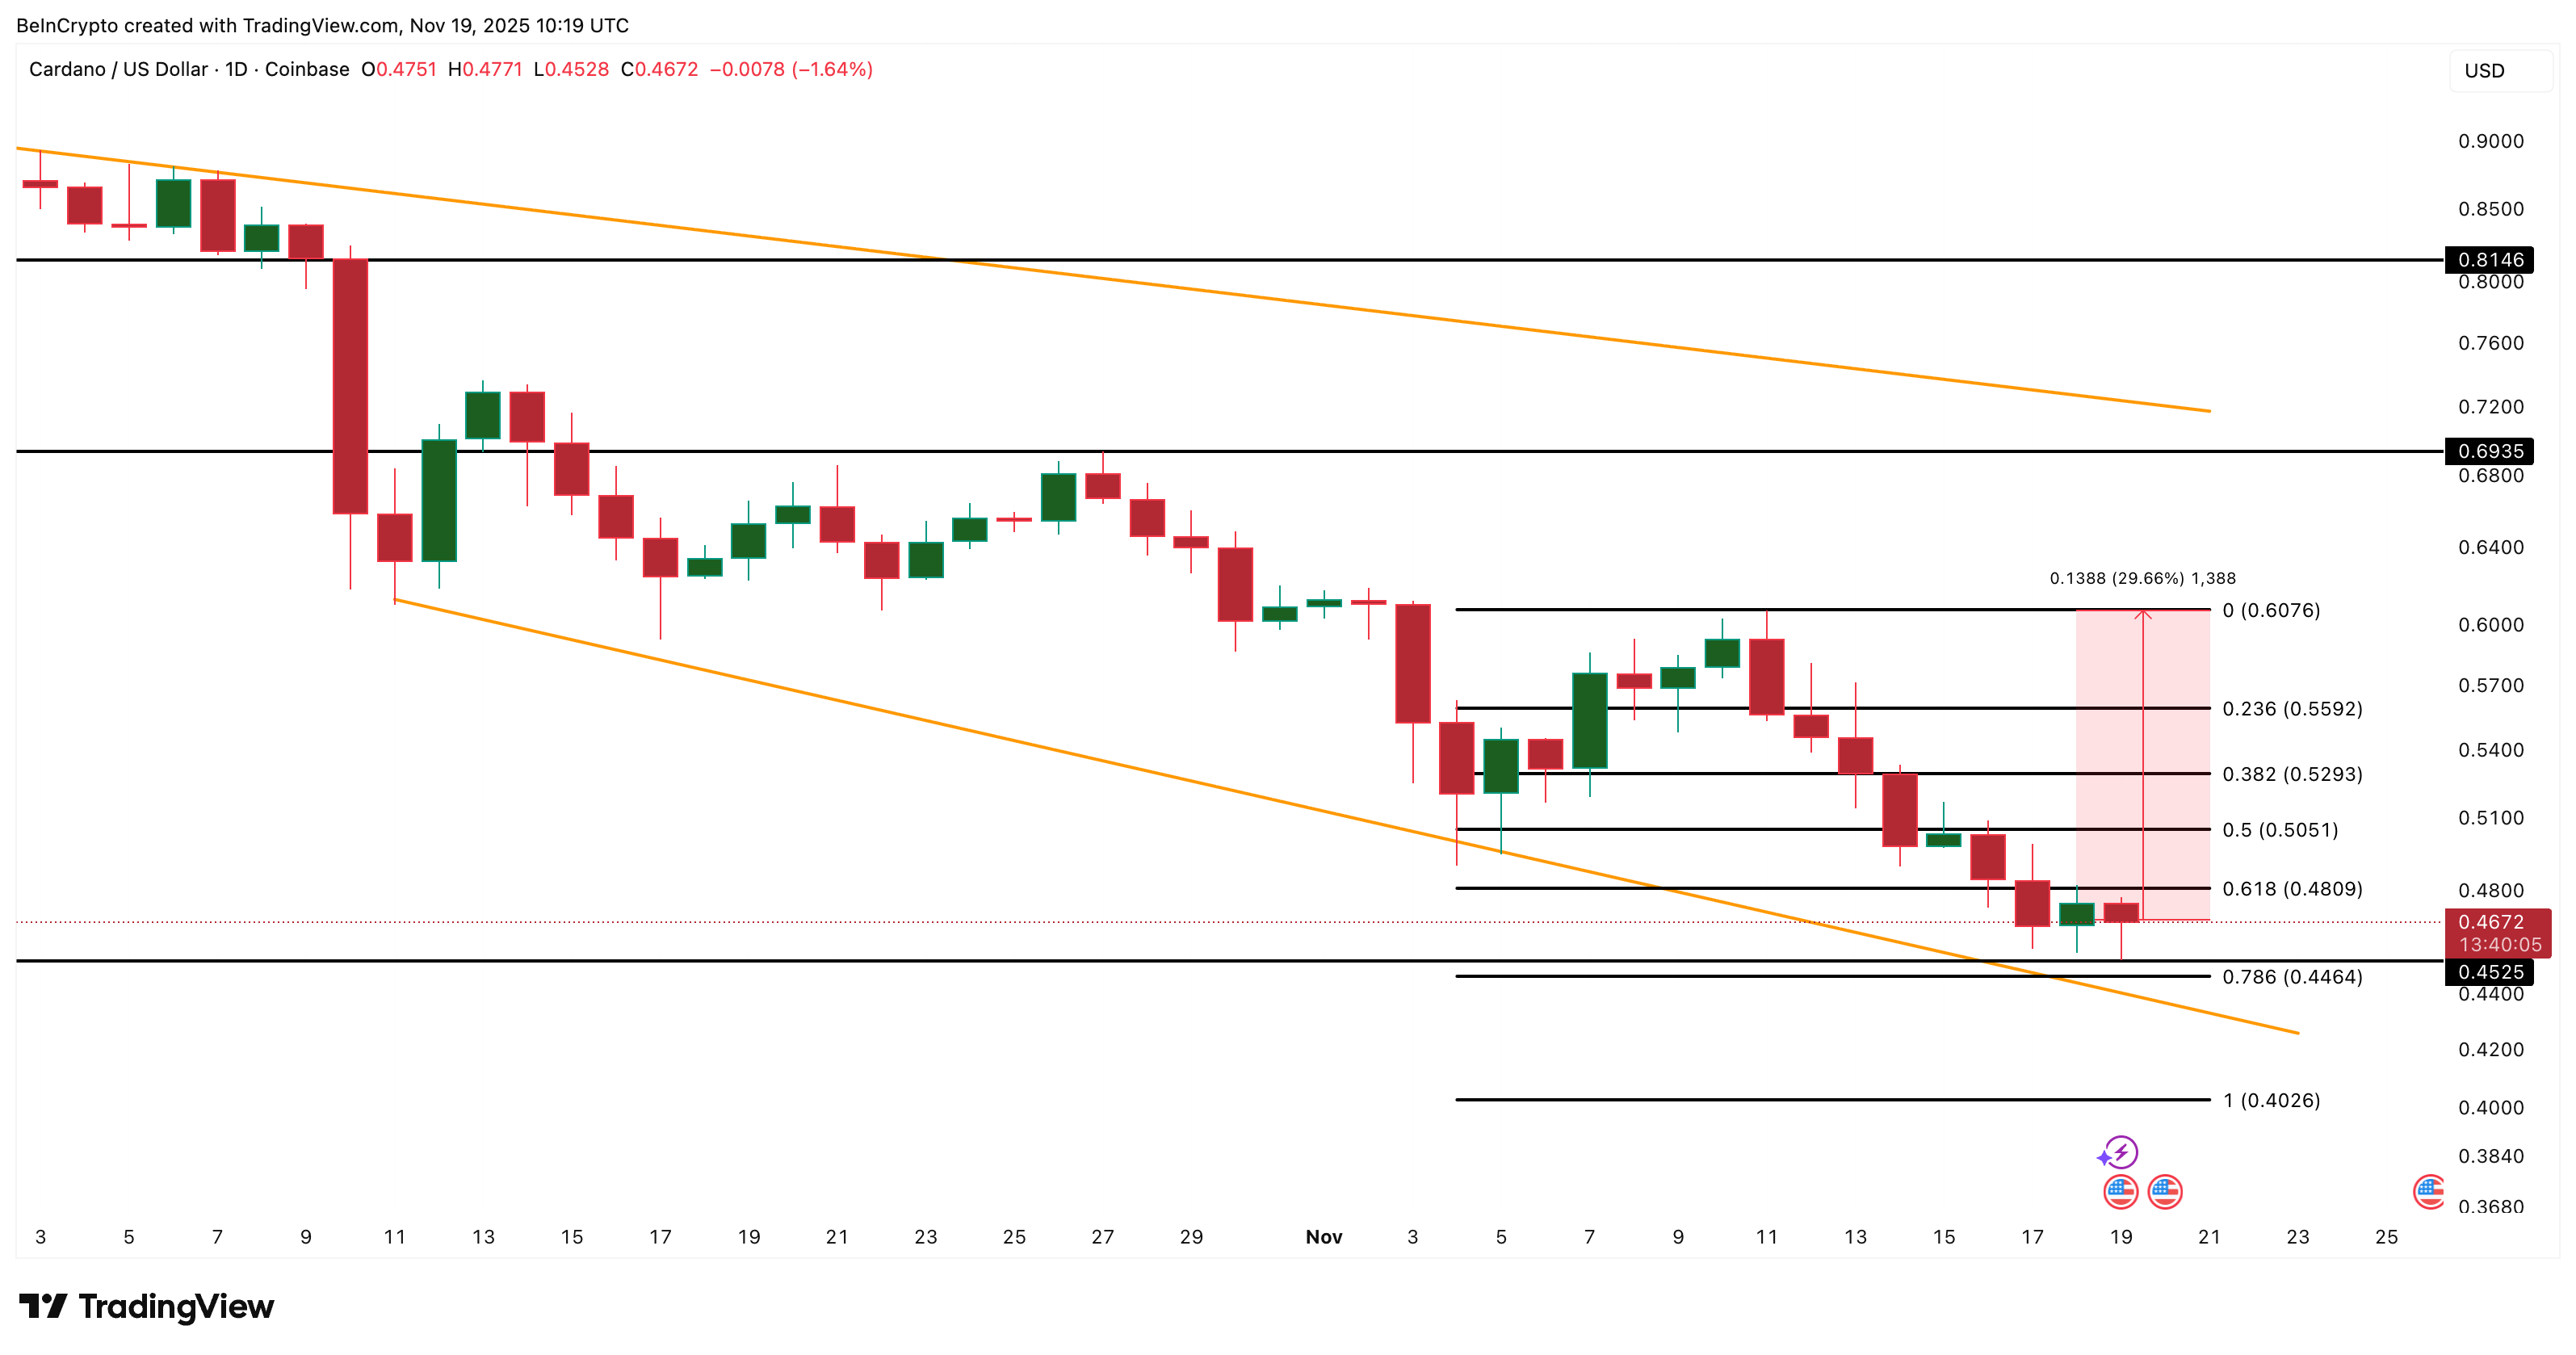
The Cardano price chart remains fragile. $0.36 is the most important near-term support. The same level is highlighted by the liquidation map shared earlier.

A clean break below it opens the door to $0.33, and from there, the measured breakdown target near $0.25 comes into focus.

For any bullish reset, ADA would need to reclaim $0.48. Without that, rallies remain corrective, not trend-changing.

Cardano Price Analysis
Cardano Price Analysis: TradingView

For now, Cardano sits in a dangerous spot.

Two breakdowns in two months define the trend. Weakness itself may slow the fall; however, unless the structure improves, the risk of a $0.25 test cannot be ignored.

The post Cardano Price Sends a Clear Warning After Back-to-Back Breakdowns— $0.25 Now in Focus appeared first on BeInCrypto.

  •  

3 Reasons Why A Cardano Price Rebound Looks Likely

Cardano has been one of the weakest large-cap coins this month. The Cardano price has dropped almost 30% over the past 30 days and nearly 26% since November 11. This drop pushed ADA toward the lower support of its falling wedge, a structure that usually leans bullish but can turn long-term bearish if broken.

Even with this pressure, three important indicators have turned positive just as Cardano sits on its last major support.


Early Signs of Buyer Strength Near Last Support

Two indicators that track buying strength and volume behavior have shifted at the same time, right as the Cardano price reached the critical $0.45 support.

The CMF (Chaikin Money Flow) tracks whether money is flowing in or out based on price and volume. It had been falling since November 10 and even dropped under zero during Cardano’s sharp correction. But from November 16 to November 19, CMF formed a higher high while the price made a lower high. This is a bullish divergence because CMF rising while price weakens shows stronger inflows than the chart reflects.

Cardano CMF Shows Divergence
Cardano CMF Shows Divergence: TradingView

Want more token insights like this? Sign up for Editor Harsh Notariya’s Daily Crypto Newsletter here.

On-Balance Volume is a simple way to see if buyers or sellers have been more active. OBV had been stuck under a downward trend line for weeks, matching the steady decline in Cardano price. But as ADA touched the $0.45 zone, OBV pushed above this trend line for the first time in a while. This usually shows buyers starting to participate again before the ADA price reacts.

Volume Support Comes Back
Volume Support Comes Back: TradingView

When CMF and OBV improve together near a major support, it often means the market may be preparing for a short-term recovery attempt. But the Cardano price still needs validation from its on-chain behavior.


Holder Behavior Shows Strong Conviction During the Drop

The Spent Coins Age Band tracks how many tokens from different wallet age groups are being moved. When many coins move at once, it often signals fear or heavy selling. When token movement drops while prices fall, it usually shows conviction from long-term holders.

On November 1, ADA saw its spent coins activity peak with the movement of 159.01 million tokens. By November 19, the metric had dropped by roughly 27%, even though the price kept falling.

Fewer ADA Coins Moving
Fewer ADA Coins Moving: Santiment

This means far fewer tokens moved during the correction. When token movement drops this sharply during a sell-off, it strengthens the idea that Cardano may be trying to save its trendline support rather than break below it. That’s the third reason pushing for the rebound angle.


Cardano Price Must Hold $0.45 or Risk a Breakdown

Cardano price is trading directly on the lower trend line of its falling wedge and its strongest support at $0.45–$0.44. If this zone holds on a daily close, ADA can attempt a rebound. Moving above $0.50–$0.52 would be the first sign of strength, but the real recovery begins only after Cardano retakes $0.60.

That level flips the short-term trend and sets up a retest of $0.69, which is the point where a full wedge breakout becomes possible. Crossing that level would mean that the Cardano price could turn its supposed rebound into a rally attempt.

Cardano Price Analysis
Cardano Price Analysis: TradingView

If the support fails, the structure breaks. A daily close under $0.44 opens a drop toward $0.40, with the possibility of deeper dips if market sentiment weakens further. The bullish setup becomes invalid below this zone.

The post 3 Reasons Why A Cardano Price Rebound Looks Likely appeared first on BeInCrypto.

  •