Reading view

Ethereum Price Nears Possible Breakdown — Yet A Bounce Hope Emerges

Ethereum price action is sending mixed signals. After correcting over 3% in a day, ETH is flashing early rebound signs, but downside risk has not cleared yet. The chart structure, momentum data, and on-chain cost levels all point to a narrow decision zone.

Right now, Ethereum is stuck between a possible bounce and a deeper breakdown. And the gap between those two outcomes is smaller than it looks. What’s worth noting is that the breakdown zone looms closer!

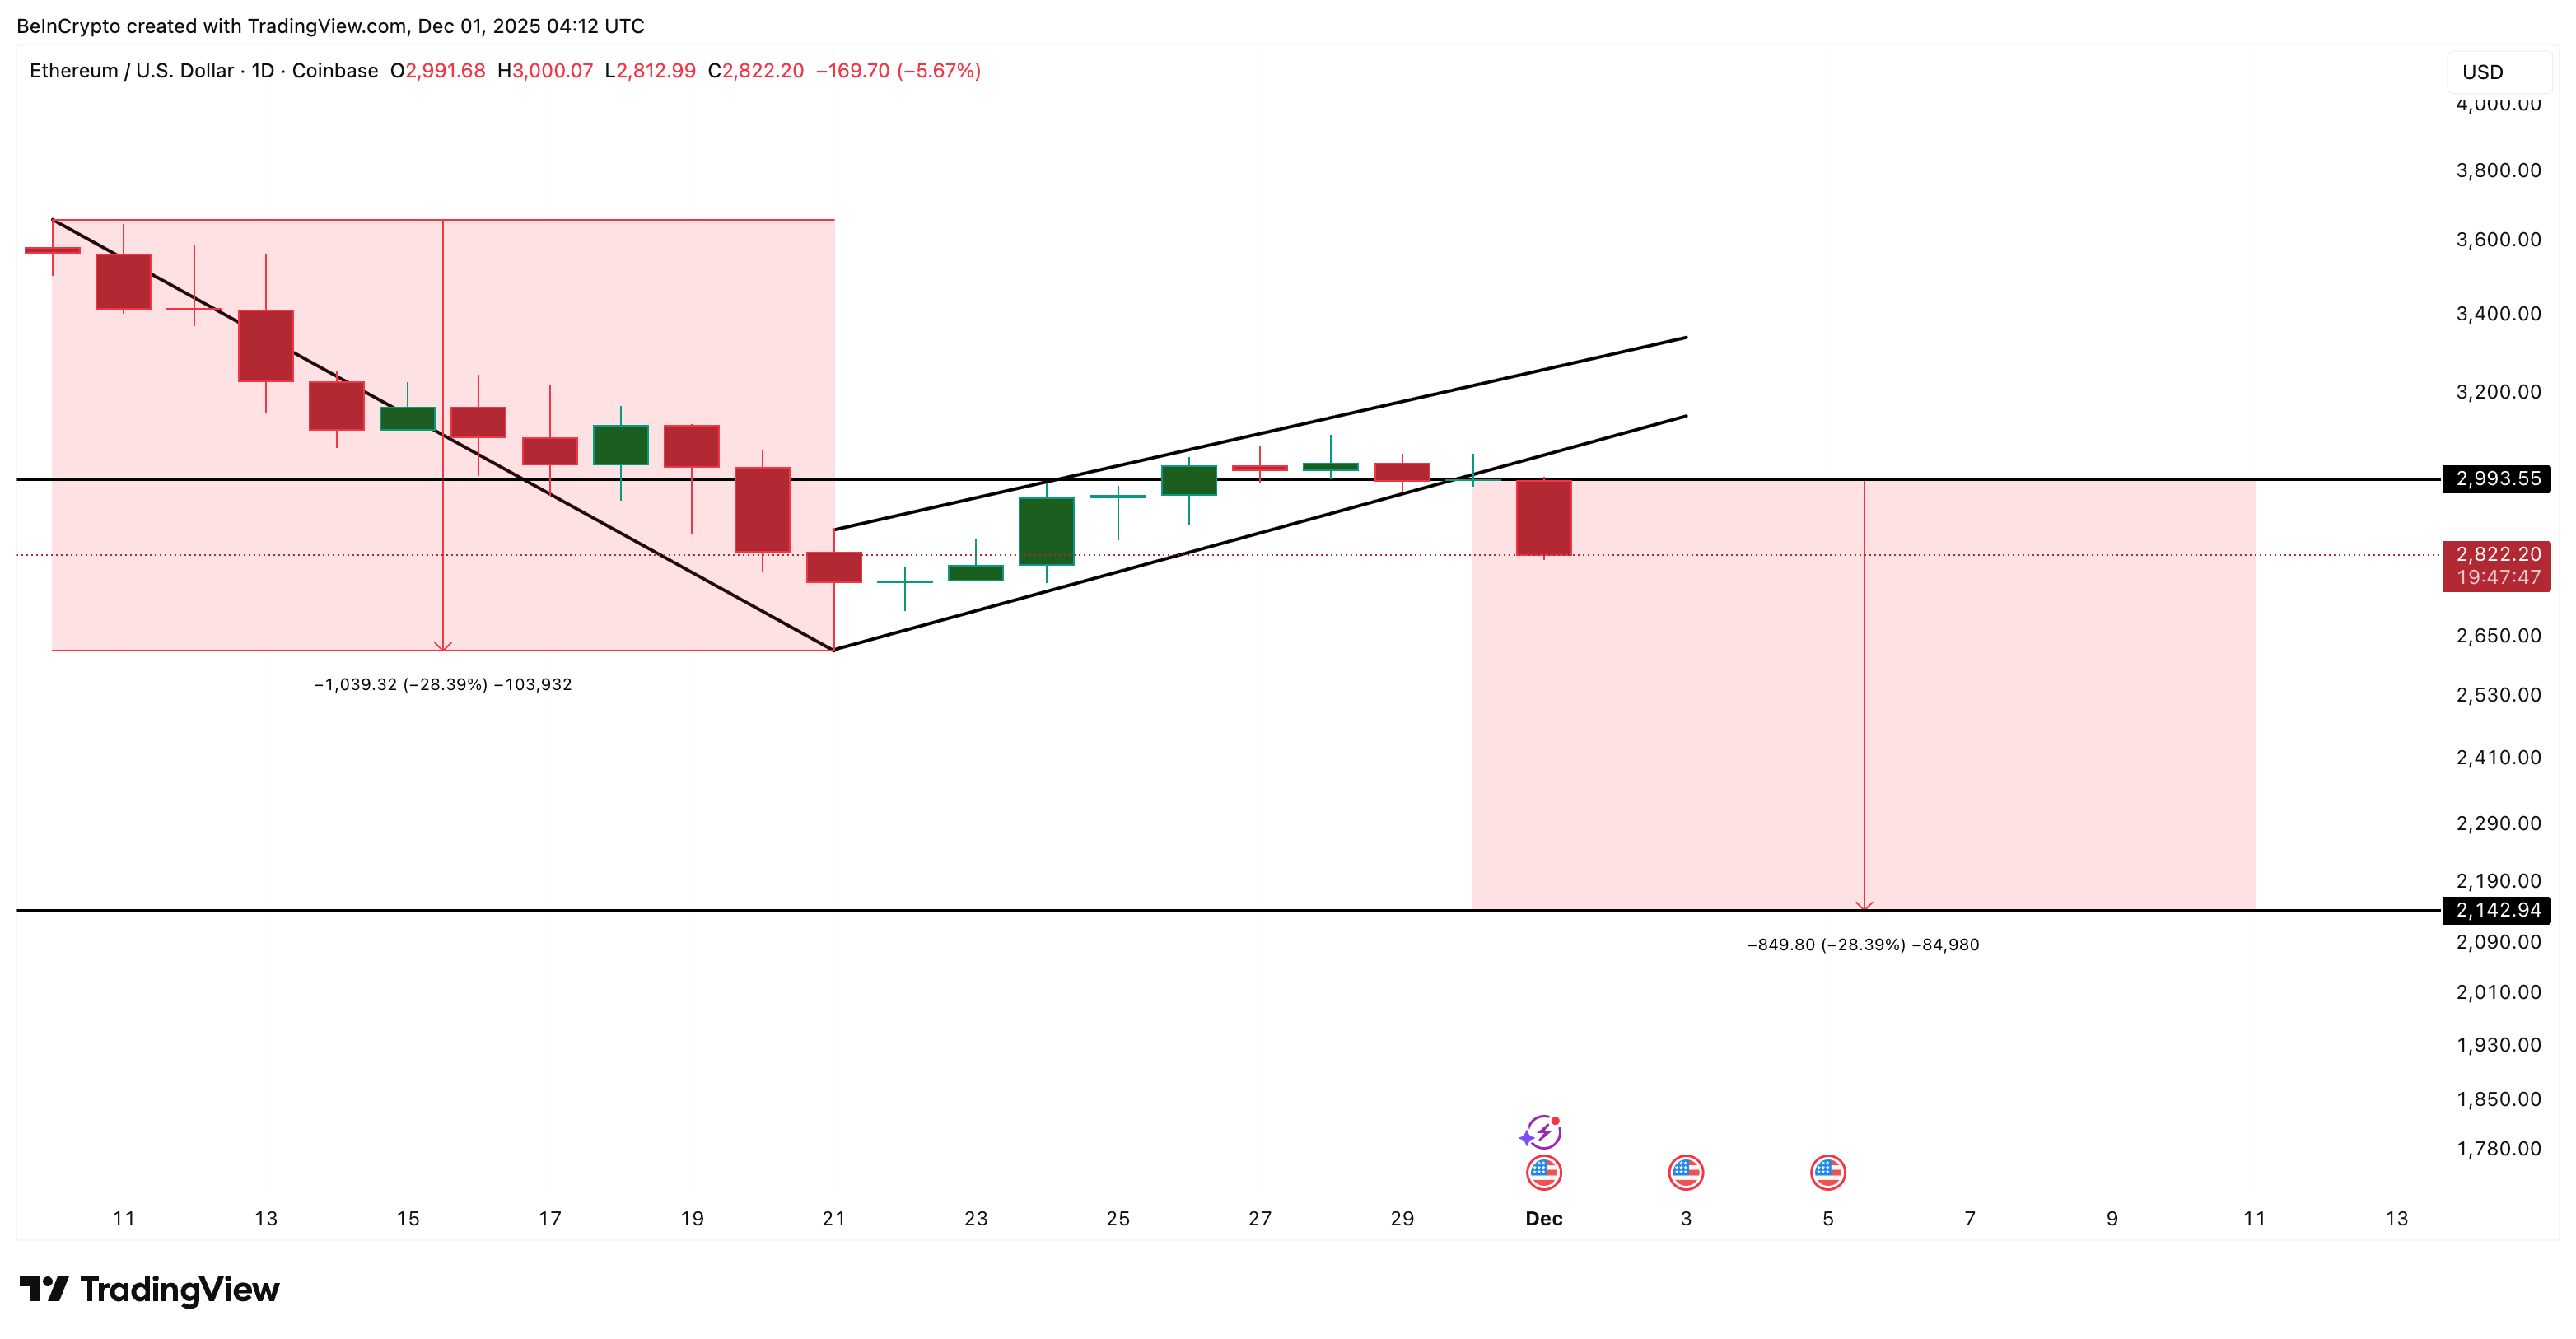
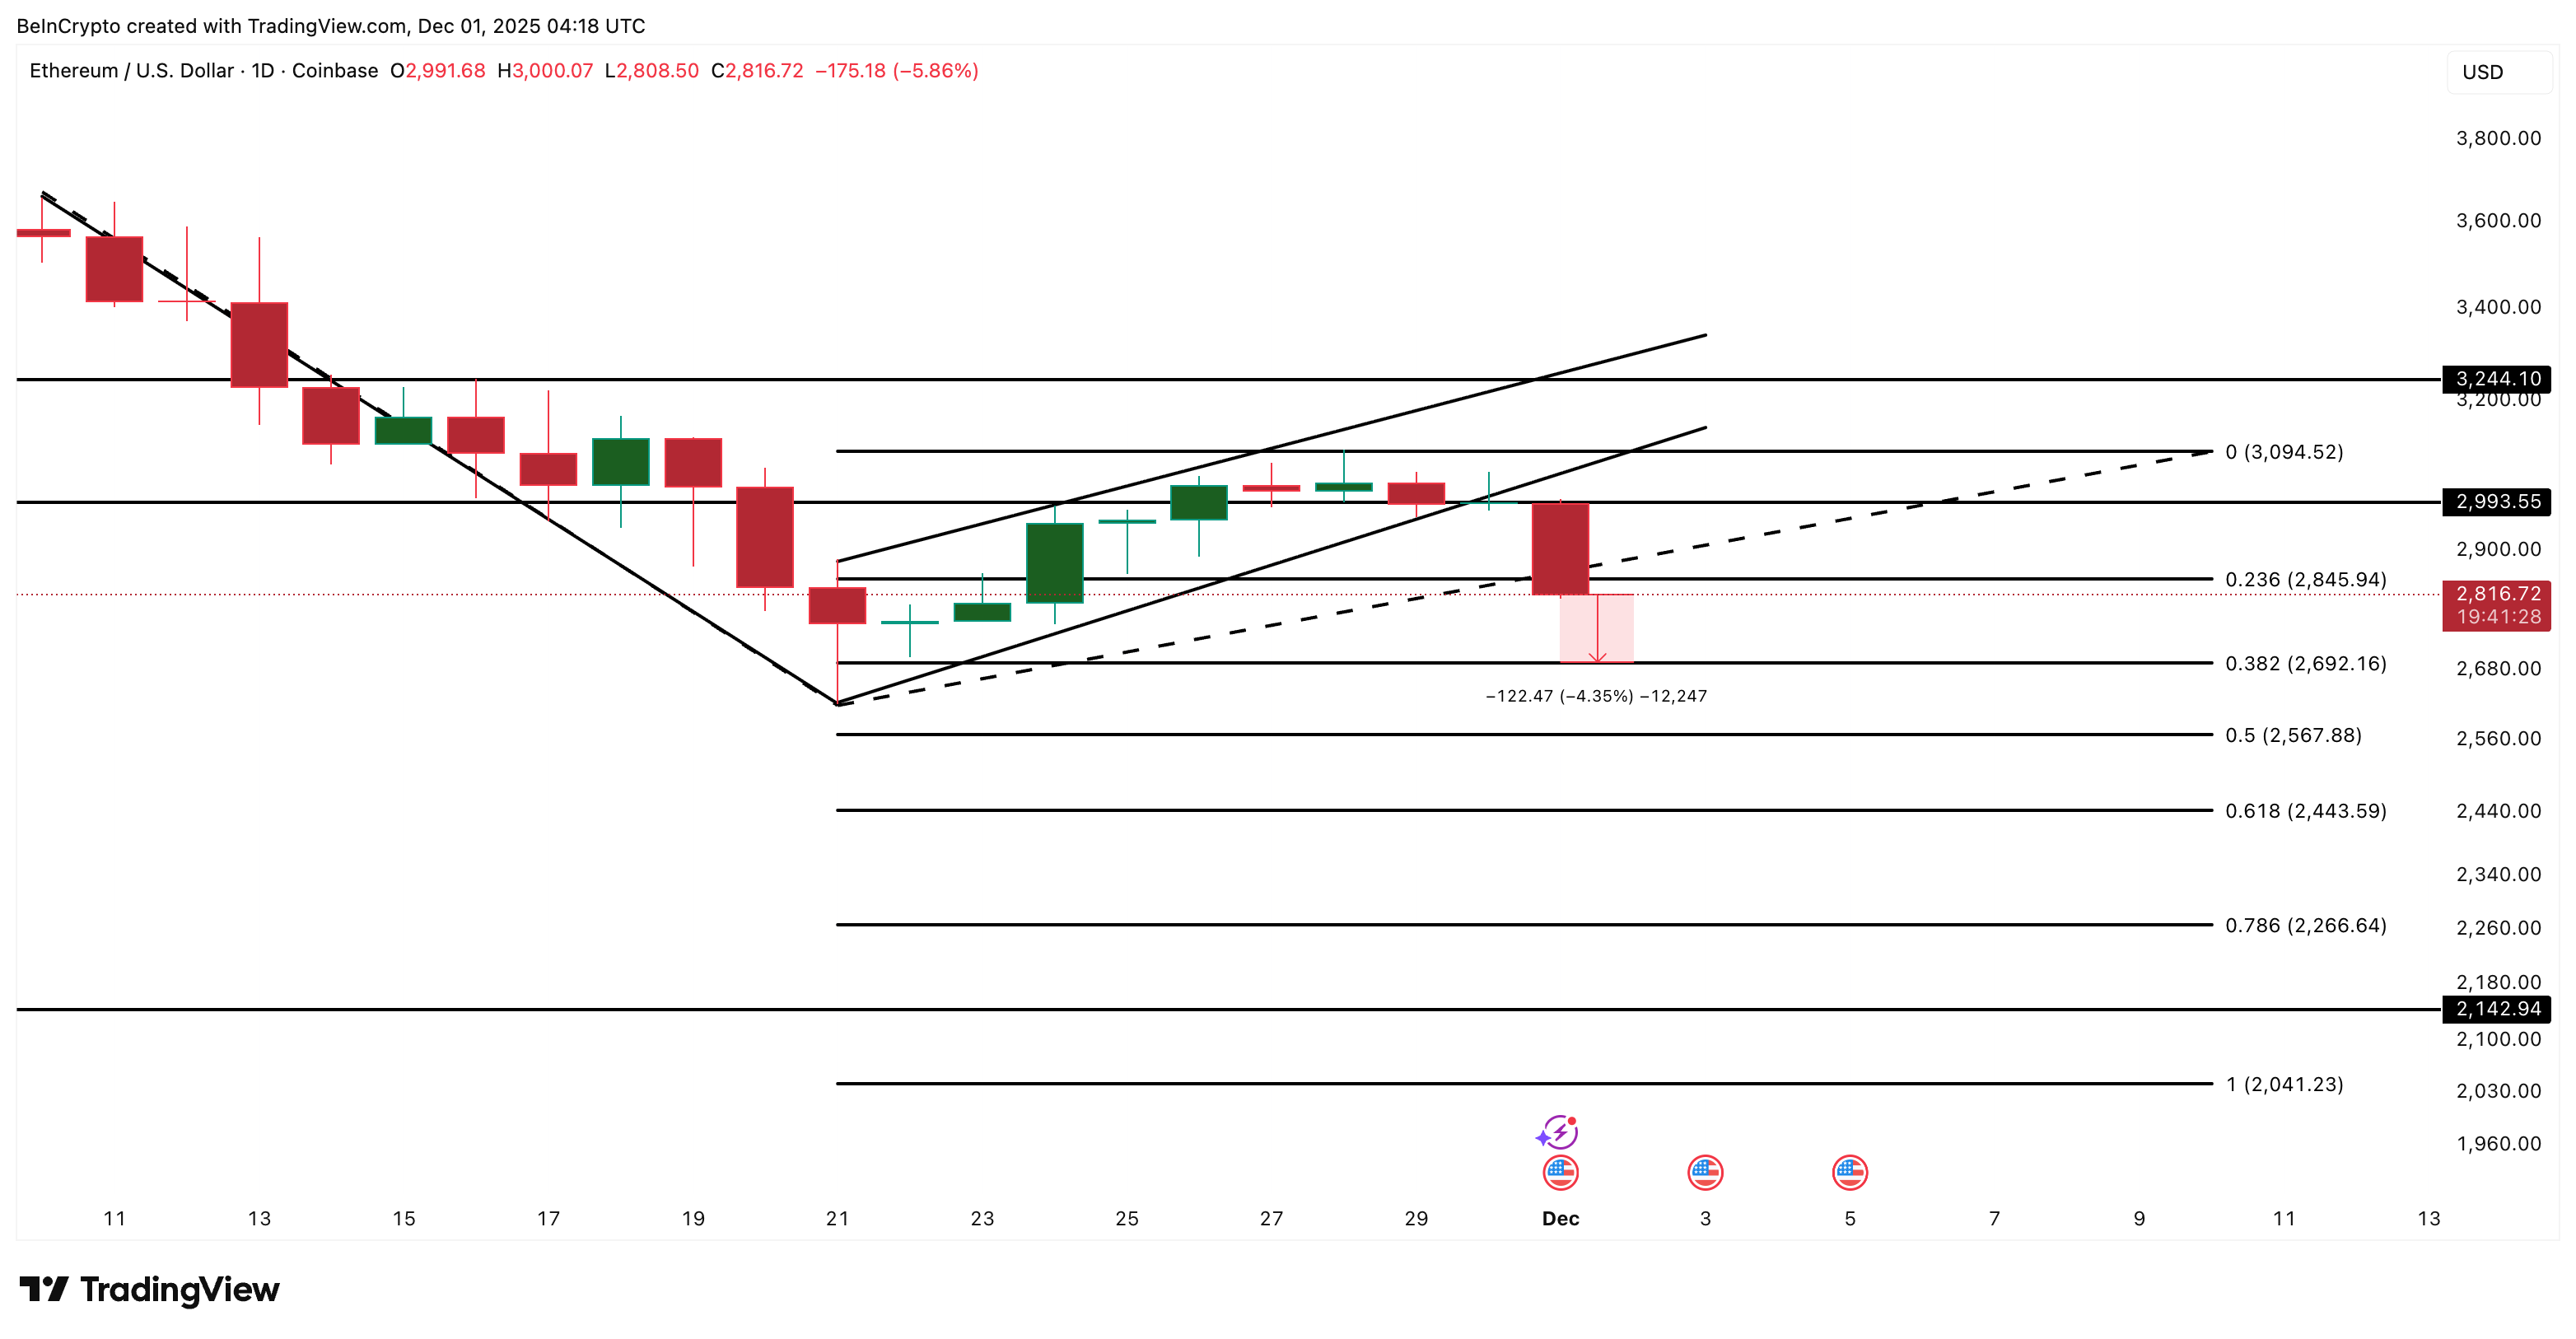
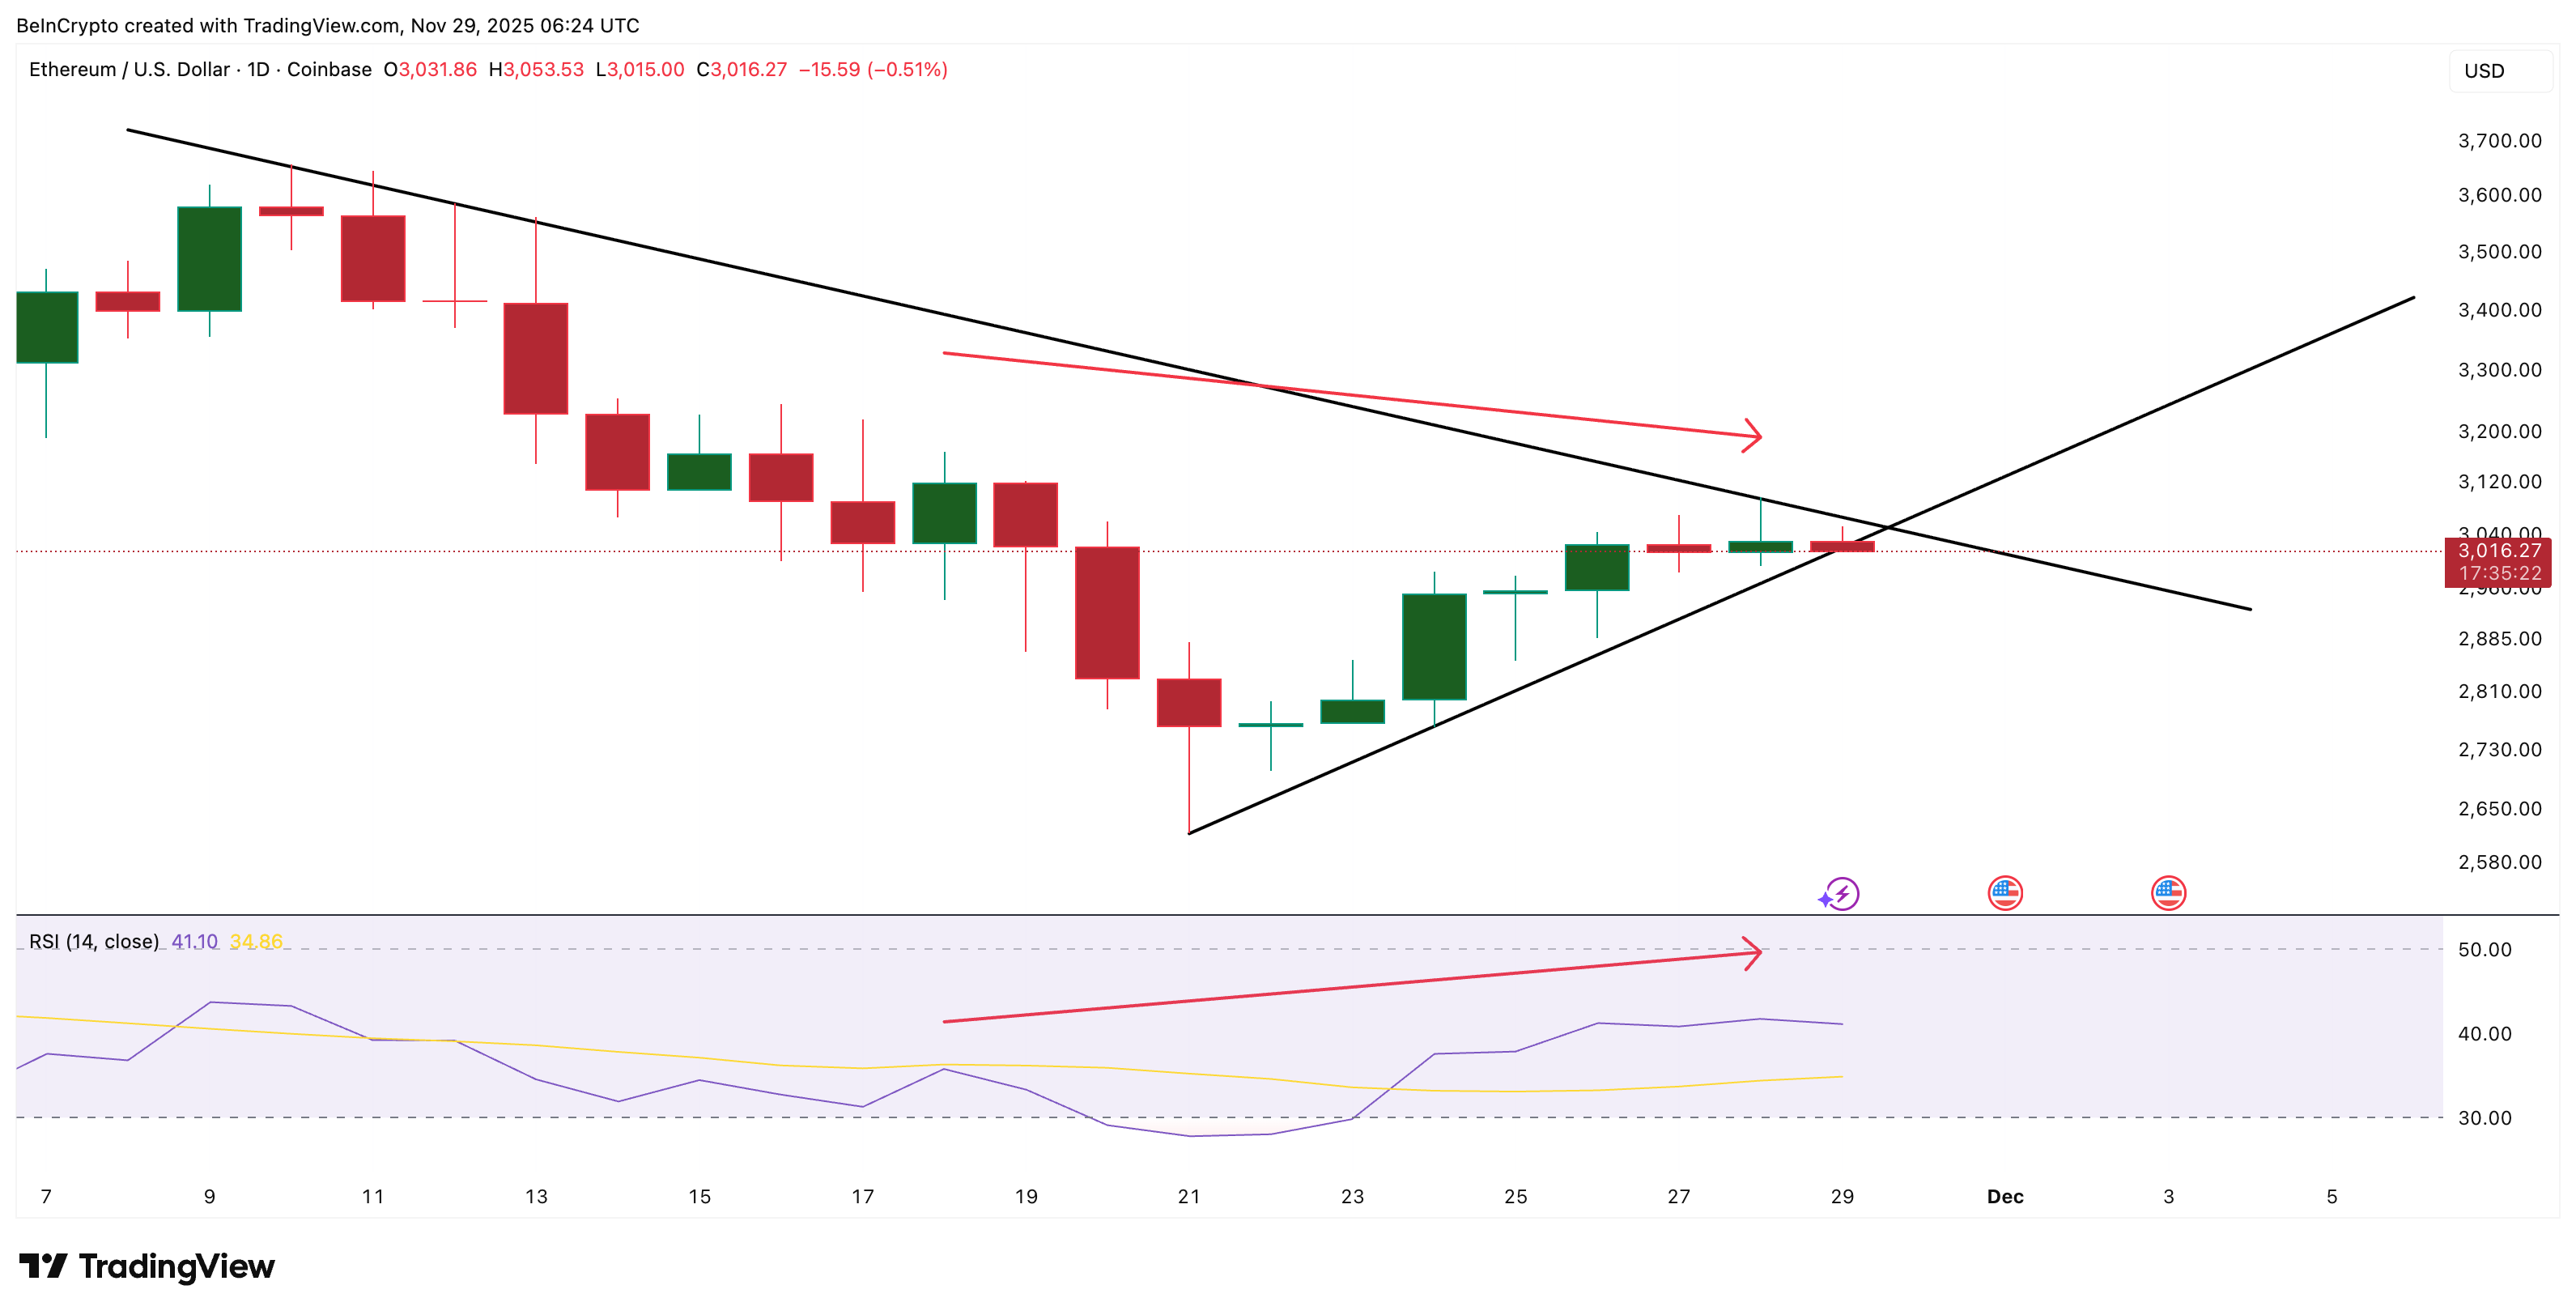
Rebound Signal Sits Inside a Tight Triangle

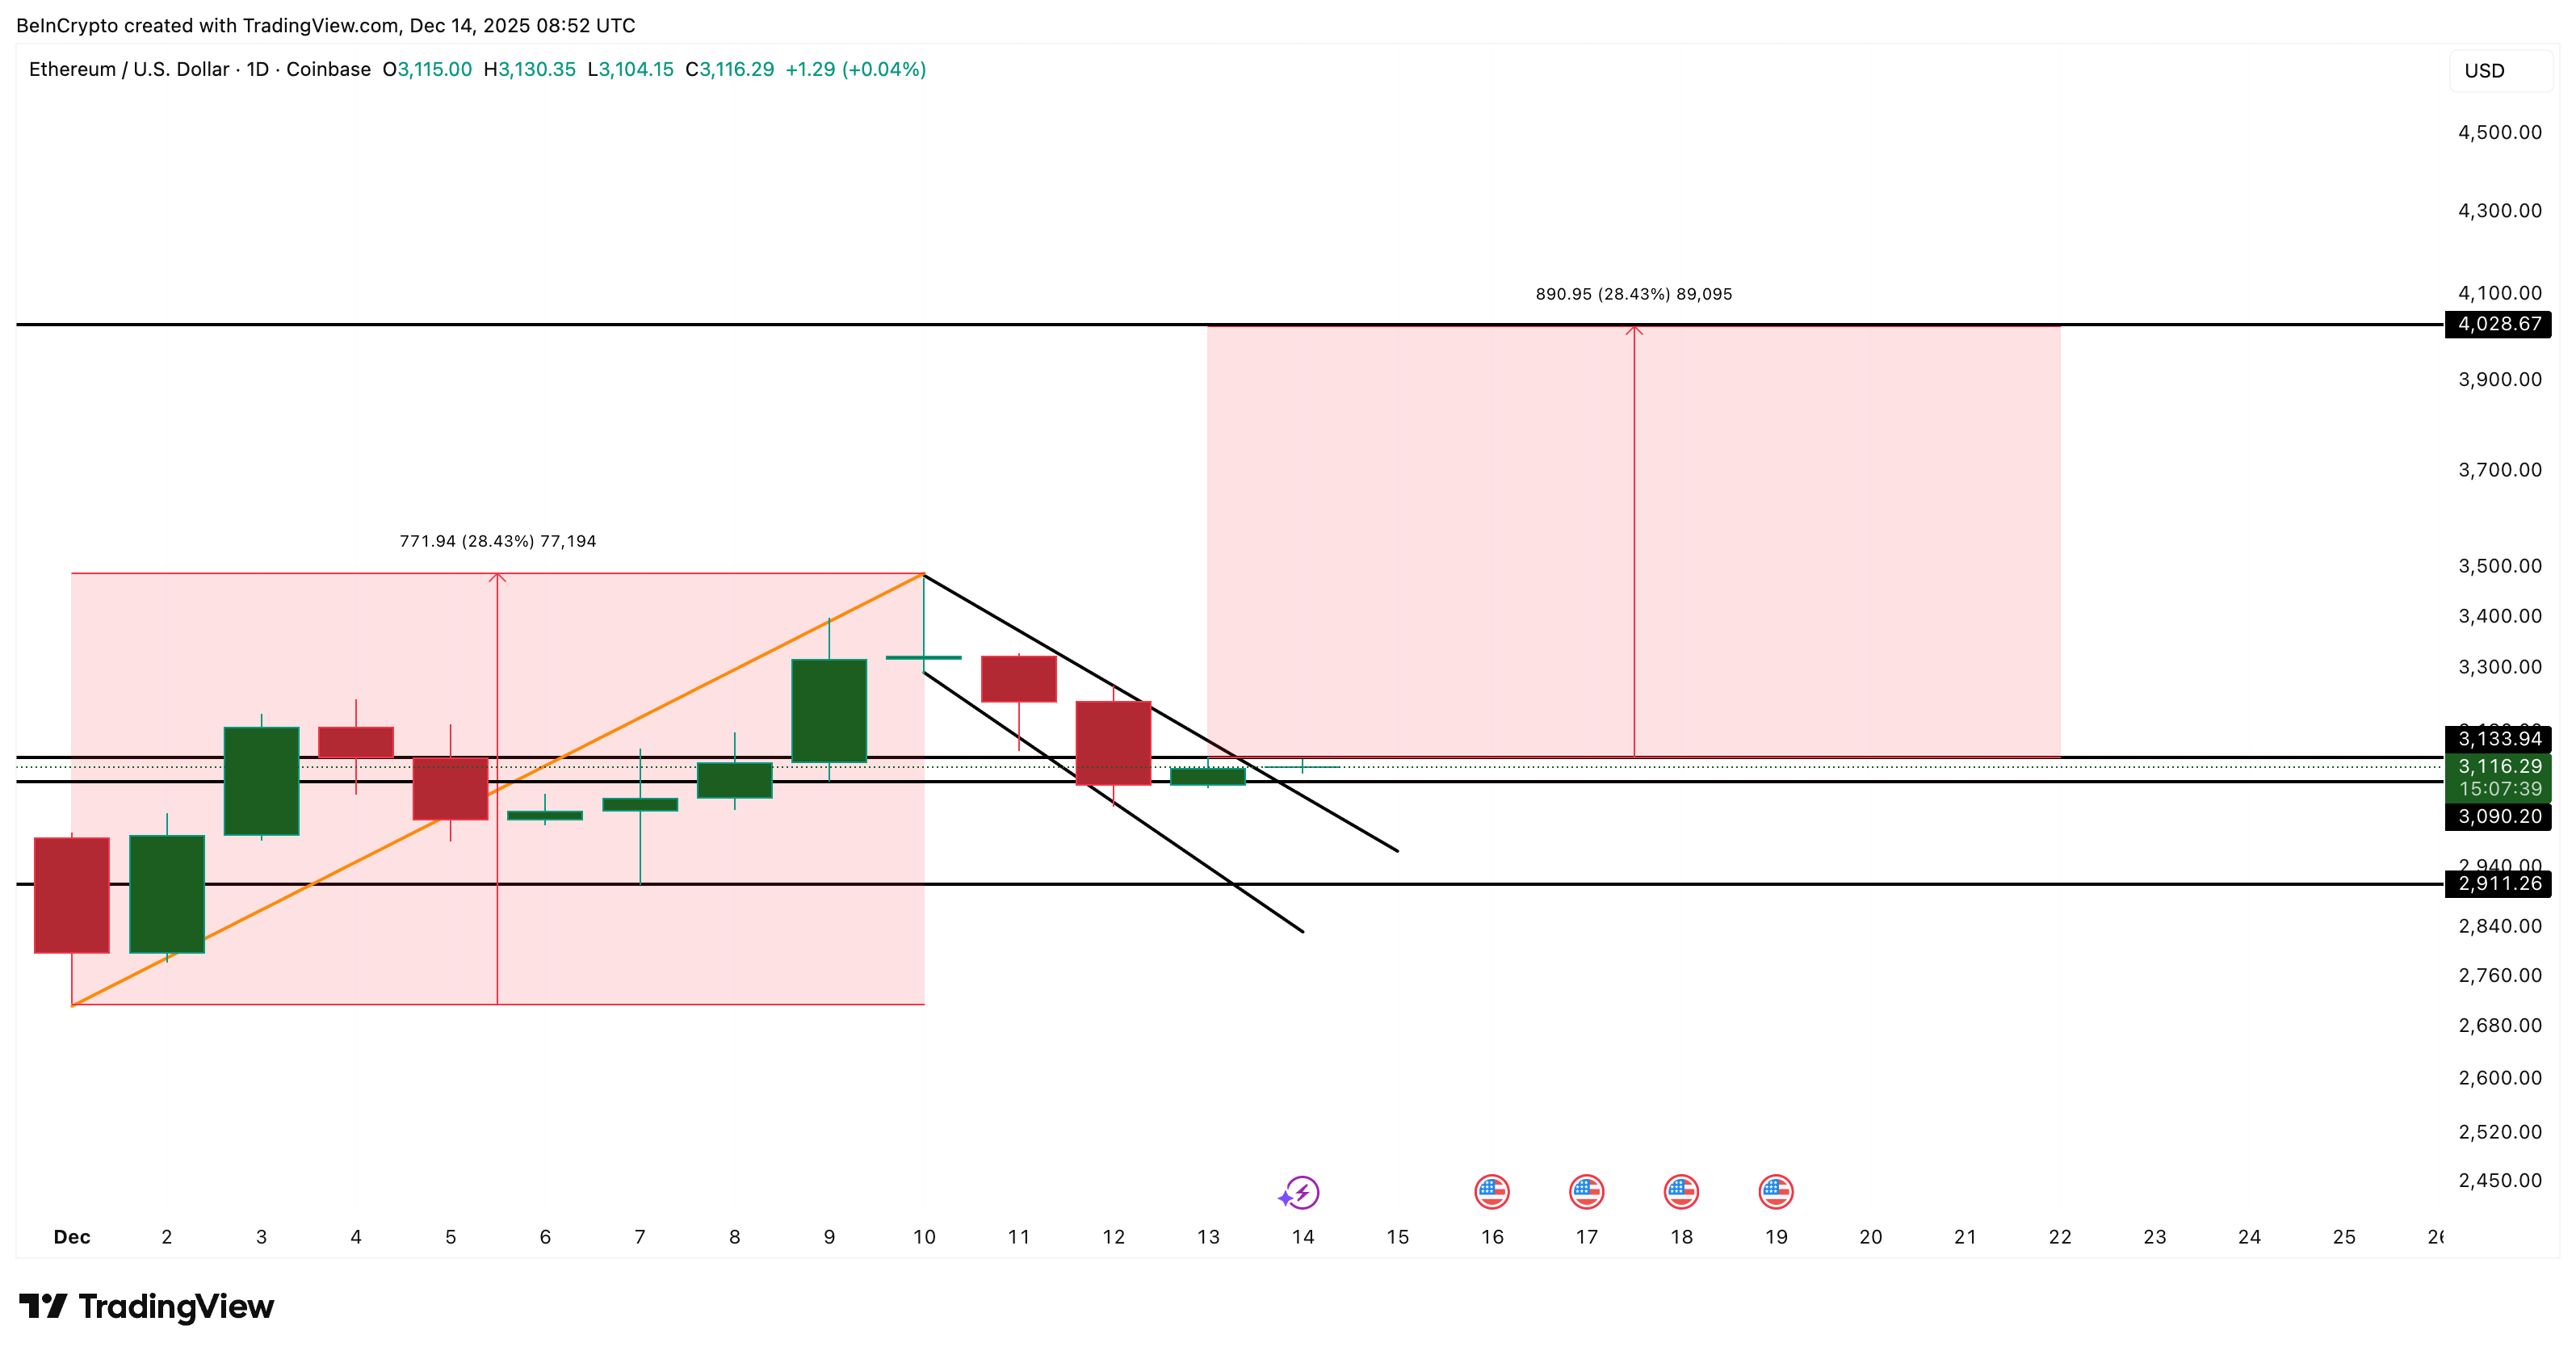
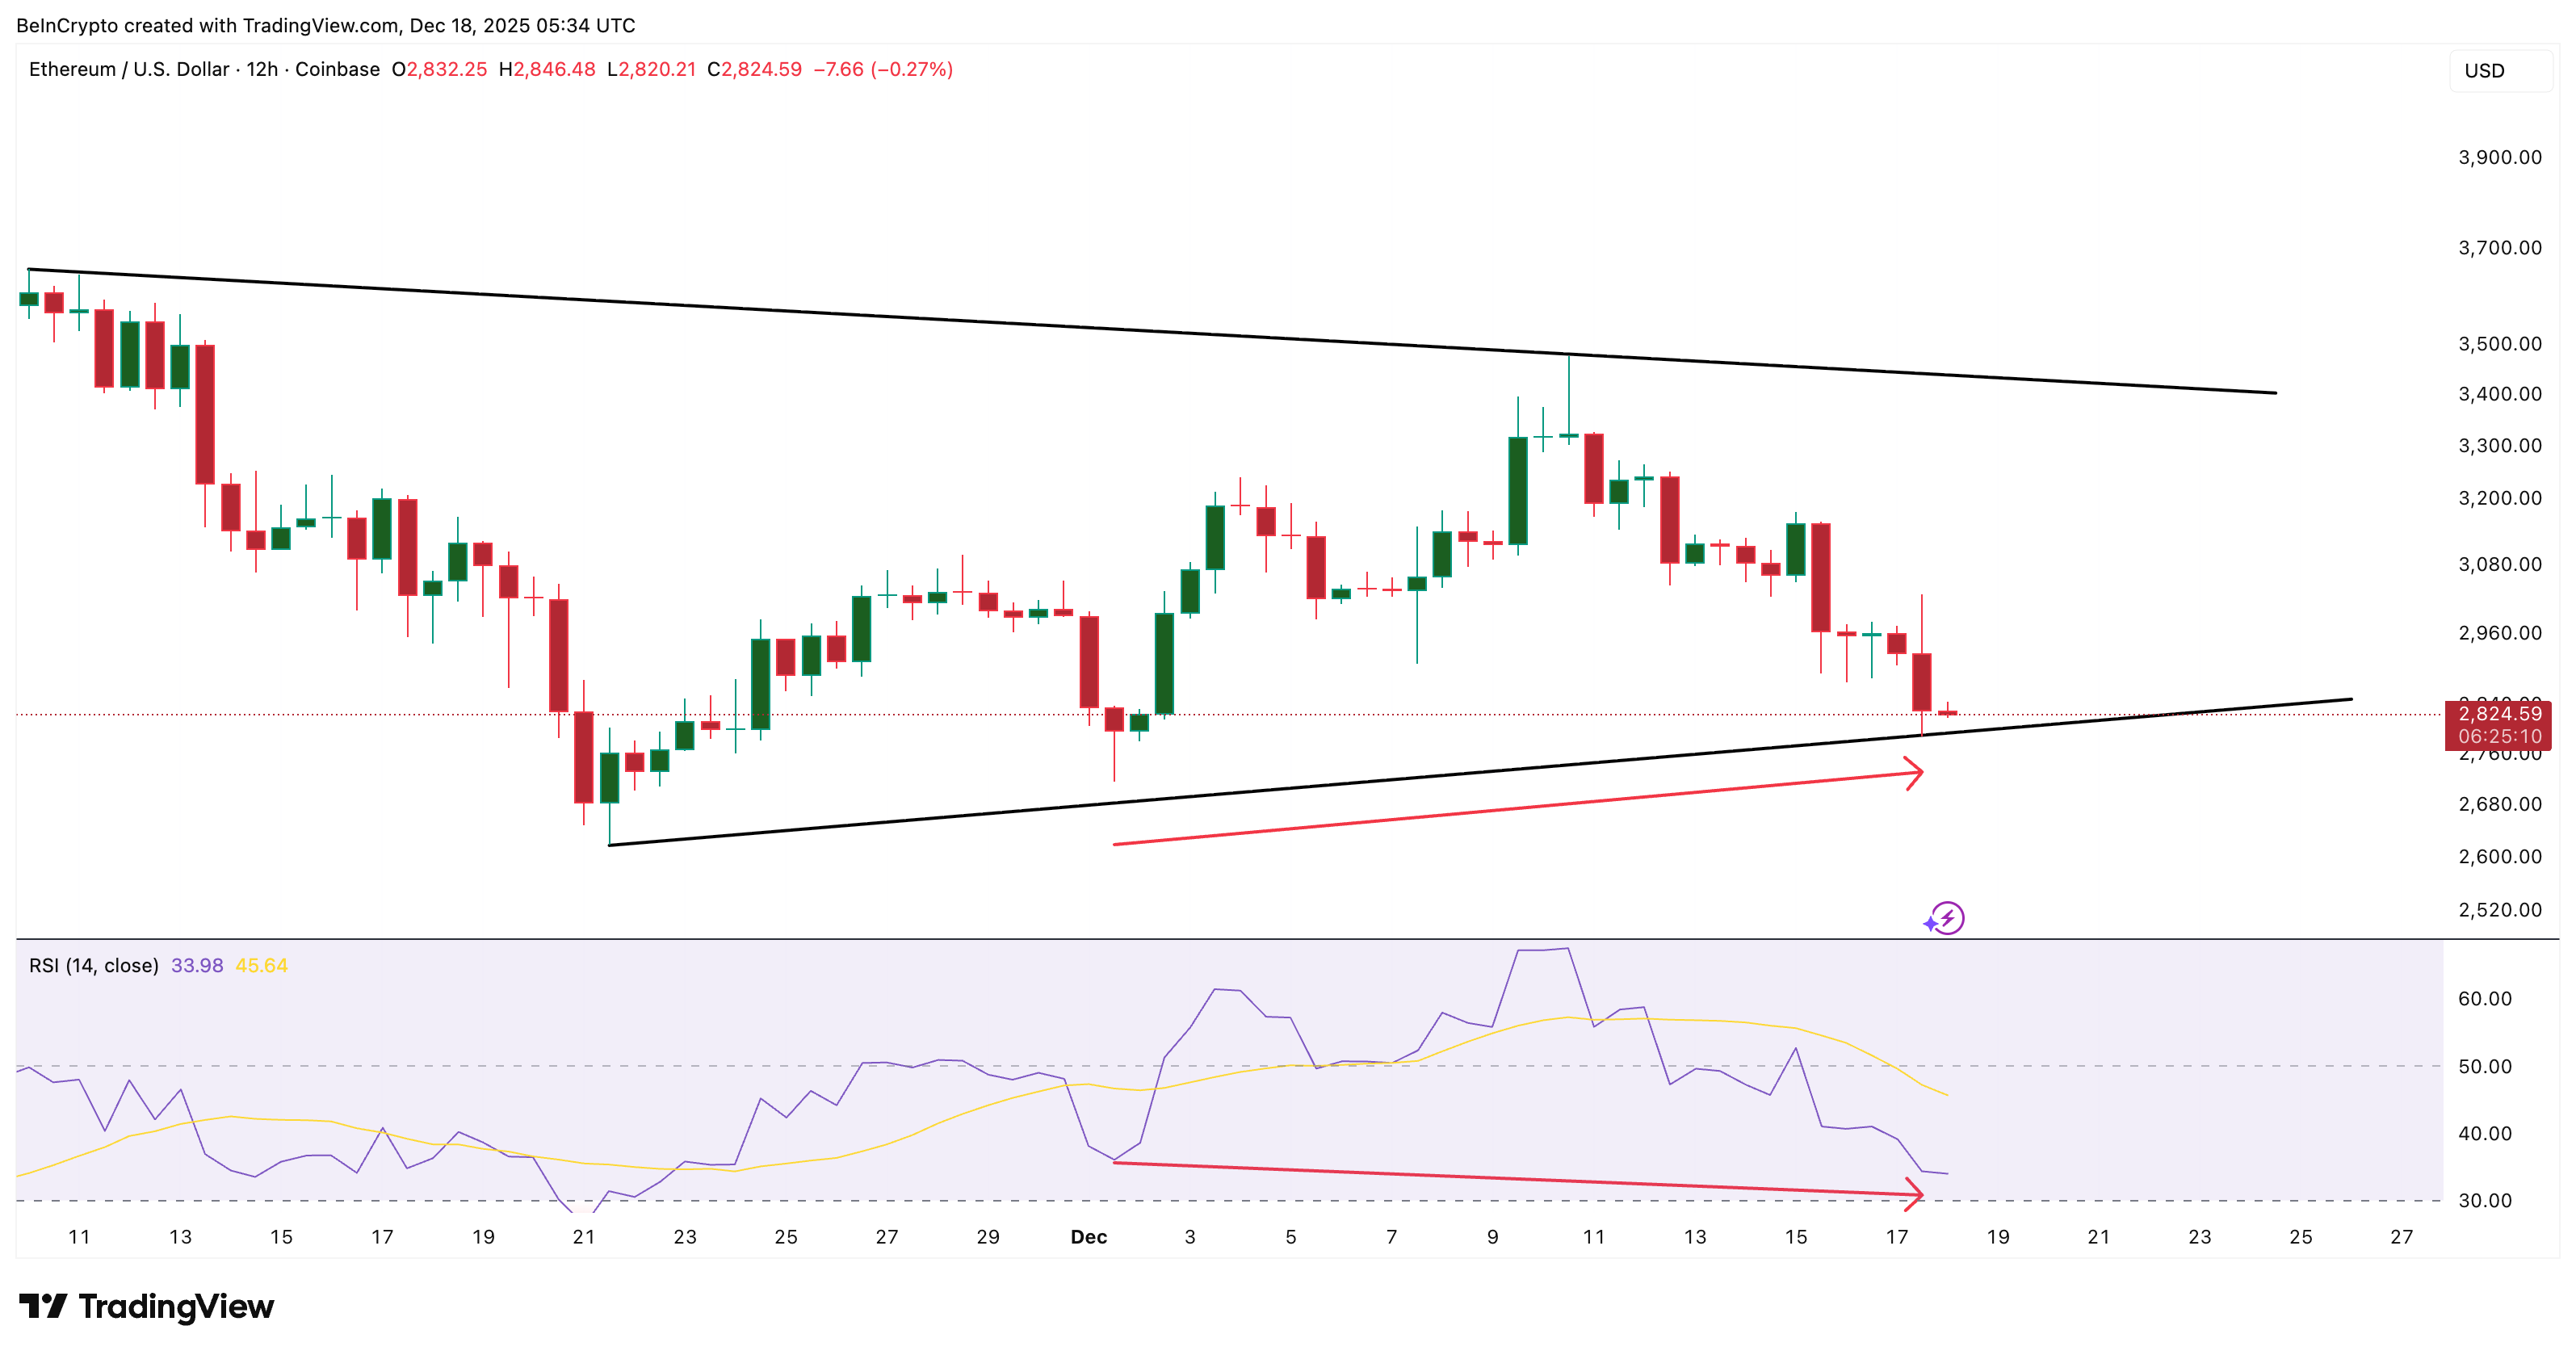
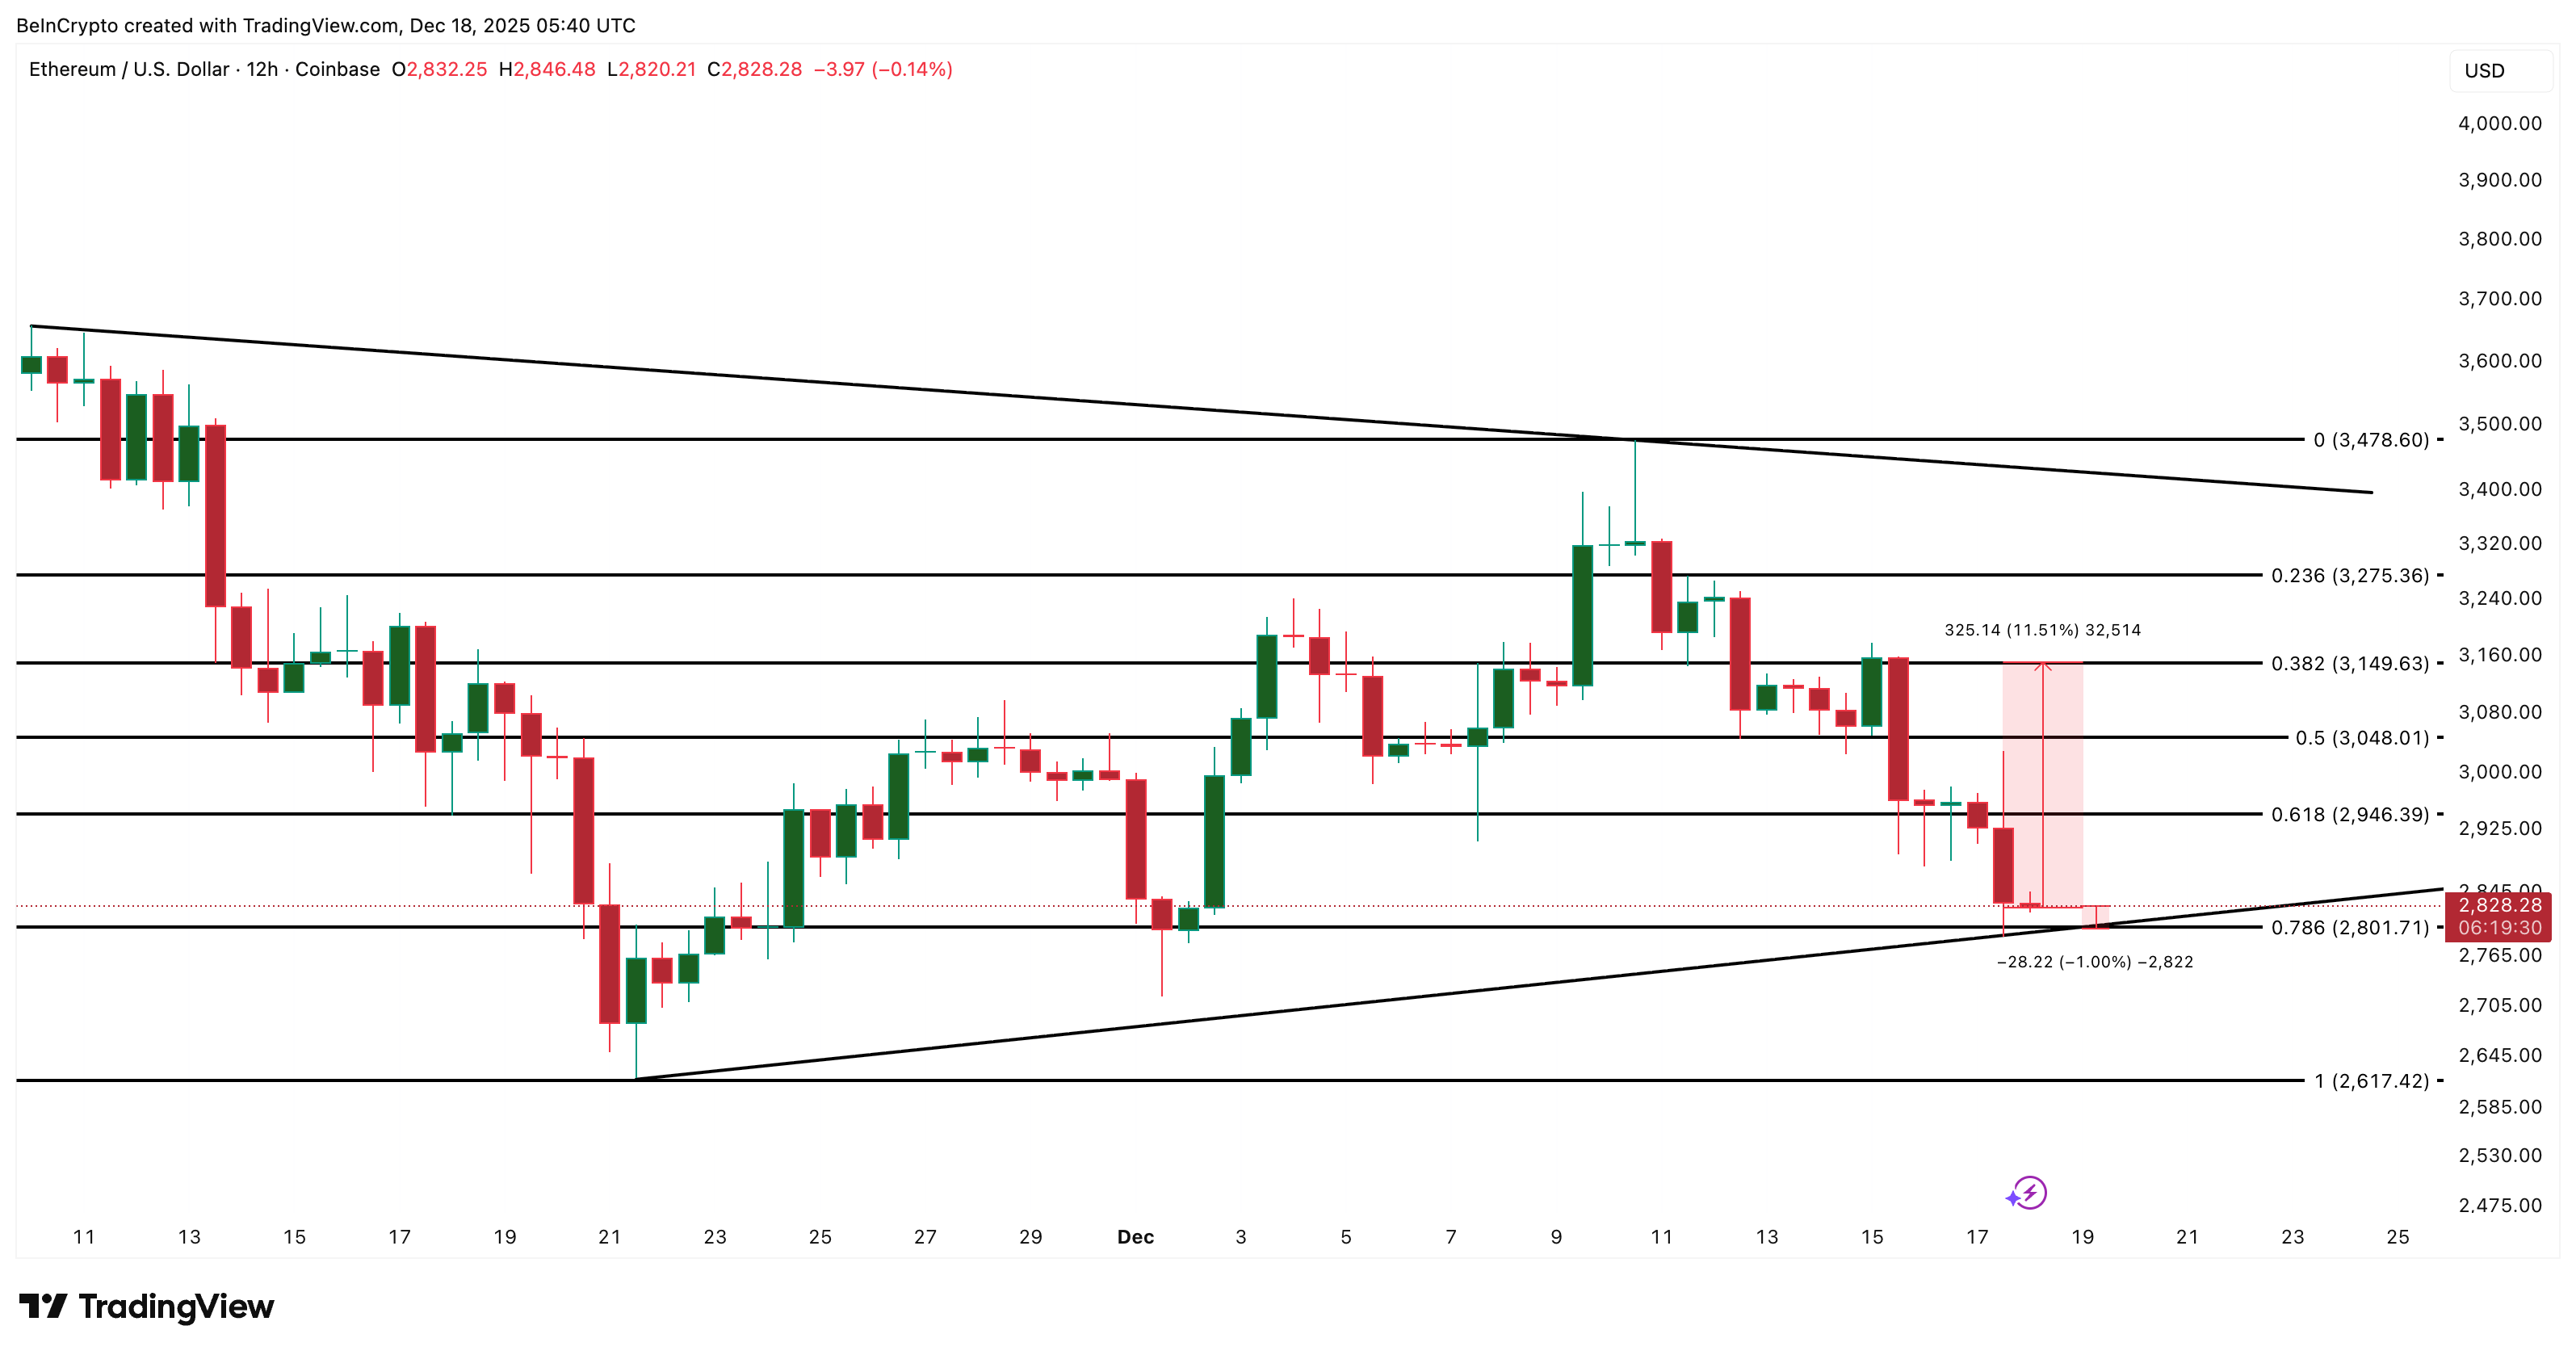
Ethereum is trading inside a narrowing triangle, a structure that reflects growing buyer-seller indecision. Price has compressed toward the lower trendline, often a zone where selling pressure starts to fade.

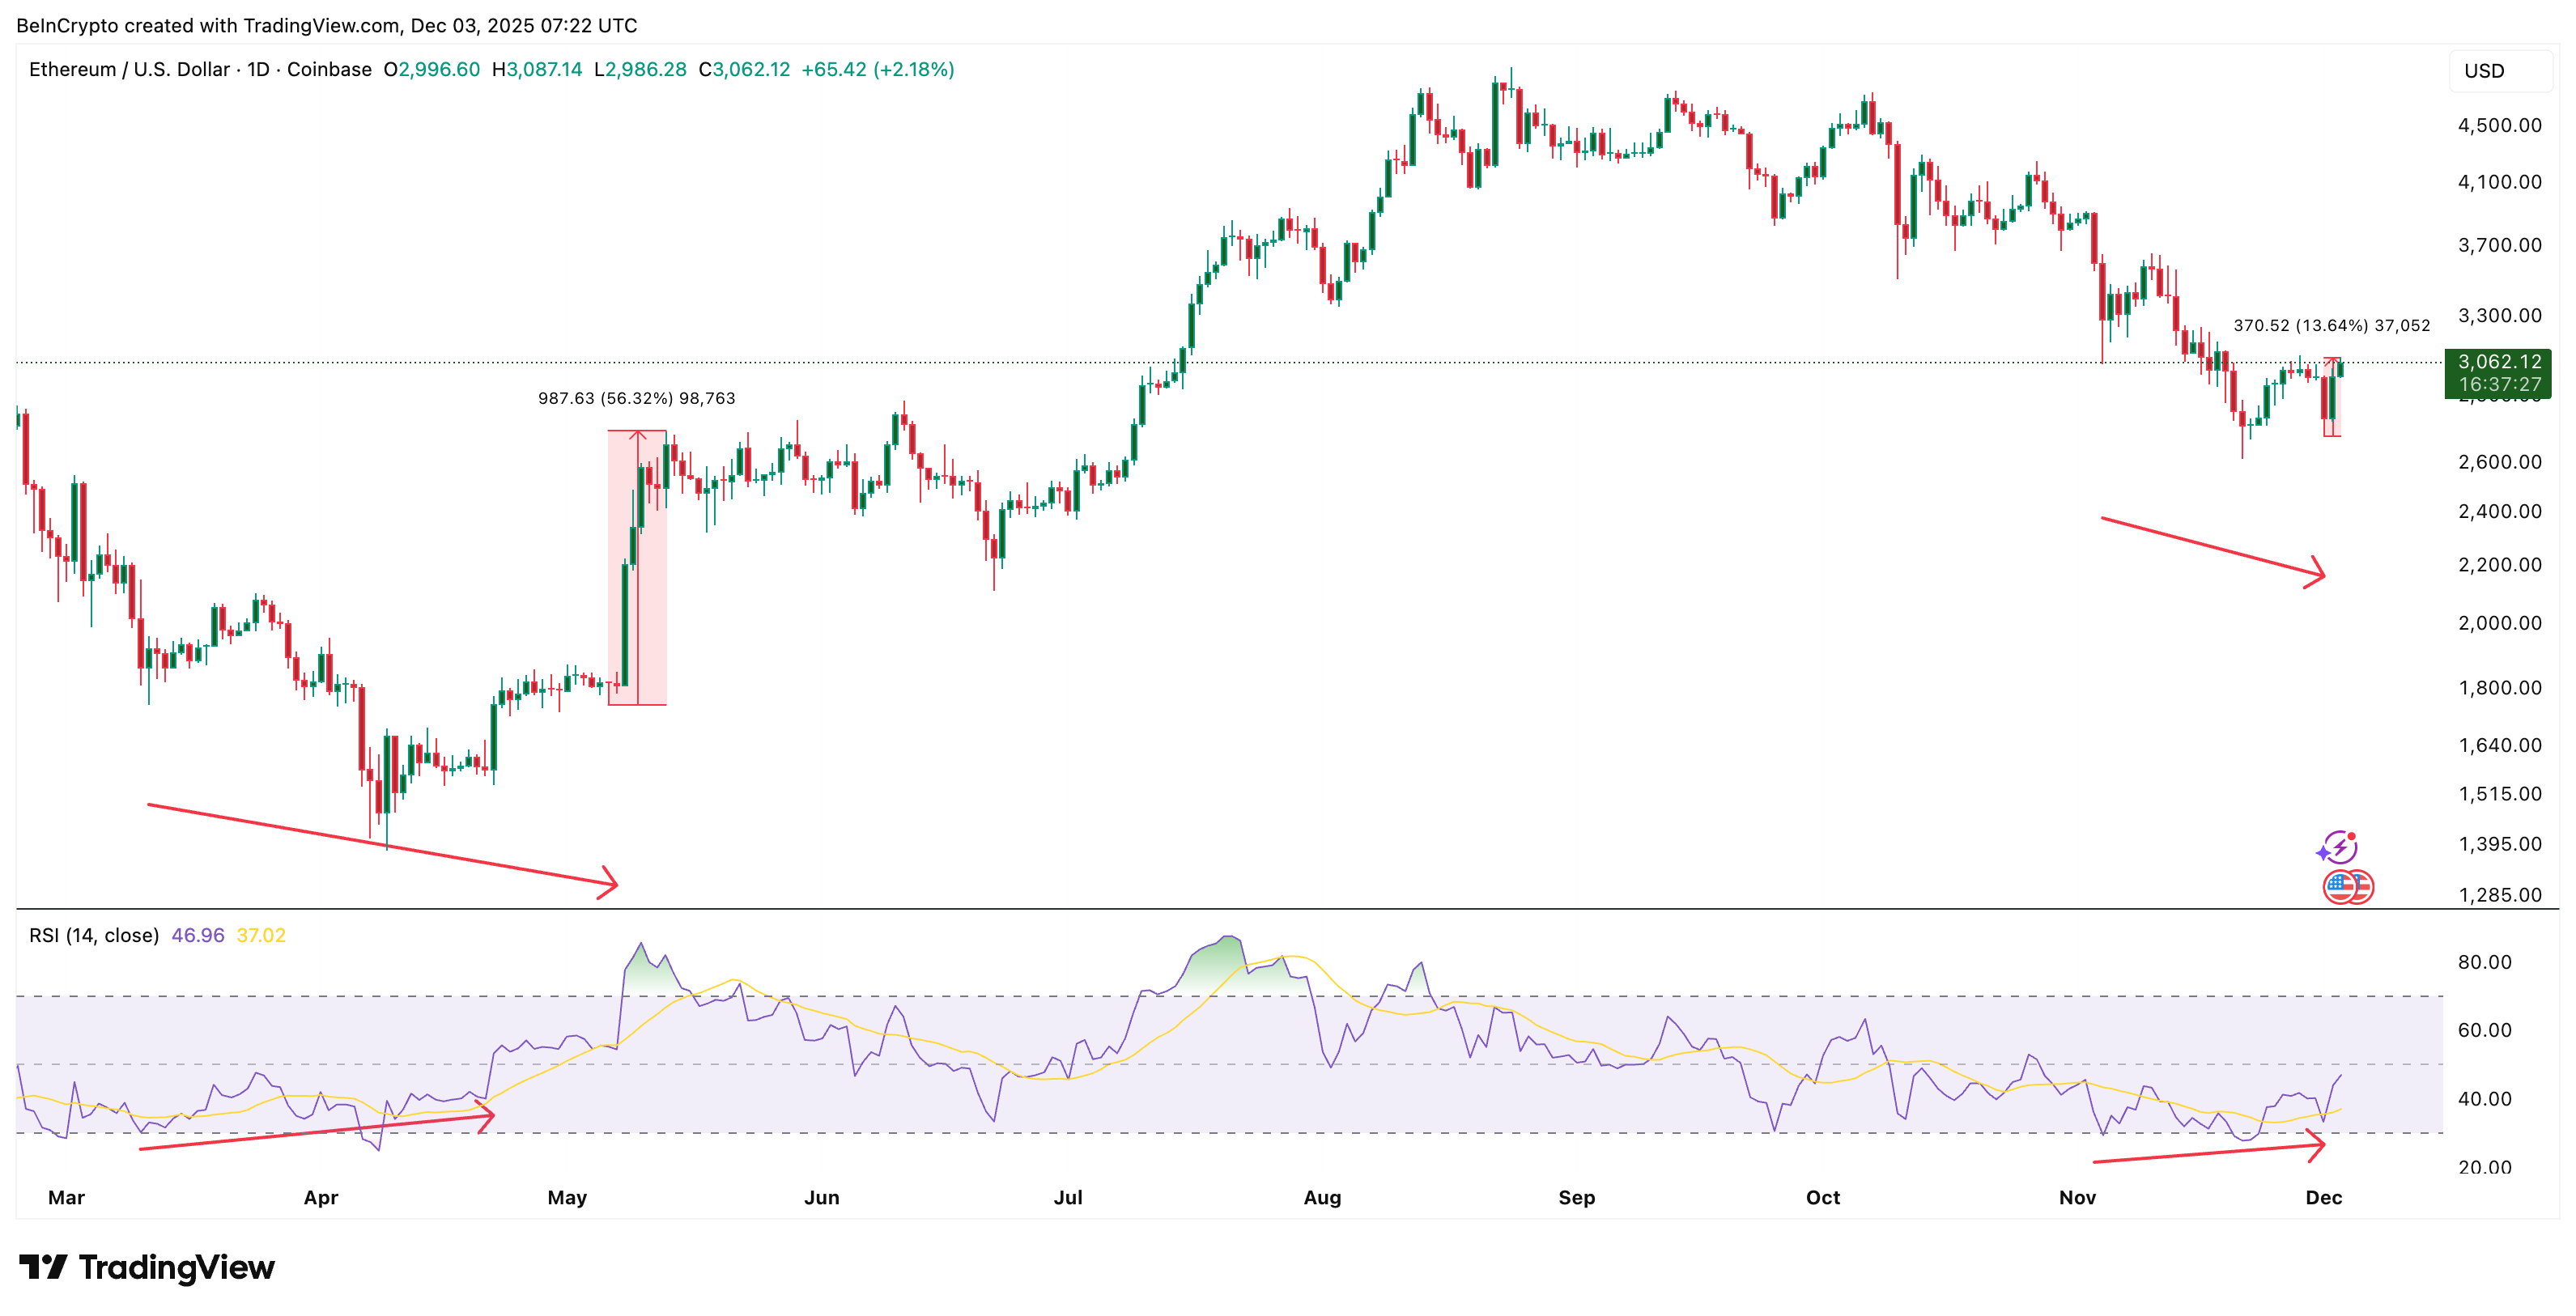
Between December 1 and December 17, ETH printed a higher low on price. At the same time, the RSI (Relative Strength Index), a momentum measuring tool, made a lower low. This creates hidden bullish divergence, meaning selling momentum is weakening.

Hidden Bullish Divergence
Hidden Bullish Divergence: TradingView

Want more token insights like this? Sign up for Editor Harsh Notariya’s Daily Crypto Newsletter here.

This setup does not guarantee a rally. But it does suggest downside pressure may be exhausting as Ethereum approaches structural support, the lower triangle trendline. In simple terms, sellers are losing strength, but buyers have not taken control yet.

That makes the next move highly sensitive to key levels.

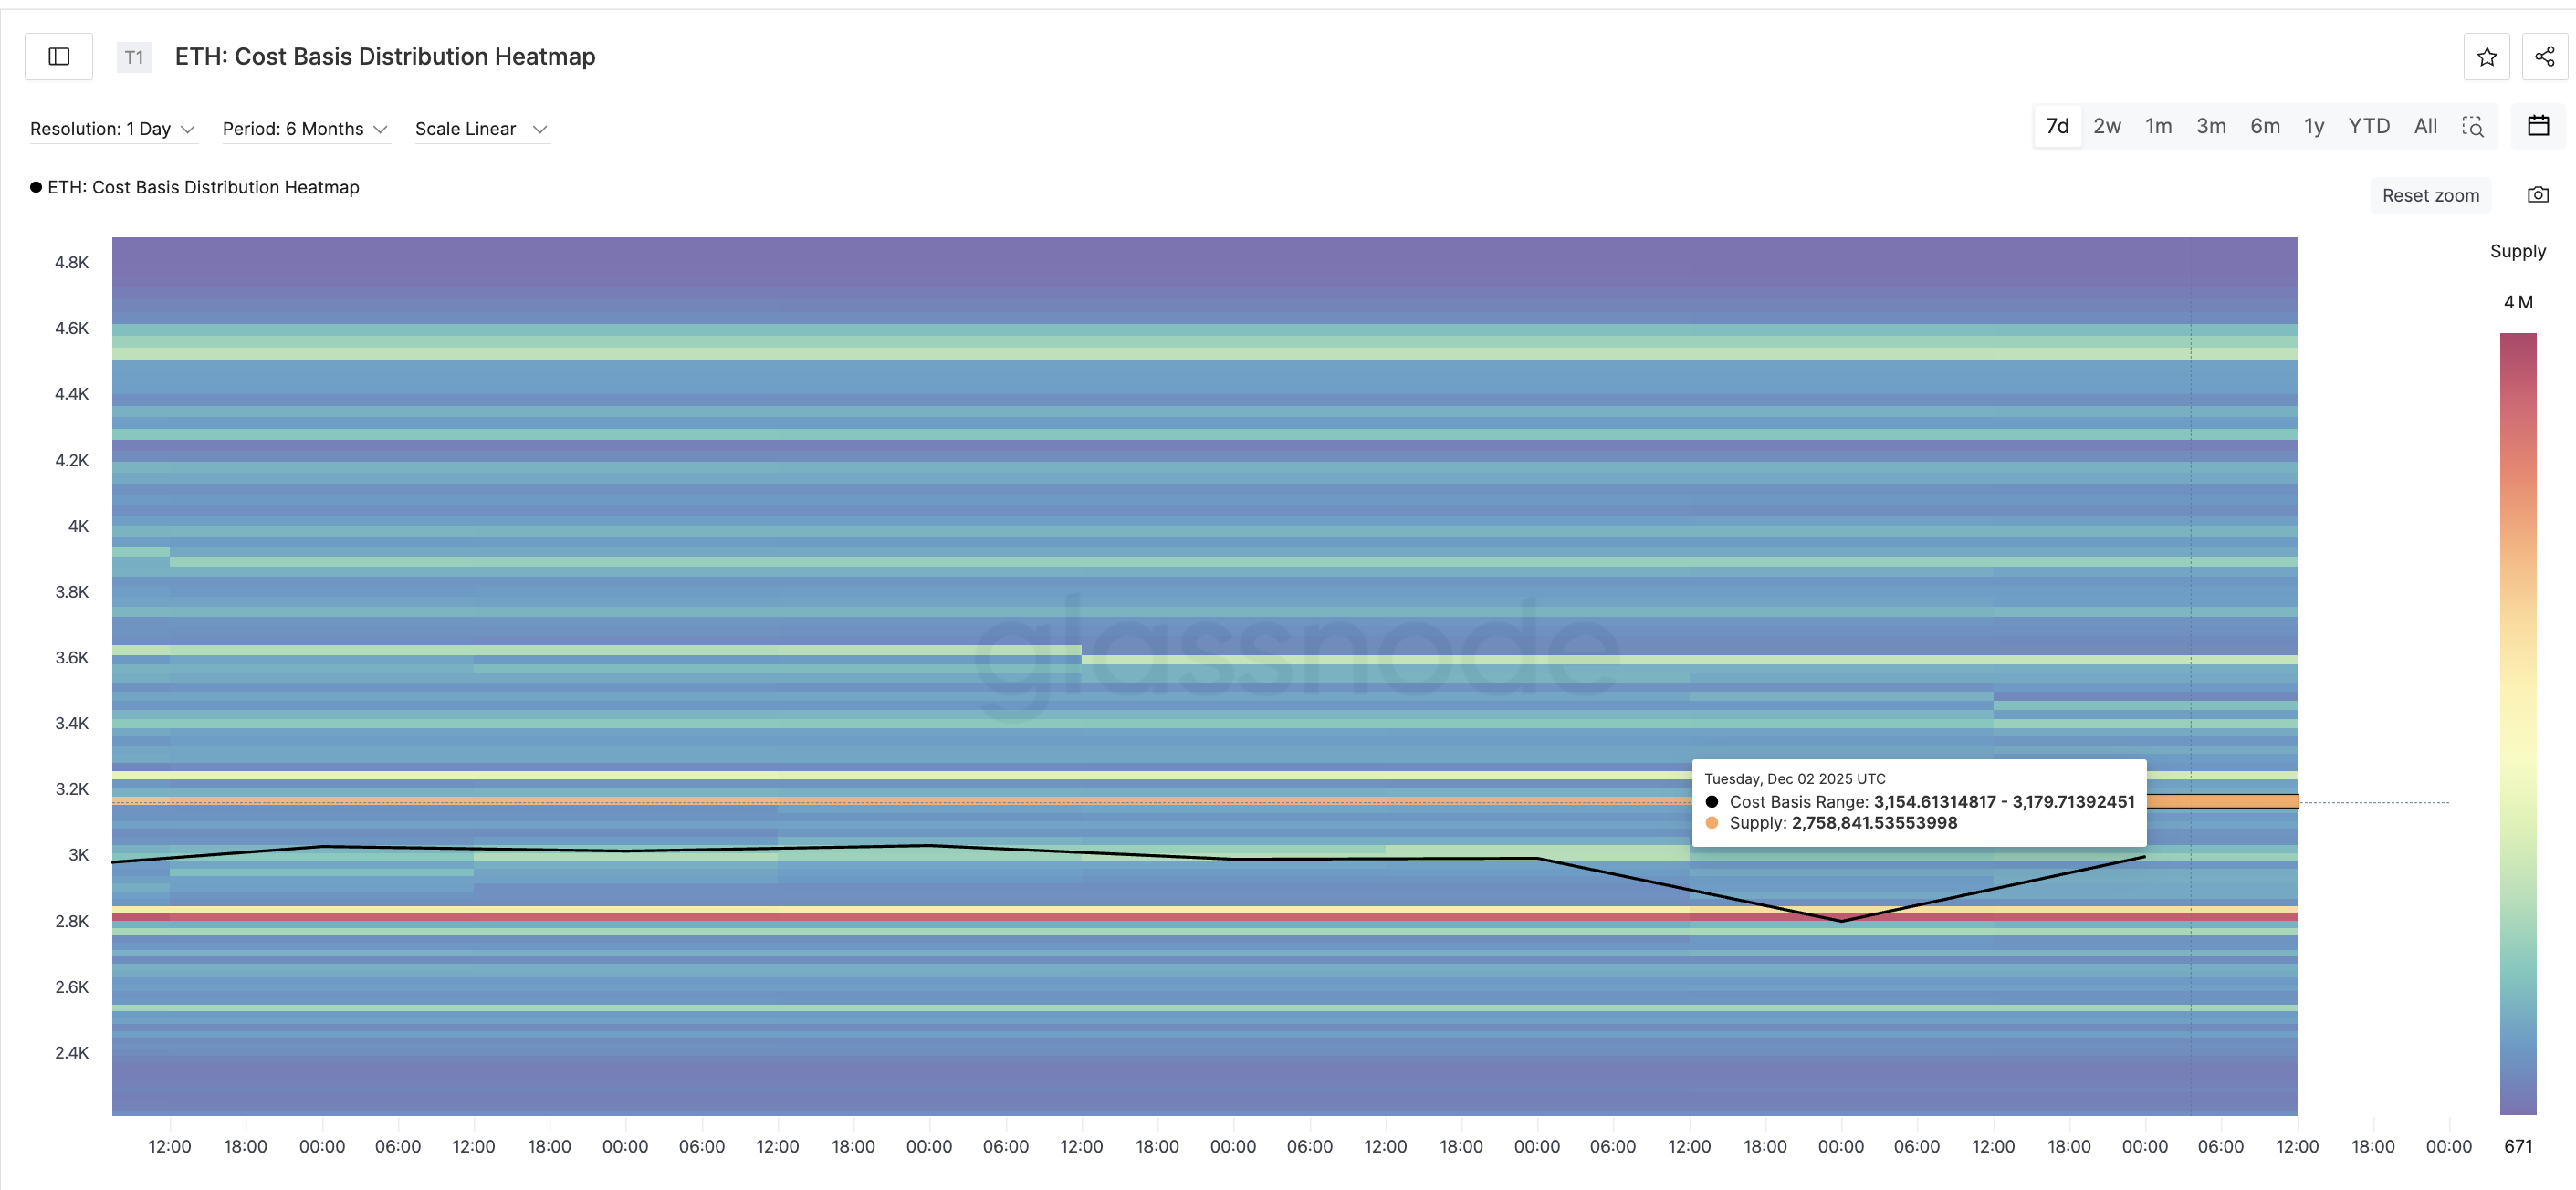
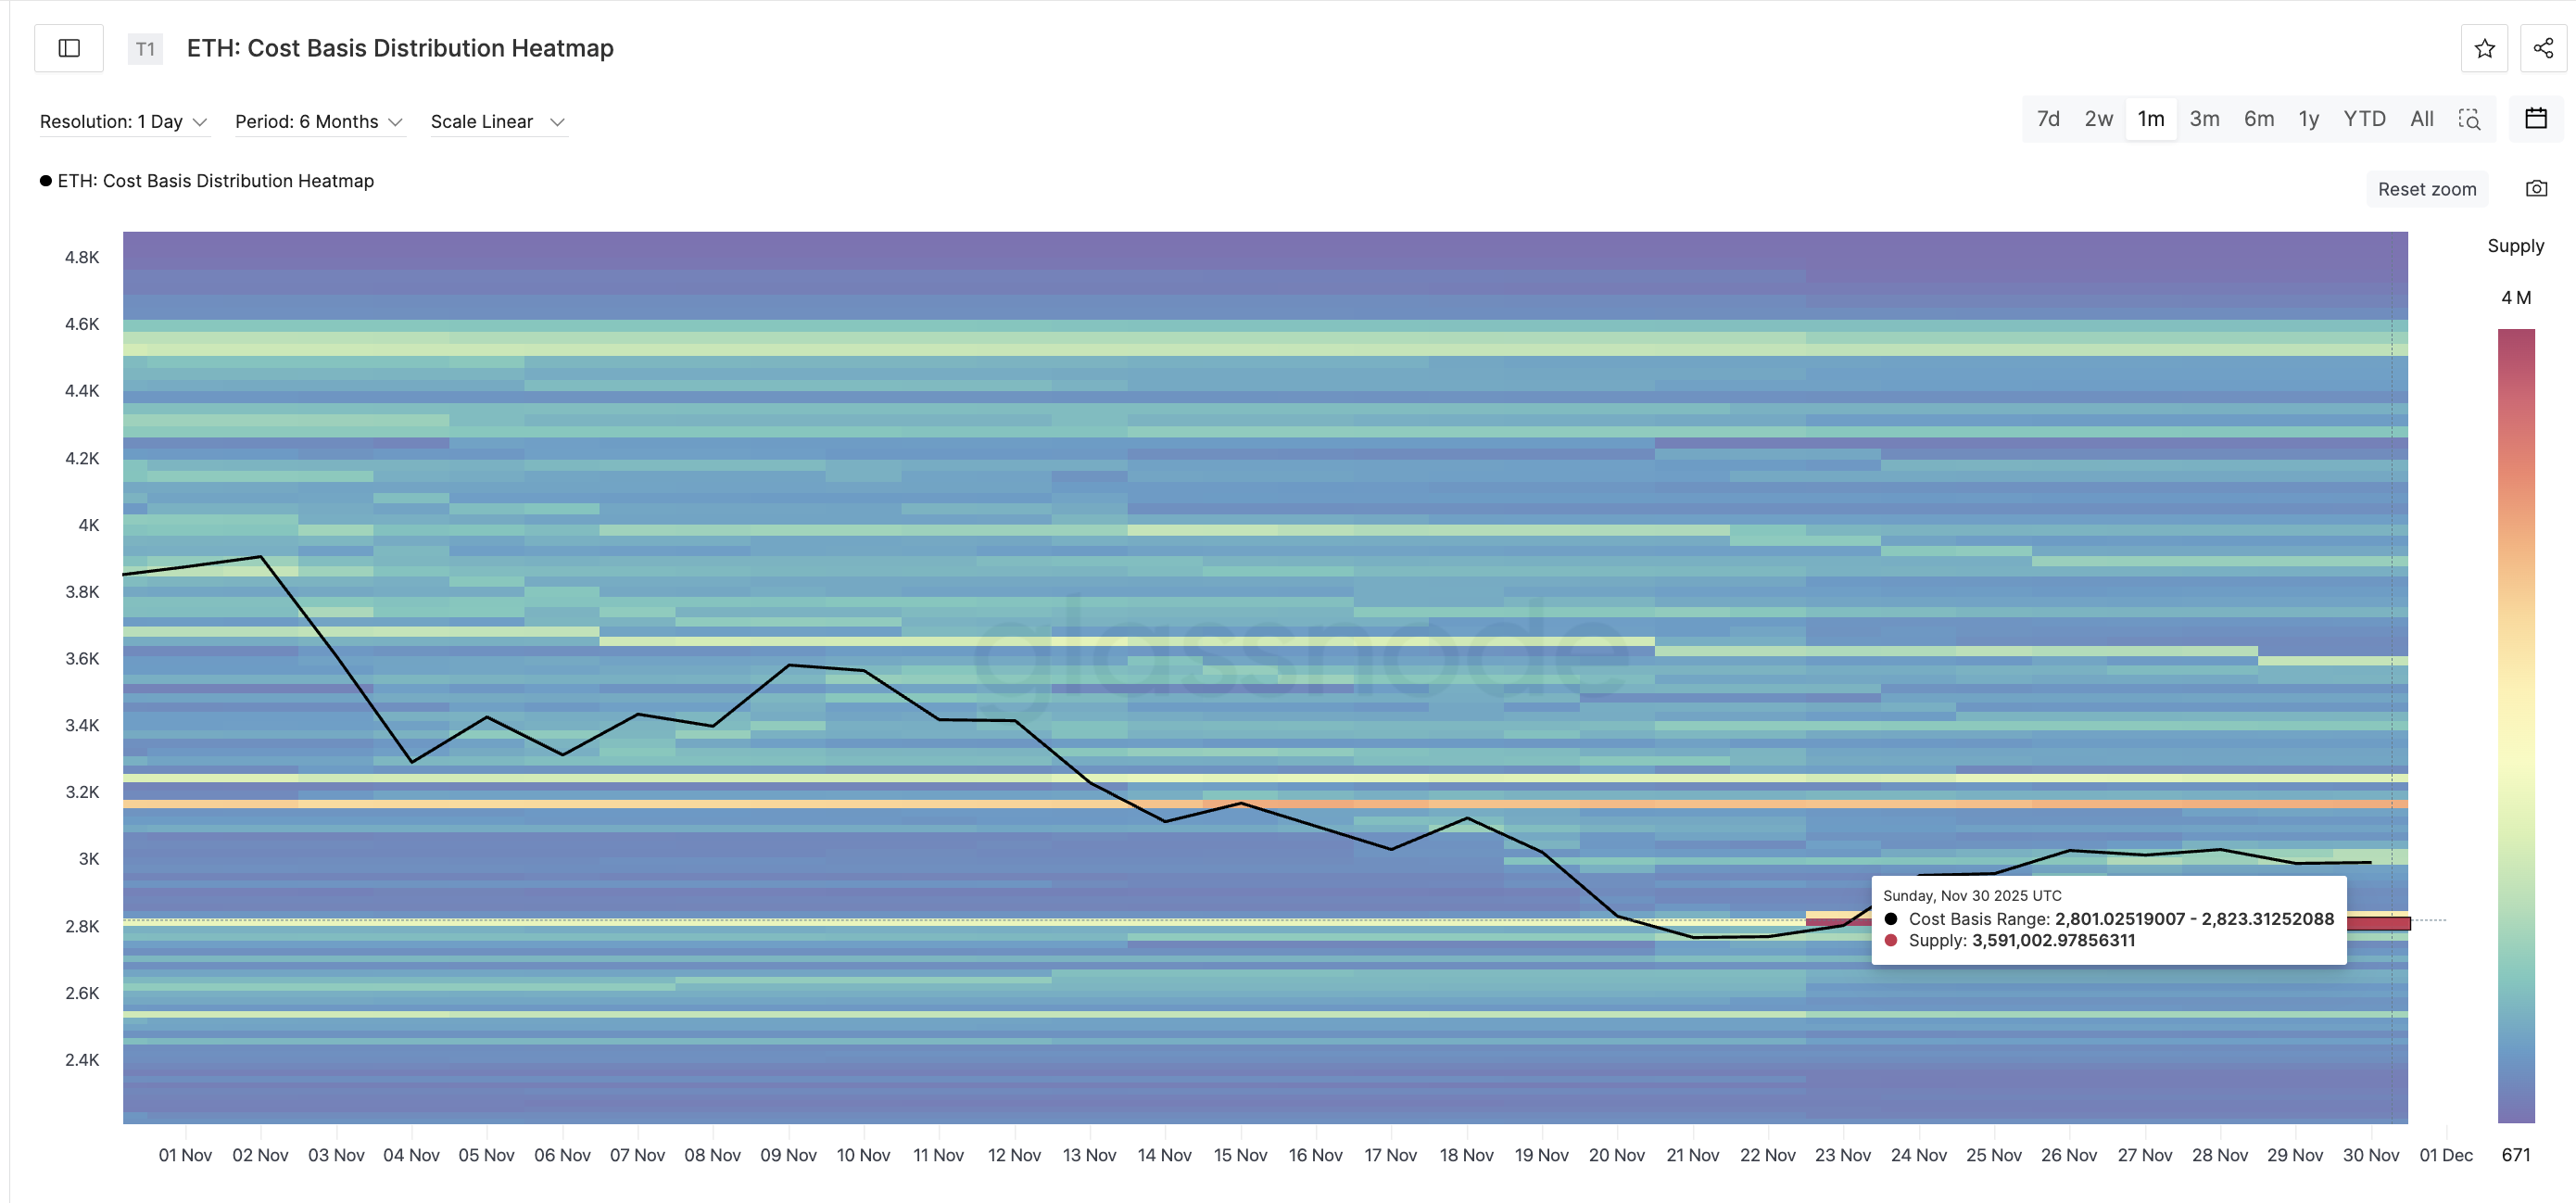
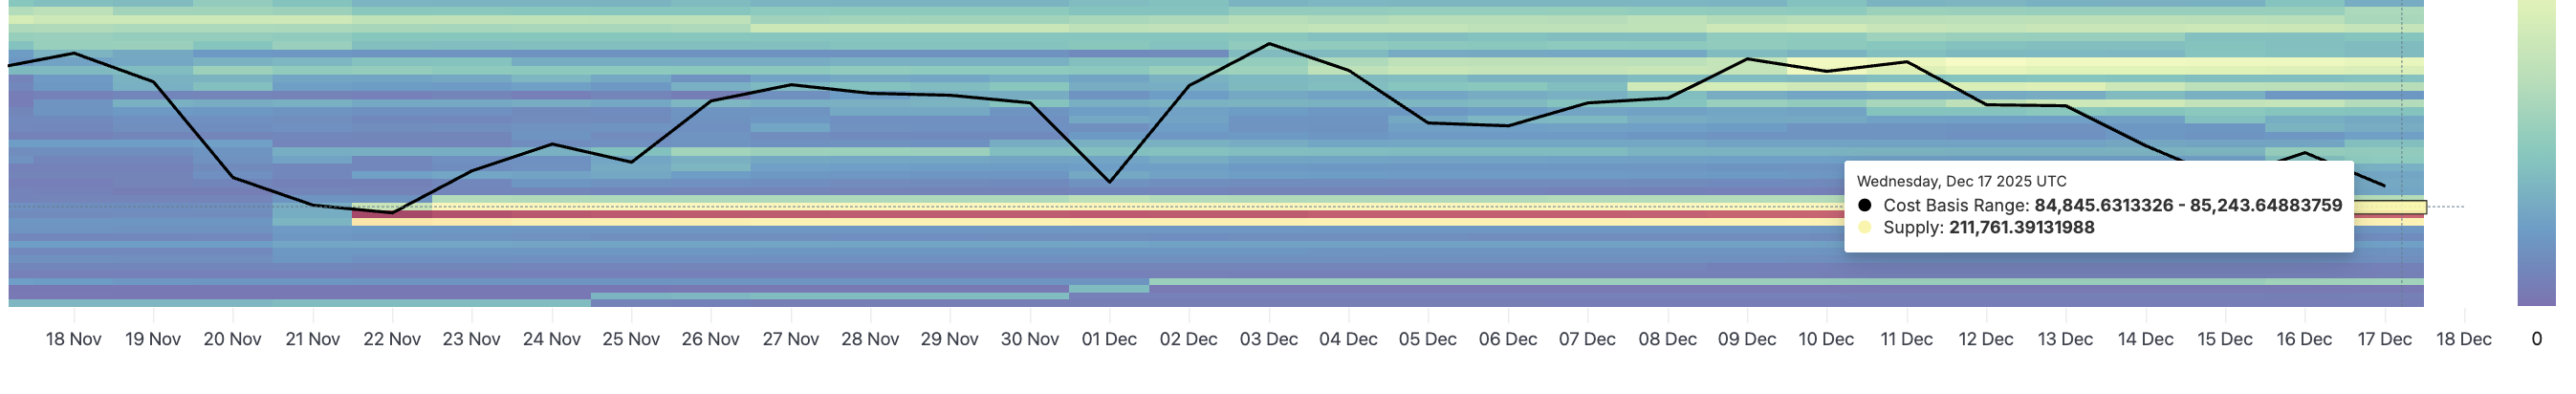
Cost Basis Data Shows Where Ethereum Price Rebound Could Stall

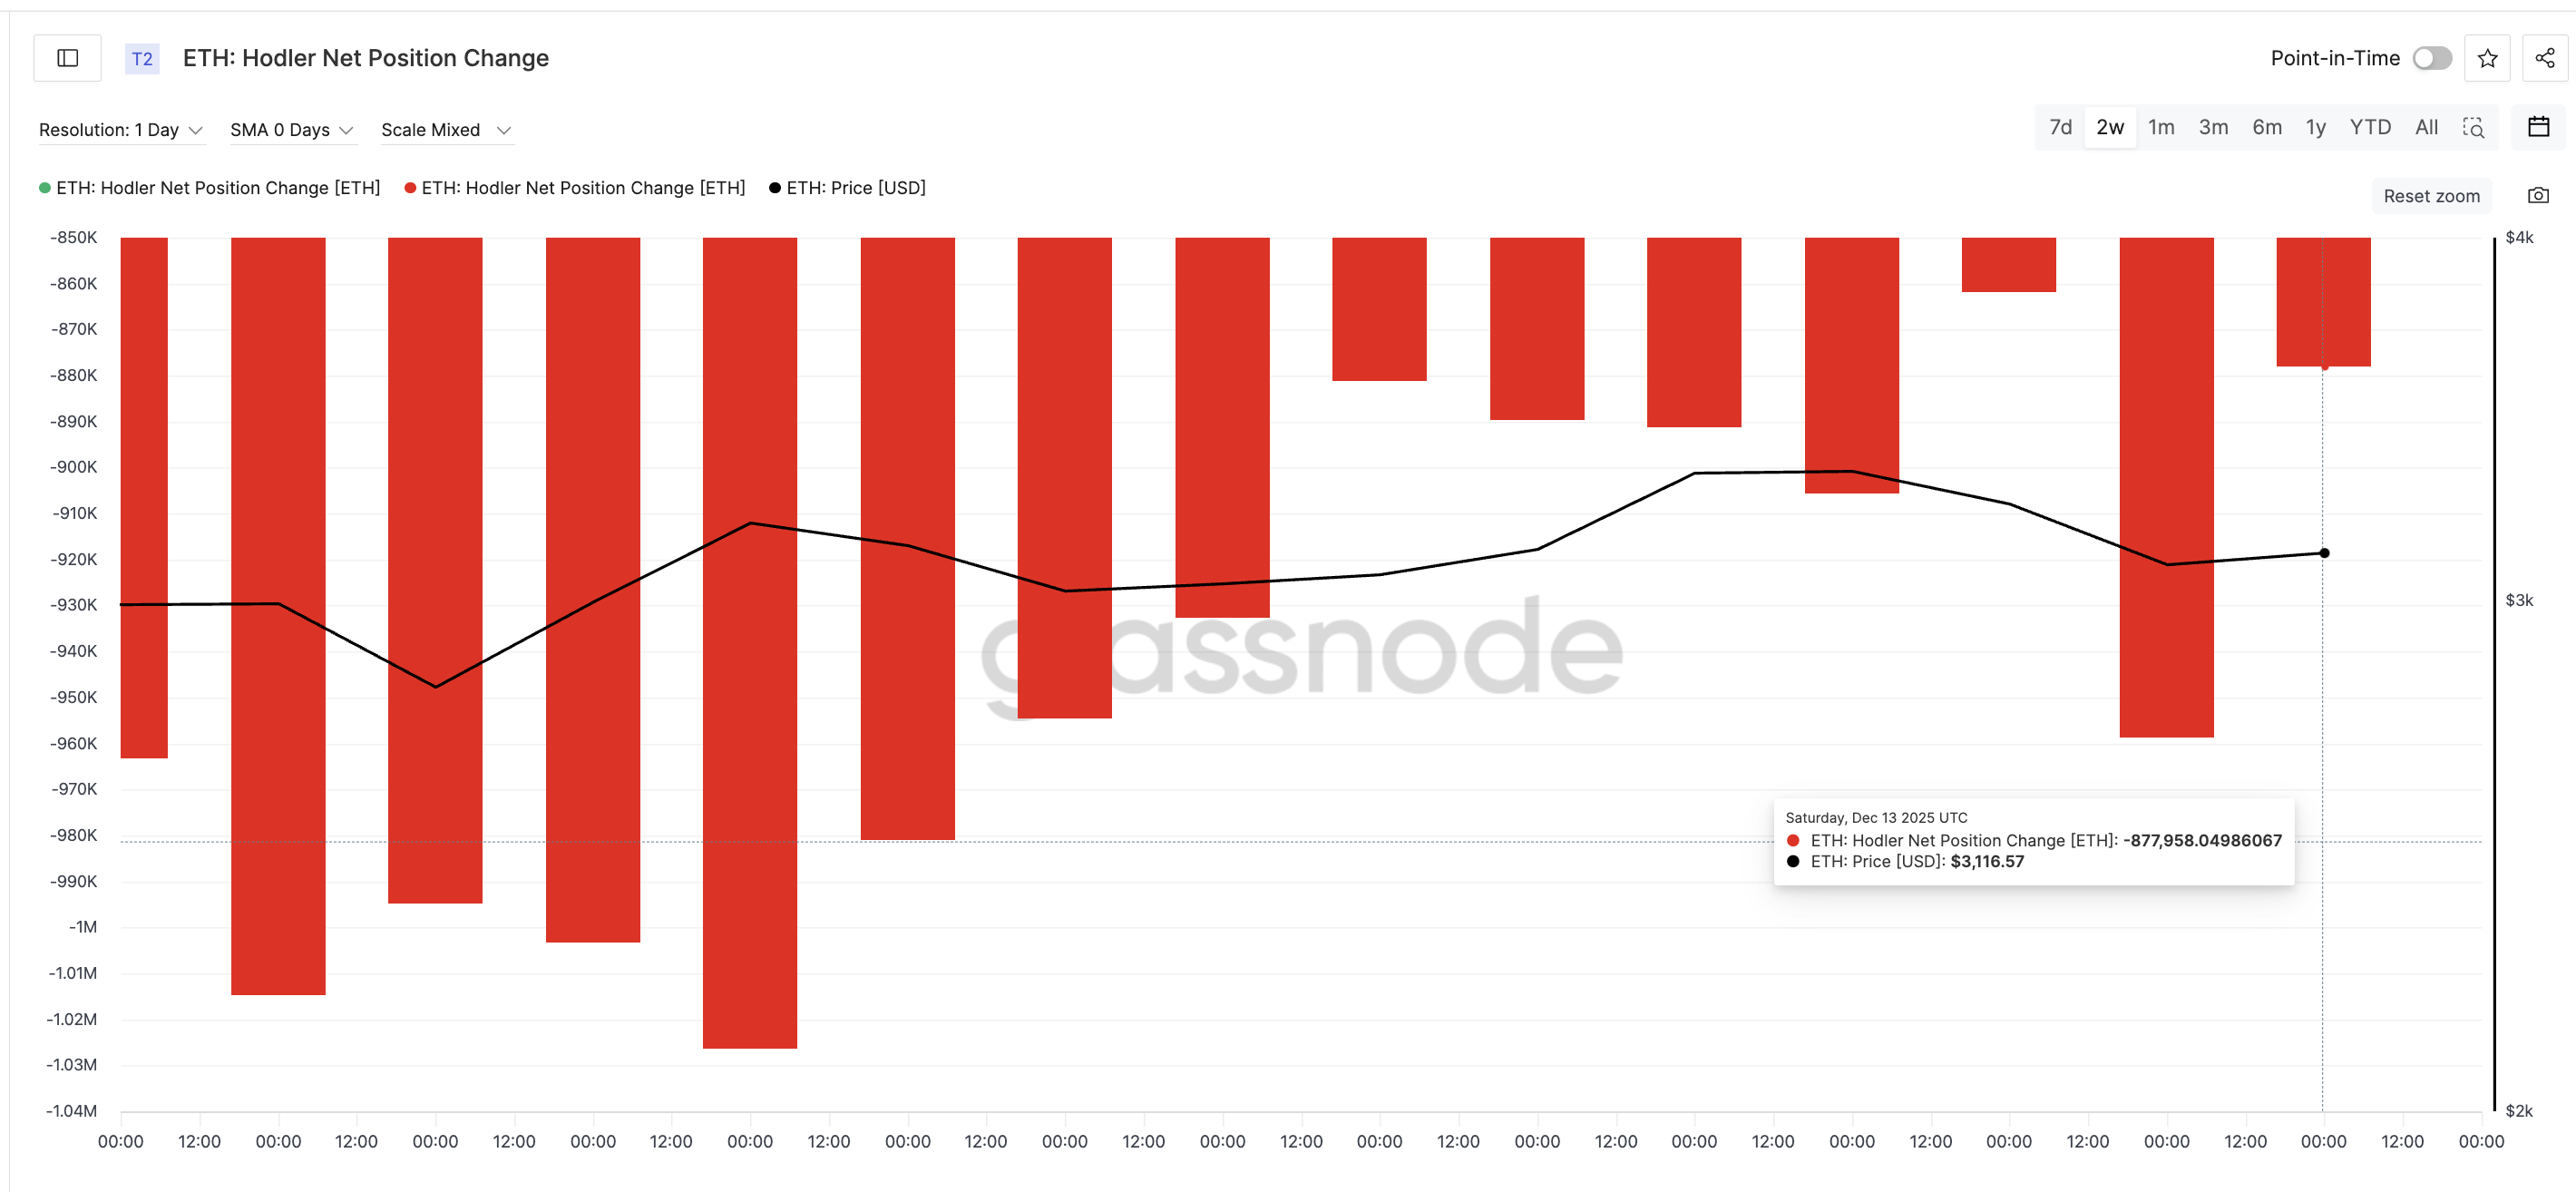
On-chain cost basis data helps explain why upside may remain capped.

The strongest near-term resistance sits between $3,154 and $3,179, where roughly 2.8 million ETH were accumulated. This is a heavy supply zone. When price revisits this range, many holders reach break-even and tend to sell.

Key Supply Cluster
Key Supply Cluster: Glassnode

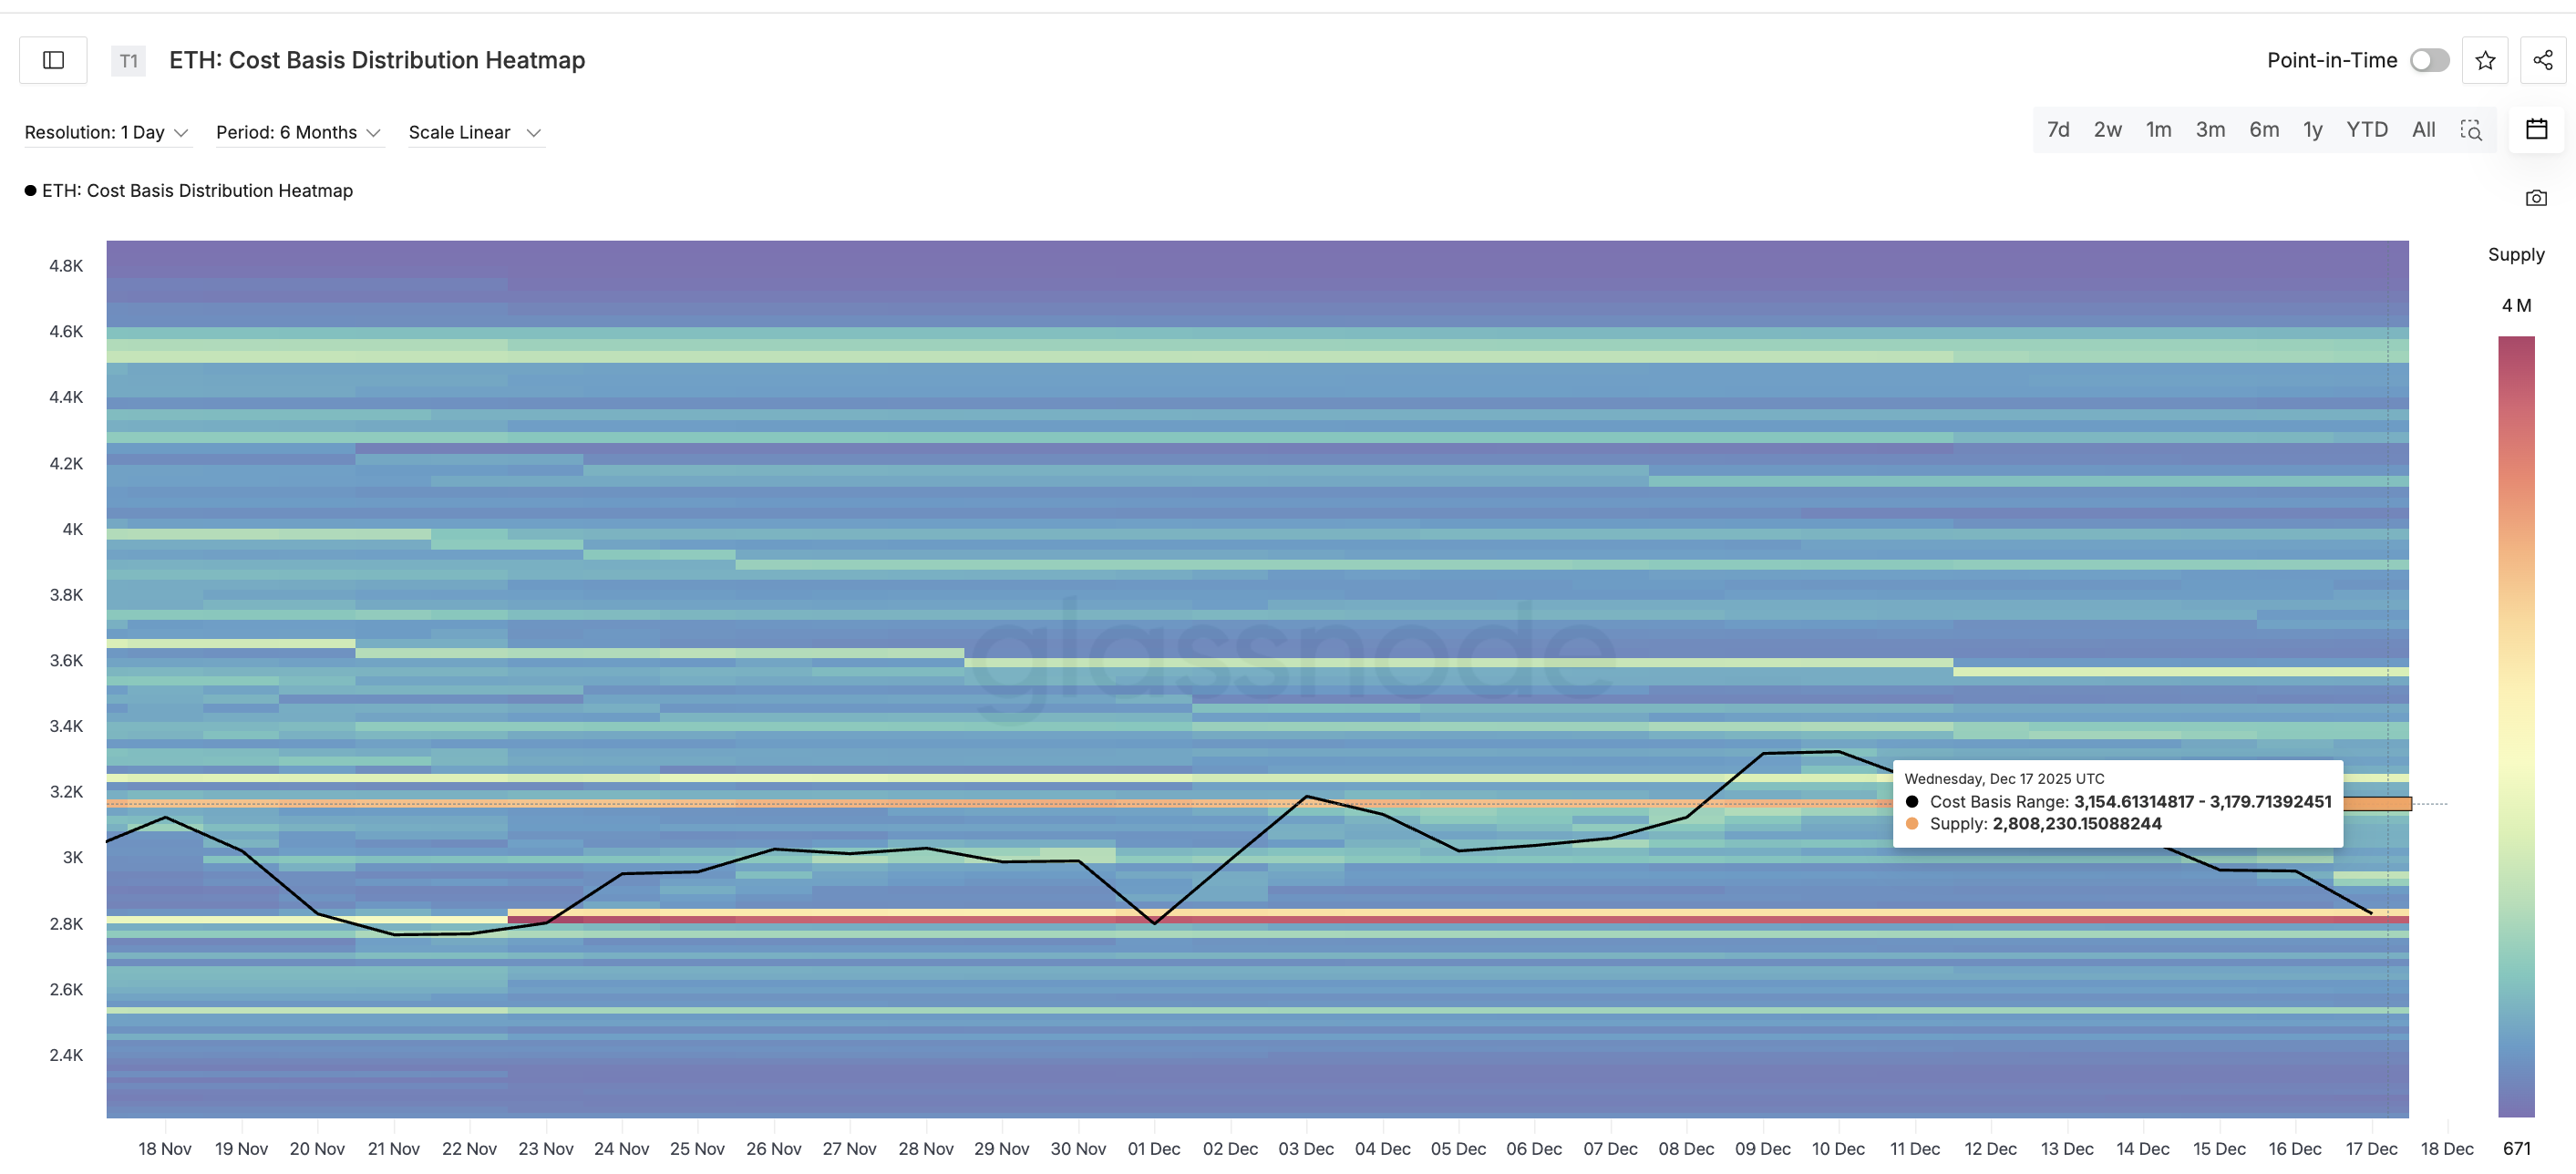
This aligns closely with the chart resistance at $3,149, which marks an 11% upside from current levels. Even if the Ethereum price rebounds, this zone is likely to attract selling unless the price closes cleanly above it. That is why any bounce without a daily close above this area would still be considered corrective, not trend-changing.

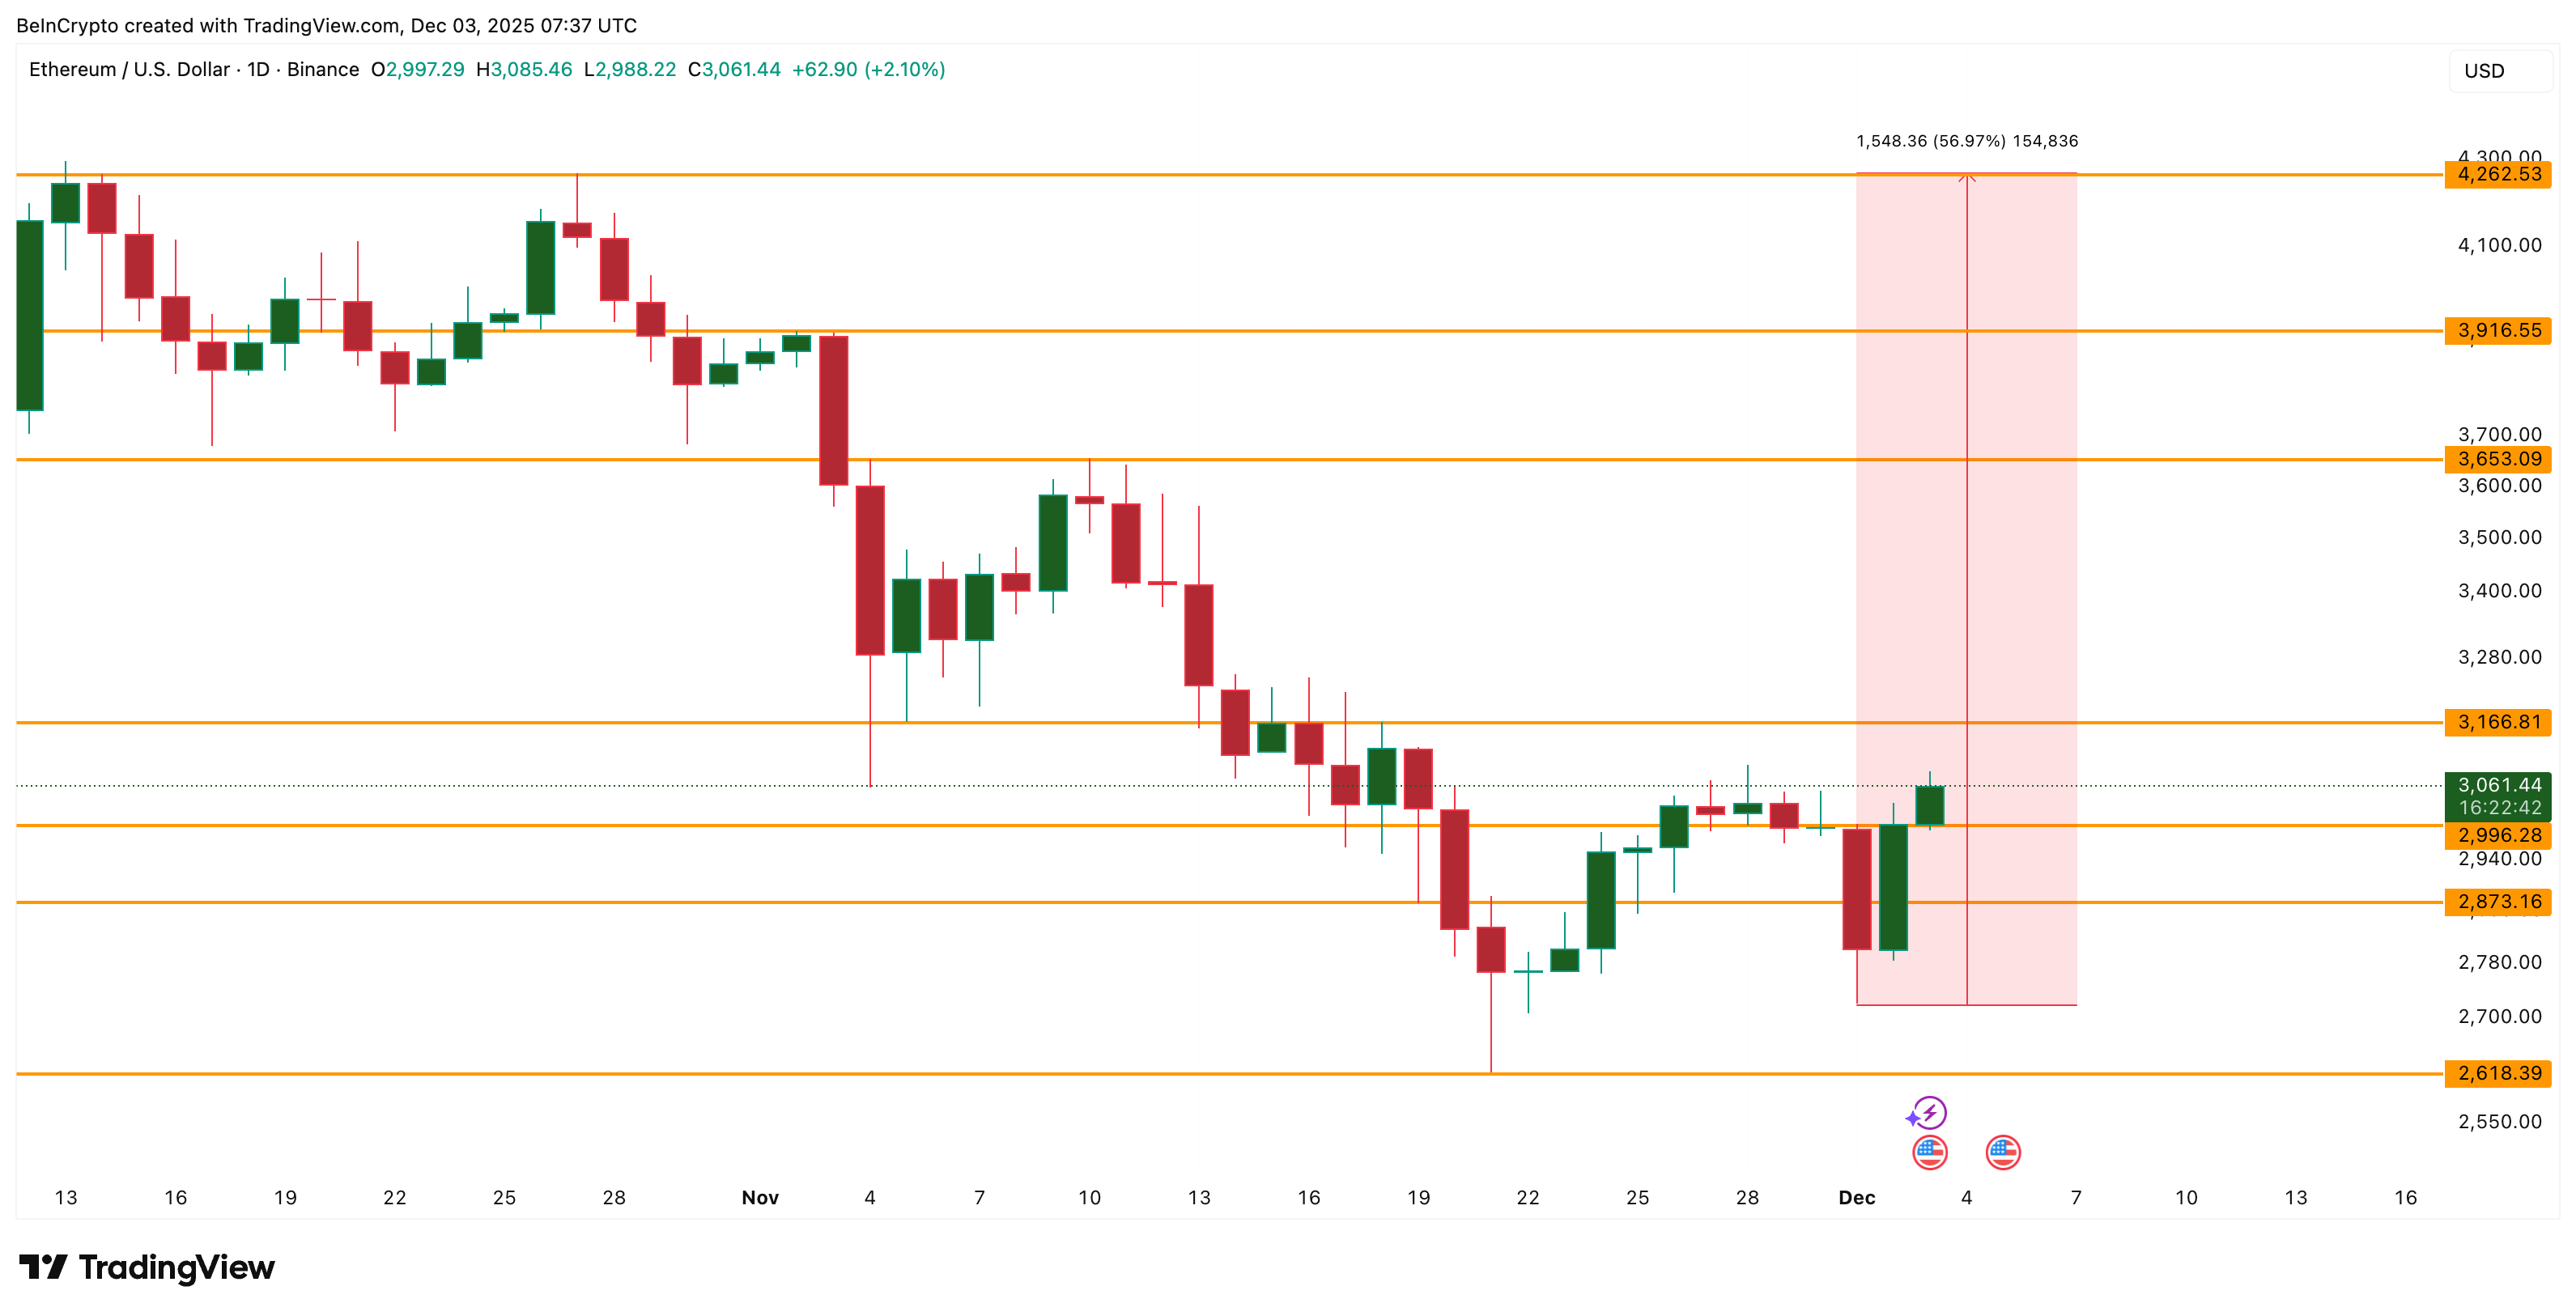
The downside picture is more fragile.

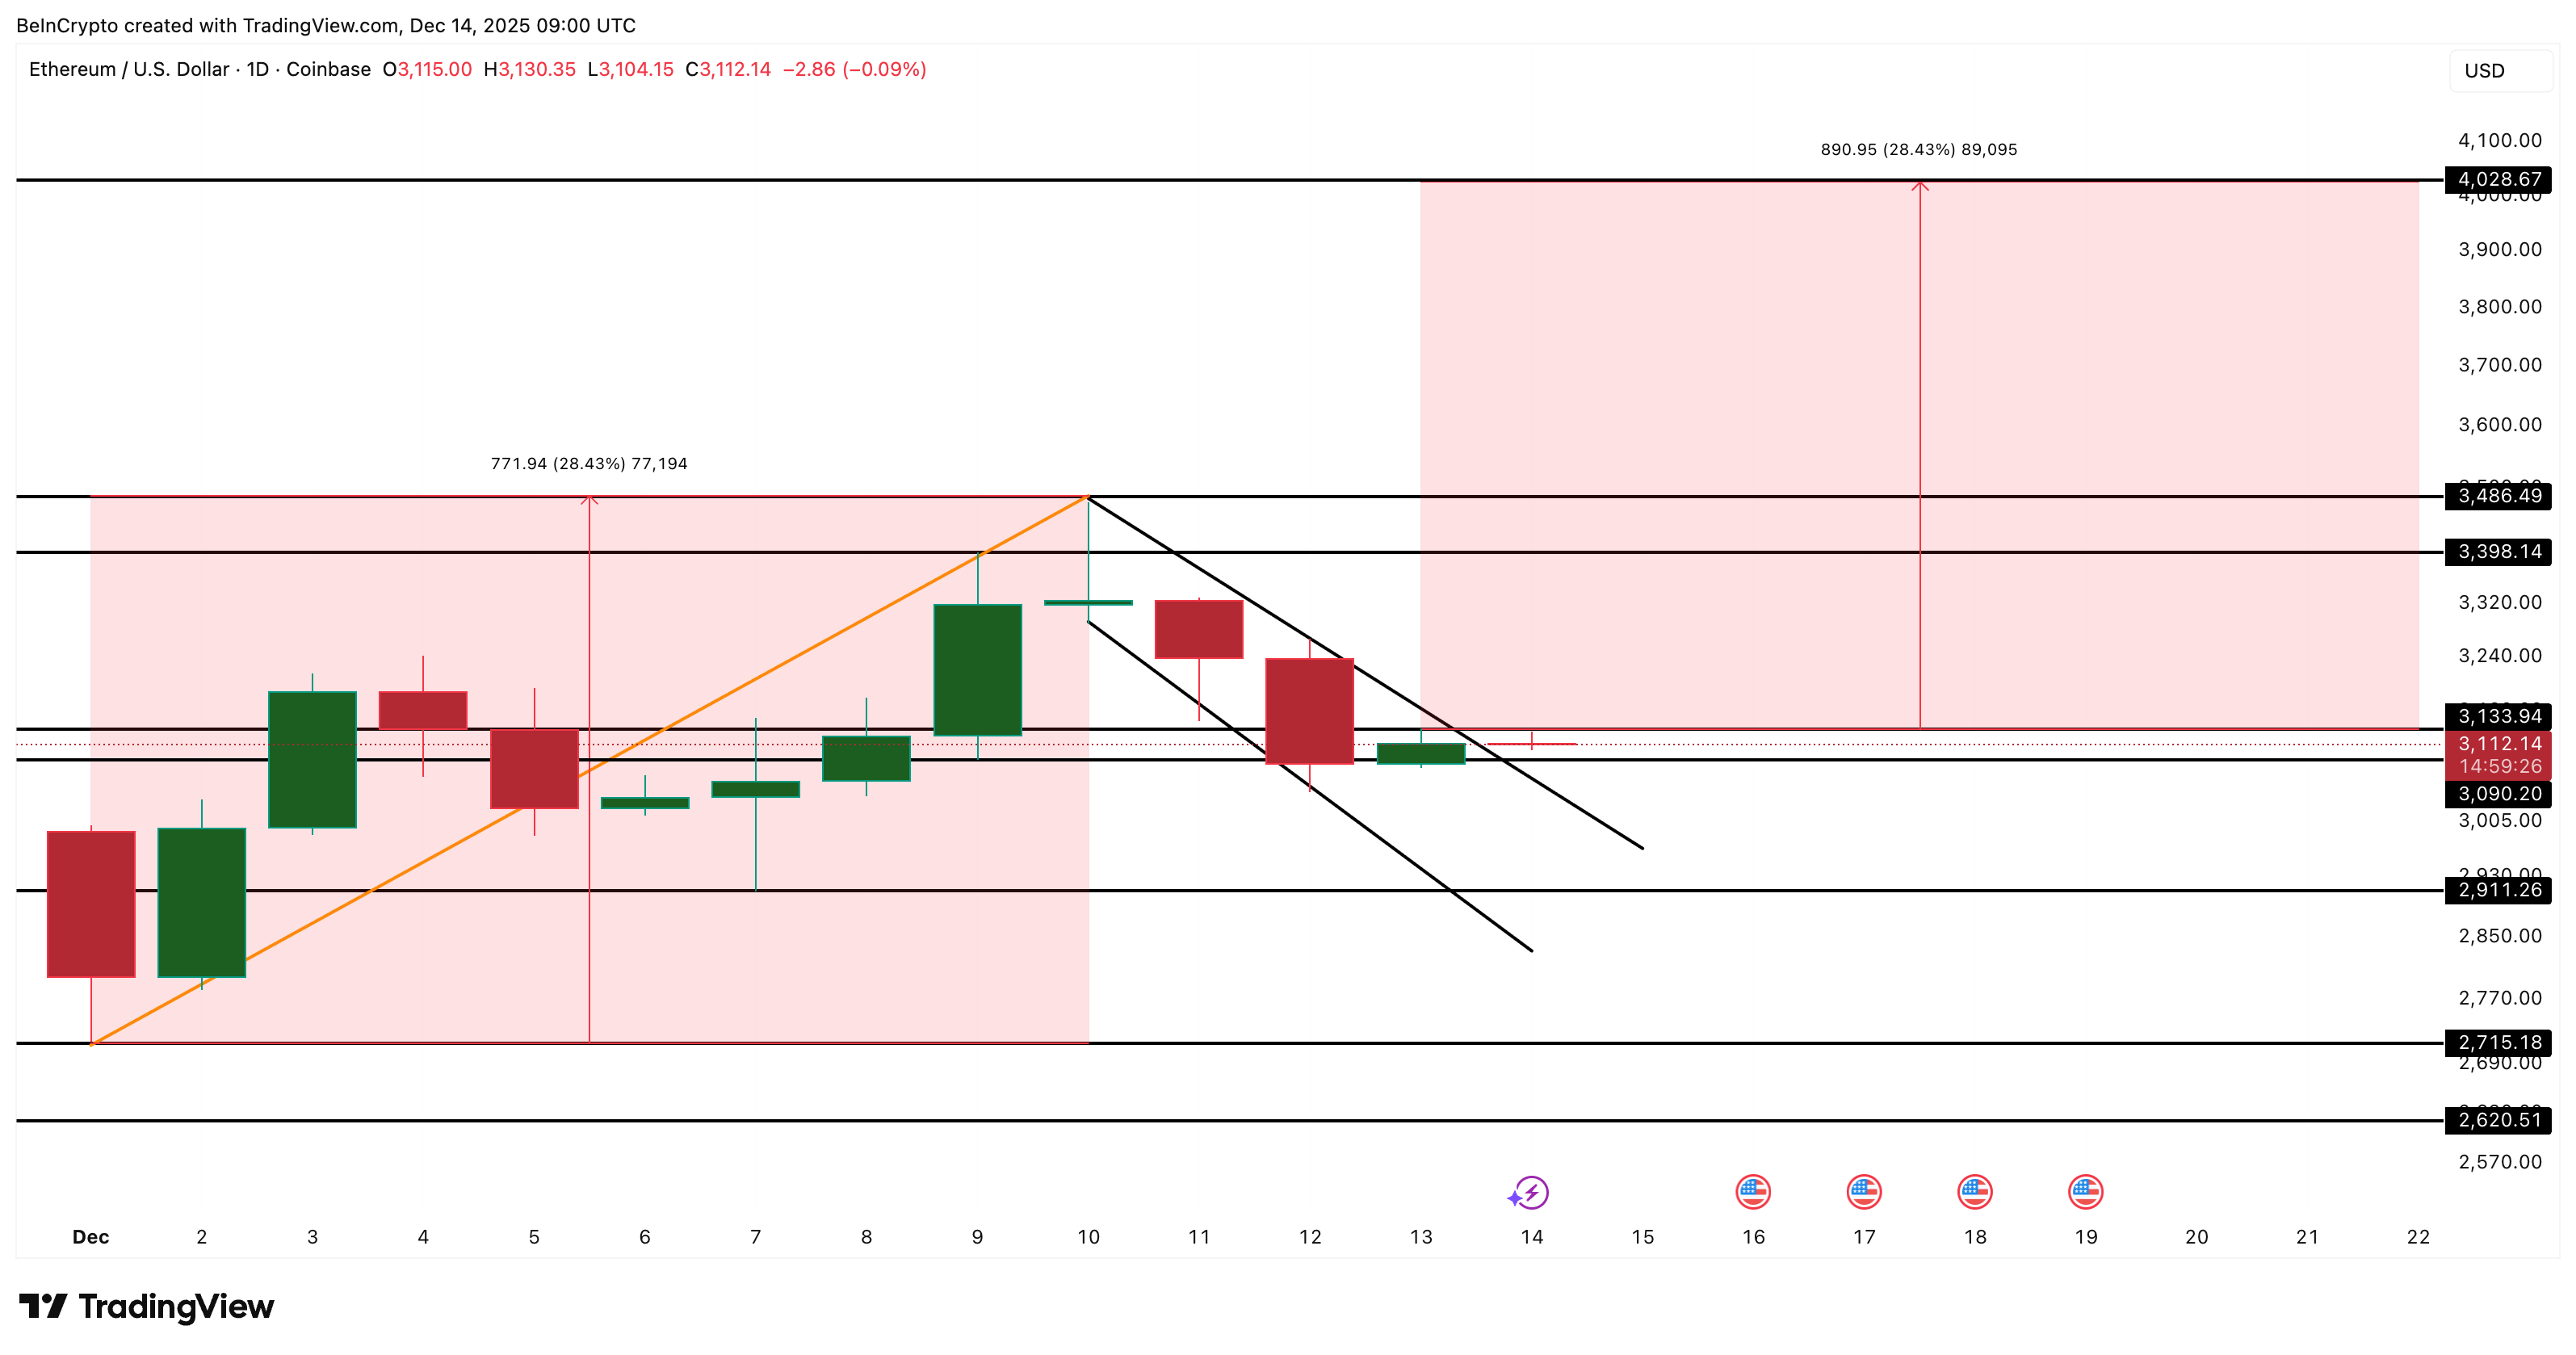
The most important support cluster sits between $2,801 and $2,823. This range has acted as a key demand zone. A clean daily close below $2,801 (which also shows up on the price chart) would be a warning signal.

ETH Support Clusters
ETH Support Clusters: Glassnode

That move would represent barely a 1% downside break, but it could open the door toward $2,617, the next major support level on the chart.

Ethereum Price Analysis
Ethereum Price Analysis: TradingView

This is what makes Ethereum’s current position dangerous. Upside could stall near 11%, but downside risk begins with just a 1% failure.

The post Ethereum Price Nears Possible Breakdown — Yet A Bounce Hope Emerges appeared first on BeInCrypto.

  •  

Ethereum Price Could Be Silently Nearing a Breakout, Here’s Why

Ethereum price action looks quiet, but the entire formation is slowly turning bullish. Over the past 24 hours, ETH has traded almost flat, while the past seven days show a modest 2.6% gain. Price has remained above $3,100 for several sessions, suggesting strength rather than exhaustion.

This sideways move is not random. Ethereum is compressing near key levels, where breakouts often form. The next move depends on whether buyers, who are gradually returning, can turn this consolidation into a continuation.

Bull Flag Structure Holds as the Breakout Zone Appears

Ethereum appears to be breaking out after consolidating inside a bull flag. A bull flag forms when the price pauses after a strong upward move, then trades in a narrow range before the next leg higher. This pattern signals consolidation, not weakness.

The structure remains intact as long as ETH holds above $3,090. That means, unless there is a daily candle close below this level, the much-anticipated breakout might hold.

This level has acted as firm support, absorbing selling pressure during recent pullbacks. Price has repeatedly bounced from this zone, showing buyers are still defending it.

Breakout Setup Forms
Breakout Setup Forms: TradingView

Want more token insights like this? Sign up for Editor Harsh Notariya’s Daily Crypto Newsletter here.

A clean daily close above $3,130 would be the first confirmation that the flag is resolving higher. That move would signal that consolidation is ending and buyers are regaining control. Without that close, Ethereum remains in compression, but the bullish structure stays valid.

Selling Pressure Eases as Key Ethereum Price Levels Emerge

On-chain data support the price structure. Holder Net Position Change, which tracks whether long-term investors are adding or selling ETH, shows that selling pressure has eased compared to earlier sessions.

On December 12, Ethereum holders distributed roughly 958,771 ETH. By December 13, net selling dropped to around 877,958 ETH, marking a decline of roughly 8.4% in selling pressure within 24 hours.

Ethereum Holders Are Selling Fewer Coins
Ethereum Holders Are Selling Fewer Coins: Glassnode

That shift matters. Ethereum is still seeing net distribution, but the pace of selling is slowing as the price compresses near resistance. This behavior typically appears during late-stage consolidation, not during breakdowns.

When selling pressure eases near a key level without price slipping lower, it increases the odds that buyers step in once a breakout confirms. Ethereum is not seeing panic exits. Instead, holders appear more willing to wait.

Ethereum Price Analysis
Ethereum Price Analysis: TradingView

If the Ethereum price secures a daily close above $3,130, the next resistance sits near $3,390. Clearing that zone would open the path toward the $4,000–$4,020 area, aligning with the measured move from the bull flag structure.

However, the bullish structure would weaken if the Ethereum price drops under $3,090 or even $2,910. Closing below the latter would break the pattern completely.

The post Ethereum Price Could Be Silently Nearing a Breakout, Here’s Why appeared first on BeInCrypto.

  •  

Could the Fusaka Upgrade Light the Fuse for a Pectra-Like 56% Ethereum Price Rally?

Ethereum price has climbed over 13% since December 1, helped by a broader market recovery and growing optimism ahead of today’s Fusaka upgrade, which improves how efficiently the network processes transactions. ETH is still down more than 17% over the past month, but the recent bounce and several technical signals look similar to what happened just before the Pectra upgrade in May 2025, when Ethereum rallied 56% in seven days.

The question now is simple: can Fusaka trigger that kind of move again?

Conditions Look Similar to Pectra — And Big Buyers Are Returning

During the Pectra phase (May 6–13), Ethereum surged 56% after flashing standard bullish divergence. That pattern occurs when price makes a lower low, but RSI (Relative Strength Index, a momentum meter from 0–100) makes a higher low. It often signals that sellers are losing control even as the chart still looks weak. More of a trend reversal.

P.S.: The Pectra upgrade dropped on May 7, 2025.

The same setup is forming now.

Between November 4 and December 1, ETH made a lower low, but RSI formed a higher low. That mirrors the exact structure that appeared before the Pectra move.

Want more token insights like this? Sign up for Editor Harsh Notariya’s Daily Crypto Newsletter here.

Price Rally Could Mimic Pectra Era
Price Rally Could Mimic Pectra Era: TradingView

Large holders also show early accumulation.

The number of Ethereum addresses holding at least $1 million has risen from 13,322 to 13,945, a 4.68% increase. Since each wallet holds a minimum of $1 million, this reflects at least $623 million in added capital entering the network’s top tier of holders. Big buyers entering ahead of a major technical upgrade is historically a constructive sign.

BIg Wallets Adding
Big Wallets Adding: Glassnode

Together, the divergence pattern and fresh large-wallet inflows build a case that Fusaka could act as a catalyst — if the key breakout level is cleared.


One Cost-Basis Cluster and One Ethereum Price Level Decide Everything

Whether ETH shows a Pectra-style extension depends on clearing a single supply wall. Glassnode’s Cost Basis Distribution reveals the heaviest near-term supply cluster between $3,154 and $3,179, where about 2.76 million ETH sits. This aligns almost perfectly with the chart’s resistance at $3,166 (a strong resistance and support line).

Key ETH Price Cluster
Key ETH Price Cluster: Glassnode

A clean daily Ethereum price candle above $3,166 would:

• show buyers have almost absorbed the largest supply zone

• open room for a push toward $3,653

If momentum mirrors the Pectra structure, a 56% extension from December’s lows would target roughly $4,262, which also matches a strong historical ceiling.

Ethereum Price Analysis
Ethereum Price Analysis: TradingView

On the downside, ETH’s structure weakens below $2,996. Losing that range exposes $2,873, and if selling pressure expands, $2,618 becomes the deeper support to watch for the Ethereum price.

The post Could the Fusaka Upgrade Light the Fuse for a Pectra-Like 56% Ethereum Price Rally? appeared first on BeInCrypto.

  •  

Ethereum Breaks Down From Key Pattern, Opening a Path Toward 28% Crash

Ethereum price has dropped more than 6% in the past 24 hours and is now down about 27% over the last 30 days. A breakdown from a major continuation pattern has opened the door to a much deeper decline. At the same time, an on-chain signal is flashing a possible 28% downside window that aligns with what could become Ethereum’s next cycle bottom if conditions worsen.

Together, these signals show that ETH may not be done correcting yet.


One Long-Term Metric Shows Room to Fall?

Ethereum recently broke down from a clean bear flag. The move began after ETH failed at $2,990 and slipped out of the rising channel it had been trading within for a week. The earlier sell-off created the “pole,” a drop of 28.39%, and the breakdown activates a measured target around $2,140, which sits almost exactly 28% below the breakdown level.

Ethereum Breaks Down
Ethereum Breaks Down: TradingView

Want more token insights like this? Sign up for Editor Harsh Notariya’s Daily Crypto Newsletter here.

To see if this target makes sense, we compare it with long-term holder NUPL. Long-term holder NUPL measures how much profit long-term holders are sitting on.

NUPL has been trending down since August 22, suggesting long-term holders are reducing unrealized profits and softening their conviction. The latest short-term low was 0.36 on Nov 21, but the six-month low sits at 0.28, recorded on June 22, which is a difference of roughly 22%.

Back on June 22, when NUPL hit 0.28, ETH traded near $2,230, and the market reversed sharply. From there, Ethereum rallied all the way to $4,820, a gain of 116% from that bottom.

New Bottom Zone Forming
New Bottom Zone Forming: Glassnode

Today, if NUPL were to retest that 0.28 cycle-low band again, the implied price drawdown from ETH’s recent local high near $2,990 would be in the same 20–25% range, which aligns exactly with the 28% bear-flag target at $2,140.

This is the cleanest overlap in the entire analysis: Both the price pattern and the long-term holder metric point to the same lower zone.


Ethereum Price Sits on Its Strongest Cost-Basis Wall

The next step is to see whether the Ethereum price chart supports the same conclusion. The Cost Basis Distribution Heatmap shows where large clusters of ETH were recently accumulated. The heaviest band sits between $2,801 and $2,823, with 3,591,002 ETH bought in that zone. This is the strongest support Ethereum has right now.

One Last Supply Wall Sits
One Last Supply Wall Sits: Glassnode

ETH has already broken below the $2,840 price level, increasing pressure on this cost-basis wall. If the ETH price cannot reclaim $2,840 quickly and close above $2,990 again, sellers remain in full control.

If weakness continues, the next levels on the trend-based extension appear one after another. The first point is $2,690, which sits about 4.5% below the current price. If that fails, the decline can extend to $2,560 (a further 4.6% drop), $2,440 (another 4.8%), and $2,260, which is just 2% above the June NUPL-bottom price of $2,230.

Below all of these sits $2,140, the full breakdown target, about 28% below the breakdown zone and fully aligned with the flag projection.

Ethereum Price Analysis
Ethereum Price Analysis: TradingView

If ETH falls through $2,266, the bear-flag target becomes the most realistic scenario.

There is still an invalidation path, but it requires strength at several layers. ETH must regain $2,840, then break above $2,990, and then secure a close above $3,090. The entire bearish pattern loses meaning only if ETH pushes through $3,240, which would be a roughly 15% move up from current levels.

For now, ETH trades beneath its strongest cost-basis wall, long-term holders are still reducing unrealized profit, and the continuation structure points clearly lower. If these conditions hold, the $2,260–$2,140 region becomes the most probable area where Ethereum could form its next cycle bottom.

The post Ethereum Breaks Down From Key Pattern, Opening a Path Toward 28% Crash appeared first on BeInCrypto.

  •  

Ethereum Price Chart Flashes a Bearish Warning — Could This Be a ‘Long-Term’ Risk?

Ethereum price trades around $3,000, but the chart and on-chain data both indicate a pressure zone that traders cannot ignore. Momentum looks unstable, as one key holder group continues to sell.

The Ethereum price is stuck at a point where even slight shifts can alter the entire structure.

Momentum Weakens as Long-Term Sellers Step In

The ETH price has attempted to recover over the past week, rising approximately 10%, but the broader trend remains down 23% over the last 30 days. The bounce looks healthy on the surface, yet the behavior underneath the chart tells a different story.

The RSI, or Relative Strength Index, measures momentum. A hidden bearish divergence has formed between November 18 and November 28.

The Ethereum price made a higher low, but momentum made a higher high. When this happens during a downtrend, it often signals a weak rebound and that sellers still control the trend.

Ethereum Price Action
Ethereum Price Action: TradingView

Want more token insights like this? Sign up for Editor Harsh Notariya’s Daily Crypto Newsletter here.

Who are those sellers? On-chain data gives the answer.

Hodler Net Position Change — which shows whether long-term holders are adding or removing ETH — has stayed deep in red for the entire month. Red readings mean long-term wallets are sending ETH back toward exchanges.

Over the last week, that pressure has increased sharply. On November 22, long-term holders offloaded about 334,600 ETH, but by November 28 the figure had grown to roughly 973,000 ETH — a rise of about 191% in six days.

There was also a local spike near 1.1 million ETH on November 26. This steady increase in weekly outflows indicates that the cohort that typically stabilizes the market is now leaning more heavily towards the sell side.

Long-Term Cohort Selling
Long-Term Cohort Selling: Glassnode

Momentum softening and long-term selling happening together give ETH a clear downside risk.

Ethereum Price Sits at a Tight Break Point

The Ethereum price is also closing in on the edge of a pennant structure. This can break either way.

ETH now trades right above the $3,016 support zone, which lines up with the 0.382 Fibonacci level. If this floor breaks, the next levels sit at $2,864, a 5% dip. A deeper slide could open $2,619, especially if long-term selling continues.

Ethereum Price Analysis
Ethereum Price Analysis: TradingView

To cancel the bearish setup, ETH must push above $3,138. That level breaks the upper pennant trendline and flips the short-term bias. Without that break, the chart remains vulnerable.

Pennants can technically break either way, but the RSI setup and long-term selling tilt the Ethereum price risk toward a downside break unless buyers step in soon.

The post Ethereum Price Chart Flashes a Bearish Warning — Could This Be a ‘Long-Term’ Risk? appeared first on BeInCrypto.

  •