Reading view

Apa yang Crypto Whale Beli setelah Pemotongan Suku Bunga FOMC Desember

Pasar aset kripto masih dalam tekanan setelah pertemuan FOMC terbaru. The Federal Reserve melakukan pemangkasan suku bunga sebesar 25 bps untuk ketiga kalinya tahun ini, namun nada yang disampaikan setelahnya justru lebih hati-hati daripada ekspektasi. Risiko inflasi dan sinyal pertumbuhan yang melambat membuat harga mayoritas aset utama tetap lesu. Meski terjadi koreksi ini, crypto whale justru diam-diam menambah jumlah aset mereka.

Mereka fokus membeli tiga token yang mulai menunjukkan tanda rebound atau pola breakout lebih awal.

Aster (ASTER)

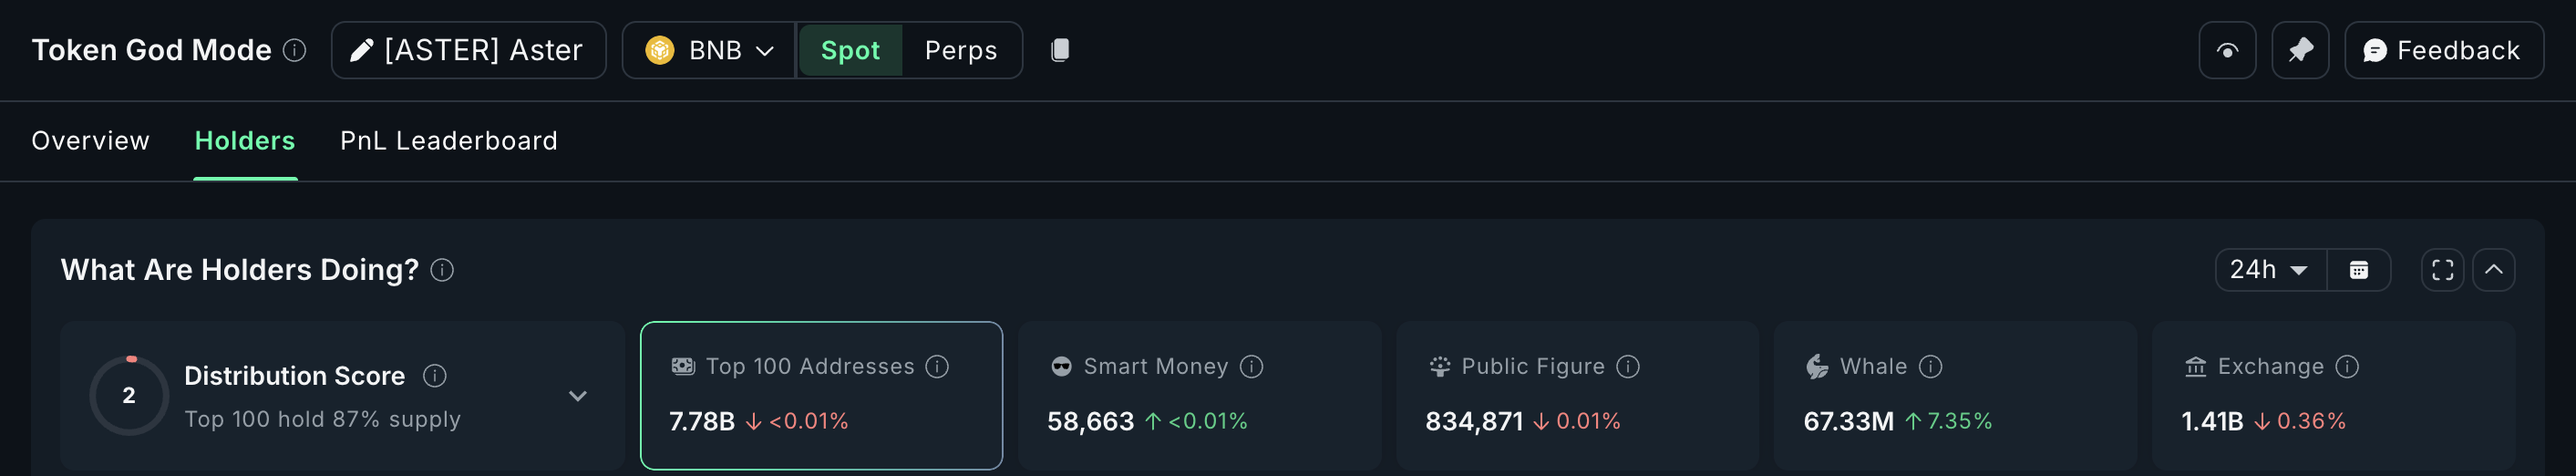
Harga Aster turun hampir 4% selama 24 jam terakhir dan memperpanjang kerugian bulanan menjadi sekitar 14%. Namun para whale justru bergerak berlawanan arah.

Kepemilikan mereka naik 7,35% dalam satu hari terakhir, dengan tambahan sekitar 4,59 juta ASTER atau setara dengan US$4,22 juta berdasarkan harga saat ini. Yang menarik, ASTER adalah salah satu koin langka yang mencatat aksi beli whale sebelum maupun setelah keputusan FOMC.

Aksi beli ini menjadi menonjol karena grafik memperlihatkan pola teknikal yang sepertinya menjadi alasan whale masuk ke pasar.

Aster Whales
Whale Aster | Sumber: Nansen

Ingin insight token lain seperti ini? Daftar ke Newsletter Harian Crypto Editor Harsh Notariya di sini.

Antara 3 November dan 11 Desember, harga ASTER membentuk higher low, sementara RSI membentuk lower low. RSI, atau Relative Strength Index, mengukur kekuatan beli dan jual. Ketika harga naik tapi RSI turun, ini membentuk hidden bullish divergence. Biasanya, sinyal ini menandakan tekanan jual mulai menurun, meskipun secara visual grafiknya masih terlihat lemah.

Aster juga menunjukkan pola yang sama antara 3 November hingga 1 Desember. Divergensi ini memicu kenaikan hampir 22%. Pola yang muncul saat ini juga mirip, sehingga para whale mungkin tengah bersiap menyambut rebound serupa.

ASTER Price Analysis
Analisis Harga ASTER | Sumber: TradingView

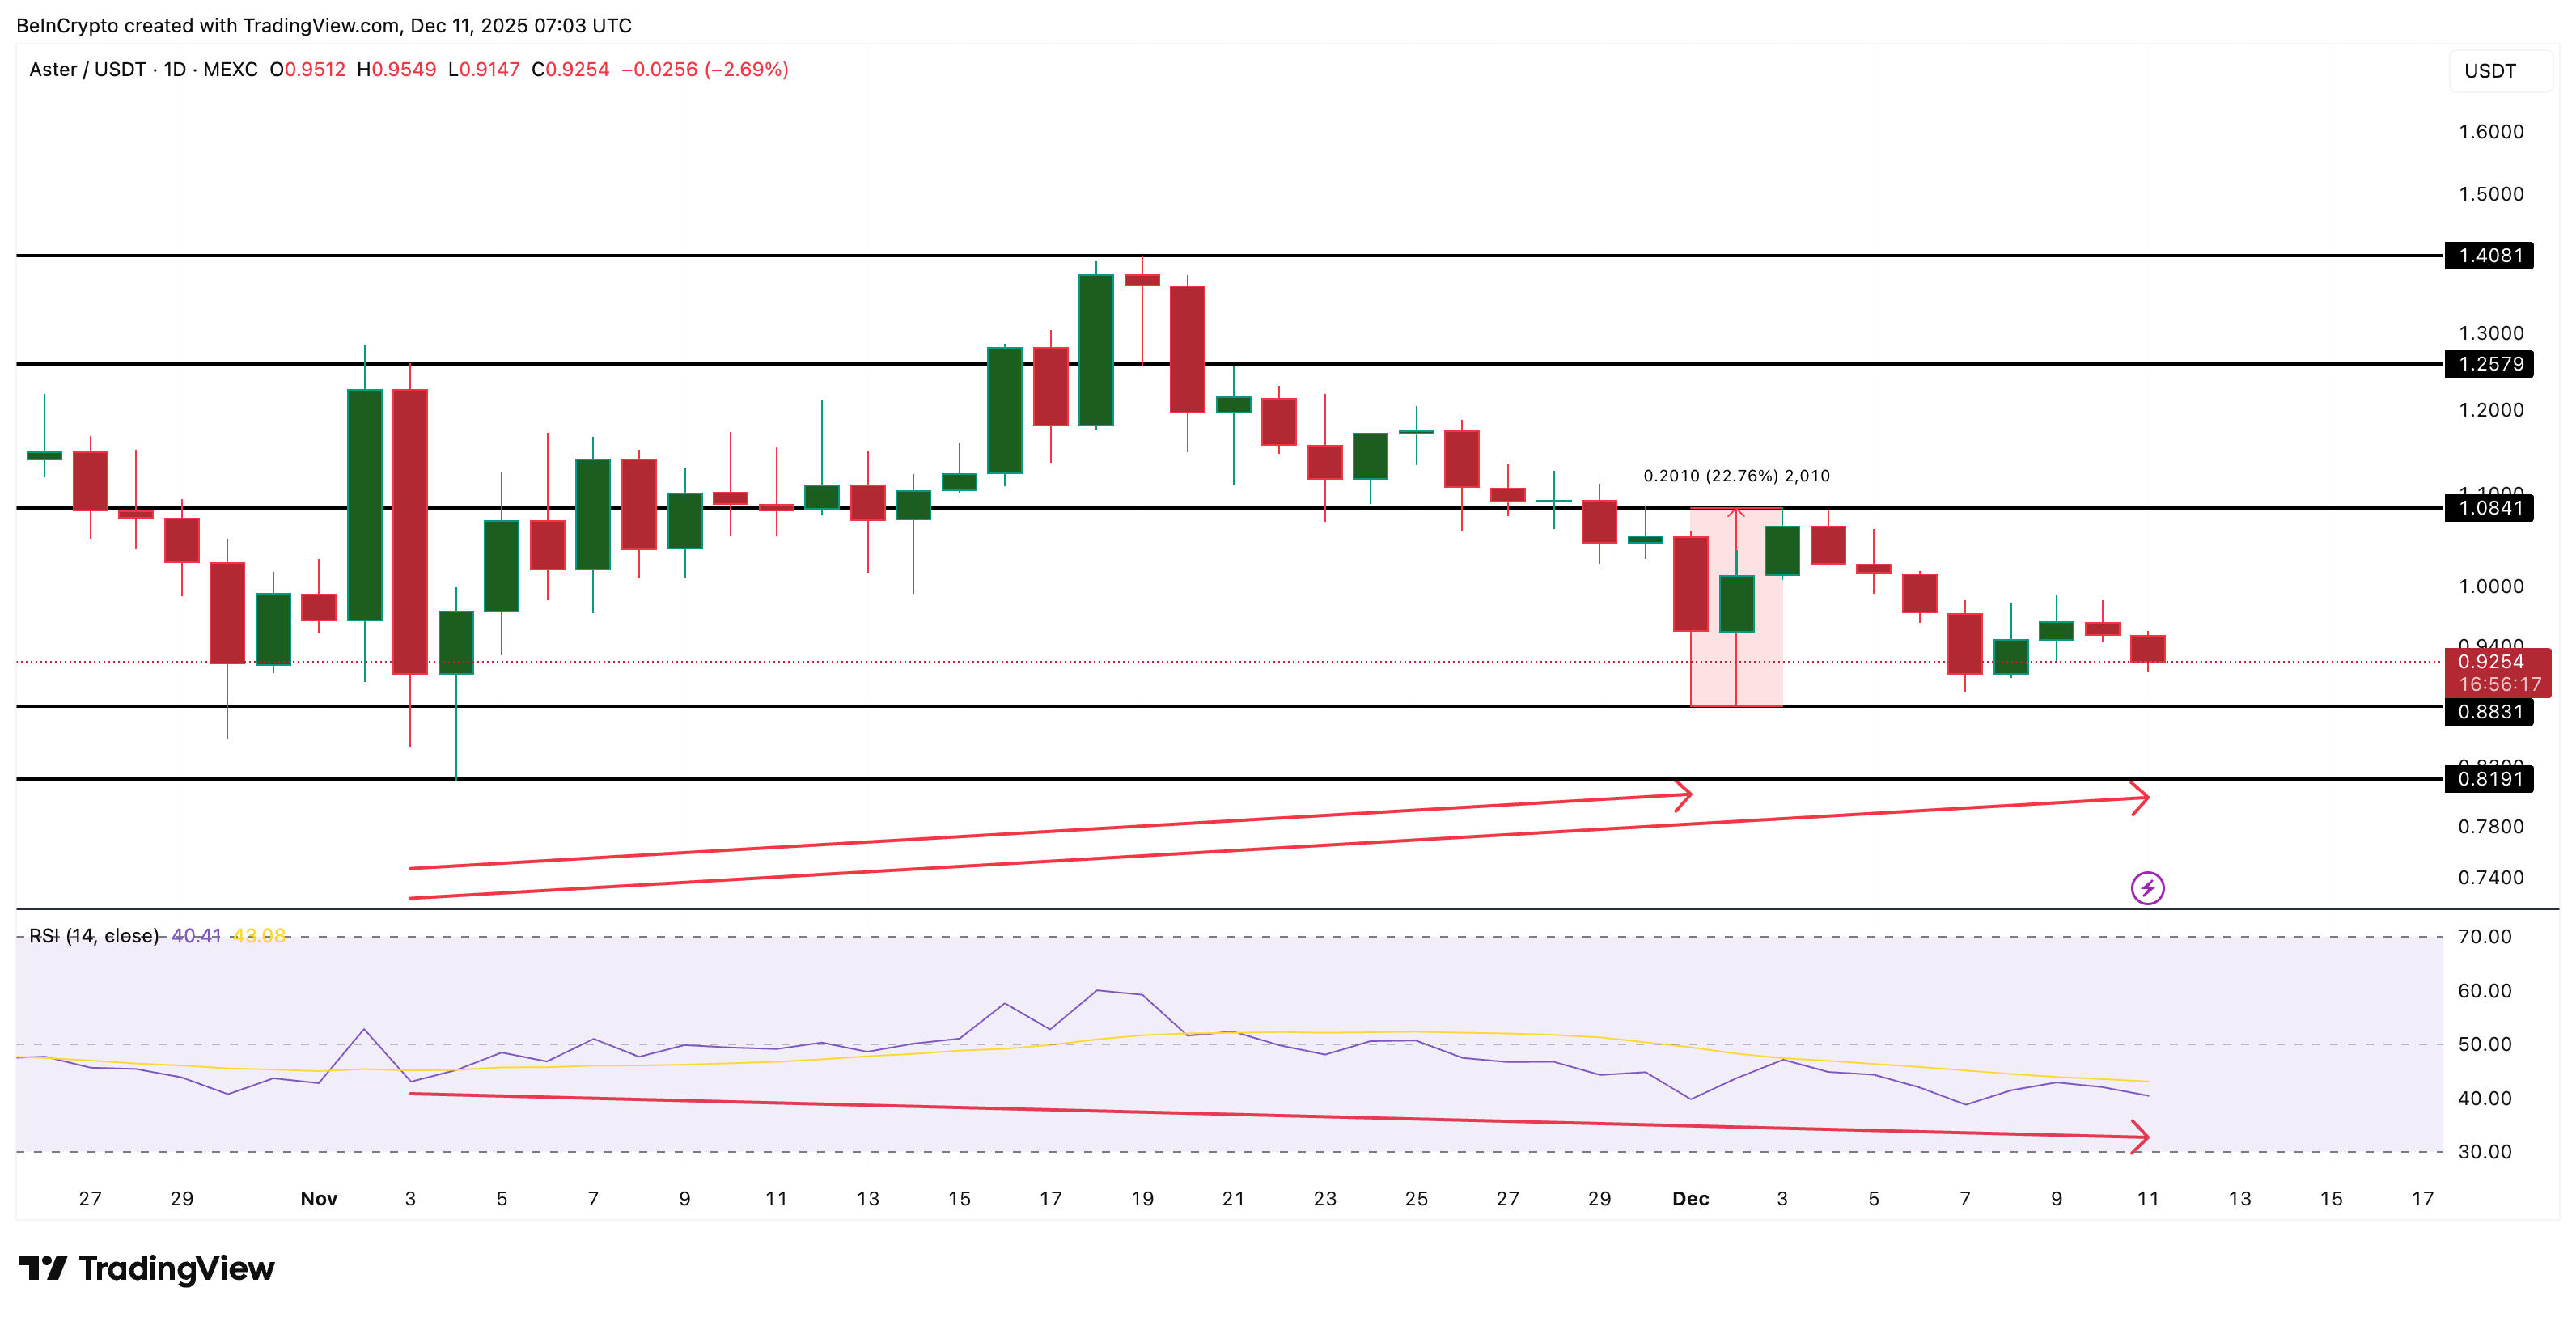
Untuk melanjutkan penguatan, Aster perlu menutup harian secara bersih di atas US$1,08, level di mana pantulan sebelumnya tertahan. Jika berhasil break di level itu, harga bisa menuju US$1,25 dan US$1,40 yang menjadi resistance berikutnya.

Namun jika strukturnya melemah, batas bawahnya juga jelas. Penutupan harian di bawah US$0,88 akan membatalkan struktur naik dan juga bisa melemahkan keyakinan para whale. Jika jebol support itu, ASTER bisa kembali ke area US$0,81 atau bahkan lebih rendah.

Maple Finance (SYRUP)

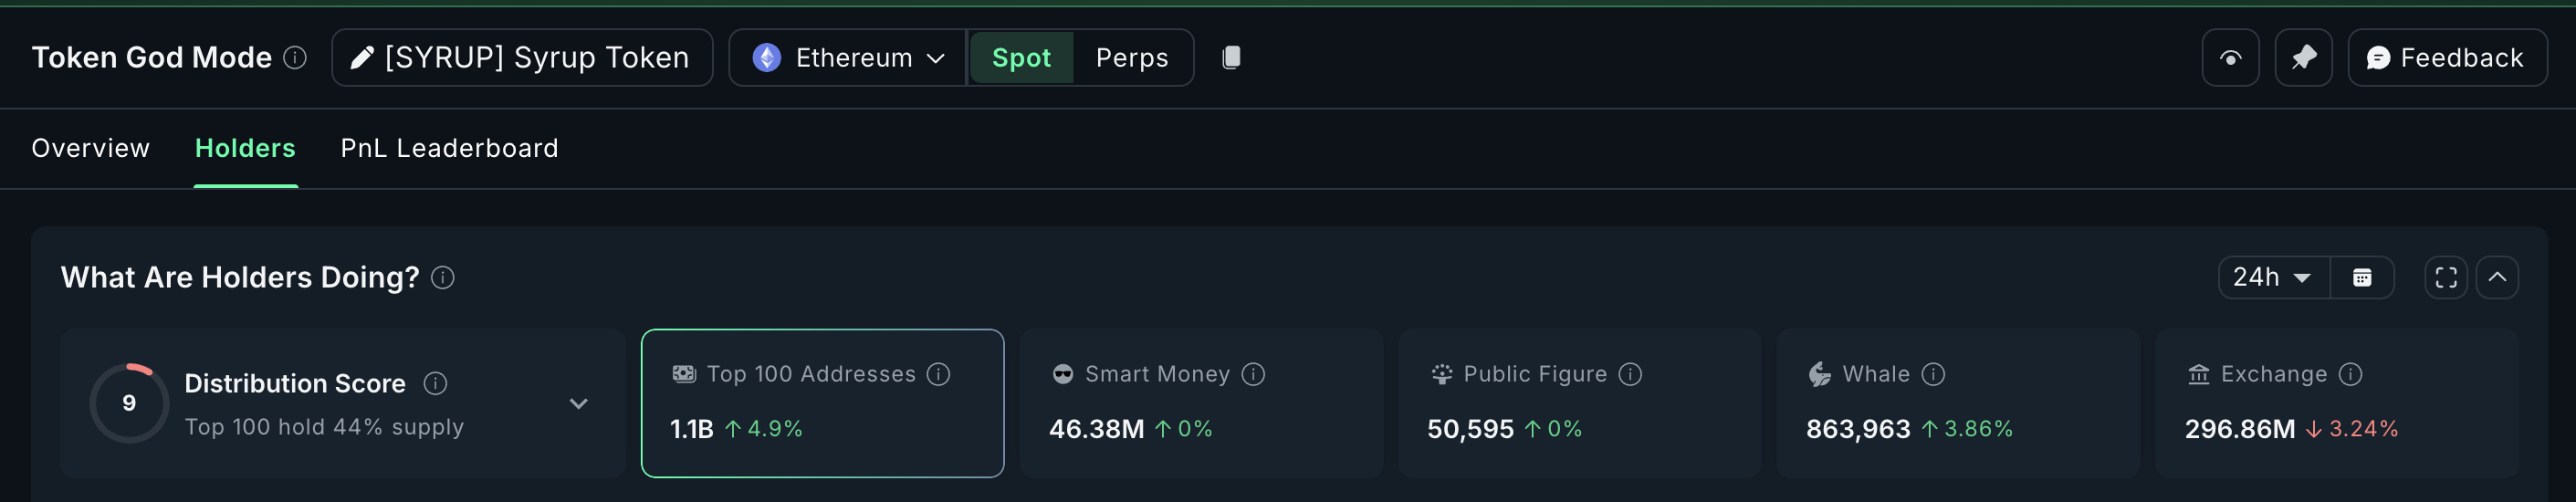
Maple Finance (SYRUP) masih melemah sekitar 2,2% selama 24 jam terakhir dan nyaris 40% sebulan ini. Meski begitu, para crypto whale tetap terus menambah posisi. Wallet whale normal menaikkan kepemilikan 3,86% dalam sehari, sementara mega whale menambah 4,9% sehingga total memegang 1,1 miliar SYRUP.

Kenaikan 4,9% tersebut menandakan mega whale menambah sekitar 51,4 juta SYRUP, setara dengan US$14,4 juta dengan harga sekarang. Akumulasi baru ini terjadi sehabis nada hawkish tipis dari FOMC, yang membuat aksi beli ini makin menarik.

Maple Finance Whales
Whale Maple Finance | Sumber: Nansen

Para whale terlihat berharap level support US$0,23 tetap bertahan. SYRUP sudah beberapa kali menyentuh area ini sejak awal Desember. Support tersebut belum pernah tertembus, yang kemungkinan menjadi alasan whale masuk. Token ini bergerak di rentang lebar US$0,23 sampai US$0,31, dengan uji support terakhir pada 4 Desember.

Momentum memberi dorongan jangka pendek. Antara 9 Desember sampai 11 Desember, harga membentuk lower low sementara RSI membentuk higher low. RSI mengukur kekuatan beli dan jual. Jika harga turun namun RSI naik, terbentuk bullish divergence. Di time frame rendah, biasanya sinyal ini menandakan potensi pantulan di tengah tren turun yang lebih besar.

SYRUP Price Analysis
Analisis Harga SYRUP | Sumber: TradingView

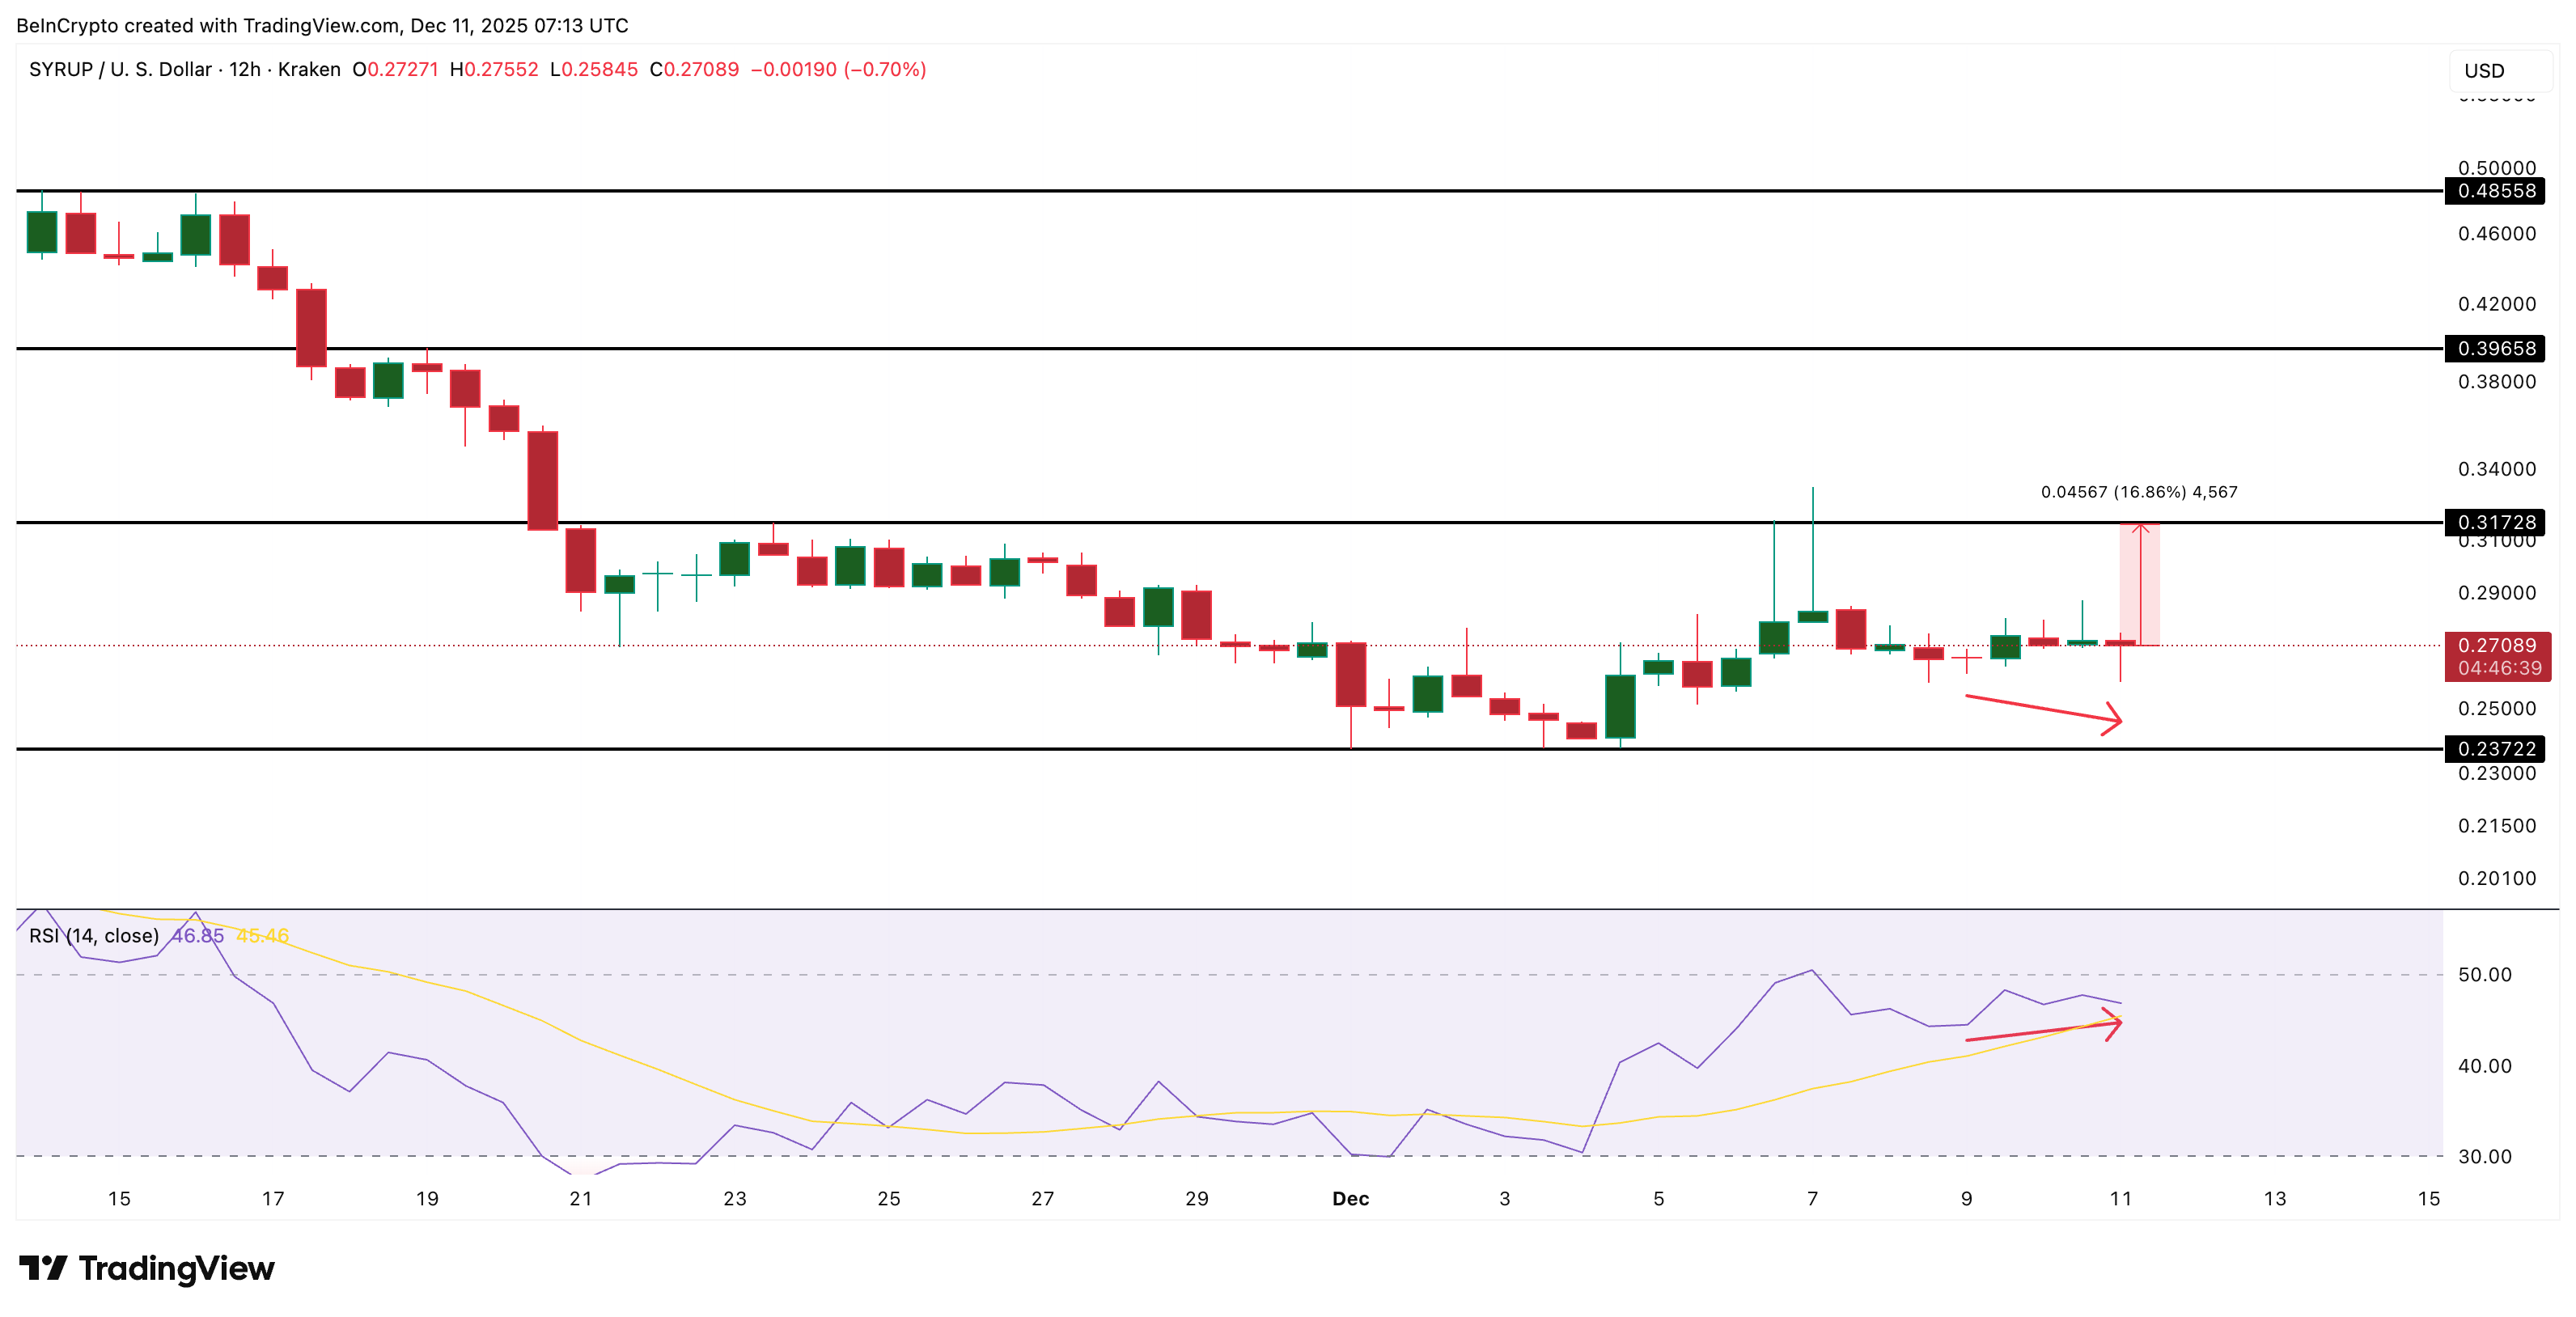
Jika pantulan terjadi, target awal adalah US$0,31, batas atas yang selama ini menahan kenaikan sejak 6 Desember. Break bersih di atas US$0,31 membuka jalan menuju US$0,39 dan US$0,48.

Tapi jika harga SYRUP jatuh ke bawah US$0,23, keyakinan whale akan melemah. Koreksi di bawah area ini berisiko membuka potensi penurunan lebih jauh dan kemungkinan mengulang pola pergerakan harga.

Pudgy Penguins (PENGU)

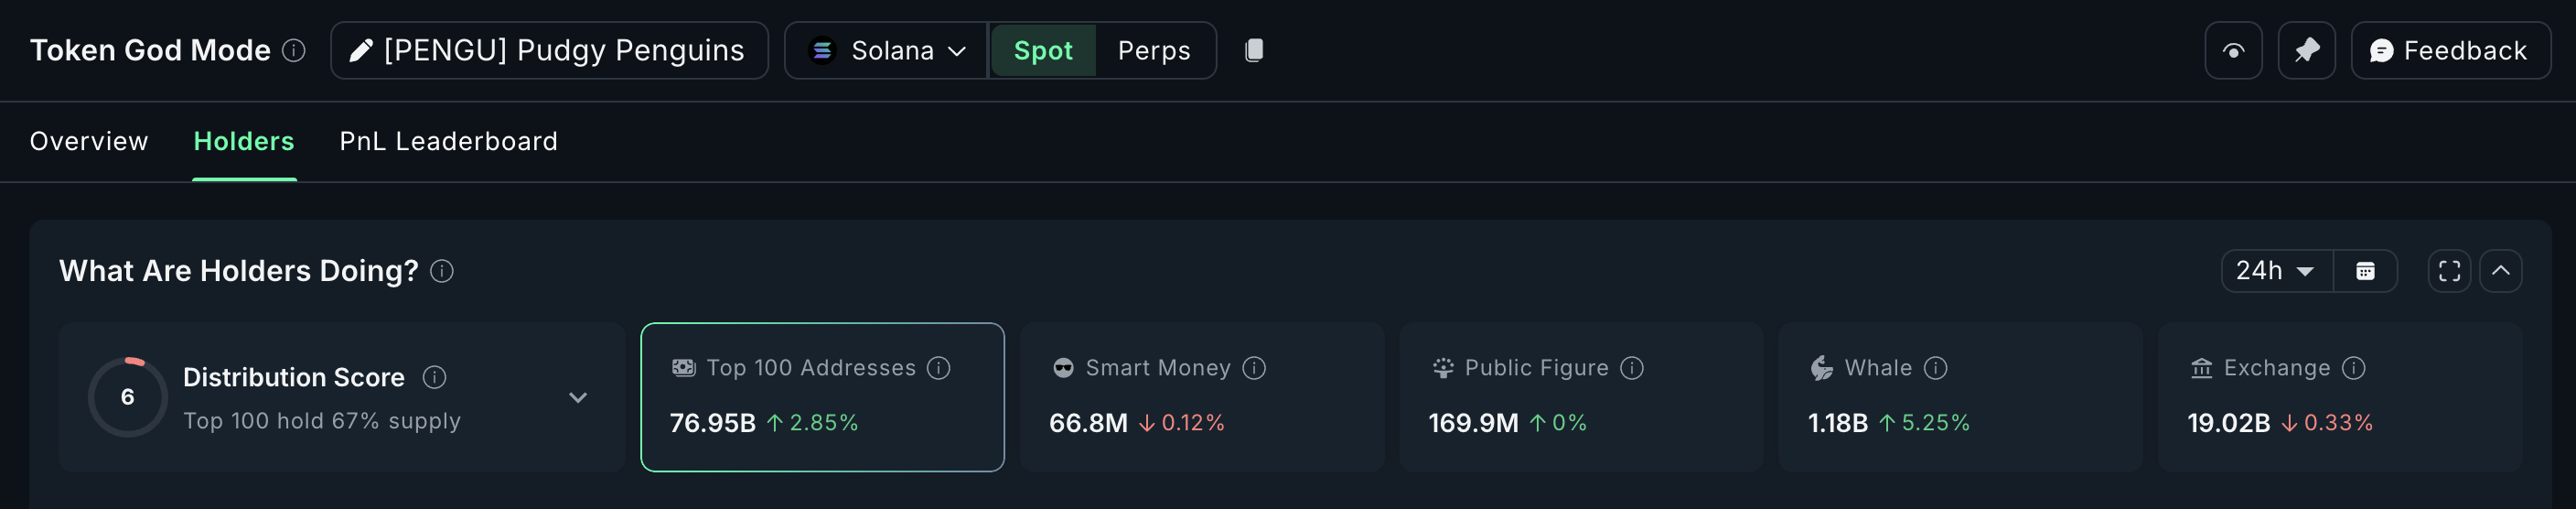
Pudgy Penguins turun hampir 10% dalam 24 jam terakhir, tapi para crypto whale tetap membeli saat harga turun. Wallet whale menambah kepemilikannya sebesar 5,25%, sehingga total simpanannya jadi 1,18 miliar PENGU. Peningkatan ini berarti whale menambah sekitar 58,9 juta PENGU.

100 alamat teratas, atau mega whale, juga menunjukkan akumulasi yang konsisten. Kepemilikan mereka naik 2,85% dalam sehari terakhir, dan sekarang total simpanan mereka mencapai 76,95 miliar PENGU. Ini berarti ada tambahan sekitar 2,13 miliar token, dengan nilai mendekati US$21,3 juta jika mengikuti harga hari ini. Untuk token yang baru saja turun dua digit, pola belanja serentak dari whale dan mega whale seperti ini termasuk langka.

PENGU Holders
Holder PENGU | Sumber: Nansen

Grafik harga PENGU menjelaskan kenapa para whale tetap mengoleksi token ini. Pudgy Penguins sedang membentuk pola inverse head and shoulders di timeframe harian. Ini adalah setup bullish reversal yang sering muncul ketika tren turun mulai kehilangan tekanan. Neckline berada di sekitar US$0,014, dan karena miring ke atas, ini menjadi sinyal bahwa struktur pembeli semakin membaik bahkan sebelum breakout terjadi.

Whale mungkin sedang memasang strategi untuk menanti breakout itu. Jika PENGU bisa ditutup di atas US$0,014, maka dari tinggi pola ini diperkirakan akan bergerak sekitar 35% ke atas, sehingga target kenaikannya ada di sekitar US$0,019. Inilah kemungkinan alasan kenapa para pemilik wallet besar masuk meskipun harga sedang lemah.

Analisis Harga PENGU | Sumber: TradingView

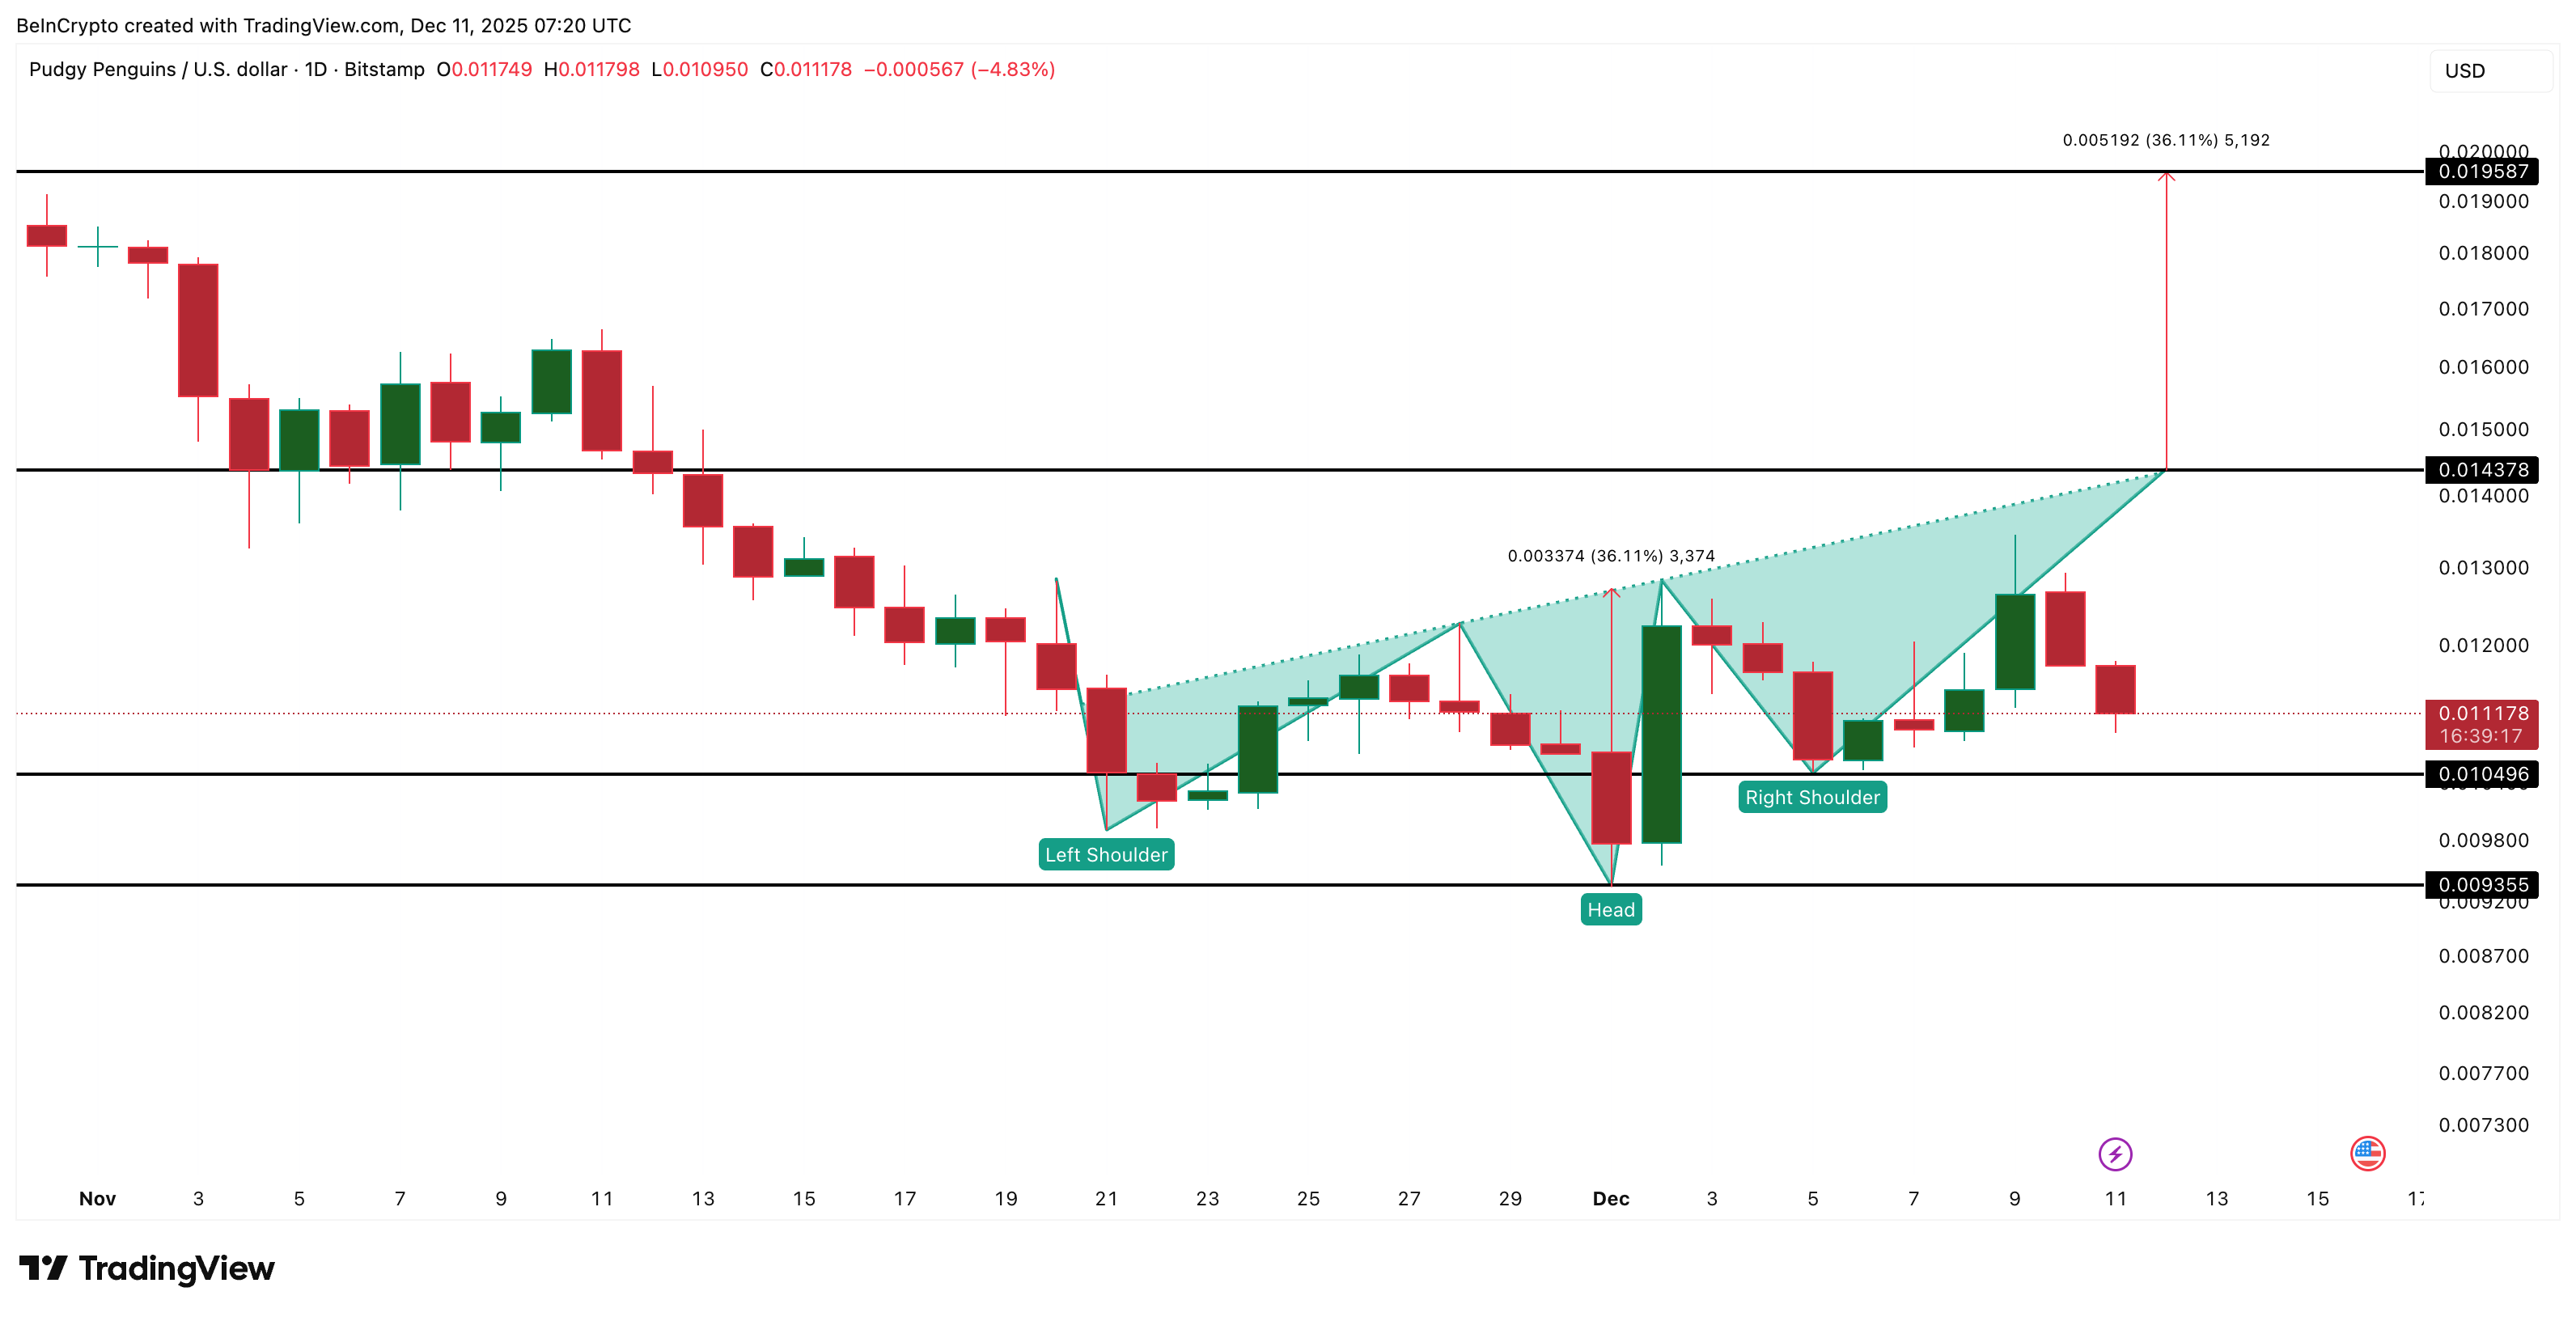
Pola ini juga punya level invalidasi yang jelas. Jika Pudgy Penguins turun di bawah US$0,010, setup-nya jadi melemah. Penurunan di bawah US$0,009 benar-benar membatalkan pola dan menghapus proyeksi bullish. Untuk saat ini, selama PENGU bertahan di atas US$0,010, pola inverse head and shoulders masih berlaku, dan para crypto whale terlihat siap menyambut kemungkinan breakout.

  •  

Apakah Harga XRP Memberi Sinyal Bounce? 3 Petunjuk Ini Bisa Jadi Tanda Bounce Kali Ini Akan Bertahan

Harga XRP sudah menguji kesabaran selama berminggu-minggu. Koin ini turun sekitar 18% selama satu bulan terakhir dan hampir 4% dalam 24 jam terakhir. XRP lebih banyak bergerak di dalam rentang yang sempit, sehingga beberapa minggu terakhir terasa datar dan membuat frustrasi.

Tapi pergerakan terbaru menunjukkan sesuatu yang sebelumnya belum muncul. Sinyal pada grafik serta perubahan sikap holder sekarang menunjuk ke peluang rebound yang mungkin akhirnya didukung cukup kuat untuk bertahan.

Sinyal Baru Menunjukkan Pembeli Mungkin Mulai Kembali

XRP telah diperdagangkan antara US$2,28 dan US$1,98 sejak akhir November. Rentang ini menunjukkan pembeli dan penjual saling imbang. Tapi di bagian bawah rentang ini, muncul sesuatu yang baru. Harga menyentuh garis bawah dari pola segitiga simetris. Segitiga simetris ini terjadi saat pembeli dan penjual sama-sama melambat, yang sering menjadi sinyal akan ada pergerakan agresif.

Petunjuk kuat pertama muncul dari tren volume. Antara 6 Desember sampai 11 Desember, harga mencatat level terendah baru, tapi On-Balance Volume (OBV) justru mencatat level terendah yang lebih tinggi.

Divergensi Mengisyaratkan Rebound XRP | Sumber: TradingView

Ingin wawasan token seperti ini? Daftar Newsletter Crypto Harian Editor Harsh Notariya di sini.

OBV mengukur apakah volume mengalir masuk atau keluar dari koin. Saat harga turun tapi OBV naik, ini menunjukkan akumulasi yang tersembunyi. Biasanya, ini mengindikasikan ada yang membeli di tengah penurunan meski grafik terlihat lemah. Inilah tanda pertama bahwa percobaan rebound bisa muncul.

Kombinasi antara support segitiga dan divergence OBV ini memberikan sinyal tekanan beli sudah mulai muncul kembali.

Mengapa Reli Ini Bisa Bertahan jika Tekanan Jual Terus Melemah

Rebound yang bersih, jika terjadi, juga butuh tekanan jual yang lebih rendah. Holder jangka panjang, biasanya kelompok terkuat di koin apapun, saat ini memangkas penjualan secara tajam. Pada 3 Desember, mereka memindahkan 101.083.156 XRP keluar. Tapi pada 10 Desember, jumlah itu turun menjadi 51.157.301 XRP. Ini sekitar 49% lebih rendah. Mereka masih menjadi penjual bersih, tapi tekanan jual sudah jelas mulai berkurang.

Holder HODL Kurangi Penjualan Koin | Sumber: Glassnode

Petunjuk ketiga, yang paling menarik, berasal dari wallet dengan pergerakan tercepat. Para holder XRP jangka pendek ini sering menjual setiap kali terjadi rebound, sehingga bisa mematikan momentum. Tapi kali ini, mereka justru mengurangi suplai. Hal ini terlihat dari metrik HODL waves, yang memperlihatkan jumlah suplai berdasarkan umur kepemilikan.

Kelompok pemilik 24 jam memegang 1,89% suplai pada 2 Desember. Lalu, per 10 Desember, itu turun drastis menjadi hanya 0,22%.

24-Hour XRP Wallets Dumping
Wallet XRP 24 Jam Melakukan Dumping | Sumber: Glassnode

Kelompok pemilik satu hari sampai satu minggu mencapai puncak di 3,88% pada 4 Desember lalu turun ke 1,24% pada 10 Desember. Hal ini menghilangkan tekanan spekulatif yang biasanya melemahkan upaya rebound.

Short-Term Cohort Leaving
Klaster Jangka Pendek Mulai Keluar | Sumber: Glassnode

Ketika holder jangka panjang lebih sedikit menjual dan holder sangat jangka pendek (modal spekulatif) keluar dari pasar, ini memberikan peluang rebound harga bisa bertahan.

Level Harga XRP yang Akan Mengonfirmasi atau Membatalkan Bounce XRP

XRP saat ini diperdagangkan sekitar US$2,00 dan masih di dalam rentang besar US$2,28 hingga US$1,98. Agar peluang rebound makin kuat, XRP perlu menembus US$2,17 dulu. Level ini, sekitar 8,37% lebih tinggi, adalah titik penentu untuk pergerakan berikutnya. Penutupan harian di atas level ini akan meningkatkan kemungkinan harga menguji batas atas rentang tersebut.

Pergerakan di atas US$2,28 akan mengonfirmasi adanya breakout dari rentang. Ini akan membuat harga XRP akhirnya bisa mengincar level yang lebih tinggi.

XRP Price Analysis
Analisis Harga XRP: TradingView

Di sisi bawah, risiko sudah sangat dekat. Penutupan candle harian di bawah US$1,98 akan melemahkan seluruh setup bullish. Jika level ini jebol, grafik memberi jalan menuju US$1,88 yang menjadi support utama berikutnya.

  •  

Bitcoin Hanya Butuh Satu Dorongan Lagi untuk Mengakhiri Koreksi — Ini Caranya

Harga Bitcoin terus melanjutkan fase koreksi setelah pemangkasan suku bunga FOMC. Koin ini turun sekitar 13% selama 30 hari terakhir dan hampir 4% dalam seminggu terakhir. Pergerakan ini masih termasuk dalam fase koreksi yang lambat dan bertahap sejak puncak Oktober.

Tapi, dua perubahan on-chain sekarang menampilkan sesuatu yang belum muncul di sepanjang penurunan kali ini. Sinyal-sinyal ini mengindikasikan bahwa fase koreksi bisa saja mendekati titik balik — jika Bitcoin mampu memberikan dorongan yang dibutuhkan.

Dua metrik kini mengarah ke kemungkinan perubahan arah

Kapitulasi jangka pendek kini terlihat dengan jelas. Data realisasi untung dan rugi milik CryptoQuant menunjukkan holder Bitcoin jangka pendek masih mengalami kerugian besar. Biasanya hal ini terjadi di akhir fase koreksi, bukan di tengah-tengah, karena aksi jual panik dalam kondisi rugi sering menandakan kelelahan di fase akhir.

BTC Short-Term Holders are Still in a Pain Zone

“Structurally, these deep loss pockets usually show up closer to the late stages of a correction than the early ones.” – By @IT_Tech_PL pic.twitter.com/bw39CfxGh6

— CryptoQuant.com (@cryptoquant_com) December 11, 2025

Data tersebut sesuai dengan apa yang terlihat pada HODL Waves.

HODL Waves mengukur berapa banyak Bitcoin yang dimiliki setiap “usia” koin — mulai dari koin sangat baru hingga yang sangat lama. Data ini menunjukkan kelompok mana yang sedang akumulasi atau justru melakukan penjualan. Kelompok satu hari hingga satu minggu memegang 6,2% pasokan pada akhir November. Namun pada 10 Desember, mereka hanya memegang 2%.

Penurunan yang sangat besar, yaitu 68%, ini menandakan adanya aksi jual besar-besaran oleh holder jangka pendek, biasanya menjadi tanda koreksi sudah hampir selesai, bukan baru mulai. Selain itu, aksi jual kelompok ini juga mengeluarkan uang spekulatif dari aset ini.

Short-Term Holders Keep Selling
Holder Jangka Pendek Terus Jual: Glassnode

Ingin insight token lainnya seperti ini? Daftar Newsletter Crypto Harian Editor Harsh Notariya di sini.

Sinyal berikutnya berasal dari Exchange Net Position Change, yaitu indikator pergerakan koin yang masuk ataupun keluar dari exchange tiap harinya.

Pada 27 November, arus bersih tercatat +5.103 BTC (koin masuk ke exchange).

Namun pada 10 Desember, arus ini berbalik menjadi –43.292 BTC, perubahan lebih dari 8,4 kali lipat dari arus masuk menjadi arus keluar.

Perubahan serupa terjadi antara 17 September hingga 25 September. Setelah perubahan itu, Bitcoin reli menuju harga tertingginya di atas US$126.000, menurut CoinGecko.

BTC Buying Intensifies
Pembelian BTC Meningkat: Glassnode

Sekarang, kombinasi yang sama — kapitulasi jangka pendek ditambah arus keluar besar-besaran — kembali terbentuk. Keduanya menciptakan peluang perubahan tren yang paling jelas sepanjang fase koreksi ini.

Harga Bitcoin Perlu Dorongan 4% untuk Breakout?

Jika sinyal-sinyal ini mengarah pada titik balik, grafik harga Bitcoin harus memberikan konfirmasi. Harga Bitcoin bergerak dalam pola segitiga simetris pada grafik harian. Segitiga simetris terbentuk ketika pembeli dan penjual sama-sama mulai melambat. Setiap sisi hanya punya dua titik sentuh, sehingga kedua garis tren ini lemah. Dorongan kecil saja bisa memecahkan seluruh pola, baik ke atas maupun ke bawah.

Dorongan itu sudah jelas: Bitcoin perlu menutup candlestick harian di atas US$94.140, hanya perlu kenaikan sekitar 4% dari posisi saat ini. Level ini beririsan dengan resistance horizontal sekaligus sisi atas segitiga. Breakout yang jelas membuka peluang naik menuju US$97.320 dan kemudian US$101.850.

Di sisi bawah, level risiko terdekat ada di US$90.180. Jika harga Bitcoin ditutup harian di bawah itu, peluang bullish melemah. Jika level tersebut jebol, US$87.010 menjadi support utama berikutnya. Jika harga menembus itu juga, maka harga kemungkinan turun ke US$80.640 yang akan menggagalkan skenario bullish besar.

Bitcoin Price Analysis
Analisis Harga Bitcoin: TradingView

Saat ini, situasi masih netral namun mulai membaik. Kapitulasi jangka pendek dan arus keluar yang besar memberikan peluang untuk harga Bitcoin mengakhiri fase koreksi — namun hanya jika mampu breakout naik 4%.

  •  

What Crypto Whales Are Buying After December FOMC Rate Cuts

The crypto market is still under pressure after the latest FOMC meeting. The Federal Reserve delivered its third 25 bps rate cut of the year, but the tone that followed was more cautious than expected. Inflation risks and slower growth signals have kept prices weak across most major assets. Despite this pullback, crypto whales are quietly adding to their positions.

Their buying has focused on three tokens that show early signs of rebound or breakout setups.

Aster (ASTER)

Aster’s price has slipped almost 4% in the past 24 hours, extending its month-on-month losses to about 14%. Yet whales are moving in the opposite direction.

Their holdings jumped 7.35% over the past day, adding about 4.59 million ASTER, worth roughly $4.22 million at the current price. What’s interesting is that ASTER is one of those rare coins that saw whale buying both before and after the FOMC decision.

This buying stands out because the chart shows a technical setup that may help explain why whales stepped in.

Aster Whales
Aster Whales: Nansen

Want more token insights like this? Sign up for Editor Harsh Notariya’s Daily Crypto Newsletter here.

Between November 3 and December 11, the ASTER price formed a higher low, while the RSI made a lower low. RSI, or Relative Strength Index, measures the strength of buying and selling. When the price rises but RSI falls, this creates a hidden bullish divergence. It usually signals that selling pressure is fading, even if the chart still looks weak on the surface.

Aster showed the same pattern between November 3 and December 1. That divergence produced a bounce of almost 22%. The current setup looks similar, and whales may be positioning for the same kind of rebound.

ASTER Price Analysis
ASTER Price Analysis: TradingView

For upside continuation, Aster needs a clean daily close above $1.08, the level where the last bounce stalled. If it breaks that line, the price can aim for $1.25 and $1.40, which match the next major resistances.

If the structure weakens instead, the downside is clear too. A daily close below $0.88 would break the rising structure and weaken whale conviction. Under that floor, ASTER may revisit $0.81 or lower.

Maple Finance (SYRUP)

Maple Finance (SYRUP) is still down about 2.2% in the past 24 hours and nearly 40% over the past month. Even with this weakness, crypto whales continued building positions. Normal whale wallets increased their holdings by 3.86% in the past day, while mega whales increased their stash by 4.9%, taking their total to 1.1 billion SYRUP.

That 4.9% jump means mega whales added roughly 51.4 million SYRUP, worth about $14.4 million at the current price. The fresh accumulation comes right after the slightly hawkish FOMC tone, which makes the buying move more interesting.

Maple Finance Whales
Maple Finance Whales: Nansen

Whales seem to be counting on the $0.23 support to hold. SYRUP touched this level several times since early December. It has not broken once, which may be the reason whales stepped in. The token has been moving in a broad $0.23 to $0.31 range, with its last support test on December 4.

Momentum gives a short-term boost. Between December 9 and December 11, the price made a lower low while the RSI made a higher low. RSI, or Relative Strength Index, measures buying and selling strength. When price drops but RSI rises, it forms a bullish divergence. On lower time frames, this usually points to a bounce even during a wider downtrend.

SYRUP Price Analysis
SYRUP Price Analysis: TradingView

If a bounce forms, the first target is $0.31, the ceiling that has rejected every move since December 6. A clear break above $0.31 opens the path to $0.39 and $0.48.

But if the SYRUP price loses $0.23, the whale conviction weakens. A breakdown there exposes open downside and likely resets the setup.

Pudgy Penguins (PENGU)

Pudgy Penguins is down almost 10% in the past 24 hours, but crypto whales continue to buy through the dip. Whale wallets increased their holdings by 5.25%, taking their total stash to 1.18 billion PENGU. That increase means whales added about 58.9 million PENGU.

Top 100 addresses or mega whales also showed steady accumulation. Their holdings rose 2.85% in the past day, lifting their combined stash to 76.95 billion PENGU. That comes to an addition of about 2.13 billion tokens, worth close to $21.3 million at today’s price. For a token that just slipped double digits, this kind of synchronized whale and mega whale buying is rare.

PENGU Holders
PENGU Holders: Nansen

The PENGU price chart explains why the whales continue to load up. Pudgy Penguins is forming an inverse head and shoulders pattern on the daily timeframe. This is a bullish reversal setup that often forms when a downtrend is losing pressure. The neckline sits near $0.014, and because it is sloping upward, it signals improving buyer-aligned structure even before a breakout forms.

Whales may be betting on that breakout. If PENGU closes above $0.014, the pattern’s height projects a move of roughly 35%, which places the upside target near $0.019. That is likely the reason large wallets are entering despite the price weakness.

PENGU Price Analysis: TradingView

But the pattern has clear invalidation levels. If Pudgy Penguins loses $0.010, the setup weakens. A drop under $0.009 fully invalidates the pattern and removes the bullish projection. For now, as long as PENGU holds above $0.010, the inverse head and shoulders remains in play, and crypto whales look prepared for a possible breakout.

The post What Crypto Whales Are Buying After December FOMC Rate Cuts appeared first on BeInCrypto.

  •  

Is XRP Price Hinting at a Bounce? 3 Clues Say This One Could Finally Hold

XRP price has tested patience for weeks. The coin is down about 18% over the last month and nearly 4% in the past 24 hours. It has spent most of its time stuck inside a tight range, making the past few weeks feel flat and frustrating.

But the latest move shows something that the earlier attempts did not. A chart signal and a shift in holder behavior now point to a bounce that might finally have enough support to hold.

A New Signal Shows That Buyers Might Be Returning

XRP has been trading between $2.28 and $1.98 since late November. This range shows that buyers and sellers have been evenly matched. But the lower side of this range recently produced something new. The price touched the bottom trend line of a symmetrical triangle. A symmetrical triangle forms when buyers and sellers slow down at the same pace, which often signals an aggresive move.

The first strong clue comes from the volume trend. Between December 6 and December 11, the price made a lower low, but the On-Balance Volume (OBV) made a higher low.

Divergence Hints At XRP Rebound: TradingView

Want more token insights like this? Sign up for Editor Harsh Notariya’s Daily Crypto Newsletter here.

OBV measures whether volume is flowing in or out of a coin. When price drops but OBV rises, it shows hidden accumulation. This usually means someone is buying the dips even while the chart looks weak. That is the first sign that a bounce attempt might surface.

This combination of the triangle support and the OBV divergence hints that early buying pressure is returning.

Why This Bounce Could Finally Hold If Selling Pressure Keeps Fading

A clean bounce, if it happens, also needs lower selling pressure. Long-term holders, often the strongest group in any coin, have reduced their selling sharply. On December 3, they were moving out 101,083,156 XRP. By December 10, that number dropped to 51,157,301 XRP. That is about a 49% reduction. They are still net sellers, but the selling pressure is softening at a noticeable pace.

HODLers Selling Fewer Coins: Glassnode

The most interesting, third clue, comes from the fastest-moving wallets. These short-term XRP holders often sell into every bounce and kill momentum. But this time, they are cutting the supply. That is evident via the HODL waves metric, which shows supply held based on cohort age.

The 24-hour cohort held 1.89% of the supply on December 2. By December 10, that had dropped to just 0.22%.

24-Hour XRP Wallets Dumping
24-Hour XRP Wallets Dumping: Glassnode

The one-day to one-week cohort peaked at 3.88% on December 4 and has dropped to 1.24% as of December 10. This removes the speculative pressure that usually weakens rebounds.

Short-Term Cohort Leaving
Short-Term Cohort Leaving: Glassnode

When long-term holders sell less and very short-term holders (speculative money) exit the market, it allows price bounces to sustain.

XRP Price Levels That Will Confirm or Break the XRP Bounce

XRP trades near $2.00 and is still inside the broader $2.28 to $1.98 range. For the bounce to gain strength, XRP needs to clear $2.17 first. That level, about 8.37% higher, is the checkpoint that decides the next push. A daily close above it improves the odds of testing the top of the range.

A move above $2.28 would confirm a range break. That would allow the XRP price to aim higher, finally.

XRP Price Analysis
XRP Price Analysis: TradingView

On the downside, the risk is close. A daily candle close under $1.98 weakens the entire bullish setup. If that breaks, the chart opens a path toward $1.88. That is the next major support.

The post Is XRP Price Hinting at a Bounce? 3 Clues Say This One Could Finally Hold appeared first on BeInCrypto.

  •  

Bitcoin Is Just One Push Away From Ending Its Correction — Here’s How

Bitcoin price has extended its correction after the FOMC rate cut. The coin is down about 13% over the past 30 days and almost 4% in the past week. The move still fits inside a slow, grinding corrective phase since the October peak.

But two on-chain shifts now show something that did not appear at any point earlier in this downturn. These signals suggest the correction could be close to a turn — if Bitcoin delivers the push it needs.

Two Metrics Now Point Toward a Possible Turn

Short-term capitulation is showing up clearly now. CryptoQuant’s realized profit-and-loss data shows short-term Bitcoin holders are still deep in losses. This usually happens near the end of a correction, not the middle, because panicked selling at a loss often marks late-stage exhaustion.

BTC Short-Term Holders are Still in a Pain Zone

“Structurally, these deep loss pockets usually show up closer to the late stages of a correction than the early ones.” – By @IT_Tech_PL pic.twitter.com/bw39CfxGh6

— CryptoQuant.com (@cryptoquant_com) December 11, 2025

This fits with what shows up on HODL Waves.

HODL Waves measure how much Bitcoin each “age band” holds — from very new coins to very old ones. It shows which groups are accumulating or selling. The one-day to one-week cohort held 6.2% of the supply in late November. By December 10, they held only 2%.

That is a massive 68% drop and signals heavy short-term selling, the kind that often completes a correction rather than starts a new one. Plus, this cohort dumping also pushes speculative money out of the asset.

Short-Term Holders Keep Selling
Short-Term Holders Keep Selling: Glassnode

Want more token insights like this? Sign up for Editor Harsh Notariya’s Daily Crypto Newsletter here.

The next signal comes from Exchange Net Position Change, which tracks how many coins move into or out of exchanges each day.

On November 27, net flows were +5,103 BTC (coins moving in).

By December 10, the flows flipped to –43,292 BTC, a flip of more than 8.4x from inflows to outflows.

A similar shift happened between September 17 and September 25. After that flip, Bitcoin rallied toward its all-time high above $126,000, per CoinGecko.

BTC Buying Intensifies
BTC Buying Intensifies: Glassnode

Now the same combination — short-term capitulation plus strong outflows — is forming again. Together, they create the cleanest trend-shift setup of this entire correction.

Bitcoin Price Needs a 4% Push to Break Out?

If these signals are pointing to a turn, the Bitcoin price chart needs to confirm it. The Bitcoin price has been moving inside a symmetrical triangle on the daily chart. A symmetrical triangle forms when buyers and sellers slow at the same pace. Each side has only two touch points, which makes both trend lines weak. A small push can break the entire setup on either side.

That push is clear: Bitcoin needs a daily close above $94,140, which is only about a 4% move from current levels. This level overlaps with both the horizontal resistance and the upper edge of the triangle. A clean breakout opens the path toward $97,320 and then $101,850.

On the downside, the nearest risk level is $90,180. A daily close under it weakens the bullish case. If that breaks, $87,010 is the next major support. Losing that exposes $80,640, where the broader bullish idea breaks.

Bitcoin Price Analysis
Bitcoin Price Analysis: TradingView

Right now, the setup is neutral but improving. Short-term capitulation and heavy outflows give the Bitcoin price a chance to end its correction — but only if it delivers that 4% breakout.

The post Bitcoin Is Just One Push Away From Ending Its Correction — Here’s How appeared first on BeInCrypto.

  •  
❌