Reading view

5 Reasons the Crypto Bull Market Could Restart Anytime Soon

The crypto market has taken a heavy hit over the past month. Total market cap fell from $4.27 trillion on October 6 to $2.98 trillion on November 19, a drop of about 30%. The rebound to $3.12 trillion has not changed the debate — traders remain split.

One group says a deeper bear market is forming. The other says the correction already looks like late-stage weakness. This piece focuses on the second group. Several telltale readings now hint that the crypto bull market could start sooner than expected.

Each of the five reasons below reflects one of three things: peak weakness, peak capitulation, or a rise in fresh buying power. Together, they might be forming one of the strongest early bull cycle setups seen.

Short-Term Selling Pressure Looks Close to Exhaustion

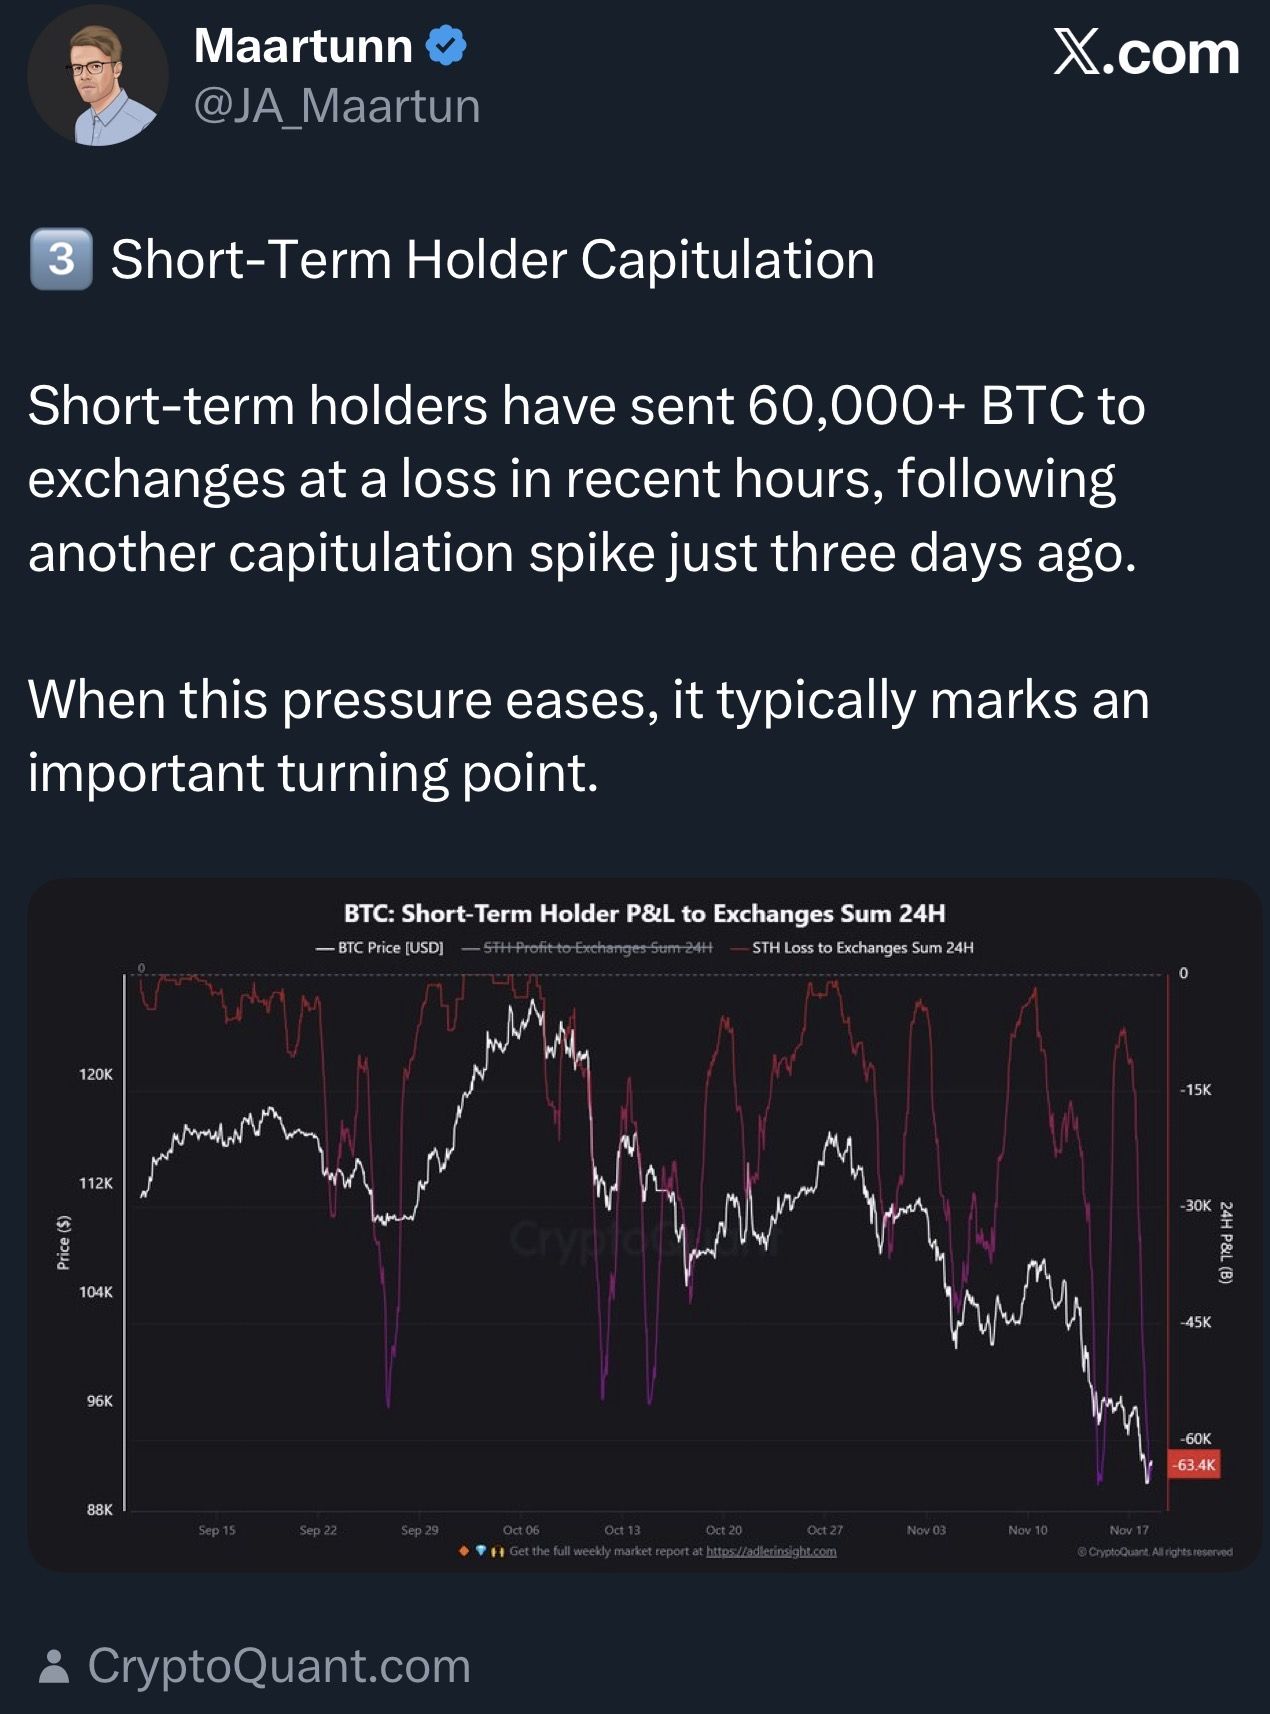
Short-term holders have been selling at one of the fastest paces in months, and this is usually what happens near a bottom.

Bitcoin lettuce hands in losses have been dumping at an accelerated pace.

More signs for a big bounce ahead. pic.twitter.com/uVDgwoPNkP

— Bitcoin Munger (@bitcoinmunger) November 19, 2025

Bitcoin Munger flagged the spike in coins sent to exchanges at a loss, while JA Maartunn highlighted a similar surge on CryptoQuant, with more than 60,000 Bitcoin moved at a loss within hours. This kind of panic selling often marks the “clean-out” phase before a trend shift from bear market vibes.

Want more token insights like this? Sign up for Editor Harsh Notariya’s Daily Crypto Newsletter here.

STH Capitulation: X

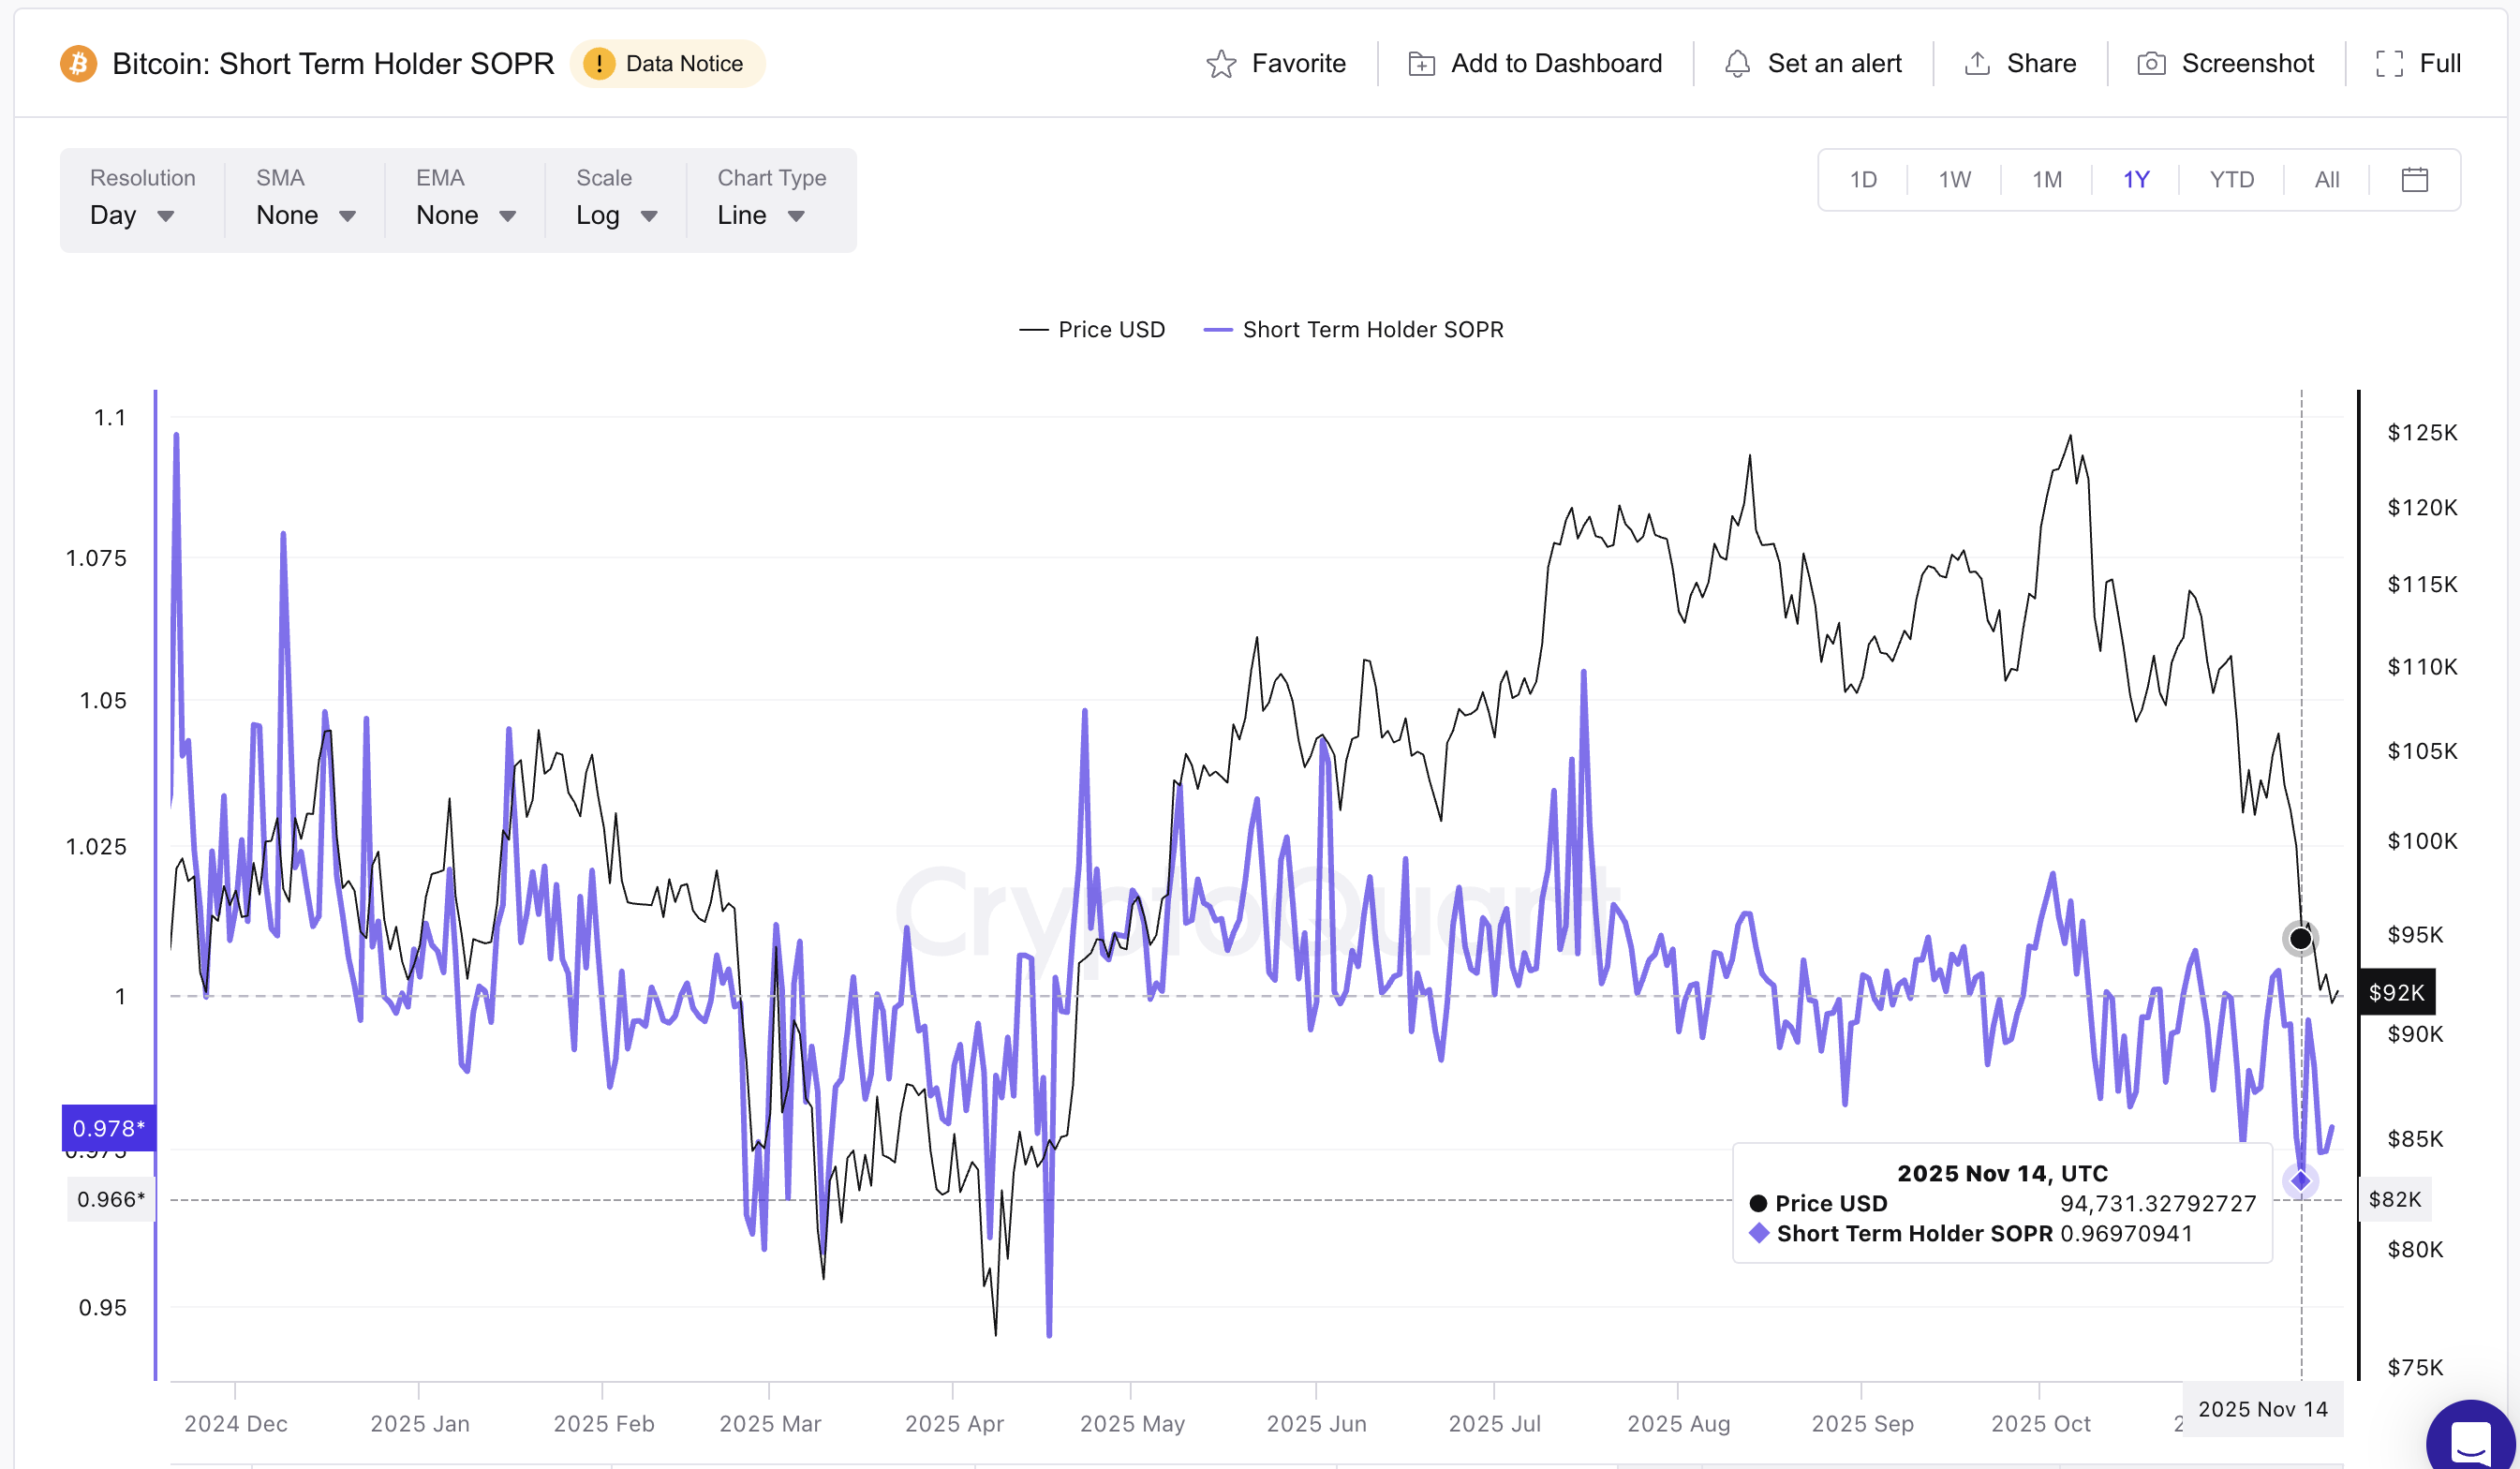
The on-chain data confirms it. The short-term holder SOPR fell to 0.96 on November 15, matching the same level from April 7. SOPR, or Spent Output Profit Ratio, shows whether coins spent on-chain are being sold at a profit or a loss. When it drops under 1 and then stabilizes, it often signals that weak holders have already capitulated.

Crypto Bull Market Signal Via STH SOPR
Crypto Bull Market Signal Via STH SOPR: CryptoQuant

Short-term holders matter because they are the group that reacts the fastest during corrections. They panic-sell earlier, hit stop losses quicker, and usually dump into weakness. This is why short-term selling pressure almost always peaks near market bottoms.

After the April reset, Bitcoin rallied from $76,270 to $123,345 within months, a near 62% move. With SOPR now back at 0.97, the latest drop hints that the selling pressure may be close to burnout.

This sets up the next question: Is fresh buying power building up elsewhere? That’s where the next indicator comes in.

Stablecoin Power Is Building Again 

If short-term sellers are close to exhaustion, the next question is simple: Is there enough fresh buying power to lift prices?

Right now, the stablecoin data says yes.

The Stablecoin Supply Ratio (SSR) has dropped to 11.59, its lowest reading in over a year. SSR compares Bitcoin’s market cap to the total stablecoin supply. When SSR falls, it means stablecoins hold more buying power relative to Bitcoin. Traders sometimes refer to this as “dry powder.”

Stablecoin Supply Ratio Hits Yearly Lows
Stablecoin Supply Ratio Hits Yearly Lows: CryptoQuant

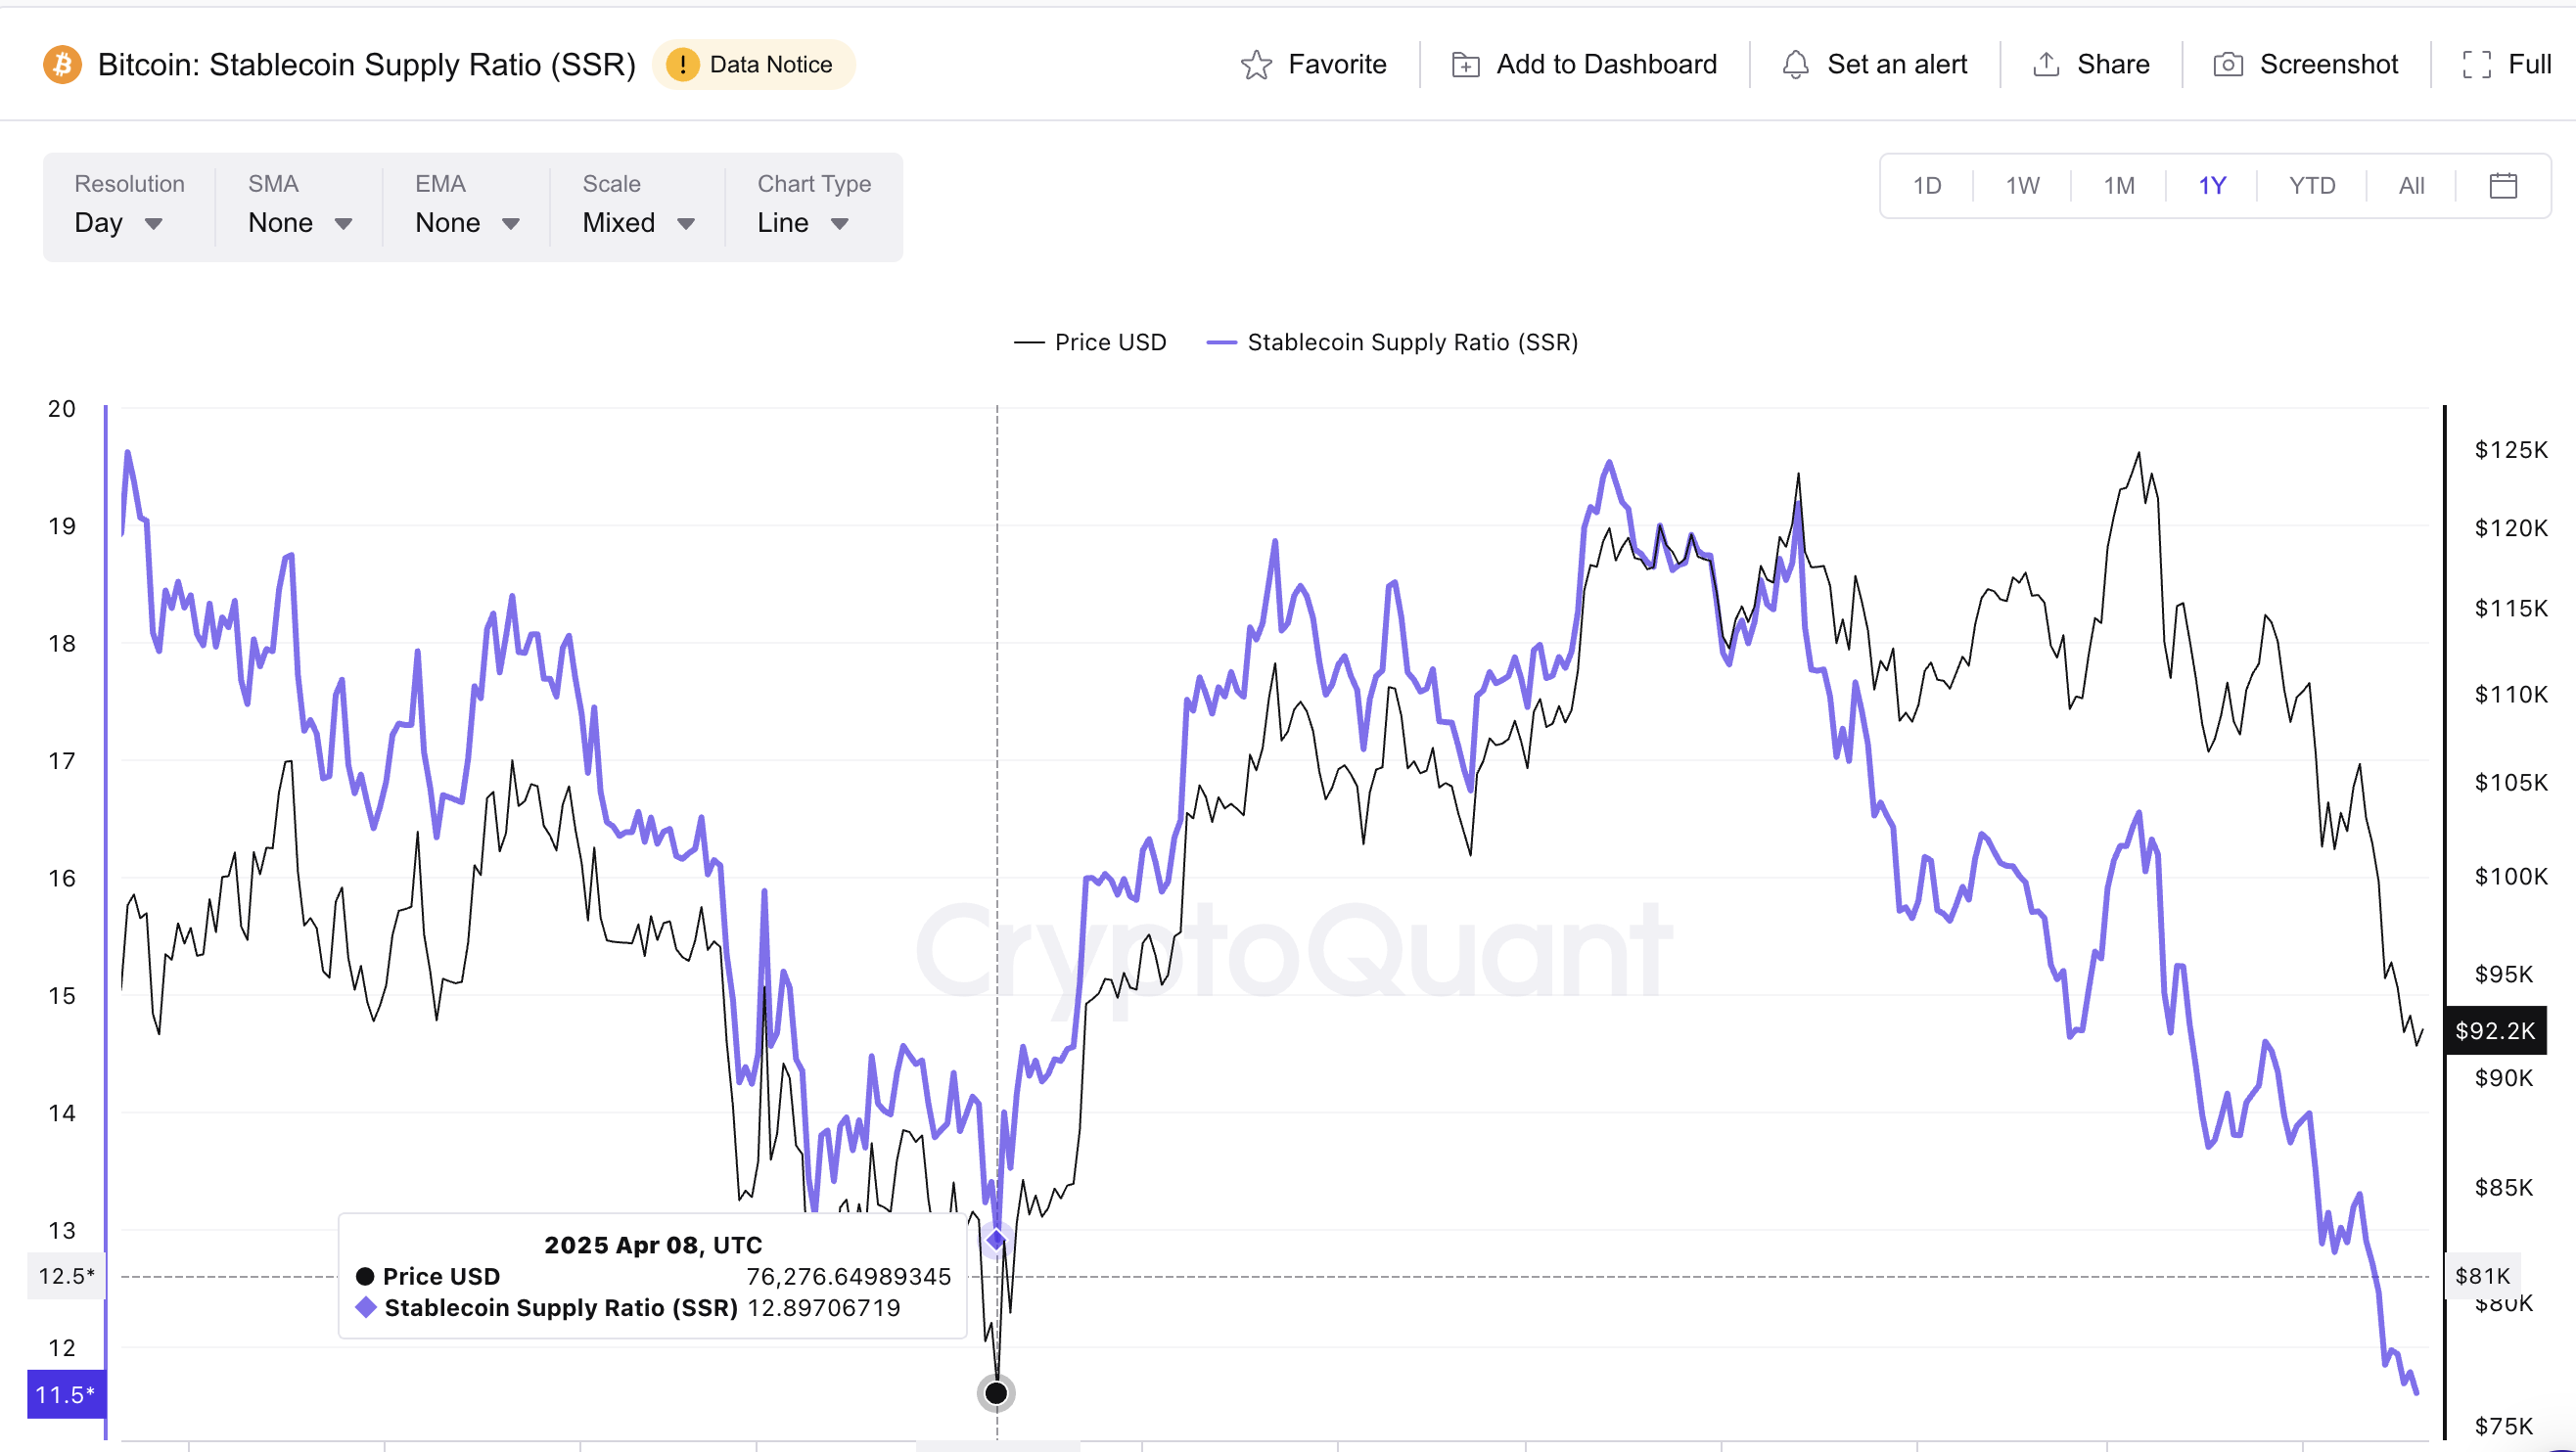
This level is even lower than the 12.89 reading seen on April 8, the same period when Bitcoin bottomed near $76,276 before rallying for months. Lower SSR means stablecoins can buy more Bitcoin per unit of supply, which usually appears near market lows.

A second confirmation comes from the RSI of SSR, highlighted by analyst Maartunn. It sits near 26, a level that has repeatedly aligned with Bitcoin bottoms during the past bear markets. A low RSI here means stablecoin buying power is oversold relative to Bitcoin’s size — a rare setup that often appears before trend shifts.

SSR RSI Bottoming Out: X

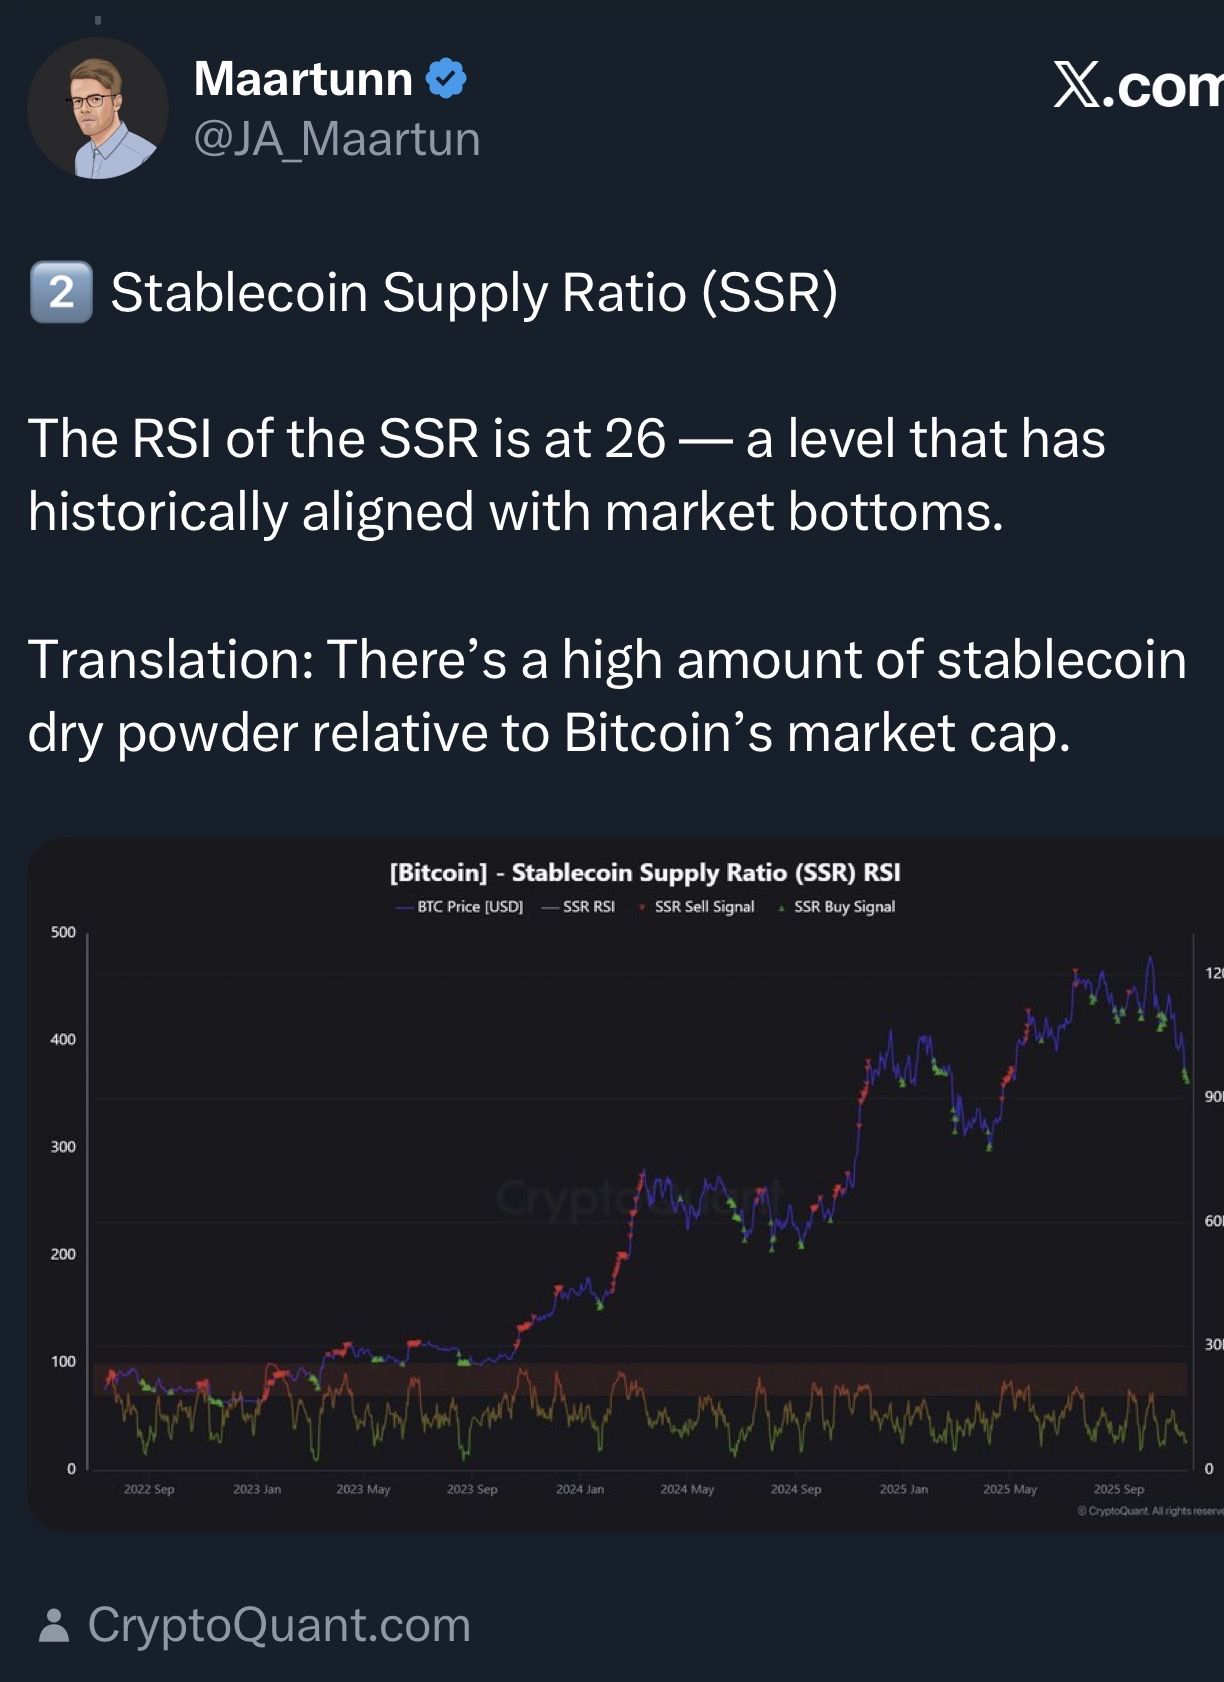
Taken together, the rising stablecoin reserves and the deeply compressed SSR show the market has the liquidity needed for a crypto bull market rebound.

Altcoin Profit Reset Might Be Quietly Strengthening the Crypto Bull Market Case

Short-term capitulation and low SSR already show that selling pressure is close to exhaustion. The next layer comes from altcoins, where the reset is even deeper.

Glassnode’s latest data shows that only about 5% of altcoin supply is still in profit, which is a level normally seen during late-stage capitulation. When almost every holder is underwater, the market usually has very little left to sell.

Altcoin relative profits are stabilizing in deep capitulation territory, with only ~5% of supply in profit, while Bitcoin’s profits have just begun to decline sharply.
This unusual divergence between BTC and alts is unprecedented in prior cycles.

📉 https://t.co/IpxEWurY3i pic.twitter.com/HqmUmNwkvF

— glassnode (@glassnode) November 15, 2025

This is similar to Bitcoin’s own wipeout, where 95% of all coins bought in the last 155 days are now underwater — higher than the COVID and FTX crashes.

JUST IN: 95% of all Bitcoin bought in the last 155 days is now underwater

Higher than COVID (92%) and FTX (94%) pic.twitter.com/FHYVdF6MNY

— Bitcoin Archive (@BitcoinArchive) November 19, 2025

This combination matters because altcoins often stabilize before Bitcoin when profit ratios collapse this sharply. Even though Bitcoin dominance is still near 60%, the gap between Bitcoin’s profit decline and the near-zero altcoin profit level suggests altcoins might be closer to forming a base.

If the crypto bull market does start from a deep reset, altcoins are often the first to respond simply because they have no remaining overhead pressure. This raises the possibility that an altcoin-led phase could start first.

Sentiment Drops to Extreme Fear: Exactly How Bull Markets Start?

After looking at altcoin losses and Bitcoin’s underwater supply, the next piece that ties the crypto bull market story together is sentiment. The Bitcoin Fear & Greed Index fell to 10 on November 15, marking its lowest reading since February 27, when Bitcoin traded near $84,718. That earlier reading came just weeks before Bitcoin bottomed in April and began the same rally we referenced earlier — the move from $76,276 on April 8 to $123,345 by August 13, a 62% jump.

Fear And Greed Index Reset: Glassnode

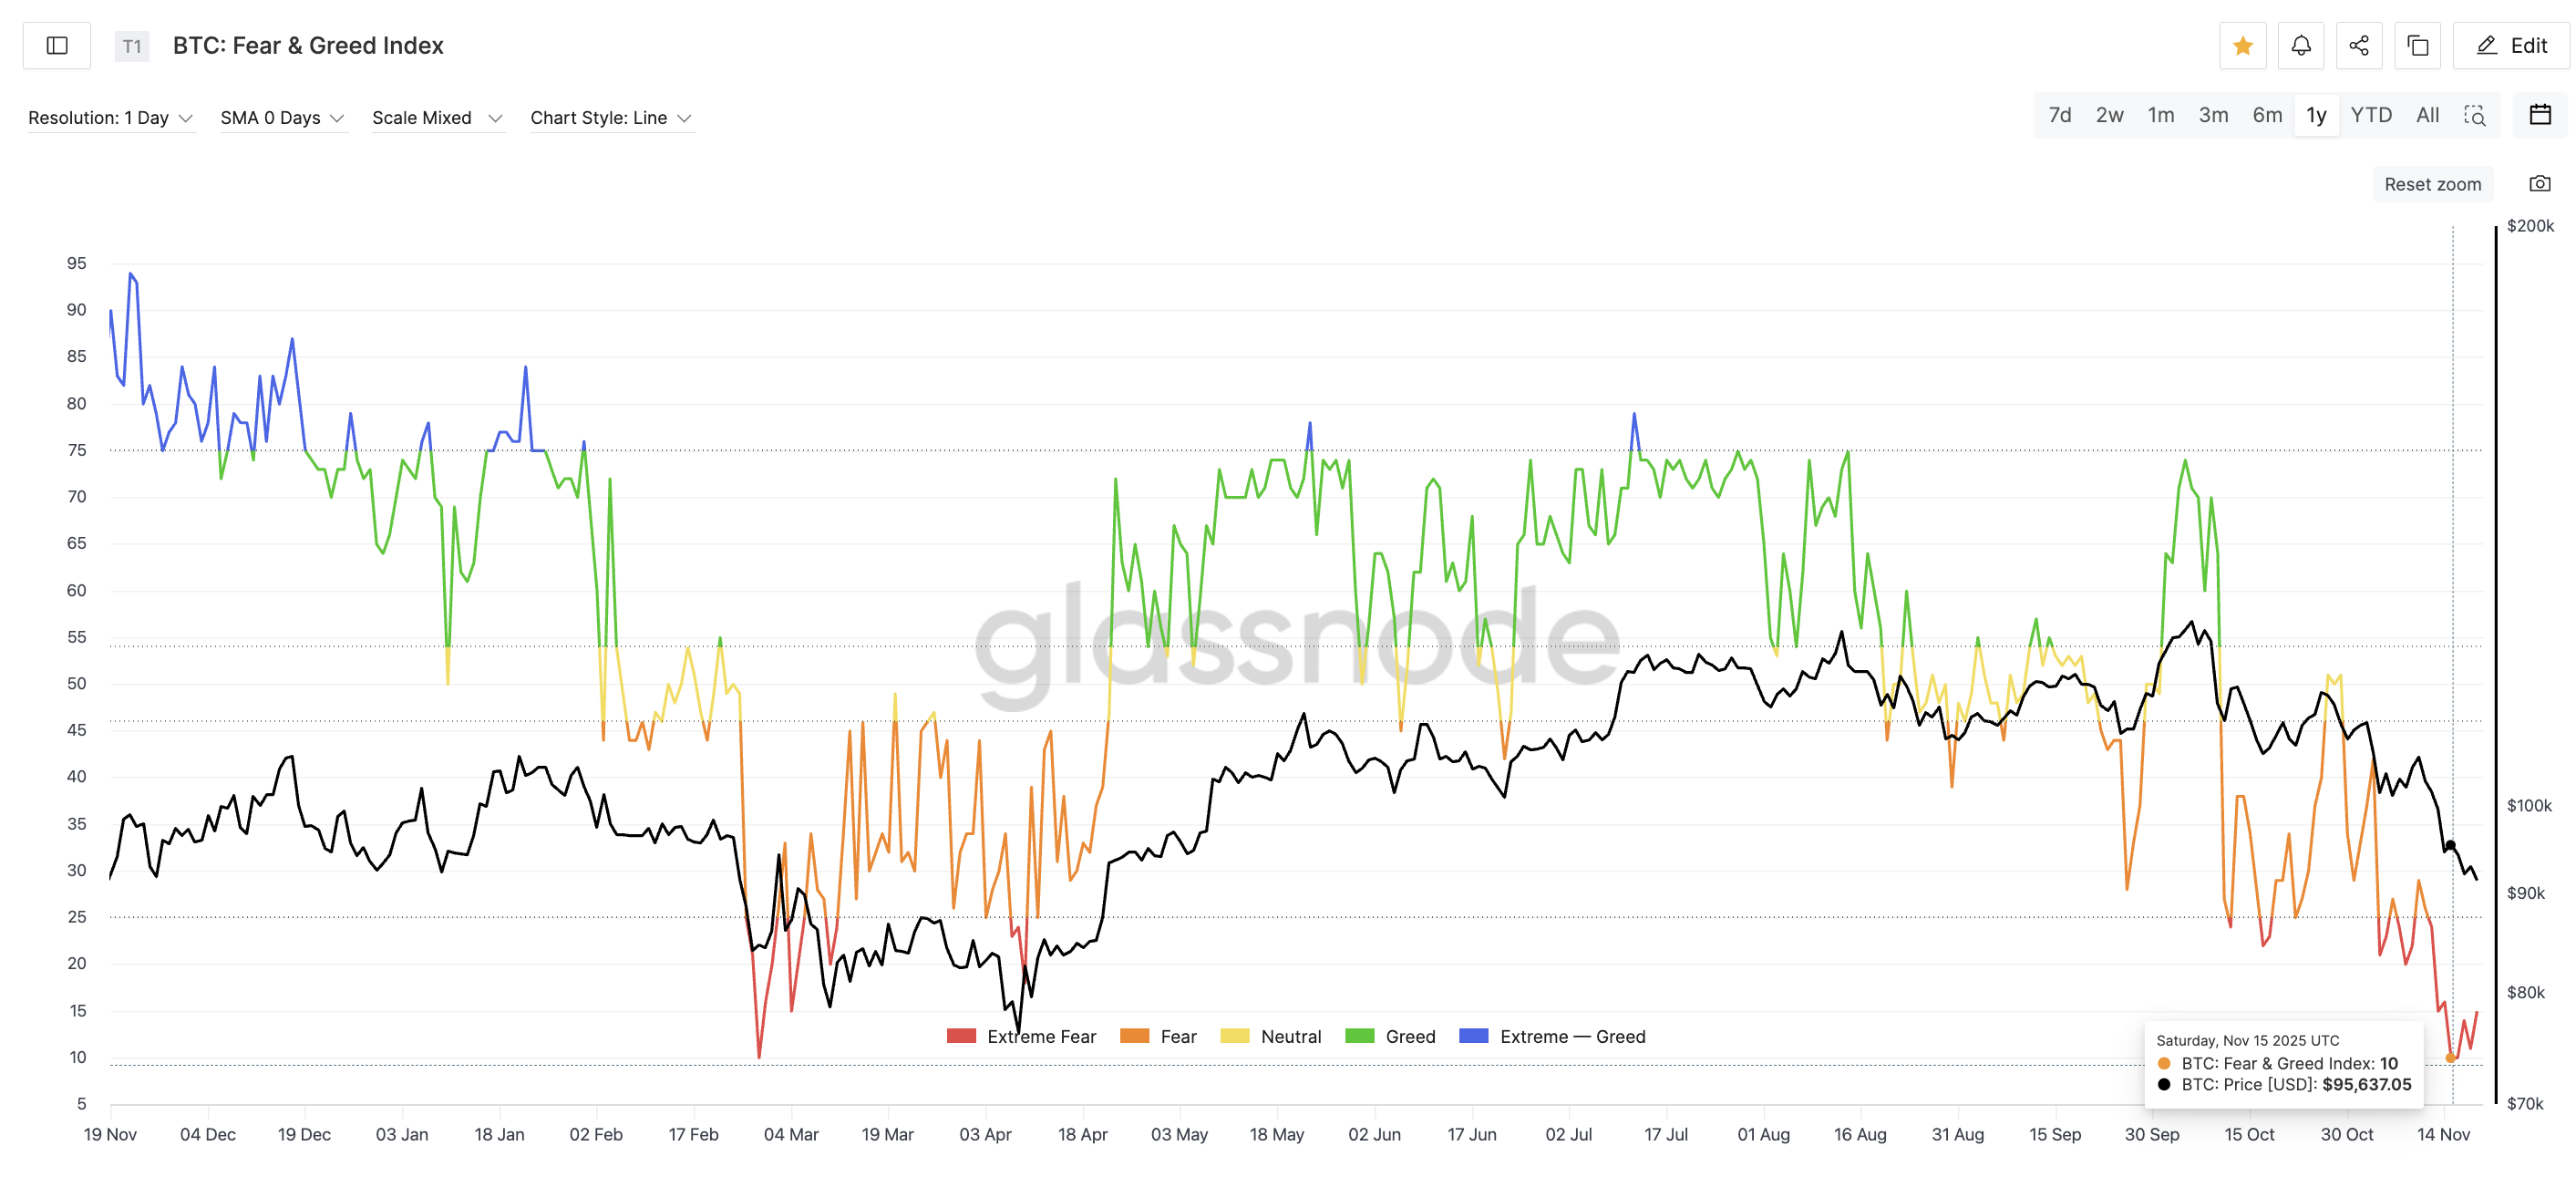
This new drop to 10 matters because extreme fear usually appears after most of the selling is done. Even during the April rebound, the index only briefly hit 18 and never slipped back to 10. Falling to that range again suggests the market has already gone through its emotional flush.

Industry leaders like Thomas Chen, CEO of Function, also describe this phase as washed-out and emotionally stretched:

“Allocator behavior has tilted sharply toward selloffs with over $2.8B in outflows… it almost feels like it’s moving back to the question: do I even want to hold BTC in this environment? With the Fear and Greed Index at extreme fear, this looks similar to the 2022 Luna crash,” he said.

Coming right after altcoin capitulation and record-low stablecoin ratios, this fear reset strengthens the broader case that the base for the next crypto bull market may be forming.

A Fresh Death Cross Just Finished Playing Out — And Bitcoin Could React?

The final signal pointing toward a possible crypto bull market is the new death cross that formed on November 15. A death cross happens when the 50-day moving average drops below the 200-day moving average. Moving averages show the average closing price over a period, so this crossover often highlights trend exhaustion rather than the start of a long crash.

Bitcoin dropped about 17% during the entire “crossing-in” phase, leading to the final signal. This move is almost identical to the 16% drop seen during the April death-cross setup. That April structure played out fully, wiped out weak momentum, and then the April-to-August rally started.

Crypto Market Analysis And Death Cross
Crypto Market Analysis And Death Cross: TradingView

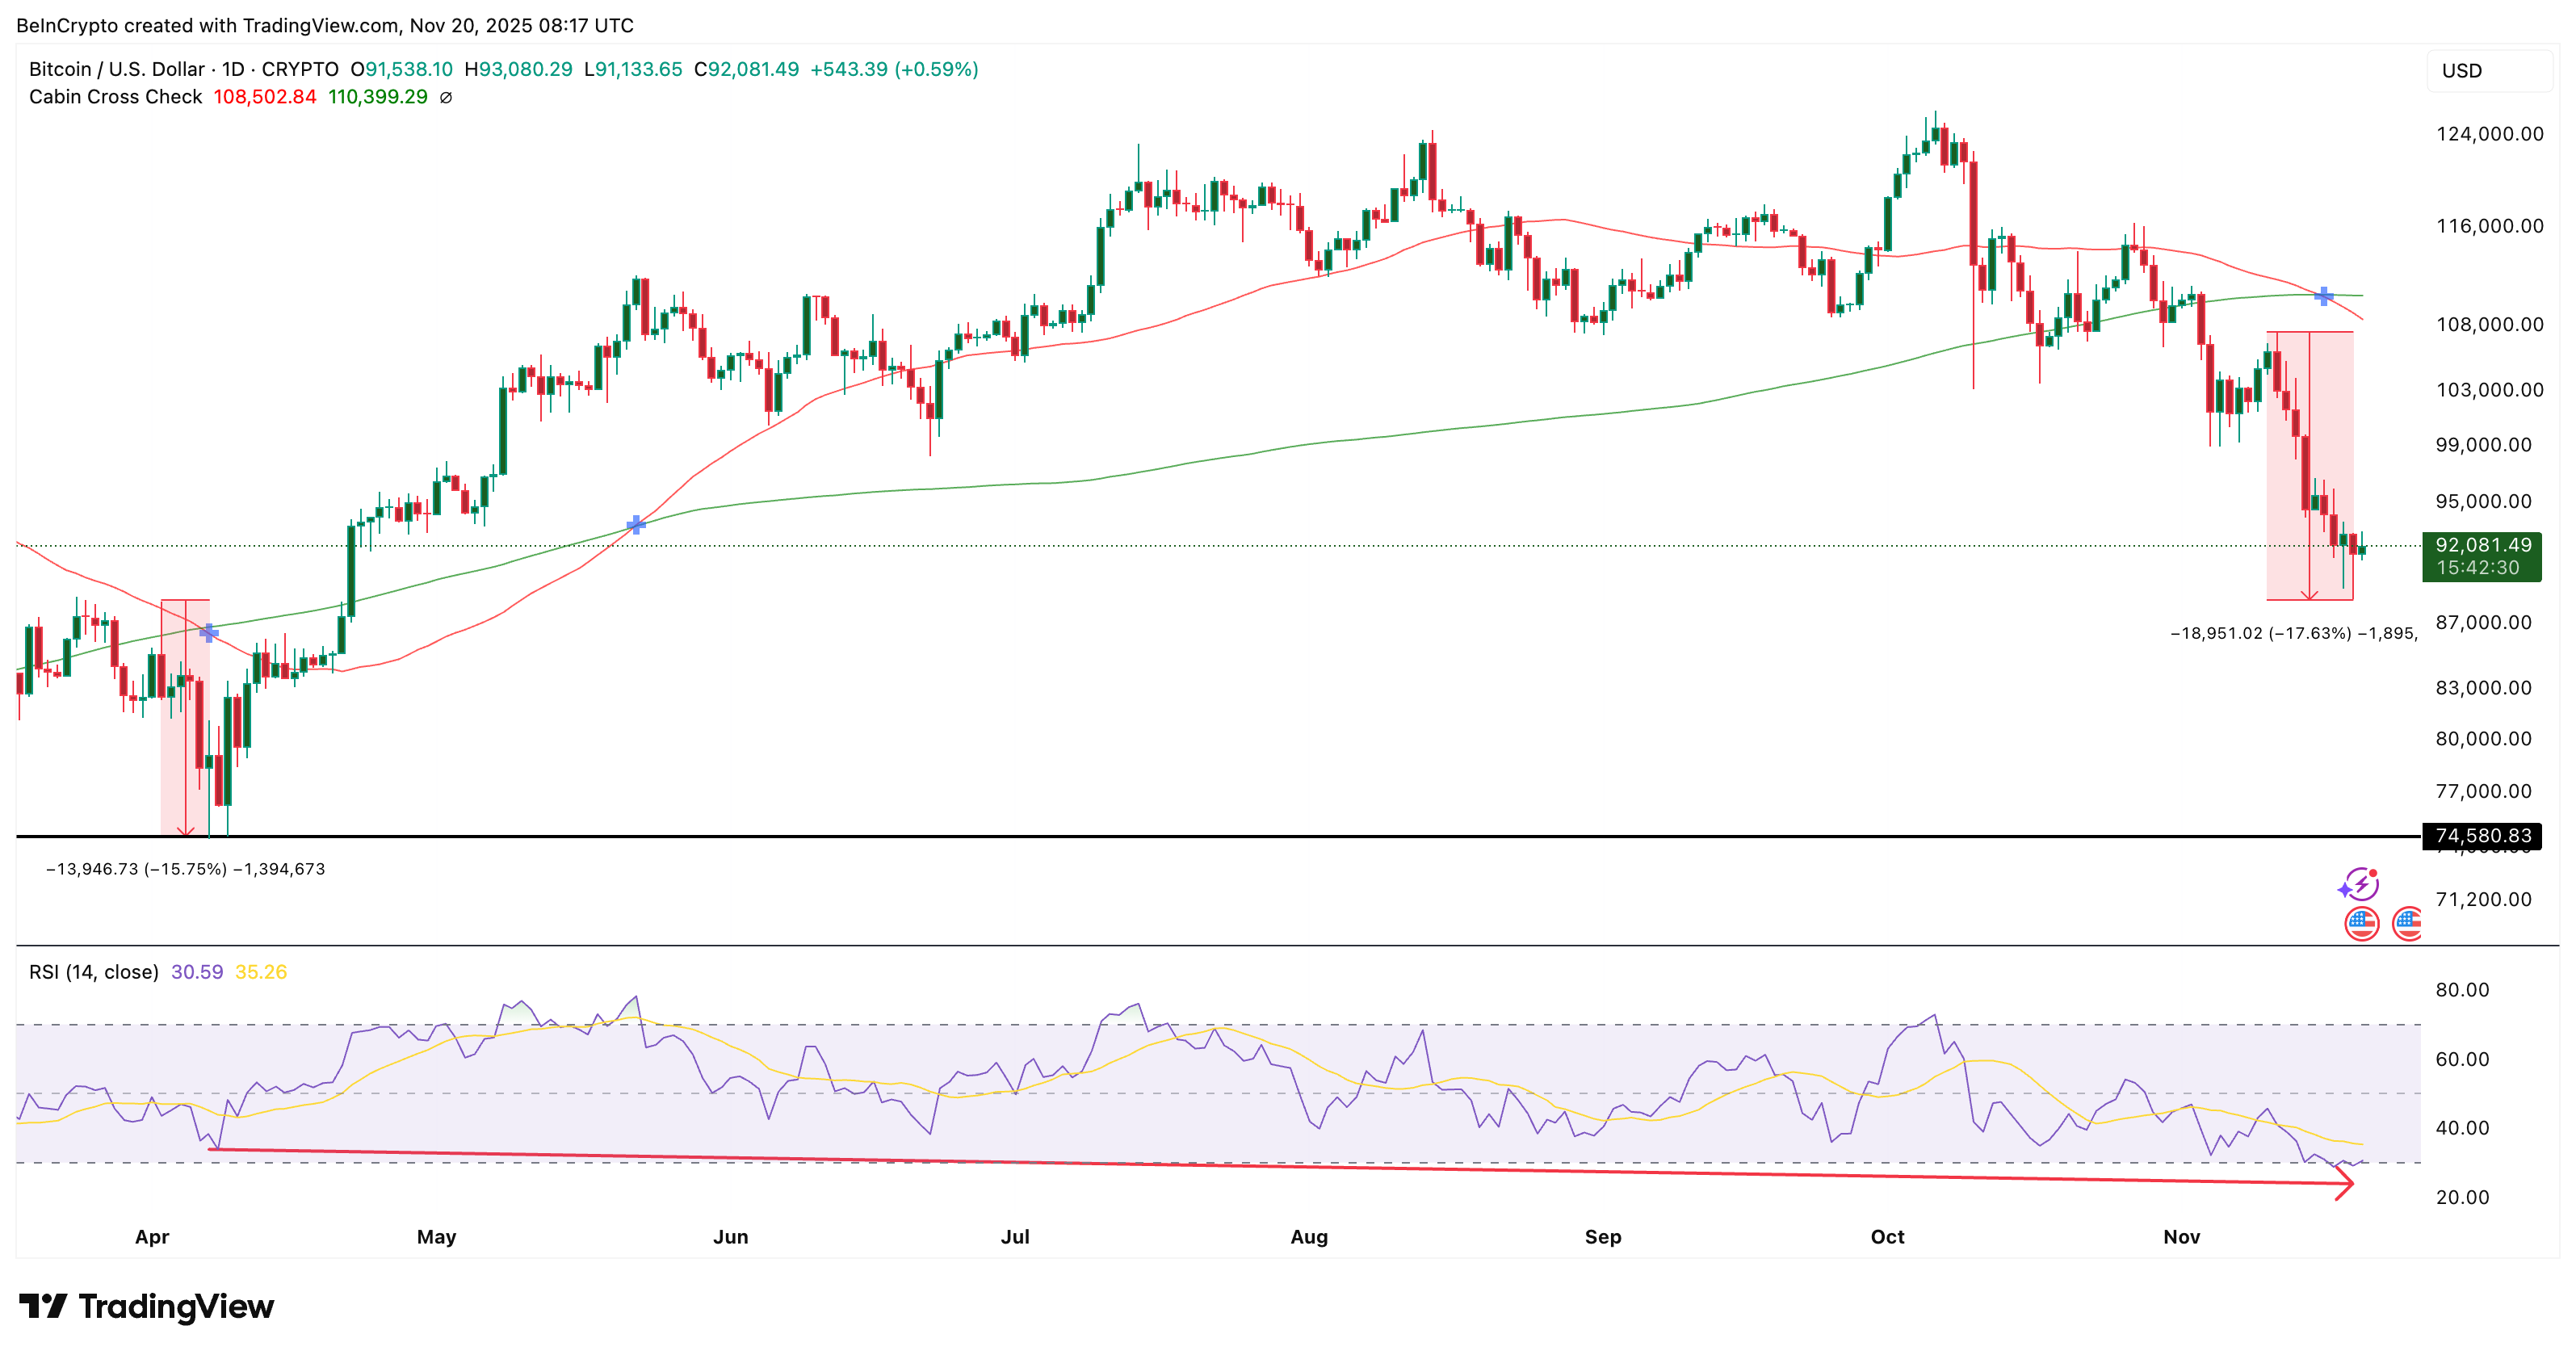
This time, something similar is happening under the surface. The price made a higher low during these two market phases, but the RSI is making a lower low. RSI tracks momentum, and this kind of hidden bullish divergence usually hints that sellers are tiring. It acts like the final pressure release before the uptrend started earlier continues. And this aligns with the peak capitulation theory shared earlier.

Fred Thiel, CEO of MARA Holdings, pointed out that the recent breakdown reflects a macro-driven flush, not just a chart event.

“Bitcoin’s drop below $90,000 reflects a perfect storm of macro headwinds and profit-taking. Long-term holders have distributed over 815,000 BTC in the past month, the most aggressive selling since 2024,” he highlighted.

If Bitcoin holds above the recent lows, the death cross may end up being another reset rather than a breakdown.

Bitcoin had a death cross today.

Note that prior death crosses marked local lows in the market.

Of course, when the cycle is over, the death cross rally fails.

The time for Bitcoin to bounce if the cycle is not over would be starting within the next week.

If no bounce occurs… pic.twitter.com/Rg8pSxYMva

— Benjamin Cowen (@intocryptoverse) November 16, 2025

That was the case earlier this year, and it is one reason traders think the crypto bull market foundation is quietly forming again. However, if the Bitcoin price doesn’t react soon to this recently formed crossover, the bull market inception might have to wait longer.

The post 5 Reasons the Crypto Bull Market Could Restart Anytime Soon appeared first on BeInCrypto.

  •  

Dogecoin Price Looks Set For Another Leg — Up Isn’t The Likely Direction

Dogecoin (DOGE) is trading near $0.156, down almost 19% over the past month and 11% in the past week. While a few large-cap coins are trying to build early recovery signs, the Dogecoin price is doing the opposite. The trend still tilts lower, and the signals forming on the chart and on-chain point to weakness rather than relief.

The short-term structure shows why the Dogecoin (DOGE) price weakness may continue before any meaningful upside can develop.


Momentum Weakens As Hidden Bearish Divergence Forms

The clearest problem sits in the momentum data. Between Nov. 15 and Nov. 18, the Dogecoin price made a lower high, but the RSI made a higher high. RSI, or Relative Strength Index, measures whether buying or selling pressure is strong. When RSI climbs while the price makes a lower high, it forms a hidden bearish divergence.

Traders treat this as a continuation warning, meaning the existing downtrend still has room.

DOGE Prints A Bearish Divergence
DOGE Prints A Bearish Divergence: TradingView

Want more token insights like this? Sign up for Editor Harsh Notariya’s Daily Crypto Newsletter here.

This weakness becomes more convincing when you look at long-term DOGE holders. Glassnode’s Hodler Net Position Change shows how many coins held for more than 155 days are moving. These wallets usually sell only when conviction collapses.

On Nov. 9, long-term holders were distributing about 62.35 million DOGE. By Nov. 19, that figure had grown to 237.20 million DOGE. That is a sharp increase of nearly 175 million DOGE in ten days, a 280% jump. This reflects a clear rise in long-term selling pressure.

HODLers Keep Dumping
HODLers Keep Dumping: Glassnode

Taken together, momentum is weakening, and holders with strong hands are stepping back. That combination makes short-term rebounds easy to fade. All while exposing downside risks.


Dogecoin Price Faces More Downside Unless Key Levels Break

The Dogecoin price continues to lean lower along its trend structure, so the next supports come from the trend-based projection levels. The first important level sits at $0.150, which has repeatedly acted as a short-term floor. Losing this support could push the price toward $0.140 and even $0.127 if broader market sentiment softens.

On the upside, the Dogecoin price needs to reclaim $0.163 to pause the bearish pattern. A clean move above $0.163 would shift momentum enough to target $0.186, the next major resistance on the chart. Until that happens, the downtrend remains intact, and every bounce carries the risk of fading.

Dogecoin Price Analysis
Dogecoin Price Analysis: TradingView

For now, the overall picture stays simple. The trend is negative, the momentum favors sellers, and long-term holders are still distributing. Unless Dogecoin starts reclaiming key levels, the DOGE price trend is likely to continue — just not in the direction Long traders are hoping for.

The post Dogecoin Price Looks Set For Another Leg — Up Isn’t The Likely Direction appeared first on BeInCrypto.

  •  

5 Alasan Reli Pasar Kripto Dapat Dimulai Kapan Saja Segera

Pada bulan lalu, pasar aset kripto terkena dampak besar. Kapitalisasi pasar total turun dari US$4,27 triliun pada 6 Oktober menjadi US$2,98 triliun pada 19 November, penurunan sekitar 30%. Rebound ke US$3,12 triliun belum mengubah perdebatan — para trader tetap terbagi.

Satu kelompok mengatakan pasar bearish yang lebih dalam sedang terbentuk, sementara kelompok lain mengatakan koreksi ini sudah tampak seperti kelemahan akhir. Artikel ini berfokus pada kelompok kedua. Beberapa indikator sekarang mengisyaratkan bahwa pasar bullish aset kripto bisa dimulai lebih cepat dari yang diperkirakan.

Masing-masing dari lima alasan di bawah ini mencerminkan satu dari tiga hal: kelemahan puncak, puncak kapitulasi, atau peningkatan dalam kekuatan beli baru. Bersama-sama, mereka bisa membentuk salah satu setup awal siklus bullish terkuat yang pernah ada.

Tekanan Jual Jangka Pendek Nampaknya Hampir Habis

Holder jangka pendek telah menjual dengan salah satu kecepatan tercepat dalam beberapa bulan, dan ini biasanya terjadi di dekat titik terendah.

Bitcoin lettuce hands in losses have been dumping at an accelerated pace.

More signs for a big bounce ahead. pic.twitter.com/uVDgwoPNkP

— Bitcoin Munger (@bitcoinmunger) November 19, 2025

Bitcoin Munger menandai lonjakan koin yang dikirim ke exchange dengan kerugian, sementara JA Maartunn menyoroti lonjakan serupa di CryptoQuant, dengan lebih dari 60.000 Bitcoin dipindahkan dengan kerugian dalam beberapa jam. Jenis penjualan panik ini sering menandai fase “pembersihan” sebelum pergeseran tren dari suasana pasar bearish.

Ingin lebih banyak wawasan token seperti ini? Daftar ke Newsletter Crypto Harian Editor Harsh Notariya di sini.

Kapitulasi STH: X

Data on-chain mengonfirmasi hal ini. SOPR holder jangka pendek turun ke 0,96 pada 15 November, menyamai level yang sama dari 7 April. SOPR, atau Spent Output Profit Ratio, menunjukkan apakah koin yang digunakan on-chain dijual dengan keuntungan atau kerugian. Ketika turun di bawah 1 dan kemudian stabil, itu sering menandakan bahwa holder lemah sudah kapitulasi.

Sinyal Pasar Bull Kripto Melalui STH SOPR
Sinyal Pasar Bull Kripto Melalui STH SOPR: CryptoQuant

Holder jangka pendek penting karena mereka adalah kelompok yang bereaksi paling cepat saat koreksi terjadi. Mereka panik menjual lebih awal, terjebak stop loss lebih cepat, dan biasanya dump saat ada kelemahan. Inilah sebabnya tekanan jual jangka pendek hampir selalu mencapai puncaknya di dekat titik terendah pasar.

Setelah reset April, Bitcoin reli dari US$76.270 ke US$123.345 dalam beberapa bulan, kenaikan hampir 62%. Dengan SOPR sekarang kembali di 0,97, penurunan terbaru mengisyaratkan bahwa tekanan jual mungkin mendekati titik akhir.

Ini menimbulkan pertanyaan berikutnya: Apakah ada kekuatan beli baru yang sedang terbentuk di tempat lain? Itulah di mana indikator berikutnya masuk.

Kekuatan Stablecoin Sedang Membangun Lagi

Jika penjual jangka pendek mendekati kelelahan, pertanyaan selanjutnya sederhana: Apakah ada cukup kekuatan beli baru untuk meningkatkan harga?

Saat ini, data stablecoin mengatakan ya.

Stablecoin Supply Ratio (SSR) telah turun ke 11,59, pembacaan terendah dalam lebih dari setahun. SSR membandingkan kapitalisasi pasar Bitcoin dengan total pasokan stablecoin. Ketika SSR turun, artinya stablecoin memegang lebih banyak kekuatan beli relatif terhadap Bitcoin. Para trader kadang menyebut ini sebagai “peluru kering.”

Stablecoin Supply Ratio Mencapai Titik Terendah dalam Setahun
Stablecoin Supply Ratio Mencapai Titik Terendah dalam Setahun: CryptoQuant

Level ini bahkan lebih rendah dari pembacaan 12,89 yang terlihat pada 8 April, periode yang sama ketika Bitcoin mencapai titik terendah di sekitar US$76.276 sebelum reli selama berbulan-bulan. SSR yang lebih rendah berarti stablecoin dapat membeli lebih banyak Bitcoin per unit pasokan, yang biasanya muncul di dekat titik terendah pasar.

Konfirmasi kedua datang dari RSI SSR, yang disorot oleh analis Maartunn. Ada di sekitar 26, level yang berulang kali selaras dengan titik terendah Bitcoin selama pasar bearish sebelumnya. RSI yang rendah di sini berarti kekuatan beli stablecoin terjual berlebihan relatif terhadap ukuran Bitcoin — setup langka yang sering muncul sebelum pergeseran tren.

RSI SSR Mencapai Titik Terendah: X

Kenaikan cadangan stablecoin dan SSR yang sangat terkompresi menunjukkan bahwa pasar memiliki likuiditas yang dibutuhkan untuk rebound pasar bull kripto.

Profit Altcoin Mungkin Diam-Diam Menguatkan Kasus Reli Pasar Bull Crypto

Kapitulasi jangka pendek dan SSR rendah sudah menunjukkan bahwa tekanan jual hampir habis. Lapisan berikutnya datang dari altcoin, di mana reset-nya bahkan lebih dalam.

Data terbaru dari Glassnode menunjukkan bahwa hanya sekitar 5% dari pasokan altcoin yang masih untung, yang merupakan tingkat yang biasanya terlihat selama tahap akhir kapitulasi. Ketika hampir setiap holder merugi, pasar biasanya memiliki sedikit sekali yang bisa dijual.

Altcoin relative profits are stabilizing in deep capitulation territory, with only ~5% of supply in profit, while Bitcoin’s profits have just begun to decline sharply.
This unusual divergence between BTC and alts is unprecedented in prior cycles.

📉 https://t.co/IpxEWurY3i pic.twitter.com/HqmUmNwkvF

— glassnode (@glassnode) November 15, 2025

Ini mirip dengan pembersihan Bitcoin, di mana 95% dari semua koin yang dibeli dalam 155 hari terakhir sekarang mengalami kerugian — lebih tinggi daripada crash COVID dan FTX.

JUST IN: 95% of all Bitcoin bought in the last 155 days is now underwater

Higher than COVID (92%) and FTX (94%) pic.twitter.com/FHYVdF6MNY

— Bitcoin Archive (@BitcoinArchive) November 19, 2025

Kombinasi ini penting karena altcoin sering kali stabil sebelum Bitcoin ketika rasio untung turun tajam seperti ini. Meskipun dominan Bitcoin masih mendekati 60%, jarak antara penurunan keuntungan Bitcoin dan tingkat keuntungan altcoin yang mendekati nol menunjukkan altcoin mungkin lebih dekat untuk membentuk dasar.

Jika pasar bull kripto dimulai dari reset yang dalam, altcoin sering kali menjadi yang pertama merespons karena mereka tidak memiliki tekanan overhead yang tersisa. Ini meningkatkan kemungkinan bahwa fase yang dipimpin oleh altcoin bisa dimulai lebih dulu.

Sentimen Turun ke Ketakutan Ekstrem: Apakah Ini Cara Bull Market Dimulai?

Setelah melihat kerugian altcoin dan pasokan Bitcoin yang merugi, bagian berikutnya yang mengaitkan cerita bull market kripto adalah sentimen. Indeks Fear & Greed Bitcoin turun ke 10 pada 15 November, menandai bacaan terendahnya sejak 27 Februari, ketika Bitcoin diperdagangkan di dekat US$84.718. Bacaan sebelumnya datang hanya beberapa minggu sebelum Bitcoin mencapai titik terendah pada bulan April dan memulai reli yang sama yang kami sebutkan sebelumnya — pergerakan dari US$76.276 pada 8 April menjadi US$123.345 pada 13 Agustus, lompatannya sebesar 62%.

Fear And Greed Index Reset: Glassnode

Penurunan baru ke 10 ini penting karena ketakutan ekstrem biasanya muncul setelah sebagian besar penjualan selesai. Bahkan selama rebound April, indeks hanya mencapai 18 sebentar dan tidak pernah jatuh kembali ke 10. Jatuh ke rentang itu lagi menandakan bahwa pasar sudah melalui pencucian emosionalnya.

Pemimpin industri seperti Thomas Chen, CEO Function, juga menggambarkan fase ini sebagai sudah tercuci dan emosional:

“Perilaku allocator telah condong tajam ke arah selloff dengan lebih dari US$2,8B arus keluar… hampir terasa seperti kembali ke pertanyaan: apakah saya bahkan ingin memegang BTC di lingkungan ini? Dengan Fear and Greed Index pada ketakutan ekstrem, ini terlihat mirip dengan crash Luna 2022,” ucapnya.

Datang tepat setelah kapitulasi altcoin dan rasio stablecoin yang paling rendah, reset ketakutan ini memperkuat argumen yang lebih luas bahwa dasar untuk pasar bull kripto berikutnya mungkin sedang terbentuk.

Death Cross Baru Selesai — Akankah Bitcoin Bereaksi?

Sinyal terakhir yang menunjuk ke kemungkinan pasar bull kripto adalah death cross baru yang terbentuk pada 15 November. Death cross terjadi ketika rata-rata bergerak 50-hari jatuh di bawah rata-rata bergerak 200-hari. Rata-rata bergerak menunjukkan harga penutupan rata-rata selama periode, jadi crossover ini sering kali menyoroti kelelahan tren alih-alih awal dari crash panjang.

Bitcoin turun sekitar 17% selama seluruh fase “crossing-in”, menghasilkan sinyal terakhir. Langkah ini hampir identik dengan penurunan 16% yang terlihat selama setup death cross April. Struktur April itu terwujud sepenuhnya, menghapus momentum lemah, lalu reli April hingga Agustus dimulai.

Crypto Market Analysis And Death Cross
Crypto Market Analysis And Death Cross: TradingView

Kali ini, sesuatu yang serupa terjadi di bawah permukaan. Harga membuat titik terendah yang lebih tinggi selama dua fase pasar ini, tapi RSI membuat titik terendah yang lebih rendah. RSI melacak momentum, dan divergensi bullish tersembunyi seperti ini biasanya mengisyaratkan bahwa penjual sudah lelah. Ini bertindak seperti pelepasan tekanan terakhir sebelum uptrend yang dimulai sebelumnya berlanjut. Dan ini selaras dengan teori kapitulasi puncak yang dibagikan sebelumnya.

Fred Thiel, CEO MARA Holdings, mengemukakan bahwa penurunan baru-baru ini mencerminkan pencucian yang didorong oleh faktor makro, bukan hanya peristiwa grafik.

“Penurunan Bitcoin di bawah US$90.000 mencerminkan badai sempurna dari hambatan makro dan pengambilan keuntungan. Pemegang jangka panjang telah mendistribusikan lebih dari 815.000 BTC dalam sebulan terakhir, penjualan paling agresif sejak 2024,” terang dia.

Jika Bitcoin bertahan di atas titik terendah terbaru, death cross dapat berakhir sebagai reset lain daripada breakdown.

Bitcoin had a death cross today.

Note that prior death crosses marked local lows in the market.

Of course, when the cycle is over, the death cross rally fails.

The time for Bitcoin to bounce if the cycle is not over would be starting within the next week.

If no bounce occurs… pic.twitter.com/Rg8pSxYMva

— Benjamin Cowen (@intocryptoverse) November 16, 2025

Hal ini terjadi awal tahun ini, dan ini adalah salah satu alasan mengapa trader berpikir dasar pasar bull kripto sedang terbentuk kembali dengan diam-diam. Namun, jika harga Bitcoin tidak segera merespons crossover yang baru-baru ini terbentuk ini, awal pasar bull harus menunggu lebih lama.

  •  

Harga Dogecoin Nampaknya Siap Menuju Langkah Berikutnya — Naik Sepertinya Bukan Arah yang Mungkin

Dogecoin (DOGE) diperdagangkan dekat US$0,156, turun hampir 19% selama sebulan terakhir dan 11% dalam minggu ini. Sementara beberapa koin berkapitalisasi besar mencoba menunjukkan tanda pemulihan awal, harga Dogecoin justru sebaliknya. Tren masih cenderung lebih rendah, dan sinyal di grafik dan on-chain menunjukkan kelemahan daripada pemulihan.

Struktur jangka pendek menunjukkan mengapa kelemahan harga Dogecoin (DOGE) dapat terus berlanjut sebelum ada kenaikan berarti yang bisa terjadi.


Momentum Melemah Saat Hidden Bearish Divergence Terbentuk

Masalah paling jelas ada di data momentum. Antara 15 November dan 18 November, harga Dogecoin membuat level tertinggi yang lebih rendah, tapi RSI membuat level tertinggi yang lebih tinggi. RSI, atau Relative Strength Index, mengukur apakah tekanan beli atau jual kuat. Ketika RSI naik saat harga membuat level tertinggi lebih rendah, itu membentuk hidden bearish divergence.

Trader memperlakukan ini sebagai peringatan kelanjutan, artinya tren turun yang ada masih memiliki ruang.

DOGE Prints A Bearish Divergence
DOGE Prints A Bearish Divergence: TradingView

Ingin lebih banyak wawasan token seperti ini? Daftar untuk Newsletter Harian Editor Harsh Notariya di sini.

Kelemahan ini menjadi lebih meyakinkan ketika melihat holder DOGE jangka panjang. Glassnode’s Hodler Net Position Change menunjukkan berapa banyak koin yang dipegang lebih dari 155 hari berpindah. Wallet ini biasanya hanya menjual ketika keyakinan runtuh.

Pada 9 November, holder jangka panjang mendistribusikan sekitar 62,35 juta DOGE. Pada 19 November, angka itu meningkat menjadi 237,20 juta DOGE. Itu adalah peningkatan tajam hampir 175 juta DOGE dalam sepuluh hari, lonjakan 280%. Ini mencerminkan peningkatan tekanan jual jangka panjang yang jelas.

HODLers Keep Dumping
HODLers Keep Dumping: Glassnode

Secara keseluruhan, momentum melemah, dan holder dengan keyakinan kuat menarik diri. Kombinasi itu membuat rebound jangka pendek mudah untuk dilupakan. Sambil mengekspos risiko penurunan.


Harga Dogecoin Berpotensi Turun Lagi Kecuali Level Kunci Tertembus

Harga Dogecoin terus condong lebih rendah seiring struktur trennya, jadi support berikutnya datang dari level proyeksi berbasis tren. Level penting pertama berada di US$0,150, yang telah berulang kali bertindak sebagai lantai jangka pendek. Kehilangan dukungan ini bisa mendorong harga menuju US$0,140 dan bahkan US$0,127 jika sentimen pasar yang lebih luas melemah.

Ke atas, harga Dogecoin perlu merebut kembali US$0,163 untuk menghentikan pola bearish. Gerakan bersih di atas US$0,163 akan mengubah momentum cukup untuk menargetkan US$0,186, resistance besar berikutnya di grafik. Sampai itu terjadi, tren penurunan tetap utuh, dan setiap lonjakan berisiko dilupakan.

Dogecoin Price Analysis
Analisis Harga Dogecoin: TradingView

Saat ini, gambaran keseluruhan tetap sederhana. Tren negatif, momentum mendukung penjual, dan holder jangka panjang masih mendistribusikan. Kecuali Dogecoin mulai merebut kembali level kunci, tren harga DOGE kemungkinan akan berlanjut — sayangnya bukan ke arah yang diharapkan trader jangka panjang.

  •  
❌