3 Prediksi Harga Teratas Bitcoin, Emas, dan Perak saat Saham Keluar dari Zona Ketakutan
Harga Bitcoin, emas, dan perak tetap diperdagangkan dengan kecenderungan bullish minggu ini, karena aset kripto pionir dan dua komoditas safe haven tersebut menanggapi keputusan suku bunga The Fed yang sudah lewat.
Setelah para pengambil kebijakan memutuskan memangkas suku bunga sebesar seperempat poin persentase, data menunjukkan pasar saham Amerika Serikat tidak lagi menunjukkan rasa takut, pergerakan penting yang terakhir kali terjadi di awal Oktober.
Bitcoin, Emas, dan Perak: Update Prospek Harga saat Ketentraman Pasar Saham Kembali
Pasar saham AS mencetak rekor tertinggi pada Kamis, 11 Desember, dan para analis memproyeksikan potensi kenaikan lebih lanjut. Rekor ini terjadi setelah The Fed memangkas suku bunga, yang biasanya mendorong naiknya harga saham.
Biaya pinjaman yang lebih rendah meningkatkan keuntungan perusahaan, mendorong investasi bisnis, dan menambah nilai pada pendapatan di masa depan. Selain itu, kredit yang lebih murah memperbesar belanja konsumen, sementara investor bergeser dari obligasi ke saham demi imbal hasil lebih tinggi.
Kondisi tersebut secara bersamaan memperbaiki likuiditas dan selera risiko, yang biasanya mendorong harga saham naik di banyak sektor. Inilah sebabnya pasar saham kini tidak lagi menunjukkan ketakutan.
JUST IN 🚨: Stock Market says Goodbye to Fear for the first time since early October 🫡🥳🫂 pic.twitter.com/vSd1qLkbkO
— Barchart (@Barchart) December 11, 2025
Sementara itu, Bitcoin, emas, dan perak juga menunjukkan optimisme serupa, dengan harga XAU dan XAG melonjak karena biaya menyimpan aset turun dan ekspektasi inflasi meningkat.
Sinyal Reversal Bullish Mulai Terbentuk pada Harga Bitcoin karena Arus Likuiditas Kembali
Grafik harian Bitcoin memperlihatkan harga mulai pulih di dalam channel naik yang jelas, dan channel ini terbentuk setelah koreksi tajam dari level tertinggi di awal Oktober.
Meski harga BTC masih di bawah exponential moving average utama (50 dan 100, masing-masing pada US$96.583 dan US$101.943), BTC mulai menunjukkan tanda-tanda stabilisasi arah tren. Pola ini tampak dari setiap titik terendah baru yang selalu lebih tinggi dari titik sebelumnya — sebuah ciri klasik pola pemulihan awal.
Volume Profiles yang bullish (batang horizontal hijau) memperlihatkan node volume tinggi di sekitar level Fibonacci 78,6%, menandakan para bull bisa saja membela US$90.358 sebagai support penting.
Level ini bisa menjadi titik tumpuan perubahan harga, dan berpotensi menjadi pijakan untuk pergerakan BTC selanjutnya ke atas.
Jika candlestick mampu menutup secara decisif di atas level US$90.358, BTC bisa mengincar klaster likuiditas besar di kisaran US$98.000–US$103.000.
Sementara itu, indikator RSI (Relative Strength Index) tetap netral, yang berarti masih ada ruang untuk ekspansi ke kedua arah.
Histogram indikator AO (Awesome Oscillator) makin menuju wilayah positif dan sudah berwarna hijau, menandakan momentum bullish mulai berkembang.
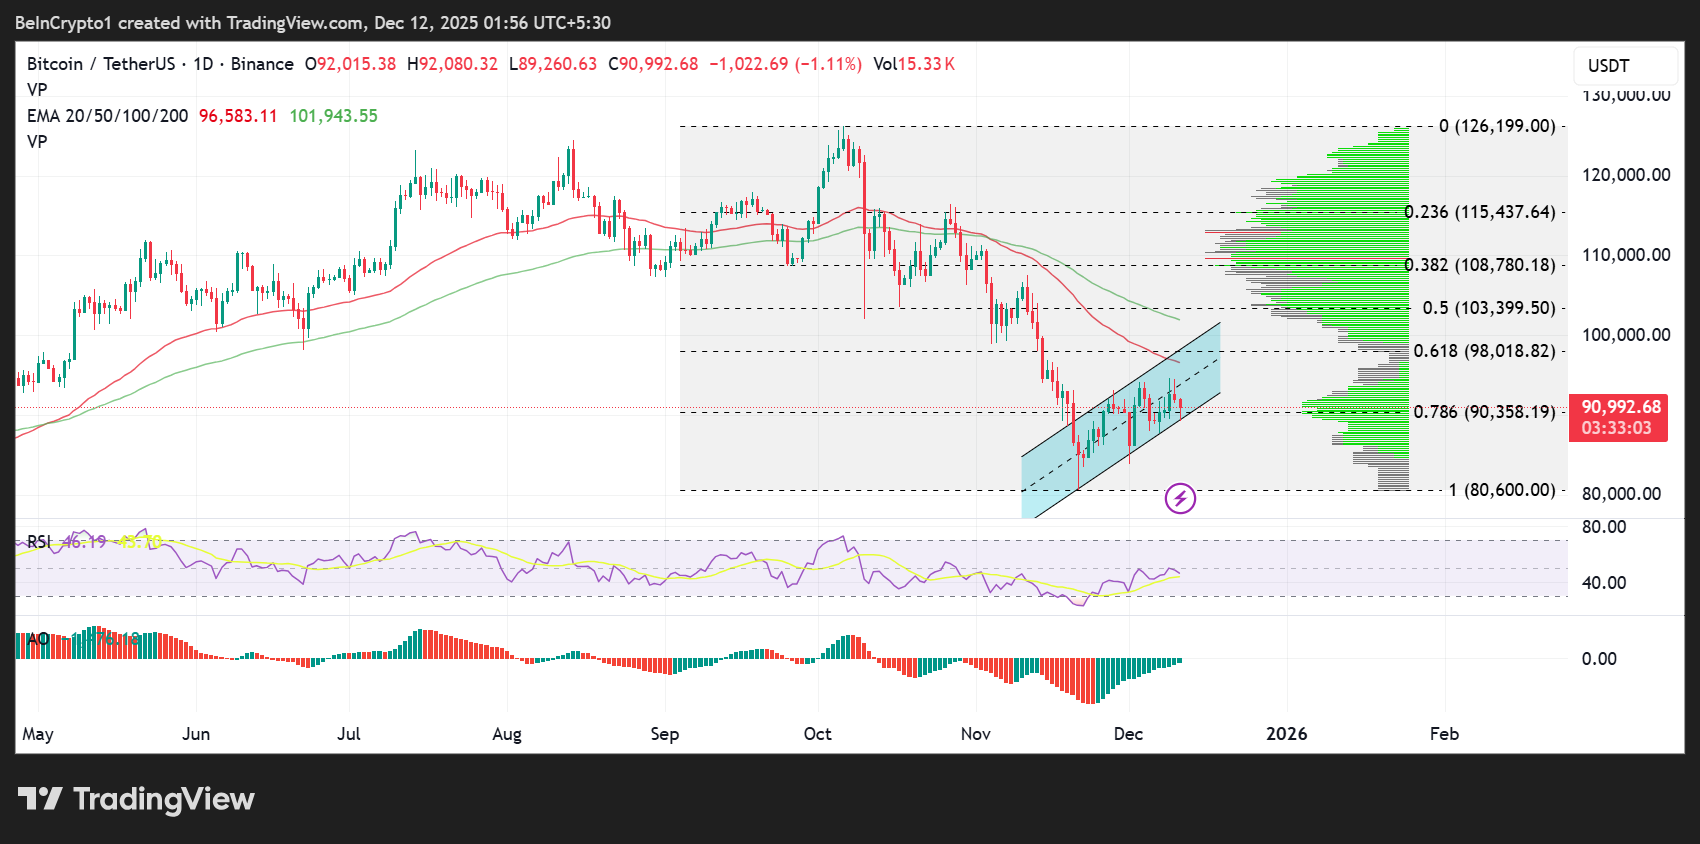
Meski begitu, kelanjutan bullish jangka pendek masih bergantung pada terjaganya struktur channel naik. Jika harga menembus batas bawah channel yang bertepatan dengan level Fibonacci 78,6% di US$90.358, BTC berpotensi mendapat tekanan bearish; momentum jual berikutnya kemungkinan mendorong BTC ke kisaran antara US$86.000 sampai US$80.600.
Tantangan utama tetap pada upaya merebut kembali posisi EMA, terutama EMA 50-hari dan 100-hari yang berada di sekitar US$96.583 dan US$101.943.
Secara historis, BTC biasanya bergerak lebih cepat begitu menembus atas moving average tersebut pada masa konsolidasi pertengahan siklus.
Secara keseluruhan, BTC menunjukkan pemulihan yang terkontrol, volume yang meningkat, dan channel yang konstruktif, namun konfirmasi utama hanya akan datang jika bull berhasil menguasai level psikologis US$100.000.
Momentum Breakout Harga Emas Semakin Kuat di Atas Resistance Kunci
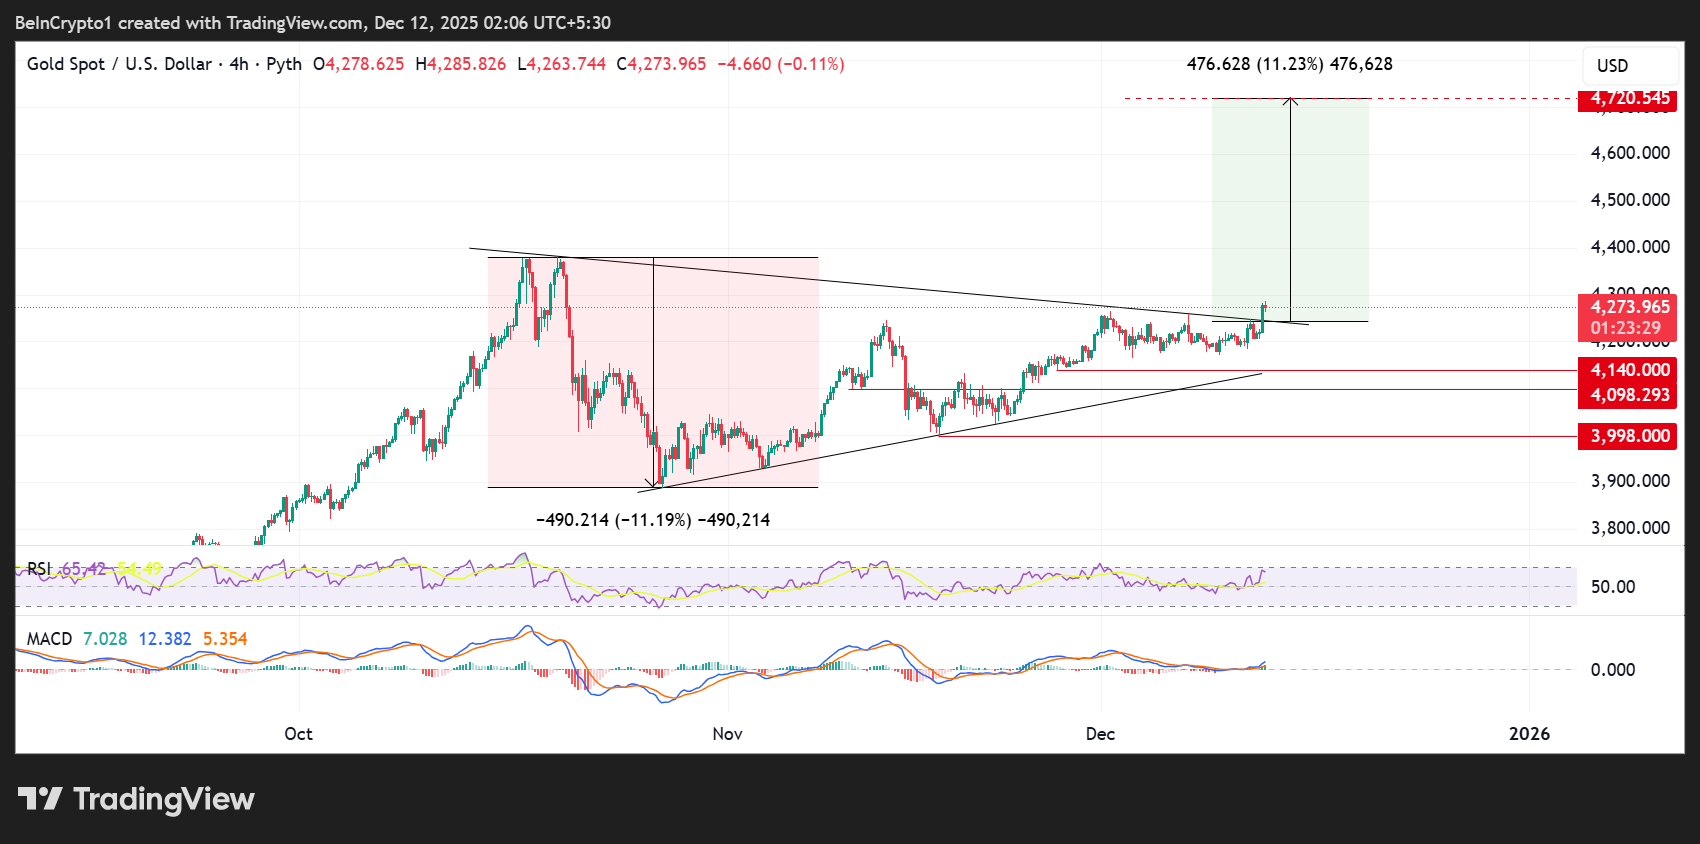
Grafik 4 jam untuk pasangan XAU/USD memperlihatkan harga emas hampir menembus breakout bersih dari formasi segitiga simetris yang makin mendatar. Formasi teknikal ini muncul setelah koreksi tajam sebesar US$490 (-11,19%) di awal kuartal.
Segitiga simetris di puncak uptrend sering menjadi pola kelanjutan di mana harga berkonsolidasi sebelum melanjutkan arahnya. Breakout emas selaras dengan pola ini, karena berhasil menembus garis downtrend dengan momentum kuat.
Pergerakan terukur dari segitiga memperkirakan target ke atas sekitar US$4.720, naik sekitar 11% dari titik breakout.
Saat ini, harga emas mulai stabil di sekitar US$4.273, level di mana candle breakout ditutup. Selama harga emas tetap di atas batas atas segitiga, struktur bullish masih bertahan.
Trader yang ingin ambil posisi long di XAU/USD sebaiknya menunggu konfirmasi retest sukses di garis tren atas.
RSI berada di tengah-tengah kisaran, tapi cenderung bullish di angka 65, menandakan emas masih belum overbought. Arahnya yang naik biasanya menjadi setup sehat untuk kelanjutan tren.
Garis MACD (Moving Average Convergence Divergence) sudah berpotongan bullish dan mulai melebar, yang menjadi pertanda kekuatan kenaikan terus bertambah.
Level support yang perlu diperhatikan ada di US$4.180, US$4.140, US$4.098, dan pivot lebih dalam pada US$3.998, yang menjadi dasar koreksi sebelumnya. Selama harga emas masih di atas level-level ini, kontrol tetap di tangan bull.
Kita juga perlu memperhatikan bahwa breakout Gold selaras dengan tren ekonomi makro yang lebih luas: ketidakpastian geopolitik yang meningkat, ekspektasi inflasi yang terus berlangsung, dan permintaan tinggi dari bank sentral.
Central banks are ramping up gold purchases:
— The Kobeissi Letter (@KobeissiLetter) December 4, 2025
Global central banks purchased +53 tonnes of gold in October, the most since November 2024.
This marks a +194% jump compared to July, and the 3rd-straight monthly acceleration.
In the first 10 months of the year, central banks have… pic.twitter.com/7pZWyEjjvf
Sementara itu, secara teknikal, struktur harga mendukung kemungkinan untuk menguji ulang, bahkan mungkin melewati, level tertinggi terbaru.
Sinyal Cup-and-Handle Jangka Panjang Harga Silver Menargetkan Kenaikan Besar
Grafik harga Silver secara multi-dekade menampilkan salah satu struktur bullish jangka panjang terkuat di komoditas, yaitu breakout Pola Cup & Handle multi-siklus yang besar.
Pola “cup” dimulai dari puncak tahun 1980 hingga penolakan pada tahun 2011, dengan pergerakan terukur sebesar 871%. Pola “handle”-nya memang lebih kecil, tapi masih kuat, terbentuk dari tahun 2011 sampai 2024 dan menunjukkan pergerakan terukur 152%. Kedua pola ini bertemu di garis breakout yang sama, yaitu di sekitar US$36, level yang sudah lebih dari 40 tahun sulit dilewati oleh Silver.
Candle terbaru menunjukkan breakout tegas dan volume tinggi yang melampaui resistance ini, mengindikasikan adanya perubahan struktur, bukan sekadar lonjakan sesaat.
Saat sebuah komoditas berhasil menembus batas harga multi-dekade, price discovery bisa terjadi sangat cepat karena tidak ada resistance historis yang menghalangi.
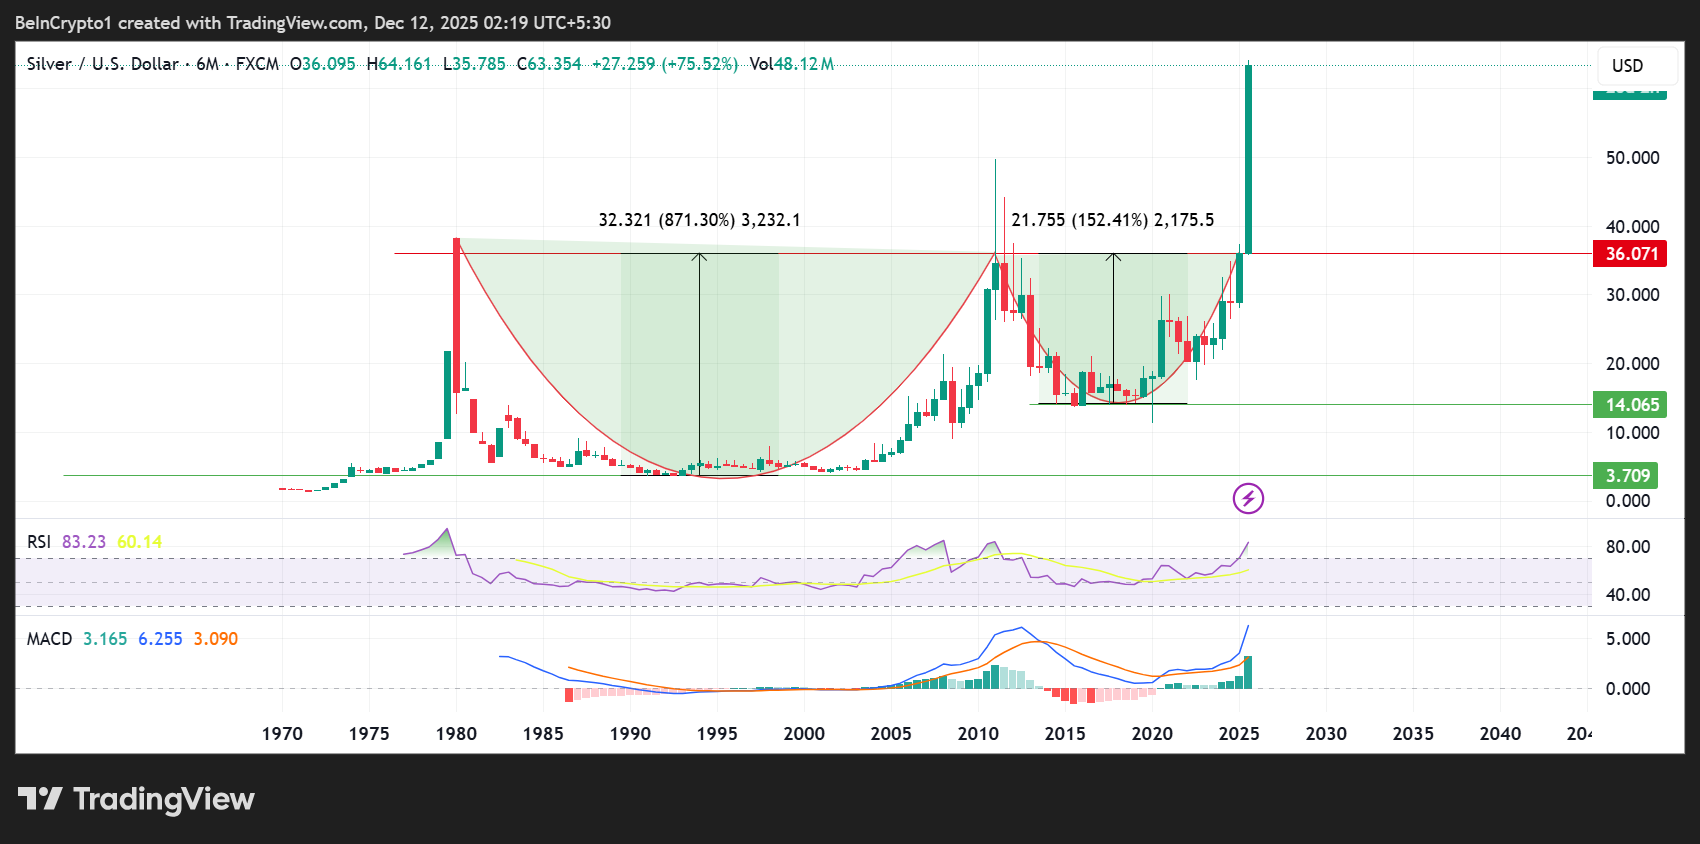
namun, Relative Strength Index (RSI) berada di wilayah overbought (di atas 80), tapi dalam breakout jangka panjang seperti ini, kondisi tersebut biasanya menandakan adanya momentum, bukan kelelahan. Moving Average Convergence Divergence (MACD) juga telah masuk ke area bullish secara kuat sehingga tren kenaikannya terkonfirmasi.
Jika breakout ini terus bertahan, maka level psikologis berikutnya yang penting adalah US$70, dengan zona all-time high tahun 1980/2011, sekarang di dekat US$50, telah berubah menjadi support.
Silver soars to $64 for the first time in history 🚨📈 Dear God 🤯👀 pic.twitter.com/2ffpTOUB1E
— Barchart (@Barchart) December 11, 2025
Mengingat masa konsolidasi yang lama dan pasokan yang terbatas selama beberapa tahun terakhir di pasar silver, kenaikan melebihi level tertinggi historis memang masih bisa terjadi.
namun, harga Silver secara historis memang cenderung volatile, jadi retest ke zona US$36 bisa saja terjadi sebelum tren penguatan berlanjut secara lebih stabil.