Reading view

4 Warning Signs Suggest Ethereum (ETH) Price May Not Recover Soon in Late December

Ethereum (ETH) has traded sideways around the $3,000 level for the past two weeks. Although recent buying came from firms such as BitMine and Trend Research, the demand appears insufficient.

The following data reveals the rest of the picture, as selling pressure remains equally strong. As a result, ETH is unlikely to stage a quick recovery in the short term.

1. ETH Exchange Reserves Rise Again During Christmas Week

Data from CryptoQuant shows that ETH reserves across all exchanges had declined steadily for several months.

However, the trend reversed in December. This week, ETH exchange reserves increased from 16.2 million to 16.6 million. That rise equals roughly 400,000 ETH transferred onto exchanges.

Ethereum Exchange Reserve. Source: CryptoQuant.

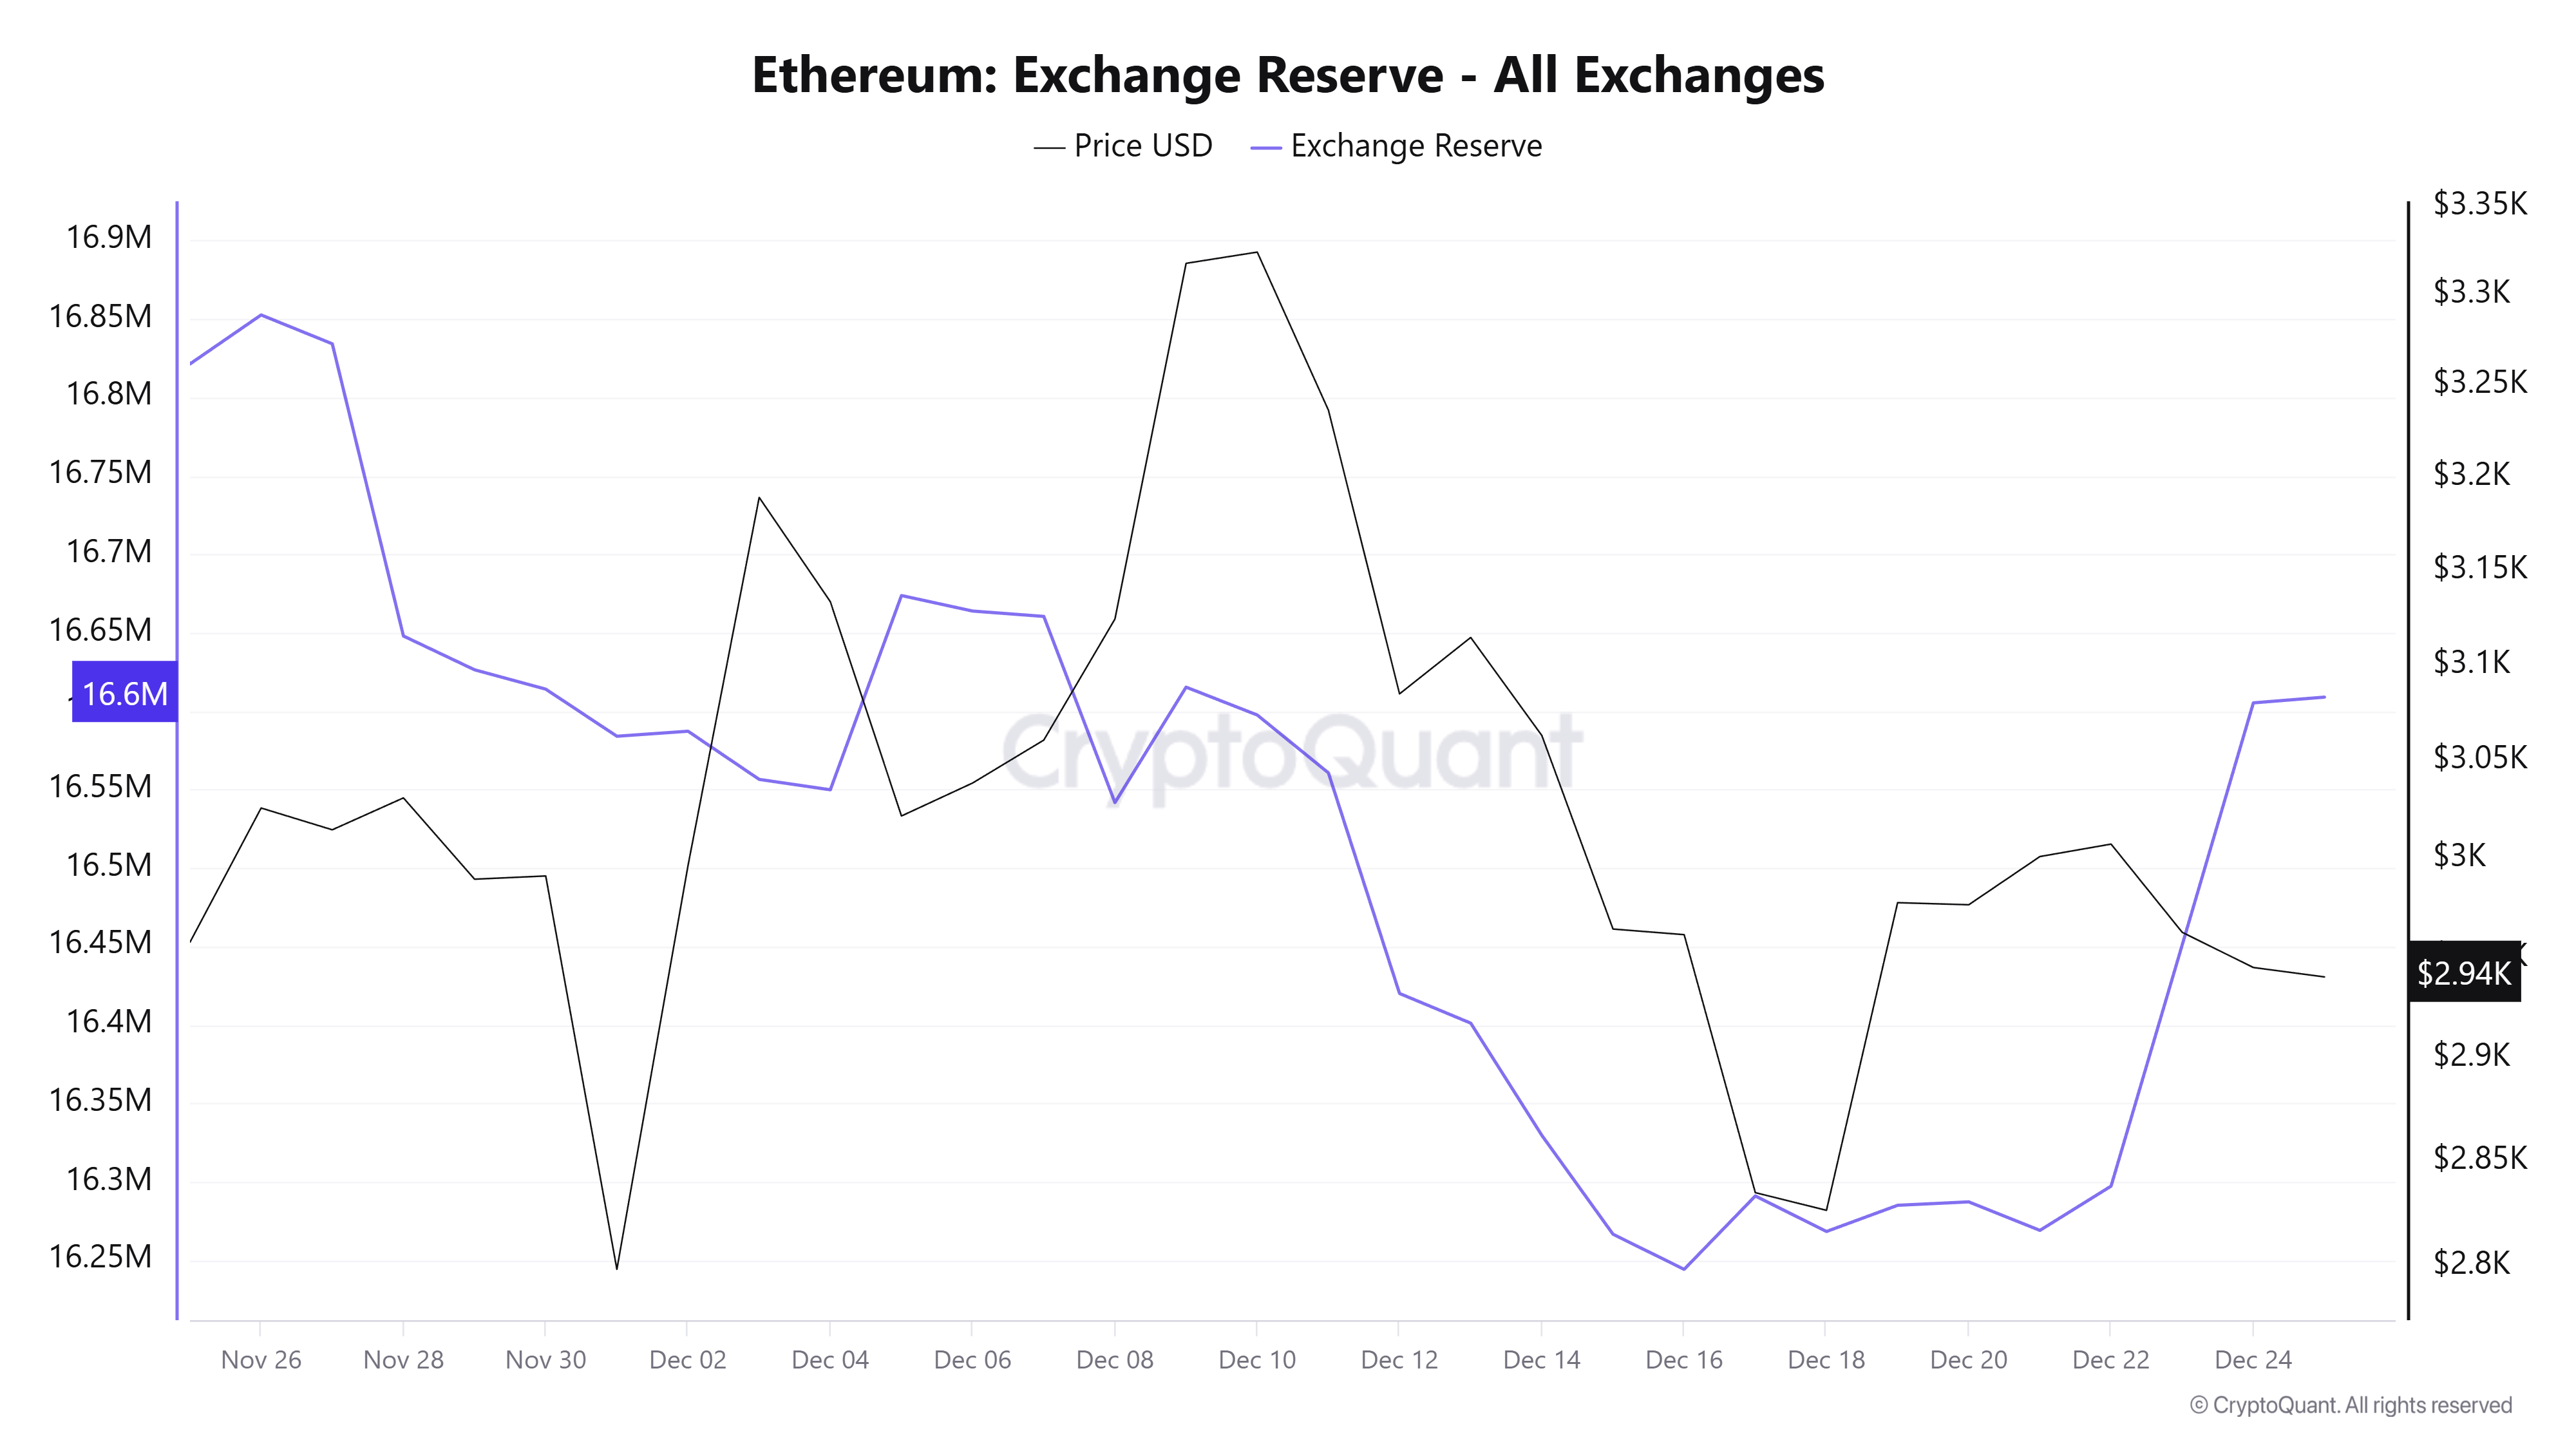
On-chain data reveals that one “OG whale” alone deposited 100,000 ETH into Binance.

Recent BeInCrypto reports show that BitMine Immersion Technologies bought 67,886 ETH this week. Trend Research also purchased 46,379 ETH. Even so, these figures remain smaller than the amount of ETH moved onto exchanges.

If ETH is transferred to exchanges for liquidation and exceeds buying absorption, selling pressure could intensify. If this trend continues into the final days of the year, ETH prices may face further downside pressure.

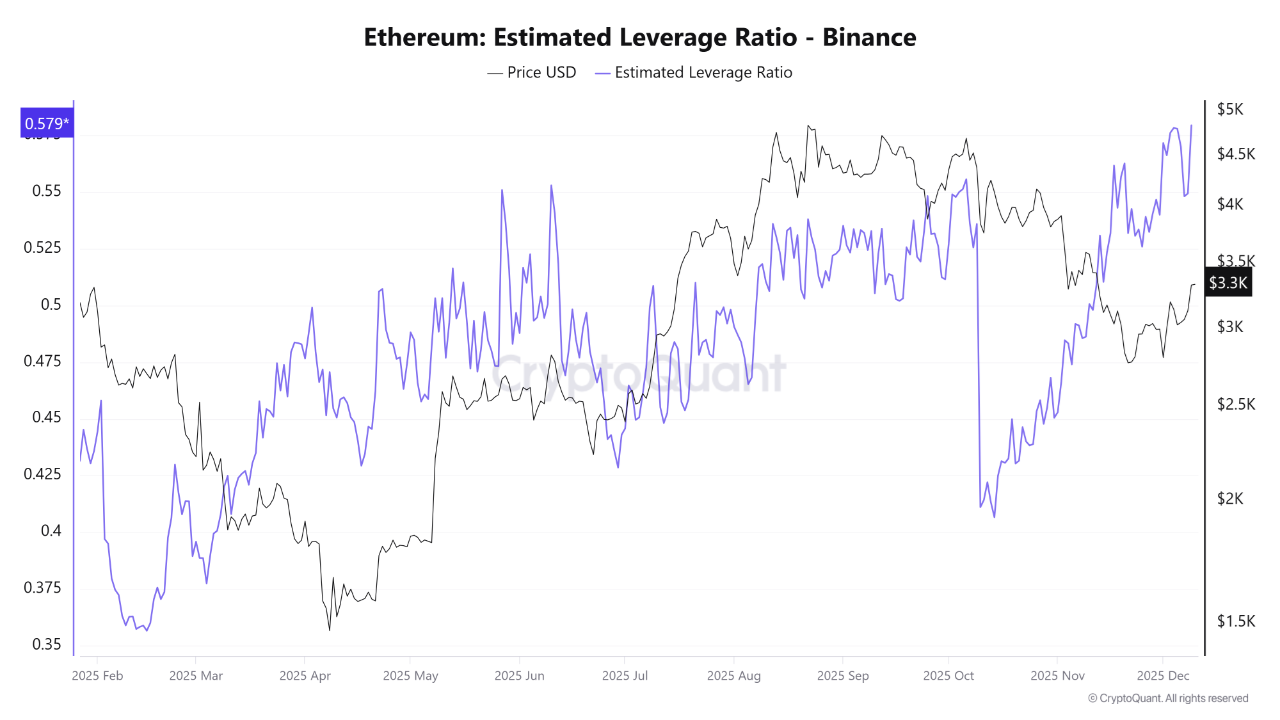
2. Ethereum’s Estimated Leverage Ratio Remains Elevated

Another key metric is Ethereum’s Estimated Leverage Ratio, which remains at an alarming level, according to CryptoQuant.

This ratio equals exchange open interest divided by coin reserves. It reflects the average leverage used by traders. Rising values suggest more investors are taking on higher leverage in derivatives markets.

Ethereum Estimated Leverage Ratio. Source: CryptoQuant.

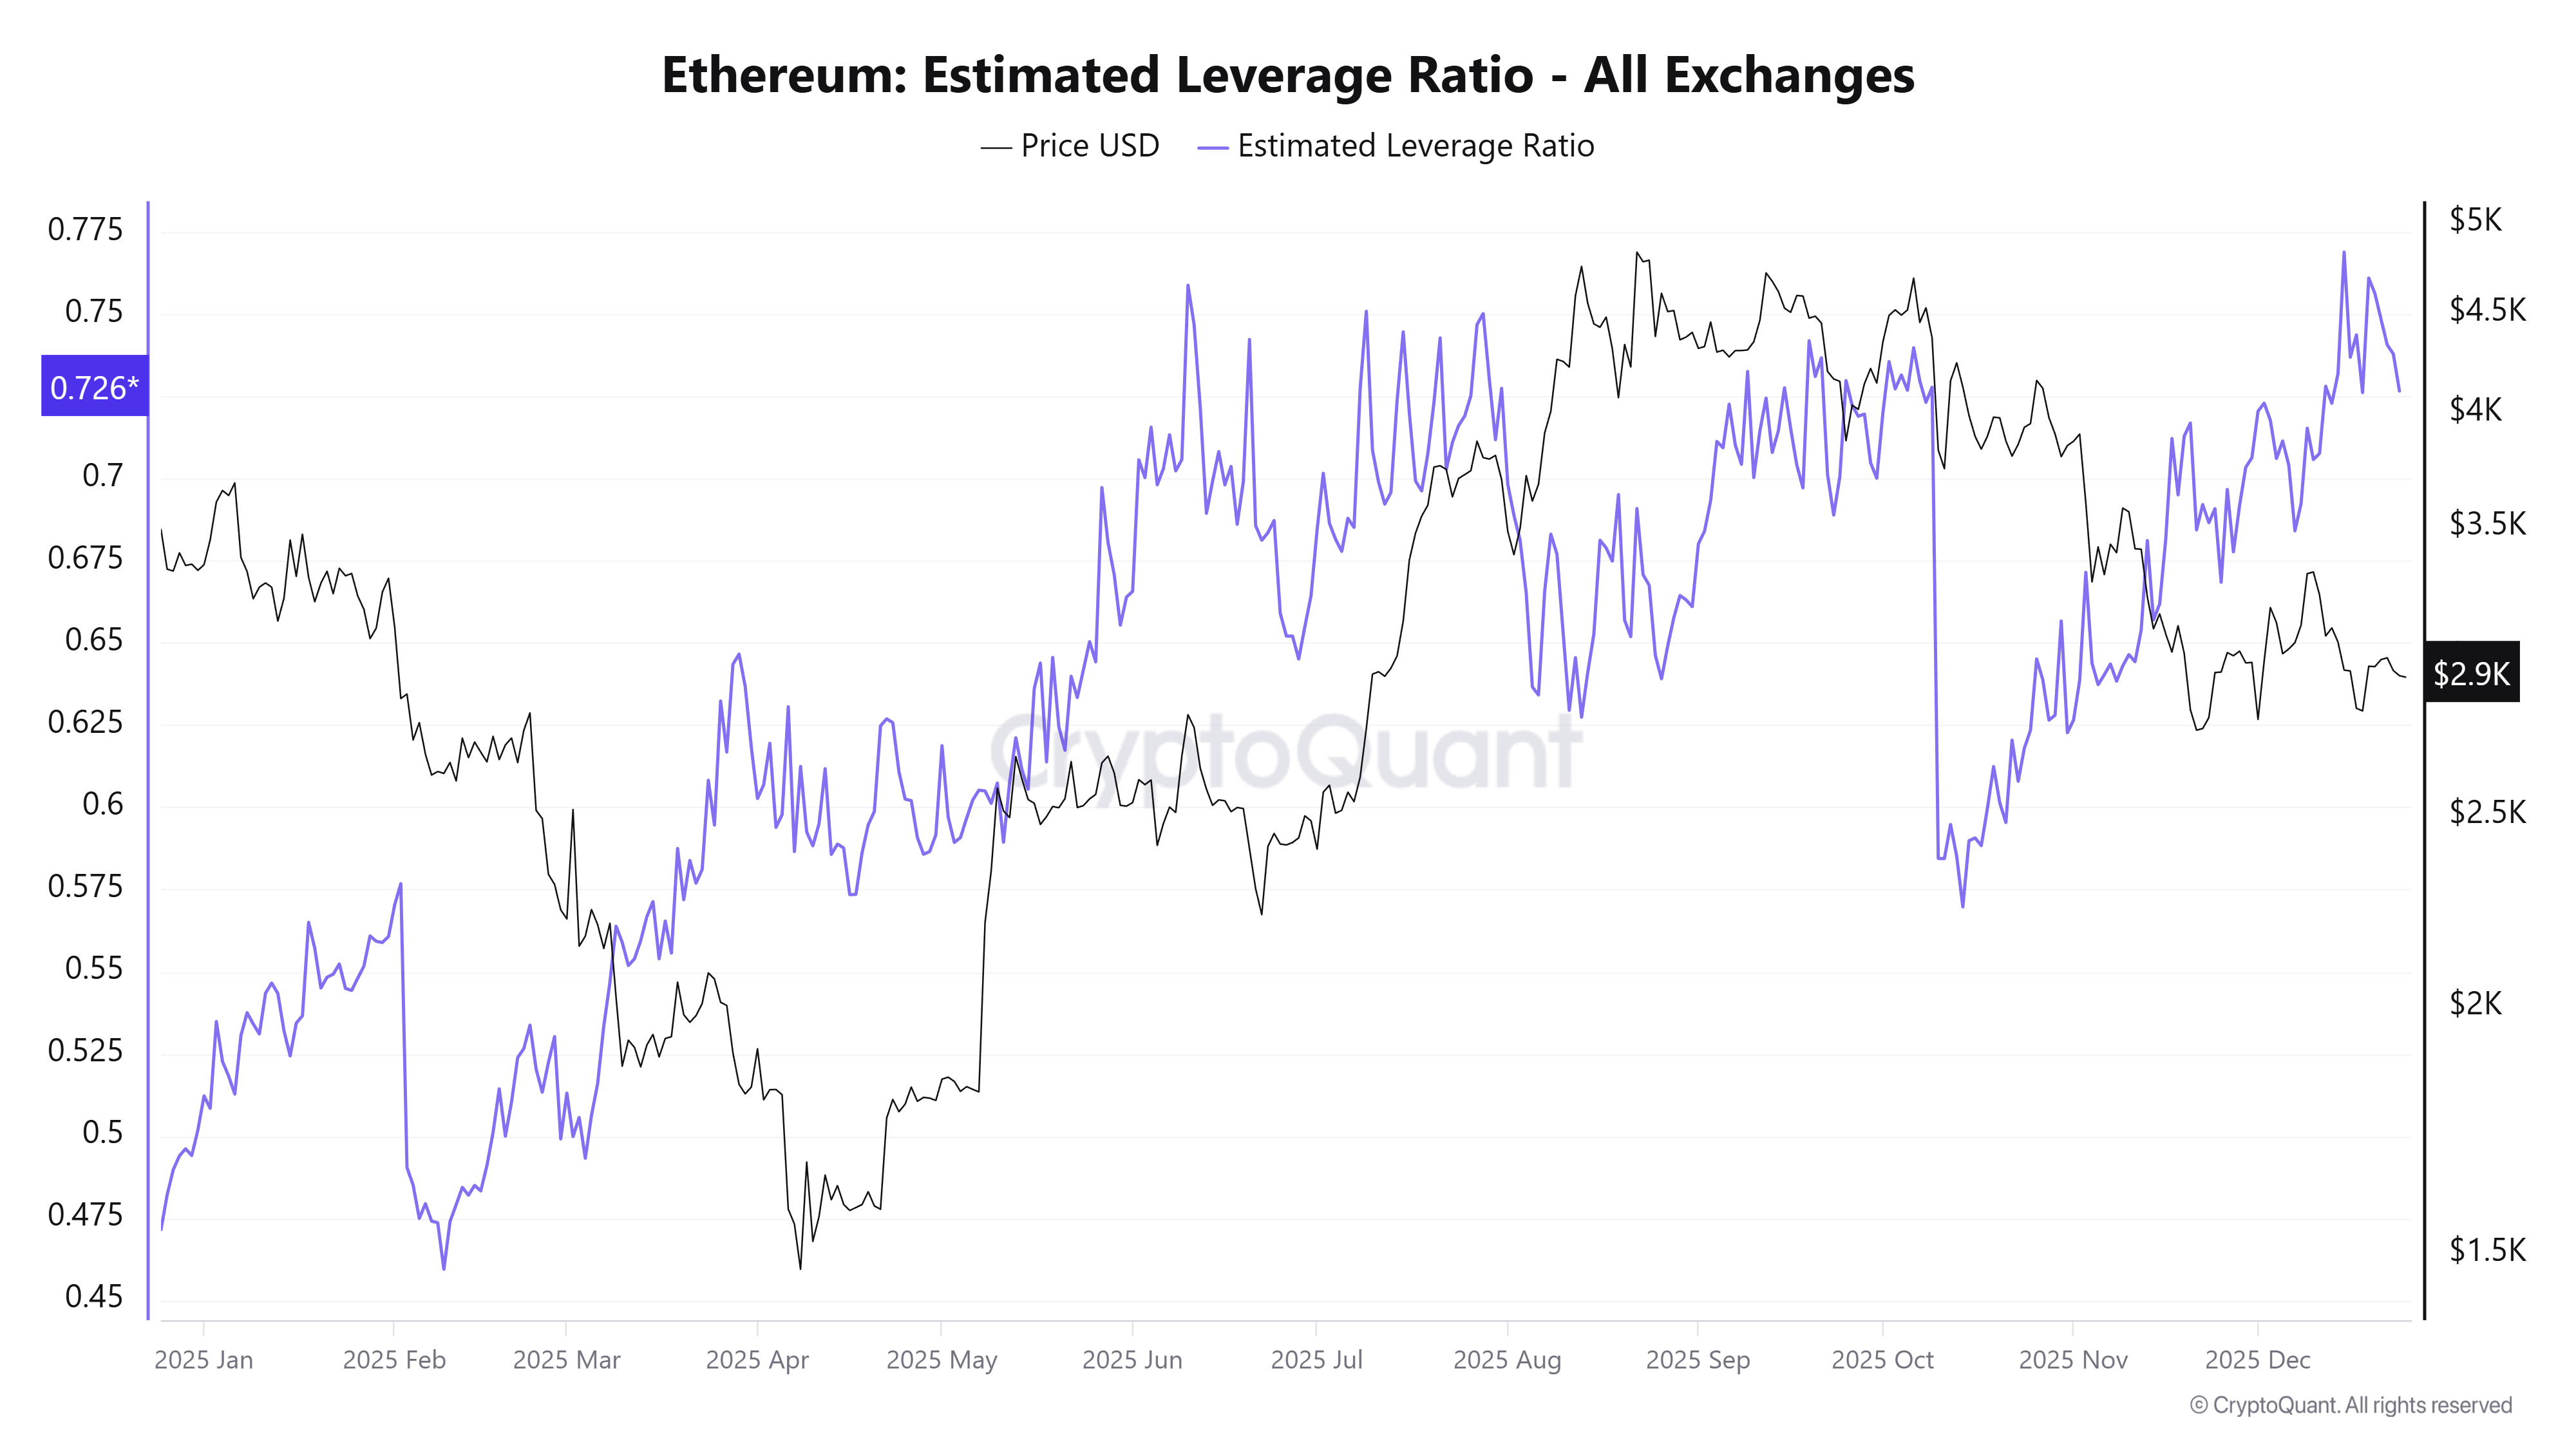
On October 10, the day with the largest liquidation losses in market history, the ratio stood at 0.72. Currently, the ratio has returned to similar levels. Some readings even reach as high as 0.76.

With leverage still elevated, Ethereum remains vulnerable to small price moves. Such moves could trigger cascade liquidations.

3. Ethereum Coinbase Premium Turns Deeper Negative in December

BeInCrypto previously reported that Ethereum’s Coinbase Premium turned negative in December.

During Christmas week, the indicator moved further into negative territory. It currently stands at -0.08, the lowest level in the past month.

Ethereum Coinbase Premium Index. Source: CryptoQuant.

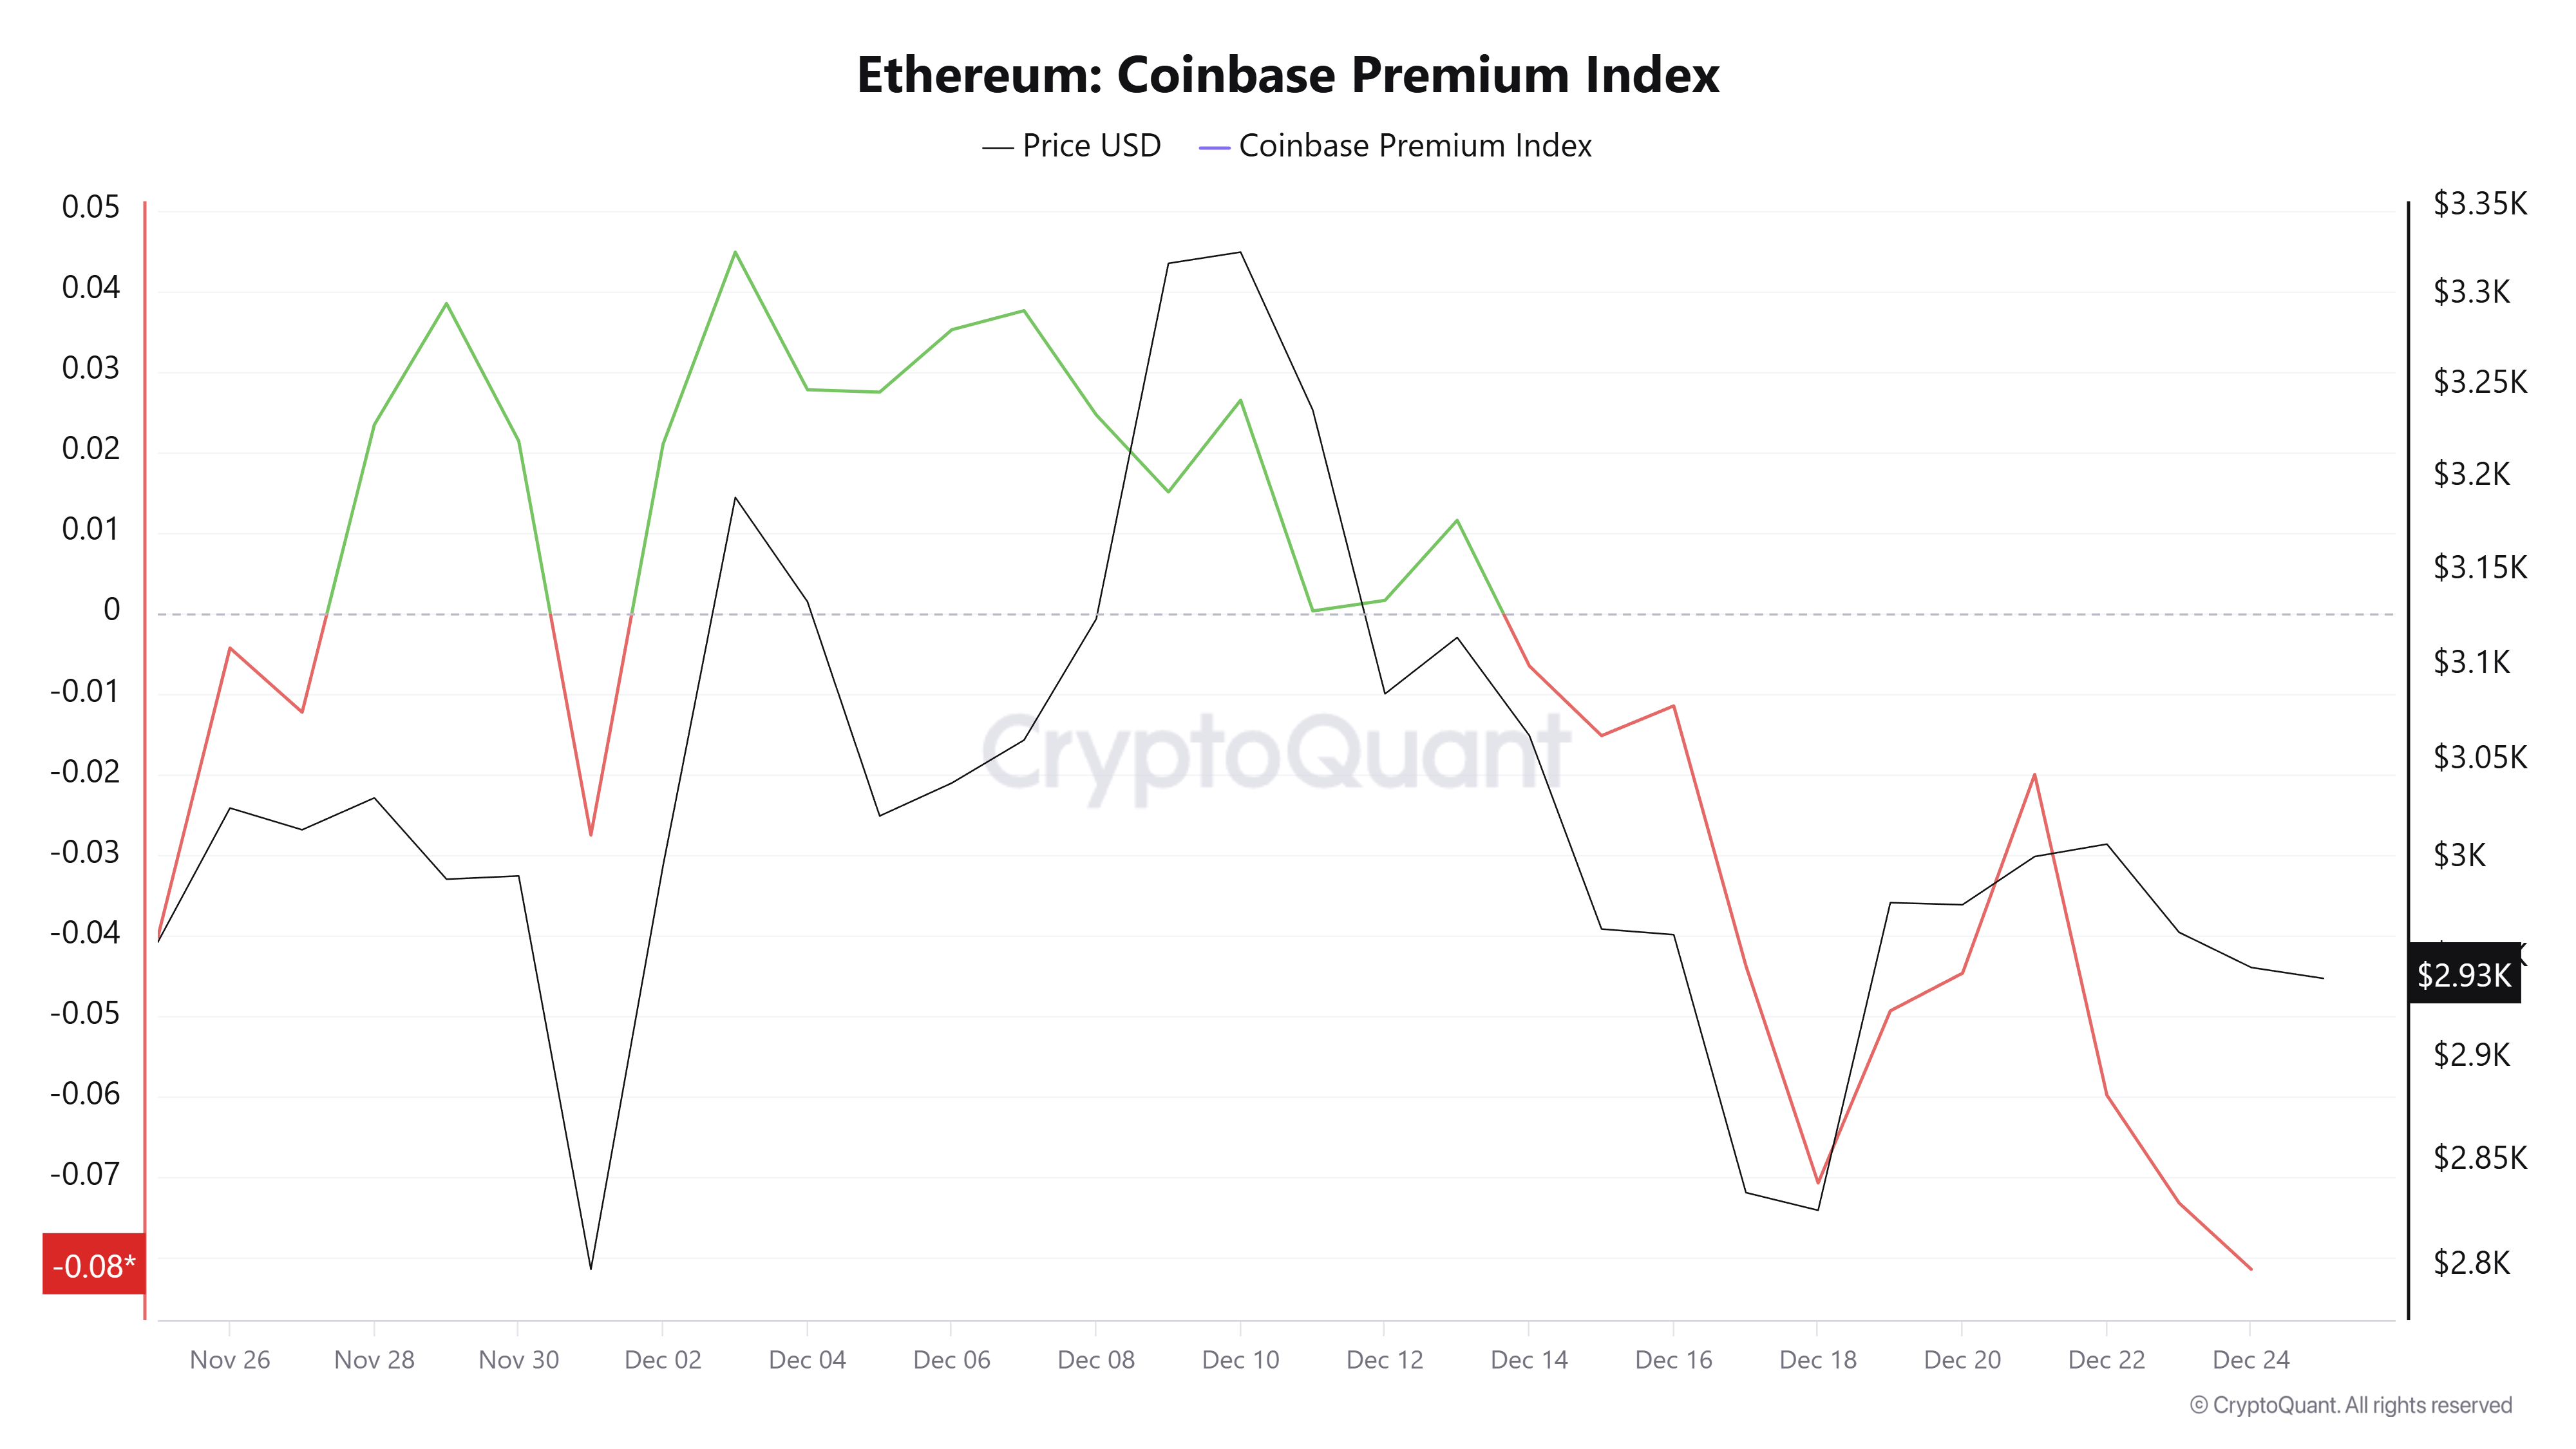
This indicator measures the percentage price difference between ETH on Coinbase Pro (USD pair) and Binance (USDT pair). Negative values indicate lower prices on Coinbase.

This trend suggests that US investors continue selling at discounted prices. ETH may struggle to recover in the short term until the Coinbase Premium turns positive again.

4. ETH ETF Flows Enter a Second Consecutive Month of Outflows

December is nearing its end, and ETH ETF flows are likely to close with a second straight month of net outflows.

Last month, net flows across all ETH ETFs reached -$1.42 billion. This month, outflows have already exceeded $560 million.

Total Ethereum Spot ETF Net Inflow. Source: SoSoValue.

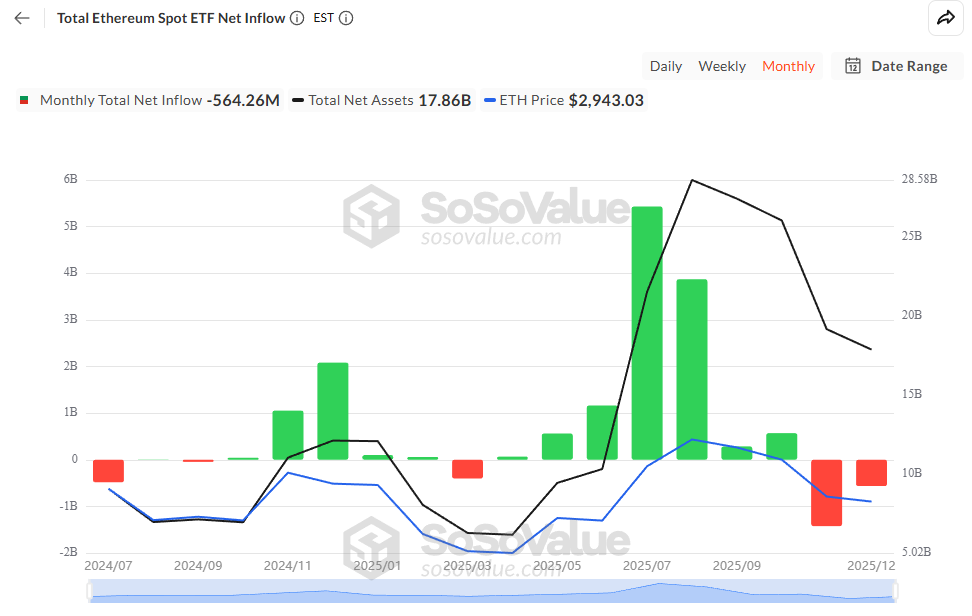
Without fresh inflows, ETH lacks upward momentum. If outflows persist, especially during low-volume year-end holidays, prices may retest lower support levels.

“Since early November, the 30D-SMA of net flows into both Bitcoin and Ethereum ETFs has turned negative and remained so. This persistence suggests a phase of muted participation and partial disengagement from institutional allocators, reinforcing the broader liquidity contraction across the crypto market,” Glassnode reported.

In summary, four signals—rising exchange reserves, elevated leverage, deeply negative premiums, and sustained ETF outflows—suggest that ETH may remain in a consolidation phase or face further downside.

Maintaining proper stop-loss levels for derivatives positions and using prudent capital allocation for spot buying can help traders reduce risk amid unexpected volatility.

The post 4 Warning Signs Suggest Ethereum (ETH) Price May Not Recover Soon in Late December appeared first on BeInCrypto.

  •  

4 Tanda Peringatan yang Menunjukkan Harga Ethereum (ETH) Mungkin Tidak Segera Pulih di Akhir Desember

Ethereum (ETH) bergerak sideways di sekitar level US$3.000 selama dua minggu terakhir. Walaupun pembelian terbaru datang dari perusahaan seperti BitMine dan Trend Research, permintaan ETH sepertinya masih kurang kuat.

Data berikut menunjukkan gambaran lainnya, karena tekanan jual juga tetap sama kuat. Alhasil, ETH nampaknya sulit untuk pulih dengan cepat dalam jangka pendek.

1. Cadangan ETH di Exchange Naik Lagi saat Pekan Natal

Data dari CryptoQuant memperlihatkan bahwa cadangan ETH di seluruh exchange menurun secara stabil selama beberapa bulan terakhir.

namun, tren ini berbalik pada bulan Desember. Minggu ini, cadangan ETH di exchange naik dari 16,2 juta menjadi 16,6 juta. Kenaikan ini setara dengan sekitar 400.000 ETH yang masuk ke exchange.

Ethereum Exchange Reserve. Source: CryptoQuant.
Cadangan Ethereum di Exchange | Sumber: CryptoQuant.

Data on-chain mengungkap bahwa satu “OG whale” sendiri menyetor 100.000 ETH ke Binance.

Laporan terbaru BeInCrypto menyebutkan bahwa BitMine Immersion Technologies membeli 67.886 ETH pekan ini. Trend Research juga membeli 46.379 ETH. Meski begitu, jumlah ini tetap lebih kecil dibanding ETH yang masuk ke exchange.

Jika ETH dipindahkan ke exchange untuk likuidasi dan melebihi daya serap pembelian, tekanan jual bisa makin meningkat. Bila tren seperti ini terus berlanjut hingga akhir tahun, harga ETH bisa saja mengalami tekanan turun lebih lanjut.

2. Rasio Leverage Estimasi Ethereum Masih Tinggi

Metik lain yang penting adalah Estimated Leverage Ratio Ethereum, yang menurut CryptoQuant masih berada pada level yang mengkhawatirkan.

Rasio ini adalah open interest exchange dibagi dengan cadangan koin. Nilai ini menggambarkan rata-rata leverage yang digunakan para trader. Jika angkanya naik, berarti semakin banyak investor mengambil leverage tinggi di pasar derivatif.

Ethereum Estimated Leverage Ratio. Source: CryptoQuant.
Estimated Leverage Ratio Ethereum | Sumber: CryptoQuant.

Pada 10 Oktober, hari dengan kerugian likuidasi terbesar sepanjang sejarah pasar, rasio ini berada di angka 0,72. Saat ini, rasionya kembali ke level serupa. Bahkan ada data yang menunjukkan level hingga 0,76.

Karena leverage masih tinggi, Ethereum tetap rentan terhadap pergerakan harga kecil yang bisa memicu likuidasi secara beruntun.

3. Coinbase Premium Ethereum Makin Negatif di Bulan Desember

Sebelumnya, BeInCrypto melaporkan bahwa Coinbase Premium Ethereum berubah negatif pada bulan Desember.

Selama pekan Natal, indikator ini makin turun ke wilayah negatif. Saat ini, angkanya berada di -0,08; level terendah selama sebulan terakhir.

Ethereum Coinbase Premium Index. Source: CryptoQuant.
Indeks Coinbase Premium Ethereum | Sumber: CryptoQuant.

Indikator ini mengukur perbedaan harga dalam persen antara ETH di Coinbase Pro (pair USD) dan Binance (pair USDT). Nilai negatif berarti harga di Coinbase lebih rendah.

Tren ini menunjukkan investor AS terus menjual ETH dengan harga diskon. ETH nampaknya belum bisa pulih dalam waktu dekat, kecuali jika Coinbase Premium kembali positif.

4. Arus ETF ETH Masuk Bulan Kedua Berturut-turut Catat Outflow

Bulan Desember hampir berakhir, dan arus ETF ETH kemungkinan bakal berakhir dengan arus keluar bersih untuk bulan kedua berturut-turut.

Bulan lalu, arus bersih dari seluruh ETF ETH mencapai -US$1,42 miliar. Bulan ini saja, arus keluar sudah melewati US$560 juta.

Total Ethereum Spot ETF Net Inflow. Source: SoSoValue.
Total Arus Masuk Bersih ETF Ethereum Spot | Sumber: SoSoValue.

Tanpa ada arus masuk baru, ETH kehilangan momentum naik. Jika arus keluar tetap terjadi, khususnya saat volume perdagangan rendah di akhir tahun, harga kemungkinan akan mengetes ulang level support yang lebih rendah.

“Sejak awal November, 30D-SMA arus bersih ke exchange-traded fund (ETF) Bitcoin dan Ethereum sudah berubah negatif dan tetap seperti itu. Pola ini menunjukkan adanya fase partisipasi yang lesu dan pelepasan sebagian posisi dari institusi, dan memperkuat kontraksi likuiditas yang terjadi di seluruh pasar aset kripto,” lapor Glassnode dalam laporannya.

Kesimpulannya, ada empat sinyal—cadangan exchange yang meningkat, leverage yang tinggi, premi yang sangat negatif, dan arus keluar yang terus-menerus dari ETF—yang menandakan bahwa ETH mungkin masih berkonsolidasi atau bahkan bisa turun lebih dalam lagi.

Menjaga level stop-loss yang tepat untuk posisi derivatif dan menggunakan alokasi modal yang bijak saat membeli spot bisa membantu trader mengurangi risiko di tengah volatilitas tak terduga.

  •  

Arthur Hayes Jual Lebih dari 1.800 Ethereum (ETH), Ada Apa?

Arthur Hayes, co-founder BitMEX, terus menarik ETH dari wallet pribadinya dan memindahkannya ke exchange selama bulan Desember. Aksi ini membuat investor yakin bahwa ia sedang menjual ETH. Langkah ini sepertinya menjadi bagian dari rencana rebalancing portofolio yang sebelumnya telah ia bagikan.

Aktivitas ini terjadi saat portofolionya menunjukkan perubahan signifikan. Kini ia lebih banyak memegang stablecoin dan jumlah ETH yang jauh lebih sedikit.

Arthur Hayes Diduga Menjual Lebih dari 1.800 ETH dalam Sepekan Terakhir

Laporan terbaru dari Lookonchain, akun yang memonitor aktivitas on-chain signifikan, mengungkap bahwa Hayes menjual tambahan 682 ETH di Binance. Transaksi ini bernilai sekitar US$2 juta. Ia mengalihkan dana tersebut ke token DeFi.

Arthur Hayes(@CryptoHayes) has just deposited another 682 $ETH($2M) into #Binance to sell and rotate into high-quality DeFi tokens.

In the past week, he has sold a total of 1,871 $ETH($5.53M), and bought 1.22M $ENA($257.5K), 137,117 $PENDLE($259K), and 132,730 $ETHFI($93K).… pic.twitter.com/2mddOY3H1t

— Lookonchain (@lookonchain) December 24, 2025

Sebelumnya, BeInCrypto melaporkan bahwa Hayes telah mentransfer 508,6 ETH, yang bernilai sekitar US$1,5 juta, ke Galaxy Digital.

Secara total, Hayes sudah menjual sekitar 1.871 ETH sepanjang minggu lalu. Perkiraan nilai transaksi ini mencapai US$5,53 juta. Ia menggunakan hasilnya untuk membeli token DeFi seperti ENA, PENDLE, dan ETHFI.

Price Performance of Tokens Purchased by Hayes. Source: TradingView
Kinerja Harga Token yang Dibeli Hayes | Sumber: TradingView

Data menunjukkan bahwa token-token tersebut sudah turun 80–90% sepanjang tahun ini. Hayes nampaknya memanfaatkan harga yang rendah. Ia memperkirakan token-token ini akan memberikan imbal hasil di masa depan. Sebelumnya, Hayes juga secara terbuka membagikan strateginya di akun X pribadinya.

“Kami sedang melakukan rotasi keluar dari ETH dan masuk ke nama-nama DeFi berkualitas tinggi, yang kami yakini dapat mengungguli pasar seiring membaiknya likuiditas fiat,” ujar Hayes.

Namun, jika kita mencermati data portofolionya menggunakan data Arkham, terdapat perubahan besar.

Pertama, jumlah ETH yang tersimpan di wallet pribadinya terus menurun dari 16.000 ETH di tahun 2022. Sejak November, jumlah ETH yang ia pegang turun dari 6.500 ETH menjadi 3.160 ETH. Ini menandakan bahwa ia telah menjual lebih dari 3.440 ETH selama periode tersebut.

Arthur Hayes's Investment Portfolio. Source: Arkham
Portofolio Investasi Arthur Hayes | Sumber: Arkham

Sementara itu, dari total portofolio senilai US$74 juta, hampir US$48 juta ditempatkan pada USDC. Stablecoin kini menguasai lebih dari 60% dari total nilai portofolionya.

Arthur Hayes's Investment Portfolio. Source: Arkham
Portofolio Investasi Arthur Hayes | Sumber: Arkham

Data Arkham memperlihatkan bahwa Hayes meningkatkan kepemilikan USDC dari US$1 juta menjadi hampir US$48 juta sejak pertengahan November. Periode ini juga berbarengan dengan sentimen pasar yang masih berada di zona fear hingga extreme fear.

Pada umumnya, kenaikan kepemilikan stablecoin bisa menandakan kesiapan untuk membeli di saat harga turun atau sikap yang lebih hati-hati.

Sebelumnya, Arthur Hayes pernah memprediksi bahwa Ethereum bisa mencapai US$20.000. Ia menyebut bahwa memegang 50 ETH bisa membuat seseorang jadi miliuner pada pemilu presiden AS mendatang.

Bagaimana pendapat Anda tentang manuver Hayes yang jual 1.800 Ethereum (ETH) miliknya? Yuk, sampaikan pendapat Anda di grup Telegram kami. Jangan lupa follow akun Instagram dan Twitter BeInCrypto Indonesia, agar Anda tetap update dengan informasi terkini seputar dunia kripto!

  •  

Bitcoin’s Trading Pair Flashes Down to $24,000 on Binance: Why You Need to be Careful

The BTC/USD1 trading pair on Binance experienced a brief flash crash. Bitcoin plunged to $24,000 before quickly recovering.

The incident did not affect Bitcoin prices on major pairs such as BTC/USDT. However, it highlighted liquidity risks in newly launched trading pairs.

BTC/USD1 crash to $24,000 exposes low-liquidity risks

According to market data from Binance, the incident lasted only a few seconds. The BTC/USD1 price later stabilized above $87,000.

USD1 is a new stablecoin issued by World Liberty Financial. The project receives backing from the family of US President Donald Trump.

Charts from Binance showed a steep wick. The move did not trigger any liquidation damage.

BTC/USD1 price performance. Source: TradingView

The incident occurred during the Christmas holiday period. Trading volumes dropped sharply at that time. Some observers speculated that the move was a liquidity test for the BTC/USD1 pair.

Joao Wedson, founder of Alphractal, explained that this phenomenon appears more often in bear markets. Capital inflows tend to weaken during those phases.

“Low liquidity in some trading pairs across multiple exchanges has been causing sharp volatility. It leads to temporary price dislocations and arbitrage issues for a few minutes. This is more common than it seems when the market is in a bearish phase,” Joao Wedson explained.

Another, more detailed explanation from the investor community linked the incident to Binance’s promotional campaign for USD1. Binance recently launched a 20% APY promotion for up to $50,000 in USD1 per user.

WuBlockchain, a reputable market-watching account, reported a sharp surge in USD1 supply after the launch. Supply increased by more than 45.6 million tokens within a few hours. Total market capitalization rose above $2.79 billion.

The sudden inflow of capital into USD1 pushed the stablecoin’s price up by 0.2%.

USD1 Price Performance. Source: CoinGecko

The X account Punk explained that many investors attempted arbitrage. They borrowed USD1 and gradually sold it on the spot market to participants joining the promotion.

Meanwhile, some traders chose to sell through the BTC/USD1 pair. Thin liquidity caught them off guard. Prices collapsed sharply, causing the outcome described above.

“This is just a small fluctuation in the bear market. There is no need to worry. Many similar fluctuations will appear later,” investor Punk said.

Could a similar situation happen to BTC/USDT?

A broader question now draws attention. Could a similar event occur on the BTC/USDT pair? This pair holds the highest liquidity in the market. A sudden drop there would cause massive liquidation losses.

Analyst Maartunn cited Kaiko data. He noted that Bitcoin’s 1% market depth has increased significantly over the years.

“Depth didn’t just recover. It expanded. By the October 2025 highs, Binance 1% depth exceeded $600 million. That level stands above pre-2022 crash levels,” Maartunn said.

Bitcoin Market Depth on Binance. Source: Kaiko

He also emphasized that the decline in BTC/USDT prices did not erode liquidity. Over the course of more than 100 days, the BTC/USDT pair fell 21.77% (from $110,291 to $86,089). During that period, average daily spot volume reached $19.8 billion, totaling $613.5 billion.

With deeper market depth and abundant volume, a similar event on BTC/USDT remains unlikely.

However, the incident serves as a lesson for traders. Careful selection of trading pairs is essential. Low-liquidity pairs can cause severe slippage and unexpected losses.

The post Bitcoin’s Trading Pair Flashes Down to $24,000 on Binance: Why You Need to be Careful appeared first on BeInCrypto.

  •  

ADA turun 70% di 2025, namun 2 sumber permintaan baru mulai muncul untuk Cardano

Harga Cardano (ADA) turun 70% di tahun 2025, menghapus seluruh kenaikan dari tahun sebelumnya. Meski masih menjadi altcoin top-10 berdasarkan kapitalisasi pasar, ADA semakin membuat banyak holder kecewa.

Namun, akhir Desember menghadirkan tanda-tanda yang bisa mendukung potensi pemulihan ADA. Faktor paling menonjol adalah meningkatnya permintaan untuk Midnight (NIGHT).

Bagaimana Permintaan Trading Midnight (NIGHT) Bisa Berdampak pada ADA?

Pertama, lonjakan volume trading NIGHT di decentralized exchange (DEX) berbasis Cardano menjadi pendorong utama.

Midnight adalah jaringan blockchain yang dikembangkan oleh Input Output Global (IOG), perusahaan di balik Cardano. Jaringan ini mengutamakan privasi data dengan memanfaatkan teknologi zero-knowledge proof.

Cardanians, perusahaan yang menjalankan stake pool Cardano, menyampaikan bahwa trading NIGHT di DEX Cardano telah menciptakan gelombang baru aktivitas on-chain.

Cardano DEXs Volume. Source: Cardanians
Volume DEX Cardano | Sumber: Cardanians

Data menunjukkan volume trading di DEX Cardano mencapai 125 juta ADA minggu lalu dan 59 juta ADA sejauh minggu ini.

DexHunter, agregator DEX Cardano, mengungkapkan bahwa order book NIGHT memperlihatkan permintaan beli NIGHT dengan ADA lebih besar dibandingkan penjualannya. Secara spesifik, total order beli mencapai 1,38 juta ADA, sementara order jual hanya berjumlah 480.000 ADA.

Midnight (NIGHT) Order Book. Source: DexHunter
Order Book Midnight (NIGHT) | Sumber: DexHunter

“NIGHT adalah salah satu proyek paling dinantikan di Cardano saat ini, dan mungkin di seluruh ekosistem,” tulis DexHunter.

Sinyal-sinyal ini menunjukkan minat yang makin besar terhadap Midnight dan juga meningkatkan permintaan terhadap ADA sebagai aset dasar untuk biaya, likuiditas, dan swap.

Belum pasti sampai kapan minat terhadap Midnight akan bertahan. Namun untuk saat ini, permintaan tersebut sedang menciptakan momentum yang dapat berpadu dengan faktor-faktor lain untuk mendukung pemulihan ADA.

Cardano jadi aset pilihan di exchange-traded product (ETP) indeks aset kripto, sedangkan para holder tetap setia

Kedua, posisi unik ADA di produk investasi indeks kripto, yang dikenal sebagai Crypto Index ETP, juga punya peran penting.

Berdasarkan analisis dari ahli James Seyffart, ADA menjadi satu-satunya aset yang masuk ke dalam semua enam produk ETP yang ia ulas.

Notable and surprising to me — The only asset that made its way into all 6 of the products i looked at was Cardano ( $ADA). pic.twitter.com/Sf71ca3xKe

— James Seyffart (@JSeyff) December 17, 2025

James Seyffart memperkirakan akan ada lebih banyak Crypto Index ETP yang diluncurkan pada 2026. Produk exchange-traded ini memegang kumpulan aset kripto yang terdiversifikasi.

Keterlibatan Cardano di sebagian besar ETP mengindikasikan bahwa institusi keuangan melihat ADA sebagai aset yang stabil dan punya potensi jangka panjang yang kuat. Persepsi ini menempatkan ADA di atas banyak altcoin lainnya.

Dengan posisi seperti ini, semakin besar arus modal institusi yang akan masuk ke ADA. Hal ini juga mendorong tekanan pembelian positif dan menarik minat investor ritel.

Selain itu, data DeFiLlama memperlihatkan bahwa total value locked (TVL) Cardano, yang diukur dalam ADA, masih stabil di sekitar 500 juta meski pasar bergejolak. Jumlah ini menandakan pengguna tidak melakukan penarikan modal dan tetap mempertahankan posisi.

Cardano's Total Value Locked. Source: DeFiLlama
Total Value Locked Cardano | Sumber: DeFiLlama

Jumlah alamat aktif harian juga tetap stabil di kisaran 25.000 sejak awal tahun ini.

Penurunan harga yang dibarengi dengan aktivitas on-chain yang bertahan menandakan investor tidak meninggalkan ekosistem ini. Sikap ini mencerminkan kepercayaan jangka panjang dari para holder dan bisa menjadi pemicu untuk pemulihan ADA.

  •  

ADA Is Down 70% in 2025 —But 2 New Sources of Demand Are Emerging For Cardano

Cardano (ADA) price has dropped 70% in 2025, erasing all gains from last year. Despite remaining a top-10 altcoin by market capitalization, ADA has increasingly frustrated many holders.

However, late December has brought signs that could support a potential ADA recovery. The most notable factor is the rising demand for Midnight (NIGHT).

How Could Midnight (NIGHT) Trading Demand Impact ADA?

First, the surge in NIGHT trading volume on Cardano-based decentralized exchanges (DEXs) stands out as a key driver.

Midnight is a blockchain network developed by Input Output Global (IOG), the company behind Cardano. The network prioritizes data privacy by utilizing zero-knowledge proof technology.

Cardanians, a company running Cardano stake pools, reported that NIGHT trading on Cardano DEXs has created a new wave of on-chain activity.

Cardano DEXs Volume. Source: Cardanians

Data shows trading volume on Cardano DEXs reached 125 million ADA last week and 59 million ADA so far this week.

DexHunter, a Cardano DEX aggregator, reported that the NIGHT order book reflects stronger demand to buy NIGHT using ADA than to sell. Specifically, buy orders total 1.38 million ADA, while sell orders stand at only 480,000 ADA.

Midnight (NIGHT) Order Book. Source: DexHunter

“NIGHT is one of the most anticipated projects on Cardano today, and possibly across all ecosystems,” DexHunter stated.

These signals reflect growing interest in Midnight and increase demand for ADA as the base asset for fees, liquidity, and swaps.

How long the interest in Midnight will last remains uncertain. For now, it is creating demand momentum that could combine with additional factors to support an ADA recovery.

Cardano as a Preferred Asset in Crypto Index ETPs While Holders Remain Loyal

Second, ADA’s unique position in crypto index investment products, known as Crypto Index ETPs, also plays an important role.

According to an analysis by expert James Seyffart, ADA is the only asset included in all six ETP products he reviewed.

Notable and surprising to me — The only asset that made its way into all 6 of the products i looked at was Cardano ( $ADA). pic.twitter.com/Sf71ca3xKe

— James Seyffart (@JSeyff) December 17, 2025

James Seyffart expects more Crypto Index ETPs to launch in 2026. These exchange-traded products hold diversified baskets of crypto assets.

Cardano’s inclusion in most ETPs suggests that financial institutions view ADA as stable with strong long-term potential. This perception places ADA ahead of many other altcoins.

Such positioning encourages institutional capital inflows into ADA. It also creates positive buying pressure and attracts retail investors.

Additionally, DeFiLlama data indicate that Cardano’s total value locked (TVL), measured in ADA, has remained relatively stable at around 500 million, despite market volatility. This level indicates that users are not withdrawing capital and continue to hold positions.

Cardano's Total Value Locked. Source: DeFiLlama
Cardano’s Total Value Locked. Source: DeFiLlama

The number of daily active addresses has stayed stable at around 25,000 since the beginning of the year.

Falling prices combined with sustained on-chain activity suggest that investors are not exiting the ecosystem. This behavior reflects long-term confidence among holders and could become a catalyst for ADA’s recovery.

The post ADA Is Down 70% in 2025 —But 2 New Sources of Demand Are Emerging For Cardano appeared first on BeInCrypto.

  •  

Apakah Toncoin undervalued? Data Desember Sinyal Potensi Reli

Ekosistem Toncoin (TON), yang punya potensi menjangkau lebih dari satu miliar pengguna melalui Telegram, melewati tahun 2025 yang cukup suram. Harga TON turun 65% dari puncaknya di awal tahun.

Meski begitu, ada beberapa sinyal positif yang muncul di akhir Desember. Sinyal-sinyal ini bisa jadi dasar harapan untuk pemulihan TON di kuartal pertama 2026.

Volume Trading dan Aktivitas Jaringan Menunjukkan Peningkatan

Pertama, volume perdagangan harian TON naik pesat.

Berdasarkan data dari Tonscan, pada pekan ketiga Desember 2025, volume perdagangan harian TON sudah melebihi US$154 juta. Angka ini meningkat lebih dari 41,7%.

Ini adalah level volume perdagangan tertinggi di bulan Desember. Lonjakan ini menandakan aktivitas perdagangan mulai aktif lagi setelah sebelumnya sempat lesu akibat sentimen negatif di pasar altcoin.

TON price and trading volume. Source: Tonscan
Harga dan volume perdagangan TON | Sumber: Tonscan

TON bertahan di atas level US$1,4 dalam beberapa hari terakhir. Volume yang meningkat, ditambah penurunan harga yang mulai melambat, memberikan sinyal tekanan beli baru.

Tanda penting lain adalah kembalinya TON ke daftar “trending” di CoinGecko. Tren ini mencerminkan minat pencarian dan permintaan trading terhadap TON yang kembali muncul di bulan Desember. Hal ini juga bisa menjelaskan lonjakan volume perdagangan baru-baru ini.

Top Trending Crypto. Source: CoinGecko
Altcoin Paling Trending | Sumber: CoinGecko

Data on-chain juga menambah rasa optimistis.

Walaupun jumlah pengguna harian aktif (DAU) TON turun tajam dibanding 2024, kini penurunan itu mulai stabil. Aktivitas pengguna sebelumnya sempat melonjak akibat kampanye airdrop dan GameFi.

TON price and Daily Active Users. Source: Artemis
Harga TON dan Pengguna Harian Aktif | Sumber: Artemis

Data menunjukkan, dalam tiga bulan terakhir, jumlah pengguna aktif harian naik dari 70.000 jadi hampir 100.000. Pada periode yang sama, harga TON sempat turun dari US$3 menjadi US$1,4. Penyimpangan tren ini menunjukkan kepercayaan kembali muncul. Ini juga bisa menandakan investor mulai melihat TON sebagai aset yang undervalued.

Apa yang Menanti TON di 2026?

Pada acara Blockchain Life 2025 bulan Oktober lalu, Pavel Durov – founder Telegram – menegaskan niat Telegram untuk ambil peran lebih aktif dalam pengembangan teknologi inti TON di tahun 2026.

Pada Desember, Durov mengumumkan peluncuran resmi Cocoon, sebuah jaringan komputasi terdesentralisasi dan aman.
Pemilik GPU sudah mulai mendapatkan TON dengan cara menyumbangkan kekuatan komputasi mereka ke jaringan ini.

Investor yakin Pavel Durov dan Telegram akan terus memperluas upayanya untuk membawa TON ke potensi satu miliar pengguna setiap bulannya.

“Pada 2026, Telegram akan mempercepat pengembangan TON, seperti yang disampaikan Pavel Durov, dengan menambahkan bahwa kita seharusnya menantikan beberapa pengumuman besar. Semoga saja 2026 jadi tahun bullish untuk ekosistem TON.” — prediksi investor Mr. Satoshik .

Pencapaian penting lain juga baru-baru ini hadir. Kraken mengumumkan dukungan untuk platform xStocks.

Integrasi ini memungkinkan pengguna Telegram untuk membeli, menyimpan, dan mentransfer saham AS serta ETF yang sudah ditokenisasi langsung lewat TON Wallet.

“Setelah menjadi pionir tokenisasi saham di Solana dan ekspansi ke EVM lewat Ethereum, sekarang kami melangkah ke TON. Dengan langkah strategis ini, kami membawa solusi unggulan yang sudah dipilih 50.000 pengguna dan menggerakkan lebih dari US$13 miliar gabungan volume CEX + DEX, ke blockchain asli Telegram.” terang xStocks .

Berbagai perkembangan ini menjadi sinyal positif bagi investor yang berharap pada pemulihan TON. Tapi, menentukan titik terendah harga TON masih sulit. Sinyal ekonomi makro yang saling bertentangan masih memberi tekanan pada pasar altcoin secara umum.

  •  

Is Toncoin Undervalued? December Data Signals Potential Rebound

The Toncoin (TON) ecosystem, with potential access to more than one billion users through Telegram, experienced a relatively gloomy year in 2025. TON’s price dropped 65% from its early-year peak.

However, several positive signals appeared in late December. These signals could form the basis for expectations of a TON recovery in Q1/2026.

Trading Volume and Network Activity Show Improvement

First, TON’s daily trading volume increased sharply.

According to data from Tonscan, as of the third week of December 2025, TON’s daily trading volume had exceeded $154 million. This figure represented an increase of more than 41.7%.

This marked the highest trading volume level for December. The surge indicated a return of active trading after a slowdown caused by negative sentiment across the altcoin market.

TON price and trading volume. Source: Tonscan

TON has held above the $1.4 level in recent days. Rising volume, combined with a slowing pace of price decline, signals renewed buying pressure.

Another notable sign is TON’s return to “trending” status on CoinGecko. This trend reflects renewed search interest and trading demand for TON in December. It also helps explain the recent increase in trading volume.

Top Trending Crypto. Source: CoinGecko
Top Trending Crypto Source: CoinGecko

On-chain data adds further optimism.

Although TON’s daily active users (DAU) fell sharply compared with 2024, the decline now appears to be stabilizing. User activity previously reached record levels due to airdrop and GameFi campaigns.

TON price and Daily Active Users. Source: Artemis

Data show that over the past three months, the number of daily active users increased from 70,000 to nearly 100,000. During the same period, TON’s price fell from $3 to $1.4. This divergence suggests returning confidence. It may also indicate that investors view TON as undervalued.

What Awaits TON in 2026?

At the Blockchain Life 2025 event in October, Pavel Durov – Telegram’s founder – emphasized Telegram’s intention to take a more active role in developing TON’s core technology in 2026.

In December, Durov announced the official launch of Cocoon, a decentralized and secure computing network.
GPU owners have begun earning TON by contributing computing power to the network.

Investors believe Pavel Durov and Telegram will continue to expand their efforts to bring TON to a potential one billion users each month.

“In 2026, Telegram is gonna ramp up work on developing TON, as Pavel Durov said, adding that we should expect some major announcements. Hoping 2026 will be a bullish year for the TON ecosystem.” – Investor Mr. Satoshik predicted.

Another major milestone recently emerged. Kraken announced support for the xStocks platform.

This integration allows Telegram users to buy, hold, and transfer tokenized U.S. stocks and ETFs directly within the TON Wallet.

“After pioneering tokenized equities on Solana and expanding to EVM through Ethereum, we set foot on TON. With this strategic step, we take the same winning solution chosen by 50,000 users, moving over $13B in combined CEX + DEX volume, to the blockchain native to Telegram.” xStocks stated.

These developments represent positive signals for investors anticipating a TON recovery. However, identifying TON’s price bottom remains difficult. Conflicting macroeconomic signals continue to pressure the broader altcoin market.

The post Is Toncoin Undervalued? December Data Signals Potential Rebound appeared first on BeInCrypto.

  •  

3 Altcoin yang Menghadapi Risiko Likuidasi pada Minggu Ketiga Desember

Berdasarkan Crypto Fear & Greed Index, sentimen pasar kripto pada minggu ketiga Desember masih didominasi oleh ketakutan, dengan skor fear ekstrem. Sentimen negatif ini telah membuat posisi short mendominasi perdagangan.

Meski begitu, beberapa altcoin punya katalis khusus yang bisa memicu likuidasi untuk posisi short. Altcoin apa saja yang dimaksud, dan risiko spesifik apa yang mereka hadapi?

1. Solana (SOL)

Liquidation heatmap 7 hari untuk SOL menunjukkan volume potensi likuidasi posisi short dua kali lebih besar daripada posisi long.

Khususnya, jika SOL naik ke US$147 minggu ini, para trader yang membuka posisi short bisa menanggung kerugian hingga US$1 miliar. Sebaliknya, jika SOL turun di bawah US$120, para trader long bisa menghadapi likuidasi sekitar US$500 juta.

SOL Exchange Liquidation Map. Source: Coinglass
Peta Likuidasi Exchange SOL | Sumber: Coinglass

Ada beberapa faktor yang menunjukkan para trader sebaiknya berhati-hati jika ingin menahan posisi short minggu ini.

Pertama, ETF SOL mencatat arus masuk positif selama tujuh hari berturut-turut pekan lalu. Terutama, Bitwise SOL ETF sukses mencatat arus masuk positif selama 33 hari berturut-turut sejak diluncurkan. Saat ini, ETF tersebut memegang lebih dari US$600 juta SOL. Tren ini menunjukkan permintaan institusi yang masih kuat.

Kedua, SOL telah membentuk support kuat di area US$130 dalam empat minggu terakhir. Selain itu, kabar positif tentang perluasan kasus penggunaan DeFi XRP di Solana melalui Hex Trust juga memperbaiki sentimen pasar.

Dengan latar belakang ini, SOL punya pondasi yang kuat untuk pulih minggu ini dan bisa memicu likuidasi posisi short.

2. Cardano (ADA)

Seperti SOL, sentimen pasar secara umum yang negatif mendorong para trader derivatif ADA jangka pendek untuk menambah modal dan leverage pada posisi short.

Tindakan ini secara signifikan meningkatkan total volume likuidasi short. Jika ADA naik ke US$0,45 minggu ini, posisi short bisa rugi hingga US$50 juta. Sebaliknya, jika ADA turun ke US$0,35, posisi long bisa menghadapi likuidasi sekitar US$19,5 juta.

ADA Exchange Liquidation Map. Source: Coinglass
Peta Likuidasi Exchange ADA | Sumber: Coinglass

Salah satu faktor penting yang harus dipertimbangkan oleh trader short ADA untuk mengurangi risiko adalah sentimen positif seputar proyek Midnight.

Midnight Network merupakan blockchain baru yang dikembangkan oleh Input Output Global (IOG), perusahaan di balik Cardano yang didirikan Charles Hoskinson.

Midnight Network fokus pada privasi melalui teknologi zero-knowledge proof, khususnya ZK-SNARKs. Token NIGHT naik lebih dari 150% dalam tujuh hari terakhir. Selain itu, proyek ini juga berhasil menang BeInCrypto “Breakthrough of the Year”.

Midnight has been voted @beincrypto's Breakthrough of the Year & this win belongs entirely to the community. 🏆🕛

Thank you to everyone who shared, voted, & continues to support privacy as a fundamental right & what Midnight is building.

It’s been a monumental week, but this is… pic.twitter.com/eiLGv4yqxV

— Midnight (@MidnightNtwrk) December 13, 2025

Peningkatan permintaan untuk NIGHT ikut mendorong permintaan terhadap ADA. Berdasarkan platform trading Taptool, volume trading NIGHT di DEX mencapai lebih dari 85 juta ADA dalam lima hari terakhir. Selain itu, para holder ADA dapat memperoleh NIGHT dengan staking ADA mereka.

3. PIPPIN

PIPPIN adalah meme coin yang mencuri perhatian di akhir tahun. Kapitalisasi pasarnya naik dari di bawah US$60 juta menjadi lebih dari US$350 juta hanya dalam tiga minggu.

Liquidation heatmap menunjukkan potensi likuidasi posisi long secara kumulatif masih lebih tinggi dibandingkan short. Data ini menandakan banyak trader jangka pendek masih memperkirakan harga akan terus naik.

PIPPIN Exchange Liquidation Map. Source: Coinglass
Peta Likuidasi Exchange PIPPIN | Sumber: Coinglass

namun, harapan tersebut membawa risiko besar. Analisis terbaru dari akun pelacak data on-chain Evening Trader Group mengungkapkan bahwa saat ini 93 wallet memegang 73% dari total suplai.

$PIPPIN | Case Study: Supply Control & The Hidden Architecture Behind the Rally

93 wallets now hold 73% of the supply, organized into three well-defined clusters based on accumulation origin.$PIPPIN keeps climbing with zero signs of exhaustion.
The on-chain picture shows why:… pic.twitter.com/MVvPCWq6rh

— Evening Trader Group (@Eveningtraders) December 12, 2025

Wallet-wallet ini terbagi menjadi tiga klaster akumulasi utama. Setiap klaster menunjukkan asal-usul dan pola perilaku yang berbeda. Menurut Evening Trader Group, akumulasi ini bisa menjadi pendorong utama lonjakan harga. Di sisi lain, tekanan jual bisa saja muncul kapan saja.

Selain itu, akun yang terkait dengan proyek (ThePippinCo) tidak pernah memberikan update sejak bulan Juni. Keheningan ini menimbulkan kekhawatiran akan komitmen tim terhadap proyek tersebut.

Jika PIPPIN turun di bawah US$0,30 minggu ini, lebih dari US$9.000.000 posisi long bisa terlikuidasi. Angka ini bahkan bisa lebih besar jika PIPPIN mengalami dump tajam, seperti nasib token meme lain yang pernah dimanipulasi.

  •  

3 Altcoins Facing Liquidation Risks in the Third Week of December

According to the Crypto Fear & Greed Index, the crypto market sentiment in the third week of December remains dominated by fear, with a score of extreme fear. This negative sentiment has caused short positions to gain the upper hand.

However, several altcoins have their own catalysts that could trigger liquidations of these short positions. Which altcoins are they, and what specific risks do they face?

1. Solana (SOL)

The 7-day liquidation heatmap for SOL shows that the potential liquidation volume of short positions is twice that of long positions.

Specifically, if SOL rises to $147 this week, traders holding short positions could suffer losses of up to $1 billion. In contrast, if SOL falls below $120, long traders could face liquidations worth around $500 million.

SOL Exchange Liquidation Map. Source: Coinglass

Several factors suggest that traders should be cautious when holding short positions this week.

First, SOL ETFs recorded seven consecutive days of positive inflows last week. Notably, the Bitwise SOL ETF has maintained positive inflows for 33 straight days since launch. It currently holds more than $600 million worth of SOL. This trend indicates sustained institutional demand.

Second, SOL has established strong support around the $130 level over the past four weeks. In addition, positive news about XRP expanding its DeFi use cases on Solana through Hex Trust has improved market sentiment.

As a result, SOL has solid grounds for a recovery this week, which could trigger short liquidations.

2. Cardano (ADA)

Similar to SOL, overall negative market sentiment has encouraged short-term ADA derivatives traders to increase capital allocation and leverage on short positions.

This behavior has significantly increased the total short liquidation volume. If ADA rises to $0.45 this week, short positions could incur losses of up to $50 million. Conversely, if ADA drops to $0.35, long positions could face liquidations of around $19.5 million.

ADA Exchange Liquidation Map. Source: Coinglass

One key factor that ADA short traders should consider to reduce risk is the positive sentiment surrounding the Midnight project.

Midnight Network is a new blockchain developed by Input Output Global (IOG), the company behind Cardano, founded by Charles Hoskinson.

Midnight Network focuses on privacy through zero-knowledge proof technology, specifically ZK-SNARKs. The NIGHT token has surged more than 150% over the past seven days. The project also won BeInCrypto’s “Breakthrough of the Year” award.

Midnight has been voted @beincrypto's Breakthrough of the Year & this win belongs entirely to the community. 🏆🕛

Thank you to everyone who shared, voted, & continues to support privacy as a fundamental right & what Midnight is building.

It’s been a monumental week, but this is… pic.twitter.com/eiLGv4yqxV

— Midnight (@MidnightNtwrk) December 13, 2025

The growing demand for NIGHT is driving demand for ADA. According to the Taptool trading platform, NIGHT recorded DEX trading volume exceeding 85 million ADA over the past five days. Additionally, ADA holders can earn NIGHT by staking their ADA.

3. PIPPIN

PIPPIN is a meme coin that gained significant attention towards the end of the year. Its market capitalization surged from below $60 million to over $350 million in just three weeks.

The liquidation heatmap indicates that cumulative potential long liquidations remain higher than those of short liquidations. This data suggests that many short-term traders still expect prices to continue rising.

PIPPIN Exchange Liquidation Map. Source: Coinglass

However, this expectation carries significant risk. A recent analysis by the on-chain data tracking account Evening Trader Group revealed that 93 wallets currently hold 73% of the total supply.

$PIPPIN | Case Study: Supply Control & The Hidden Architecture Behind the Rally

93 wallets now hold 73% of the supply, organized into three well-defined clusters based on accumulation origin.$PIPPIN keeps climbing with zero signs of exhaustion.
The on-chain picture shows why:… pic.twitter.com/MVvPCWq6rh

— Evening Trader Group (@Eveningtraders) December 12, 2025

These wallets are divided into three main accumulation clusters. Each cluster shows distinct origins and behavioral patterns. According to Evening Trader Group, this accumulation may be the primary driver behind the price surge. On the other hand, selling pressure could emerge at any time.

In addition, the project-linked account (ThePippinCo) has not posted any updates since June. This silence has raised concerns about the team’s commitment to the project.

If PIPPIN falls below $0.30 this week, more than $9 million in long positions could be liquidated. This figure could be even higher if PIPPIN experiences a sharp dump, similar to the fate of other manipulated meme tokens.

The post 3 Altcoins Facing Liquidation Risks in the Third Week of December appeared first on BeInCrypto.

  •  

Litecoin Diabaikan Retail, Sementara Institusi Diam-Diam Akumulasi 3,7 Juta LTC

Litecoin (LTC) belum berhasil keluar dari bayang-bayang tren turun panjangnya sejak 2021. Kinerja harga yang lemah membuat banyak investor ritel melupakan altcoin “pendahulu” ini.

Namun, laporan terbaru menunjukkan munculnya sinyal positif yang tumbuh secara diam-diam. Sinyal ini menjadi dasar para analis untuk memperkirakan bahwa harga mungkin akan segera breakout di atas US$100.

Institusi kumpulkan 3,7 juta LTC meski harga turun

Tahun ini, ketika perusahaan dan institusi menambah cadangan aset digital mereka serta meluncurkan crypto ETF, Litecoin juga ikut dalam tren ini.

Data dari Litecoin Register menunjukkan bahwa hingga akhir 2025, Treasury dan ETF memegang hampir 3,7 juta LTC. Nilai totalnya telah melebihi US$296 juta.

Total Treasury & ETF Holdings (LTC). Source: Litecoin Register
Total Treasury & ETF Holdings (LTC) | Sumber: Litecoin Register

“Saat ini lebih dari 3,7 juta Litecoin dipegang oleh 10 perusahaan publik dan dana investasi. Ada kenaikan satu juta LTC sejak Agustus 2025,” komentar Litecoin Foundation.

Grafik di atas memperlihatkan akumulasi yang konsisten selama satu tahun terakhir. Tren ini terus berlanjut meski LTC belum mencetak harga tertinggi baru di tahun 2025.

Holder utama yang tercatat di antaranya adalah Grayscale, Lite Strategy, dan Luxxfolio Holdings. Luxxfolio Holdings berniat mengumpulkan 1 juta LTC hingga 2026.

Selain itu, laporan “Silver Standard” dari LitVM menyoroti Litecoin sebagai blockchain dengan catatan uptime tertinggi di antara jaringan lama. Blockchain ini telah mempertahankan 100% uptime selama 12 tahun terakhir.

Blockchain Uptime Since Inception. Source: LitVM
Uptime Blockchain Sejak Awal | Sumber: LitVM

Uptime mengukur lamanya sebuah jaringan beroperasi secara berkesinambungan tanpa gangguan. Blockchain dengan uptime tinggi menunjukkan stabilitas, keamanan, dan keandalan sistem dalam memproses transaksi tanpa kegagalan teknis.

“Institusi menginginkan uang yang kuat. Mereka membutuhkan reliabilitas LTC selama 12 tahun terakhir,” ujar investor Creed.

Data fundamental memang tidak selalu memberikan dampak jangka pendek secara langsung. Tapi, sentimen jangka pendek dari pasar derivatif nampaknya sangat positif.

Binance top traders are rapidly increasing their $LTC long positions. pic.twitter.com/8iO72QaDfj

— CW (@CW8900) December 12, 2025

Trader papan atas di Binance dengan cepat meningkatkan posisi long LTC pada minggu kedua Desember. Perilaku mereka mengindikasikan ekspektasi bullish yang cukup kuat.

Hal-hal ini dapat menjelaskan mengapa beberapa investor lama masih percaya pada LTC. Seorang investor aset kripto yang aktif sejak 2015, Lucky, meyakini bahwa LTC akan segera pulih.

“Saya tidak melihat $LTC akan bertahan di bawah US$100 lebih lama lagi,” prediksi Lucky.

Litecoin price recovery scenario. Source: Lucky
Skenario Pemulihan Harga Litecoin | Sumber: Lucky

Saat ini, situasi LTC mirip dengan beberapa altcoin lain yang punya fundamental kuat namun pergerakan harga lambat, seperti XRP, XLM, LINK, dan INJ.

Pakar juga berpendapat bahwa hanya altcoin yang didukung oleh likuiditas dari DAT dan ETF yang bisa bertahan serta tumbuh secara berkelanjutan di fase pasar terbaru.

  •  

Whale Borong Ethereum — tapi Leverage Tertinggi Catatkan Risiko Besar untuk Posisi Long Mereka

Setelah The Fed mengumumkan pemangkasan suku bunga, dompet whale besar mulai mengucurkan modal ke posisi long Ethereum (ETH). Langkah ini menunjukkan rasa percaya diri tinggi pada potensi kenaikan ETH, sekaligus meningkatkan risiko secara keseluruhan.

Ada beberapa faktor yang menunjukkan kalau posisi long mereka bisa saja terlikuidasi dalam waktu dekat jika tidak ada manajemen risiko yang efektif.

Seberapa Percaya Diri Para Whale dengan Posisi Long Ethereum Mereka?

Perilaku whale memberikan gambaran jelas soal sentimen saat ini.

Menurut akun pemantau on-chain Lookonchain melaporkan bahwa seorang whale terkenal yang dianggap sebagai Bitcoin OG baru saja menambah posisi long di Hyperliquid menjadi 120.094 ETH. Harga likuidasinya hanya berada di US$2.234.

Posisi ini saat ini menunjukkan kerugian PnL 24 jam lebih dari US$13,5 juta.

A Whale's Long ETH Position on Hyperliquid. Source: HyperDash
Posisi Long ETH Whale di Hyperliquid | Sumber: HyperDash

Begitu juga, seorang trader ternama, Machi Big Brother, masih memegang posisi long senilai 6.000 ETH dengan harga likuidasi di US$3.152.

Selain itu, platform data on-chain Arkham mengabarkan bahwa whale trader asal Cina yang pernah memprediksi crash pasar 10/10 kini menahan posisi long ETH senilai US$300 juta di Hyperliquid.

Aktivitas whale di posisi long ETH mencerminkan ekspektasi mereka terhadap kenaikan harga dalam waktu dekat. Tapi, di balik optimisme tersebut, terdapat risiko besar akibat tingkat leverage Ethereum yang agresif.

Leverage ETH Mencapai Level Berbahaya

Data dari CryptoQuant memperlihatkan kalau rasio leverage ETH di Binance sudah mencapai 0,579—tertinggi sepanjang sejarah. Level ini menunjukkan penggunaan leverage yang sangat agresif, sehingga pergerakan harga kecil saja bisa memicu efek domino.

Ethereum Estimated Leverage Ratio - Binance. Source: CryptoQuant.
Perkiraan Rasio Leverage Ethereum – Binance | Sumber: CryptoQuant.

“Rasio leverage yang sangat tinggi artinya jumlah kontrak terbuka yang dibiayai leverage naik lebih cepat daripada volume aset nyata di platform. Bila ini terjadi, pasar menjadi lebih rentan terhadap pergerakan harga mendadak, sebab para trader sangat mudah terlikuidasi—baik saat tren naik maupun tren turun,” papar analis Arab Chain .

Data historis memperlihatkan, puncak serupa biasanya terjadi saat tekanan harga tinggi dan sering jadi sinyal puncak pasar lokal.

Kelemahan Pasar Spot Menambah Risiko

Pada pasar spot, tanda-tanda pelemahan jelas terlihat. Pengamat pasar kripto Wu Blockchain mengabarkan bahwa volume transaksi spot di exchange utama turun hingga 28% pada November 2025 dibandingkan Oktober.

November Exchange Data Report: Spot trading volume of major exchanges in November 2025 fell 28% compared with October. The top three exchanges by change rate were Bitfinex +17%, Coinbase -8%, and KuCoin -17%. The bottom three were Bitget -62%, Gate -44%, and MEXC -34%.… pic.twitter.com/oXgFKyrv6b

— Wu Blockchain (@WuBlockchain) December 10, 2025

Laporan lain dari BeInCrypto juga menyorot bahwa arus masuk stablecoin ke exchange anjlok 50%, dari US$158 miliar di Agustus menjadi US$78 miliar pada hari ini.

Kombinasi dari pembelian spot yang lemah, leverage tinggi, dan cadangan stablecoin yang menurun bikin peluang ETH untuk pulih jadi semakin kecil. Kondisi ini bisa membuat posisi long whale berada pada risiko likuidasi yang signifikan.

  •  

Zcash Jadi Pusat Hype — tapi Monero (XMR) Diam-diam Mendominasi di Hal yang Penting

Privacy coin telah menjadi salah satu narasi utama yang membentuk tren investasi aset kripto tahun ini. Dua altcoin teratas di sektor ini berdasarkan volume dan kapitalisasi pasar adalah Zcash (ZEC) dan Monero (XMR).

Perhatian investor sangat tertuju pada ZEC. Sementara itu, XMR terus menunjukkan pertumbuhan yang solid dan konsisten.

XMR ungguli ZEC dalam banyak hal meski kurang mendapat sorotan

Dari sisi volume perdagangan spot harian di bulan Desember, ZEC tampil sangat baik.

Berdasarkan data dari CoinGecko, ZEC mencatat volume perdagangan harian hampir US$1 miliar. Jumlah ini melampaui XMR dan DASH, berkat likuiditas yang tinggi di exchange utama seperti Binance.

Namun, ZEC tertinggal jauh soal transaksi on-chain harian. Data dari BitInfoCharts memperlihatkan XMR rata-rata mencatat sekitar 26.000 transaksi per hari. Angka ini lebih dari tiga kali lipat rata-rata ZEC yang hanya sekitar 8.000 transaksi per hari.

Zcash, Monero Daily Transactions. Source: Bitinfocharts
Transaksi Harian Zcash, Monero | Sumber: BitInfoCharts

Grafik tersebut juga menunjukkan aktivitas on-chain XMR tetap stabil dalam jangka panjang. Hal ini mencerminkan perilaku pengguna yang konsisten. Sebaliknya, lonjakan dan penurunan tajam ZEC belakangan ini lebih menyerupai euforia sesaat.

Aktivitas on-chain membawa makna yang lebih besar dalam jangka panjang dibanding volume spot. Aktivitas ini menunjukkan pola pemakaian nyata dan penerimaan pengguna terhadap XMR untuk transfer anonim, bukan sekadar sentimen trading jangka pendek.

Selain itu, harga ZEC lebih sering berfluktuasi karena volatilitas yang meningkat akibat aktivitas trading spekulatif. Pergerakan harga XMR cenderung lebih stabil.

Data TradingView mengungkap bahwa ZEC telah turun lebih dari 40% selama sebulan terakhir. Kini banyak analis menyarankan kemungkinan pola bubble. Di sisi lain, harga XMR turun sekitar 12%.

Comparing The Price Performance Between ZEC and XMR. Source: TradingView
Perbandingan Performa Harga Antara ZEC dan XMR | Sumber: TradingView

Dari sudut pandang ini, ZEC cocok untuk trader yang mengejar narasi privacy coin dan ingin meraih profit cepat saat FOMO ekstrem terjadi. Tapi, risiko penurunan harga lebih dalam dan waktu pemulihan yang lebih lama juga harus siap mereka hadapi.

Selain itu, laporan terbaru dari MEXC Research semakin mengokohkan posisi XMR. Dalam periode waktu lebih panjang, XMR terbukti memiliki volume perdagangan dan aktivitas pengguna yang lebih baik dibandingkan ZEC dan DASH.

“Meskipun ZEC dan DASH mencatat volume perdagangan tertinggi, Monero tetap menjadi aset utama di kalangan trader privacy coin, menguasai 93% total volume perdagangan pada Q3–Q4 dan 72% pengguna di segmen ini,” papar MEXC Research melalui laporannya.

Laporan itu juga menyebutkan semakin besarnya minat pada aset privacy mencerminkan kebutuhan anonimitas yang bertambah karena regulator memperketat kontrol modal.

Oleh sebab itu, baik memegang ZEC atau XMR, investor masih bisa mendapat manfaat di tahun depan. Para ahli memperkirakan privacy coin akan tetap menjadi narasi dominan pasar pada 2026.

  •  

Whales Are Going All-In on Ethereum — But Record Leverage Puts Their Longs at Risk

After the FED announced interest rate cuts, major whale wallets began pouring capital into long positions on Ethereum (ETH). These moves signal strong confidence in ETH’s upside. They also increase overall risk.

Several factors suggest that their long positions may face liquidation soon without effective risk management.

How Confident Are Whales in Their Ethereum Long Positions?

Whale behavior offers a clear view of current sentiment.

On-chain tracking account Lookonchain reported that a well-known whale, considered a Bitcoin OG, recently expanded a long position on Hyperliquid to 120,094 ETH. The liquidation price sits at only $2,234.

This position is currently showing a 24-hour PnL loss of more than $13.5 million.

A Whale's Long ETH Position on Hyperliquid. Source: HyperDash
A Whale’s Long ETH Position on Hyperliquid. Source: HyperDash

Similarly, another well-known trader, Machi Big Brother, is maintaining a long position worth 6,000 ETH with a liquidation price of $3,152.

Additionally, on-chain data platform Arkham reported that the Chinese whale trader who called the 10/10 market crash is now holding a $300 million ETH long position on Hyperliquid.

Whale activity in ETH long positions reflects their expectation of a near-term price increase. However, behind this optimism lies a significant risk stemming from Ethereum’s leverage levels.

ETH Leverage Is Reaching Dangerous Highs

CryptoQuant data shows that ETH’s estimated leverage ratio on Binance has reached 0.579 — the highest in history. This level indicates extremely aggressive leverage usage. Even a small price swing could trigger a domino effect.

Ethereum Estimated Leverage Ratio - Binance. Source: CryptoQuant.
Ethereum Estimated Leverage Ratio – Binance. Source: CryptoQuant.

“Such a high leverage ratio means that the volume of open contracts financed by leverage is rising faster than the volume of actual assets on the platform. When this occurs, the market becomes more vulnerable to sudden price movements, as traders are more susceptible to liquidation—whether in an upward or downward trend,” analyst Arab Chain said.

Historical data indicate that similar peaks typically coincide with periods of intense price pressure and often signal local market tops.

Spot Market Weakness Adds More Risk

The spot market is also showing clear signs of weakening. Crypto market watcher Wu Blockchain reported that spot trading volume on major exchanges dropped 28% in November 2025 compared to October.

November Exchange Data Report: Spot trading volume of major exchanges in November 2025 fell 28% compared with October. The top three exchanges by change rate were Bitfinex +17%, Coinbase -8%, and KuCoin -17%. The bottom three were Bitget -62%, Gate -44%, and MEXC -34%.… pic.twitter.com/oXgFKyrv6b

— Wu Blockchain (@WuBlockchain) December 10, 2025

Another report from BeInCrypto highlighted that stablecoin inflows into exchanges have declined by 50%, falling from $158 billion in August to $ 78 billion as of today.

Combined, low spot buying power, high leverage, and shrinking stablecoin reserves reduce ETH’s ability to recover. These conditions could put whale long positions at significant risk of liquidation.

The post Whales Are Going All-In on Ethereum — But Record Leverage Puts Their Longs at Risk appeared first on BeInCrypto.

  •  

 Zcash Leads in Hype — But Monero (XMR) Is Quietly Dominating Where It Matters

Privacy coins have emerged as one of the dominant narratives shaping cryptocurrency investment trends this year. The two leading altcoins in this sector by volume and market capitalization are Zcash (ZEC) and Monero (XMR).

Investor attention has focused heavily on ZEC. Meanwhile, XMR continues to show strong and steady growth.

XMR Outperforms ZEC in Many Aspects Despite Lacking the Spotlight

In terms of daily spot trading volume in December, ZEC performed exceptionally well.

According to CoinGecko, ZEC maintains a daily trading volume of nearly $1 billion. This level surpasses XMR and DASH, thanks to strong liquidity on major exchanges like Binance.

However, ZEC falls far behind in daily on-chain transactions. Data from BitInfoCharts shows XMR reaching an average of about 26,000 transactions per day. This figure is more than triple ZEC’s average of roughly 8,000 transactions per day.

Zcash, Monero Daily Transactions. Source: Bitinfocharts
Zcash, Monero Daily Transactions. Source: BitInfoCharts

The chart also indicates that XMR’s on-chain activity remains consistent over the long term. This trend reflects stable user behavior. In contrast, ZEC’s recent surge and sharp decline appear more like temporary excitement.

On-chain activity carries longer-term significance than spot volume. It reflects real usage patterns and user acceptance of XMR for anonymous transfers rather than short-term trading sentiment.

Additionally, ZEC’s price fluctuates due to increased volatility resulting from speculative trading. XMR’s price movement remains more stable.

TradingView data shows that ZEC has fallen by more than 40% over the past month. Many analysts now suggest the possibility of a bubble pattern. Meanwhile, XMR declined by roughly 12%.

Comparing The Price Performance Between ZEC and XMR. Source: TradingView

From this perspective, ZEC suits traders who chase the privacy coin narrative and aim for quick profits during extreme FOMO cycles. The downside is deeper price drops and longer recovery periods.

Furthermore, the latest report from MEXC Research reinforces XMR’s position. Over longer timeframes, XMR demonstrates superior trading volume and user activity compared to ZEC and DASH.

“Despite ZEC and DASH posting record-high trading volumes, Monero remains an asset of choice among privacy coin traders, accounting for 93% of total trading volume in Q3–Q4 and 72% of users in this segment,” MEXC Research reported.

The report also notes that growing interest in privacy assets reflects users’ increasing need for anonymity as regulators strengthen capital controls.

Therefore, regardless of holding ZEC or XMR, investors can continue to benefit next year. Experts predict privacy coins will remain a dominant market narrative in 2026.

The post  Zcash Leads in Hype — But Monero (XMR) Is Quietly Dominating Where It Matters appeared first on BeInCrypto.

  •  

What Does the Russell 2000 Breakout Signal Mean for Bitcoin and Altcoins?

The Russell 2000 Index, which comprises approximately 2,000 small-cap companies, has long served as a barometer of investor appetite for growth and high-risk equities. Analysts quickly noticed its correlation with the crypto market.

When risk-on sentiment spreads into the crypto market, it can help push Bitcoin and altcoins higher. The details below illustrate how this dynamic unfolds.

Russell 2000 Flashes a Breakout Signal, Raising Hope for Crypto

If the S&P 500 represents large-cap blue-chip companies, the Russell 2000 focuses on small-cap stocks.

The index is not as famous as the S&P 500 or the Dow Jones. However, it remains important, especially for investors who seek higher risk. This risk appetite aligns closely with many crypto investors.

In December, the Russell 2000 recorded a major turning point when it broke above a long-term resistance level. This move often signals strong upside momentum.

The breakout is considered a clear risk-on signal. This suggests that capital is shifting back to riskier assets, which can serve as fuel for Bitcoin (BTC) and altcoins.

Bitcoin vs Russell 2000. Source: Bitcoin Vector

The Bitcoin Vector — an institutional Bitcoin report published by Swissblock — noted that in late 2020, the Russell 2000 broke through new highs and later turned that level into support. Bitcoin surged 380% after that.

“Last time this setup appeared, BTC delivered over 390% upside. This time the structure is different, but we’re starting from an environment that precedes liquidity expansion. And when liquidity turns, risk assets take the lead,” Bitcoin Vector stated.

Negentropic, co—founder of Glassnode, added that the Russell 2000 breakout signals a broad return of investors to risk assets.

Several analysts also believe this is a bullish sign for altcoins.

“Russell 2000 is the biggest indicator for Altseason, and it’s about to hit a new all-time high,” Ash Crypto said.

By comparing the altcoin market capitalization with that of the iShares Russell 2000 ETF — a fund that tracks US small-cap equities — analyst Cryptocium highlighted a correlation. Altcoin market cap (OTHERS) often surges when the iShares Russell 2000 ETF breaks above its previous all-time high.

Altcoin Market Cap vs iShares Russell 2000 ETF. Source: Cryptocium

This pattern has appeared twice: once in 2017 and again in 2021. It now suggests a potential altcoin boom in 2026.

But a Deeper Look Reveals Internal Weakness

A closer look inside the Russell 2000 rally shows a different picture.

Analyst Duality Research noted that, although the index rose in 2025, small-cap ETFs within the index still recorded net outflows of approximately $19.5 billion this year. This contrasts sharply with past rallies, which have typically been accompanied by strong ETF inflows.

The Russell 2000 is up more than 13% year-to-date and over 40% off its April lows, yet small-cap ETFs have still recorded roughly $20 billion in net outflows this year. pic.twitter.com/QEXQ6qIcsn

— Duality Research (@DualityResearch) December 8, 2025

This perspective weakens the bullish argument for a tight correlation between the Russell 2000 and the crypto market. If risk-on sentiment fails to last and the breakout turns into a false move, that negative shift may spread and extend the bearish mood in the crypto market.

The post What Does the Russell 2000 Breakout Signal Mean for Bitcoin and Altcoins? appeared first on BeInCrypto.

  •  

Why Stablecoin Market Caps Keep Rising but the Crypto Market Isn’t Exploding

Stablecoin issuers continue to mint new tokens such as USDT and USDC. This expansion is often compared to the spark that ignites major market rallies. However, data shows that the market caps of leading stablecoins have increased for months while the broader crypto market has not grown proportionally.

The following report outlines several reasons behind this mismatch, based on recent data and industry analyses.

3 Reasons Behind the Decoupling Between Stablecoin Growth and the Crypto Market

CoinGecko data shows that the market caps of USDT and USDC reached new highs in December, at $185 billion and $78 billion, respectively.

Both stablecoins have experienced steady growth since the start of the year. By December, Circle and Tether continued to issue aggressively. The latest report from on-chain tracker Lookonchain noted that Tether minted $1 billion and Circle added another $500 million.

Analysts often describe this capital as “dry powder” for the market. Yet the question remains: where has it actually gone?

More Stablecoins Flow Into Derivatives Exchanges Than Spot Exchanges

CryptoQuant data indicate that USDT (ERC-20) on derivatives exchanges has increased consistently since early 2025, rising from below $40 billion to nearly $60 billion.

Meanwhile, USDT (ERC-20) on spot exchanges has been trending downward. It currently sits near yearly lows.

Tether (ERC-20) Exchange Reserve. Source: CryptoQuant.

USDC on spot exchanges has also dropped sharply in recent months, falling from $6 billion to $3 billion.

This data reflects a shift in trader behavior. Many prefer short-term opportunities with leverage rather than long-term spot accumulation. This shift makes it harder for altcoin prices to gain upward momentum.

Leveraged trading also introduces higher risk. It delivers fast profits but can erase capital just as quickly. Multiple billion-dollar liquidation events in 2025 illustrate this ongoing trend.

Stablecoins Now Serve Many Purposes Beyond Crypto Investing

Another reason stems from the broader utility of stablecoins. The issuance by Tether and Circle does not solely reflect internal demand for cryptocurrencies. It also reflects demand from the global finance ecosystem.

A new IMF report highlights the widespread use of stablecoins such as USDT for cross-border remittances.

Stablecoins' Cross-border Flows. Source: IMF
Stablecoins’ Cross-border Flows. Source: IMF

The chart shows that cross-border flows involving USDT and USDC reached approximately $170 billion in 2025.

“Stablecoins could enable faster and cheaper payments, particularly across borders and for remittances, where traditional systems are often slow and costly,” the IMF noted.

As a result, even though supply increases, a substantial portion of capital is absorbed into real-world applications rather than speculation.

Investor Caution Slows Capital Rotation

A third factor is cautious investor sentiment.

A recent Matrixport report describes the current market conditions as lacking retail participation and exhibiting low trading volume. Sentiment indicators remain in “fear” and “extreme fear” territory.

“Simply put, without volume, enthusiasm cannot compound, and without enthusiasm, volume will not return, a classic crypto chicken-and-egg standoff,” Matrixport reported.

This sentiment pushes investors to hold stablecoins instead of deploying them into Bitcoin or altcoins.

Stablecoin Market Cap. Source: Coinglass

Historical data reinforces this view. A comparison of Bitcoin’s price and the market caps of USDT and USDC reveals that, in the first half of 2022, stablecoin supply continued to rise even after the market had entered a bear phase. In late 2022, stablecoin supply dropped sharply as many investors exited the market.

An increase in stablecoin market caps does not automatically translate into higher Bitcoin or altcoin prices. The impact depends heavily on investor sentiment, capital flows, and the broader use cases driving stablecoin demand.

The post Why Stablecoin Market Caps Keep Rising but the Crypto Market Isn’t Exploding appeared first on BeInCrypto.

  •  

Apa Arti Sinyal Breakout Russell 2000 untuk Bitcoin dan Altcoin?

Indeks Russell 2000, yang terdiri dari sekitar 2.000 perusahaan dengan kapitalisasi kecil, sudah lama menjadi barometer selera investor terhadap pertumbuhan dan ekuitas berisiko tinggi. Analis cepat menyadari korelasinya dengan pasar crypto.

Ketika sentimen risk-on menyebar ke pasar crypto, ini dapat membantu mendorong Bitcoin dan altcoin lebih tinggi. Detil di bawah ini menggambarkan bagaimana dinamika ini terjadi.

Russell 2000 Memberikan Sinyal Breakout, Nampaknya Memberikan Harapan untuk Aset Kripto

Jika S&P 500 mewakili perusahaan blue-chip dengan kapitalisasi besar, Russell 2000 berfokus pada saham-saham dengan kapitalisasi kecil.

Indeks ini tidak sepopuler S&P 500 atau Dow Jones. Namun, tetap penting, terutama bagi investor yang mencari risiko lebih tinggi. Selera risiko ini sangat selaras dengan banyak investor crypto.

Pada bulan Desember, Russell 2000 mencatat titik balik penting ketika berhasil menembus level resistance jangka panjang. Gerakan ini sering menandakan momentum kenaikan yang kuat.

Breakout ini dianggap sebagai sinyal risk-on yang jelas. Hal ini menunjukkan bahwa modal berpindah kembali ke aset yang lebih berisiko, yang dapat menjadi bahan bakar untuk Bitcoin (BTC) dan altcoin.

Bitcoin vs Russell 2000. Source: Bitcoin Vector
Bitcoin vs Russell 2000 | Sumber: Bitcoin Vector

Laporan Bitcoin Vector — laporan Bitcoin institusional yang diterbitkan oleh Swissblock — menjelaskan bahwa pada akhir tahun 2020, Russell 2000 menembus level tertinggi baru dan kemudian mengubah level tersebut menjadi support. Bitcoin melonjak 380% setelah itu.

“Terakhir kali setup ini muncul, BTC memberikan kenaikan lebih dari 390%. Kali ini strukturnya berbeda, tetapi kita memulai dari lingkungan yang mendahului ekspansi likuiditas. Dan ketika likuiditas berbalik, aset berisiko memimpin,” terang Bitcoin Vector menyebutkan .

Negentropic, co-founder Glassnode, menambahkan bahwa breakout pada Russell 2000 menandakan kembalinya investor ke aset berisiko secara luas.

Beberapa analis juga percaya ini adalah sinyal bullish untuk altcoin.

“Russell 2000 adalah indikator terbesar untuk altcoin season, dan ini akan mencapai level tertinggi sepanjang masa baru,” ujar Ash Crypto mengatakan.

Dengan membandingkan kapitalisasi pasar altcoin dengan iShares Russell 2000 ETF — sebuah dana yang melacak ekuitas kapitalisasi kecil AS — analis Cryptocium menyoroti korelasi. Kapitalisasi pasar altcoin (OTHERS) sering melonjak ketika iShares Russell 2000 ETF menembus level tertinggi sepanjang masa sebelumnya.

Altcoin Market Cap vs iShares Russell 2000 ETF. Source: Cryptocium
Kapitalisasi Pasar Altcoin vs iShares Russell 2000 ETF | Sumber: Cryptocium

Pola ini telah muncul dua kali: sekali pada tahun 2017 dan lagi pada tahun 2021. Sekarang menunjukkan potensi booming altcoin pada tahun 2026.

Namun Pandangan Lebih Dalam Menunjukkan Kelemahan Internal

Pandangan lebih dekat pada reli Russell 2000 menunjukkan gambaran berbeda.

Analis Duality Research mencatat bahwa, meskipun indeks naik pada tahun 2025, ETF dengan kapitalisasi kecil dalam indeks tersebut masih mencatat arus keluar bersih sekitar US$19,5 miliar tahun ini. Ini sangat kontras dengan reli yang lalu, yang biasanya disertai dengan arus masuk ETF yang kuat.

The Russell 2000 is up more than 13% year-to-date and over 40% off its April lows, yet small-cap ETFs have still recorded roughly $20 billion in net outflows this year. pic.twitter.com/QEXQ6qIcsn

— Duality Research (@DualityResearch) December 8, 2025

Pandangan ini melemahkan argumen bullish untuk korelasi erat antara Russell 2000 dan pasar crypto. Jika sentimen risk-on tidak bertahan lama dan breakout berubah menjadi gerakan palsu, perubahan negatif tersebut dapat menyebar dan memperpanjang mood bearish di pasar crypto.

  •  

Mengapa Kapitalisasi Pasar Stablecoin Terus Naik Tapi Pasar Aset Kripto Tidak Meledak

Penerbit stablecoin terus mencetak token baru seperti USDT dan USDC. Ekspansi ini sering dibandingkan dengan percikan yang memicu reli pasar besar. Namun, data menunjukkan bahwa kapitalisasi pasar stablecoin utama telah meningkat selama beberapa bulan, sementara pasar kripto secara keseluruhan tidak berkembang secara proporsional.

Laporan berikut menguraikan beberapa alasan di balik ketidakcocokan ini, berdasarkan data terbaru dan analisis industri.

3 Alasan di Balik Pemisahan Pertumbuhan Stablecoin dan Pasar Aset Kripto

Data CoinGecko menunjukkan bahwa kapitalisasi pasar USDT dan USDC mencapai titik tertinggi baru pada bulan Desember, yaitu US$185 miliar dan US$78 miliar, masing-masing.

Kedua stablecoin ini mengalami pertumbuhan stabil sejak awal tahun. Pada bulan Desember, Circle dan Tether terus menerbitkan secara agresif. Laporan terbaru dari pelacak on-chain Lookonchain mencatat bahwa Tether mencetak US$1 miliar dan Circle menambahkan lagi US$500 juta.

Analis sering menggambarkan modal ini sebagai “bubuk kering” untuk pasar. Namun, pertanyaannya tetap: ke mana sebenarnya modal ini pergi?

Lebih Banyak Stablecoin Mengalir ke Derivatives Exchange Daripada Spot Exchange

Data CryptoQuant menunjukkan bahwa USDT (ERC-20) di bursa derivatif telah meningkat secara konsisten sejak awal 2025, naik dari di bawah US$40 miliar menjadi hampir US$60 miliar.

Sementara itu, USDT (ERC-20) di bursa spot sedang menurun. Saat ini berada di dekat titik terendah tahunan.

Tether (ERC-20) Exchange Reserve. Source: CryptoQuant.
Cadangan Exchange Tether (ERC-20) | Sumber: CryptoQuant.

USDC di bursa spot juga turun tajam dalam beberapa bulan terakhir, dari US$6 miliar menjadi US$3 miliar.

Data ini mencerminkan perubahan perilaku trader. Banyak yang lebih memilih peluang jangka pendek dengan leverage daripada akumulasi spot jangka panjang. Perubahan ini membuat harga altcoin lebih sulit untuk mendapatkan momentum naik.

Perdagangan dengan leverage juga memperkenalkan risiko yang lebih tinggi. Ini menawarkan keuntungan cepat namun juga bisa menghapus modal dengan cepat. Beberapa peristiwa likuidasi bernilai miliaran Dollar di 2025 menggambarkan tren yang sedang berlangsung ini.

Stablecoin Kini Berfungsi untuk Banyak Tujuan Selain Investasi Aset Kripto

Alasan lain berasal dari kegunaan stablecoin yang lebih luas. Penerbitan oleh Tether dan Circle tidak hanya mencerminkan permintaan internal untuk aset kripto. Ini juga mencerminkan permintaan dari ekosistem keuangan global.

Laporan baru IMF menyoroti penggunaan luas stablecoin seperti USDT untuk pengiriman uang lintas batas.

Stablecoins' Cross-border Flows. Source: IMF
Arus Lintas Batas Stablecoin | Sumber: IMF

Grafik menunjukkan bahwa arus lintas batas yang melibatkan USDT dan USDC mencapai sekitar US$170 miliar pada 2025.

“Stablecoin dapat memungkinkan pembayaran yang lebih cepat dan lebih murah, terutama lintas batas dan untuk pengiriman uang, di mana sistem tradisional seringkali lambat dan mahal,” ujar IMF menjelaskan.

Akibatnya, meskipun pasokan meningkat, sebagian besar modal diserap ke dalam aplikasi dunia nyata daripada spekulasi.

Kehati-hatian Investor Memperlambat Rotasi Modal

Faktor ketiga adalah sentimen investor yang berhati-hati.

Laporan Matrixport terbaru menggambarkan kondisi pasar saat ini yang kurang partisipasi ritel dan volume perdagangan rendah. Indikator sentimen tetap berada di wilayah “takut” dan “sangat takut”.

“Secara sederhana, tanpa volume, antusiasme tidak bisa bertambah, dan tanpa antusiasme, volume tidak akan kembali, sebuah kebuntuan klasik dalam kripto,” papar Matrixport melaporkan.

Sentimen ini mendorong investor untuk menahan stablecoin daripada menggunakannya untuk Bitcoin atau altcoin.

Stablecoin Market Cap. Source: Coinglass
Kapitalisasi Pasar Stablecoin | Sumber: Coinglass

Data historis memperkuat pandangan ini. Perbandingan antara harga Bitcoin dan kapitalisasi pasar USDT serta USDC menunjukkan bahwa, pada paruh pertama tahun 2022, pasokan stablecoin terus meningkat meskipun pasar telah memasuki fase bear. Pada akhir 2022, pasokan stablecoin turun tajam ketika banyak investor keluar dari pasar.

Peningkatan kapitalisasi pasar stablecoin tidak secara otomatis berarti harga Bitcoin atau altcoin akan naik. Dampaknya sangat bergantung pada sentimen investor, arus modal, dan kasus penggunaan lebih luas yang mendorong permintaan stablecoin.

  •  

Apa Tantangan yang Menghalangi Pemulihan Awal Desember XRP?

XRP telah naik 10% sejak awal Desember. Kenaikan ini sejalan dengan pemulihan pasar yang lebih luas. Banyak holder XRP berharap harga akan naik lebih jauh, namun mereka juga sebaiknya mewaspadai beberapa faktor yang mengkhawatirkan.

Faktor-faktor ini bisa membatasi kemampuan XRP untuk pulih bulan ini. Berikut adalah analisis yang menjelaskannya.

Faktor yang Bisa Membuat Tekanan Jual Baru pada XRP di Desember

Data CryptoQuant menunjukkan lonjakan tajam dalam XRP Ledger Velocity. Ini telah mencapai level tertinggi tahun ini.

Metode ini mengukur frekuensi perpindahan aset di seluruh jaringan. Peningkatan yang kuat menunjukkan bahwa XRP tidak disimpan dalam cold wallet atau disimpan untuk kepentingan jangka panjang, melainkan diperdagangkan dengan cepat di antara peserta pasar.

XRP Ledger Velocity. Source: CryptoQuant.
XRP Ledger Velocity. Sumber: CryptoQuant.

CryptoOnchain, seorang analis di CryptoQuant, menjelaskan bahwa lonjakan ini sering mengindikasikan likuiditas tinggi dan partisipasi kuat dari trader. Ini mungkin bahkan melibatkan transaksi besar dari pelaku pasar “whale”.

Indikator ini sendiri bersifat netral, namun lonjakan tiba-tiba sering kali menyebabkan fluktuasi harga yang signifikan. Akibatnya, setiap katalis negatif pada saat ini dapat menekan XRP kembali turun dan menghapus pemulihan awal bulan ini.

Sinyal negatif sudah mulai muncul. Yang pertama adalah lonjakan posisi short. Peningkatan ini telah menciptakan tekanan jual yang berat di segmen derivatif.

XRP Funding Rate. Source: CryptoQuant.
XRP Funding Rate. Sumber: CryptoQuant.

Funding rate tetap kebanyakan negatif, menunjukkan bahwa posisi short mendominasi. Ini mencerminkan sentimen yang semakin bearish di antara trader. Data historis juga menunjukkan bahwa funding rate negatif yang mendalam pada bulan April bertepatan dengan XRP jatuh di bawah US$2.

“Saat lebih banyak trader masuk ke posisi short di pasar derivatif, kelanjutan tren menjadi lebih mungkin, karena tekanan short yang terus-menerus membuat minat untuk membuka posisi long rendah. Di bawah kondisi ini, kemungkinan harga retesting zona US$2,0–US$1,9 meningkat,” prediksi analis PelinayPA .

Secara keseluruhan, kenaikan awal Desember tidak cukup kuat untuk membalikkan tren penurunan yang lebih luas yang telah berlangsung sejak Juli. Pandangan PelinayPA tetap masuk akal di bawah kondisi saat ini.

Tekanan jual juga bisa datang dari investor Korea. CryptoQuant melaporkan bahwa saldo XRP di Upbit mencapai 6,18 miliar, dibandingkan dengan 2,6 miliar di Binance. Pengaruh trader Korea tidak bisa diabaikan.

XRP Exchange Reserve - Upbit. Source: CryptoQuant.
XRP Exchange Reserve – Upbit. Sumber: CryptoQuant.

Cadangan XRP di Upbit terus meningkat selama tiga bulan berturut-turut. Sekarang berada di level tertinggi tahun 2025. Tren ini dapat menciptakan potensi tekanan jual untuk XRP pada bulan Desember.

Jika investor Korea menjual, ditambah dengan sinyal bearish dari pasar derivatif dan peningkatan Velocity, harga XRP mungkin menghadapi penurunan lebih lanjut.

Namun, ETF XRP saat ini berfungsi sebagai penyeimbang terkuat terhadap potensi tekanan jual. Data menunjukkan bahwa ETF ini telah mempertahankan arus masuk bersih positif selama tiga minggu berturut-turut. Vanguard juga telah mengakhiri larangan kripto bertahun-tahun dan akan mengizinkan perdagangan ETF XRP pada Desember.

  •  
❌