Reading view

Why Christmas-Themed Tokens Could be Worst Crypto Narratives of 2025

The Christmas week is known for joy, celebration, and all things festive, and in recent history, an Xmas-themed crypto token. While these tokens are often expected to rally around the holiday, such moves occur far less frequently than anticipated, leaving many investors vulnerable to short-lived hype and potential losses.

In line with the same, BeInCrypto has analysed three such Christmas crypto tokens that the investors should stay away from in 2025.

SANTA HAT (SANTAHAT)

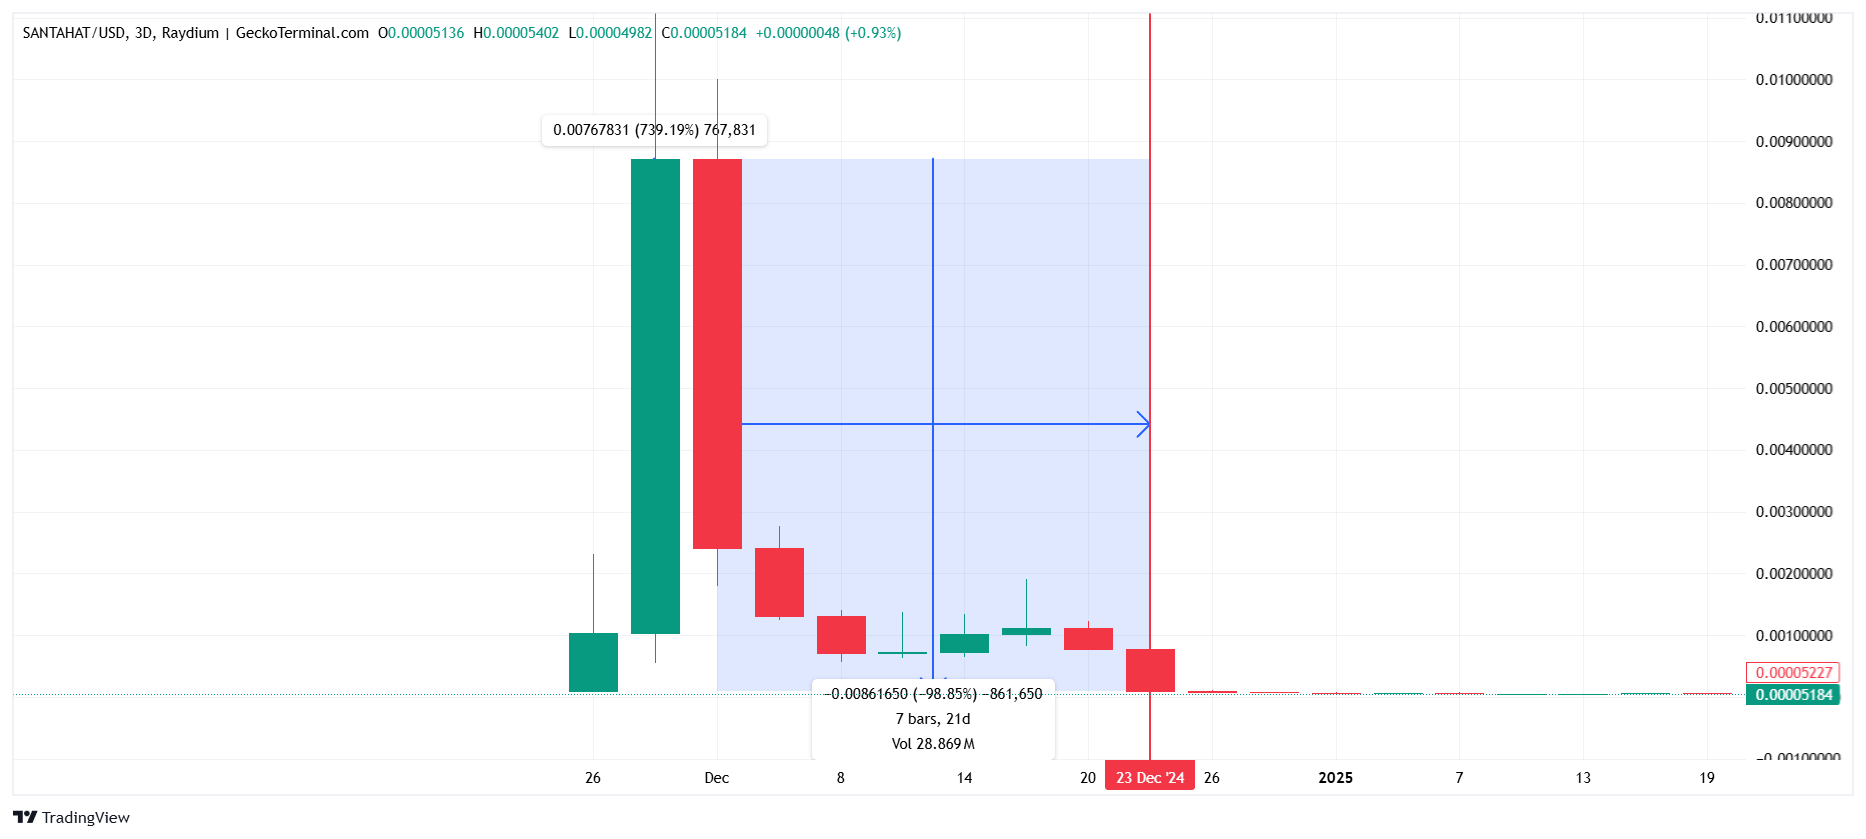
SANTA HAT previously demonstrated the risks tied to seasonal crypto tokens. After launch, the token surged 739% before collapsing 98.85% within three weeks, well before Christmas. The sharp reversal erased gains and highlighted how holiday-themed hype often fails to sustain long-term price appreciation.

Want more token insights like this? Sign up for Editor Harsh Notariya’s Daily Crypto Newsletter here.

SANTA HAT Price 2024
SANTA HAT Price 2024. Source: GeckoTerminal

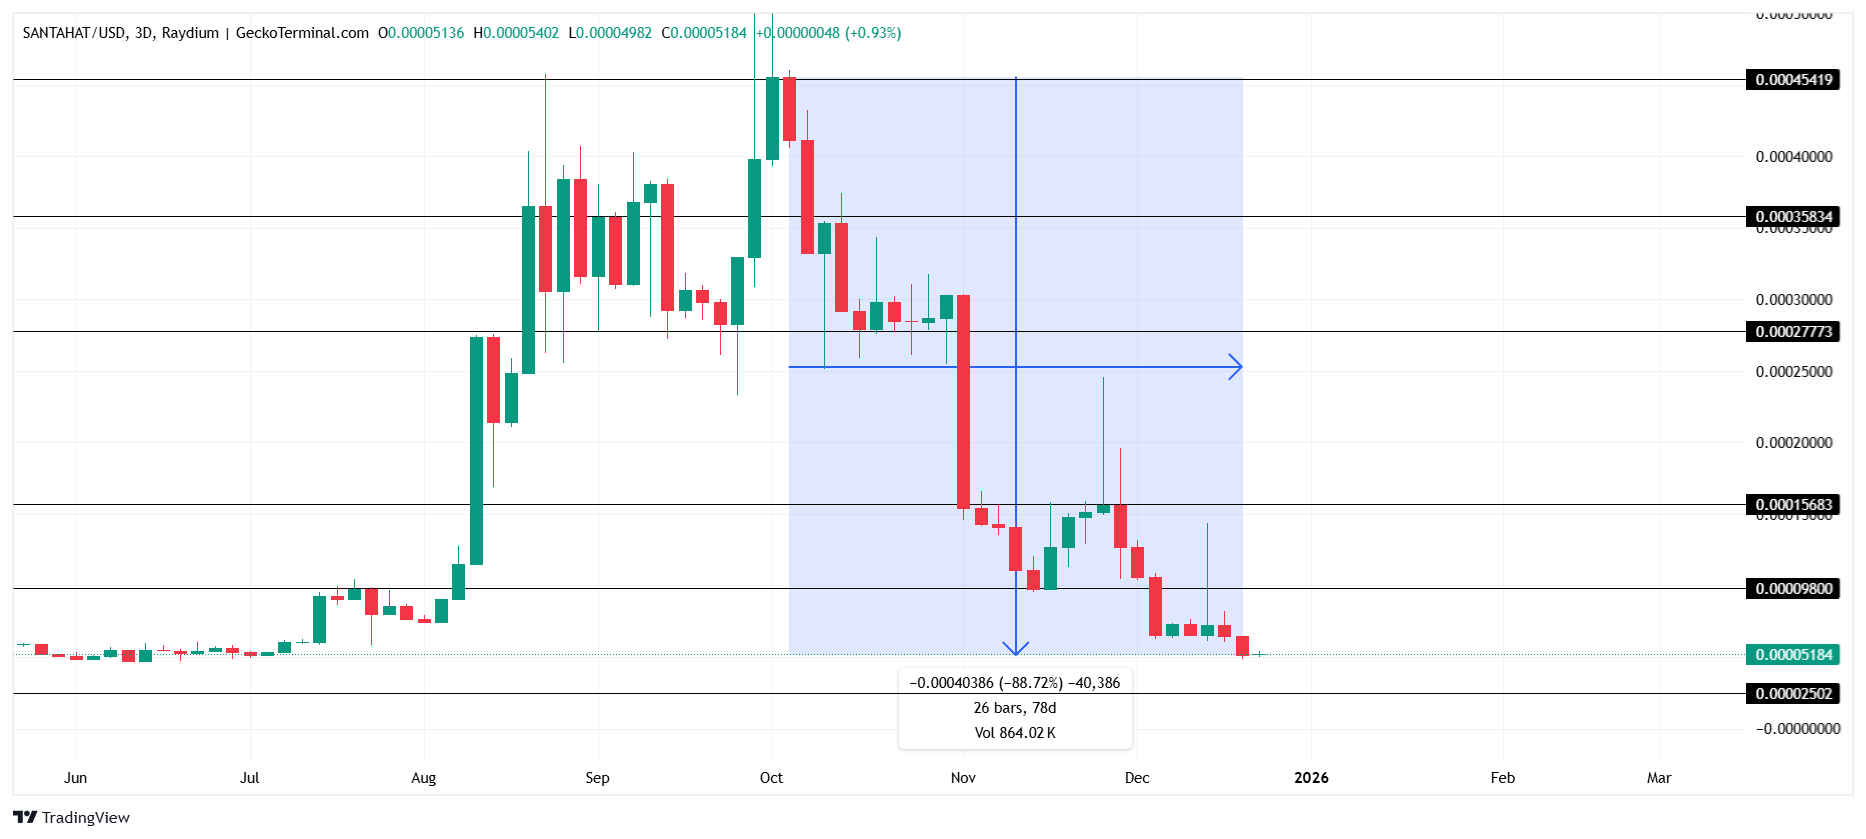
Momentum briefly returned during August and September, but selling pressure resumed in early October. Since then, SANTA HAT has plunged 88.7%, hitting a five-month low. Current price action suggests further downside, with a likely move toward the $0.00002502 support. A breakdown there risks a near-total loss.

SANTA HAT Price Analysis.
SANTA HAT Price Analysis. Source: GeckoTerminal

Despite more than 21,100 holders and locked liquidity, fundamentals have not translated into price stability. Historical performance remains the dominant signal. Past cycles show repeated failures to recover, reinforcing a bearish outlook for SANTA HAT despite its structurally sound on-chain mechanics.

Rizzmas (RIZZMAS)

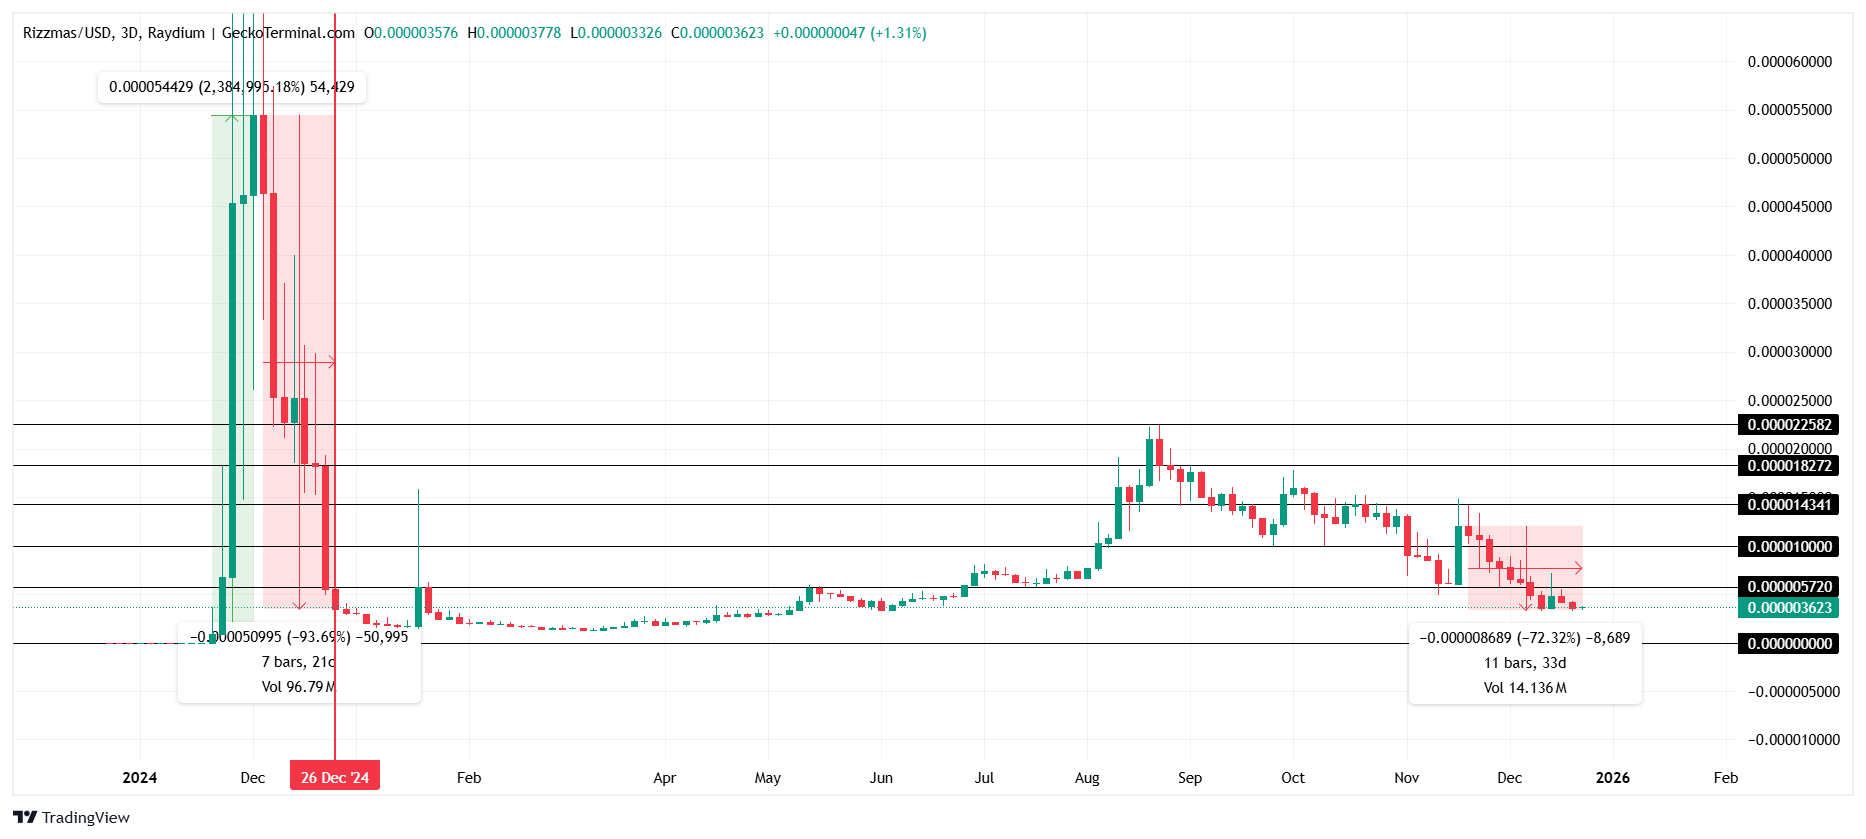
RIZZMAS illustrates the risks tied to Christmas-themed crypto tokens. Last year, the token surged 2,384% ahead of December before collapsing 93.6% by Christmas. The pattern reflects speculative hype rather than sustainable demand, leaving late investors exposed to sharp losses during seasonal reversals.

Over the past month, RIZZMAS has shed 72% of its earlier gains, despite reaching a yearly high of $0.00002258. Current price action signals continued weakness. Market structure suggests further downside, with the token at risk of losing nearly all remaining value in the coming sessions.

RIZZMAS Price Analysis.
RIZZMAS Price Analysis. Source: GeckoTerminal

A prudent approach favors caution. Seasonal tokens may appear attractive or fundamentally sound, yet often lack real utility or long-term growth drivers. Historical performance shows repeated boom-and-bust cycles, making capital preservation more important than chasing short-lived thematic rallies.

GigaMas (GIGAMAS)

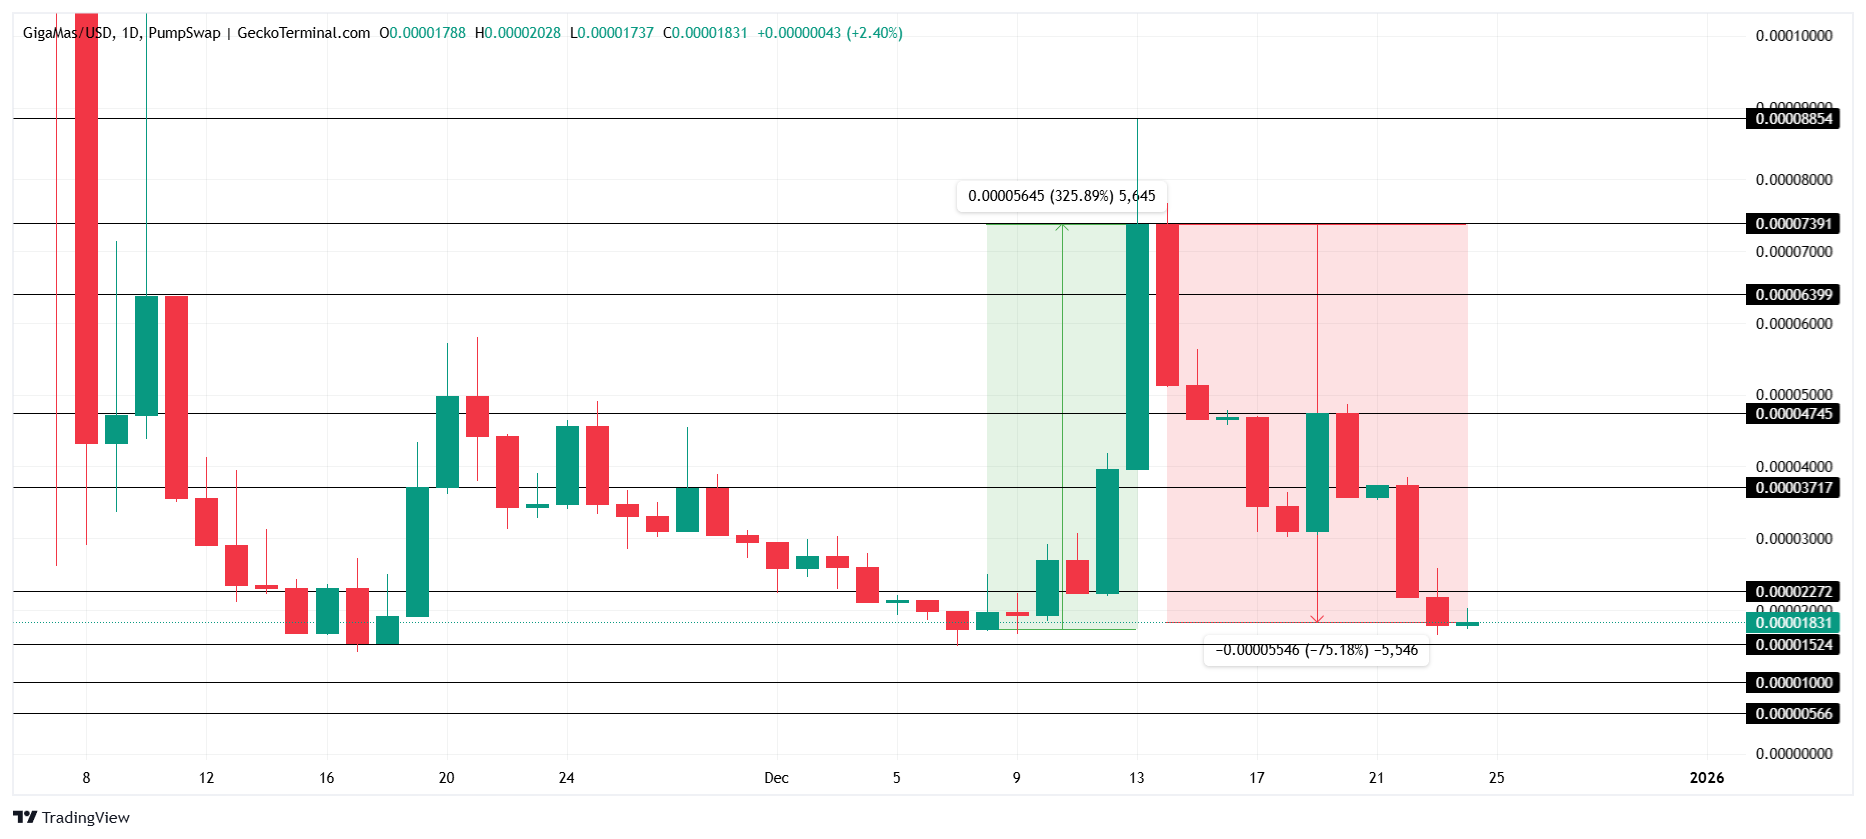
GIGAMAS represents a newer example of seasonal crypto tokens failing to sustain value. Launched less than two months ago, the Christmas-themed crypto token surged 325% during its initial rally before collapsing 75%. It now trades near $0.00001831, reflecting a rapid loss of speculative momentum.

Recovery prospects appear extremely limited. The technical structure shows weak demand and persistent selling pressure. GIGAMAS is likely to break below the $0.00001524 support, with further downside toward $0.00001000. A move through these levels could erase nearly all remaining value.

GIGAMAS Price Analysis.
GIGAMAS Price Analysis. Source: GeckoTerminal

This trend is critical for GIGAMAS’ roughly 2,000 holders to recognize. Holiday-themed tokens lack durable utility and long-term adoption. Historical performance suggests these assets behave like speculative traps, with sharp collapses typically accelerating as Christmas approaches.

The post Why Christmas-Themed Tokens Could be Worst Crypto Narratives of 2025 appeared first on BeInCrypto.

  •  

PIPPIN Price Nears Record Levels, but Outflows Start Rising

PIPPIN has surged sharply in recent sessions, reigniting interest across the market. The altcoin’s latest rally has pushed its price within reach of its all-time high, raising expectations of another record. 

However, as momentum builds, concerns around profit-taking and near-term selling pressure are also increasing.

PIPPIN Whales Could Shift The Outcome

On-chain flow data signals growing caution among retail participants. The Chaikin Money Flow has slipped below the zero line, entering negative territory. This shift indicates that PIPPIN outflows are beginning to outweigh inflows, reflecting early stages of distribution rather than accumulation.

The rise in outflows appears linked to investors locking in profits after the recent rally. When prices approach record levels, traders often reduce exposure to manage risk. This behavior can slow momentum, even during otherwise bullish market phases.

Want more token insights like this? Sign up for Editor Harsh Notariya’s Daily Crypto Newsletter here.

PIPPIN CMF
PIPPIN CMF. Source: TradingView

Despite signs of retail caution, whale activity remains supportive. Wallets holding more than $1 million worth of PIPPIN increased their holdings by 3.57% over the past 24 hours. Total whale-controlled supply now stands at approximately 425.34 million PIPPIN.

Large holders often influence short-term price trends due to their capital scale. Continued accumulation by whales suggests confidence in further upside. Their behavior can counterbalance retail selling, helping maintain price structure during volatile periods.

PIPPIN Whale Holdings.
PIPPIN Whale Holdings. Source: Nansen

PIPPIN Price Pushes On

PIPPIN trades near $0.497 at the time of writing, marking a 38% gain over the past 24 hours. The token now sits less than 7% below its all-time high of $0.530. Momentum remains strong, supported by sustained buying interest from large holders.

A successful breakout above $0.530 would likely attract additional speculative demand. Clearing the all-time high could open the path toward $0.600. Sustained volume above resistance would support further price discovery and the formation of new highs.

PIPPIN Price Analysis
PIPPIN Price Analysis. Source: TradingView

Downside risk remains if selling pressure accelerates. A failure to hold current levels could push PIPPIN below the $0.434 support. A deeper pullback toward $0.366 would invalidate the bullish thesis, shifting focus back to consolidation rather than expansion.

The post PIPPIN Price Nears Record Levels, but Outflows Start Rising appeared first on BeInCrypto.

  •  

Zcash Price Eyes 50% Breakout As Top Holders Accumulation Strengthens

Zcash has shown mixed price action in recent sessions, alternating between short pullbacks and brief recoveries. Volatility remains elevated, yet the broader technical structure continues to lean bullish. 

Despite hesitation in the spot market, ZEC’s macro trend suggests the potential for a sustained rally if key conditions align.

Zcash Holders To The Rescue

On-chain data indicates growing confidence among Zcash’s largest holders. Wallets ranked within the top 100 addresses increased their combined ZEC holdings by 2.7% over the past 24 hours. This accumulation occurred while the price declined nearly 6%, signaling strategic buying rather than reactive selling.

Such behavior reflects long-term optimism. Large holders often accumulate during drawdowns when they anticipate higher future prices. Their actions suggest expectations of recovery remain intact, providing a supportive demand base that could stabilize ZEC during periods of broader market uncertainty.

Want more token insights like this? Sign up for Editor Harsh Notariya’s Daily Crypto Newsletter here.

Zcash Top 100 Holder Balance.
Zcash Top 100 Holder Balance. Source: Nansen

Technical indicators support this constructive outlook. The Squeeze Momentum Indicator is currently signaling the formation of a squeeze. This setup often precedes sharp price movement when volatility expands after a period of compression.

Importantly, the histogram shows bullish momentum remains active. If the squeeze releases while momentum stays positive, the resulting volatility could favor an upside move for ZEC. Broader market stability will play a crucial role in determining whether this breakout materializes.

ZEC Squeeze Momentum Indicator
ZEC Squeeze Momentum Indicator. Source: TradingView

ZEC Price Is Looking At A Rally

ZEC is forming an ascending triangle, a bullish continuation pattern that often resolves higher. The structure suggests growing buying pressure against a horizontal resistance. Based on the pattern’s measured move, a breakout could deliver a 50% rally, targeting the $670 level.

A rebound from the $403 support would strengthen this setup. Holding this level could allow Zcash to breach the $442 resistance. A successful move above $442 would likely trigger a breakout from the triangle, opening the path toward the $500 resistance. Clearing that level would confirm a broader bullish rally.

ZEC Price Analysis
ZEC Price Analysis. Source: TradingView

Downside risks remain if momentum fails. A breakdown below the $403 support would invalidate the ascending triangle. In that scenario, ZEC could fall toward the $340 level, erasing much of this month’s gains and negating the bullish thesis.

The post Zcash Price Eyes 50% Breakout As Top Holders Accumulation Strengthens appeared first on BeInCrypto.

  •  

Ethereum Nears $3,000 as Bitmine Expands Holdings to 4 Million ETH

Ethereum is once again attempting to reclaim the $3,000 level after several failed efforts this month. ETH briefly pushed higher during early trading but continues facing resistance amid fragile broader market conditions. 

Despite muted momentum, on-chain data suggests investors may be positioning to support a potential recovery.

Ethereum Holders Continue To Grow

Ethereum’s network growth has surged to a four-year and seven-month high. This metric reflects the pace at which new addresses are joining the network. The increase signals renewed interest at current price levels, even as ETH struggles to break higher.

Rising network growth often introduces fresh capital. New participants expand liquidity and strengthen demand foundations. For Ethereum, this trend is particularly important as price recovery depends on sustained inflows rather than short-term speculative trading. Strong address growth suggests long-term confidence remains intact.

Want more token insights like this? Sign up for Editor Harsh Notariya’s Daily Crypto Newsletter here.

Ethereum Network Growth
Ethereum Network Growth. Source: Santiment

Bitmine Could Be Aiding Price Recovery

A major contributor to this growth is Bitmine. The firm has quickly accumulated Ethereum through its treasury strategy. Bitmine now holds approximately 4.066 million ETH, representing 3.37% of the total supply within six months.

The company has publicly targeted ownership of 5% of all ETH, a move that could further tighten circulating supply and support price appreciation.

Macro indicators present a mixed backdrop. The MVRV Long/Short Difference remains at low negative levels, indicating neither long-term holders nor short-term traders are currently in profit. This lack of profitability often slows transaction activity, as participants hesitate to move assets at a loss.

Low profit conditions can suppress velocity across the network. However, such environments also reduce sales pressure. If broader macro conditions improve, long-term holders typically act as stabilizers. Their reluctance to sell at unfavorable prices can provide a base for recovery when demand returns.

Ethereum’s current setup reflects this balance. Weak profitability limits enthusiasm, yet it also prevents aggressive distribution. A positive external catalyst could shift sentiment quickly, allowing stronger hands to absorb supply and push ETH higher.

Ethereum MVRV Long/Short Difference
Ethereum MVRV Long/Short Difference. Source: Santiment

ETH Price Faces Its Challenge

Ethereum trades near $2,968 at the time of writing, sitting just below the $3,000 resistance. The level has capped price action repeatedly in recent weeks. Continued failure to reclaim it keeps ETH vulnerable to volatility and short-term pullbacks.

To revisit December’s high of $3,447, ETH requires a recovery of roughly 16%. The first hurdle remains $3,131, a key resistance zone. Sustained network growth and continued accumulation by large entities like Bitmine could provide the buying pressure needed to reach this level.

ETH Price Analysis.
ETH Price Analysis. Source: TradingView

Downside risks persist if Ethereum fails to secure $3,000 as support. A rejection could send the price back toward $2,798, a level previously tested. Given ETH’s tendency for sharp moves in this range, a breakdown could accelerate losses before stability returns.

The post Ethereum Nears $3,000 as Bitmine Expands Holdings to 4 Million ETH appeared first on BeInCrypto.

  •  

Solana Eyes Recovery as Investors Quitely Accumulate $345 Million Worth of SOL

Solana slipped out of last week’s consolidation after failing to sustain upside momentum, delaying a recovery toward $150. SOL has since traded cautiously, awaiting stronger confirmation. 

Recent on-chain and institutional activity suggests investors are positioning for a rebound, potentially setting the stage for renewed price strength into year-end or early January.

Solana Holders Have The ETF Leash

Solana’s ecosystem is introducing a novel catalyst through on-chain “Creator ETFs,” also known as Bands, launched via Bands.fun. These products differ from traditional exchange-traded products. They operate directly on the Solana blockchain as programmable portfolios curated by creators, analysts, or influencers.

Creator ETFs can bundle tokens or NFTs and rebalance automatically based on a predefined rule. Increased adoption could lift on-chain activity and transaction volume. Higher network usage often supports price recovery by strengthening demand for SOL as a utility asset.

Institutions See Potential

Exchange balance data adds another constructive signal. Solana balances on centralized exchanges have dropped sharply over the past 10 days. During this period, investors accumulated roughly 2.65 million SOL, valued at $345 million.

Declining exchange balances typically indicate accumulation rather than distribution. Holders appear willing to move assets into self-custody, reducing immediate sell pressure. This behavior suggests confidence in Solana’s longer-term outlook and supports the case for stabilization following recent weakness.

Want more token insights like this? Sign up for Editor Harsh Notariya’s Daily Crypto Newsletter here.

Solana Exchange Balance
Solana Exchange Balance. Source: Glassnode

Institutional sentiment toward Solana remains resilient despite broader market uncertainty. CoinShares’ weekly report shows SOL attracted $48.5 million in inflows for the week ending December 20. Month-to-date inflows now stand at $117.6 million.

These allocations indicate sustained institutional interest. Professional investors often accumulate during consolidation phases. Continued inflows can help offset retail selling and provide a foundation for recovery when market conditions improve.

Solana Institutional Flows.
Solana Institutional Flows. Source: CoinShares

SOL Price Is Aiming At Recovery

Solana trades near $124 at the time of writing, sitting below the $126 resistance. The combination of on-chain innovation, exchange outflows, and institutional inflows could support a recovery attempt by late December or early January.

A break above $126 would be an initial confirmation. Reclaiming $130 would further strengthen sentiment. The key upside target sits near $136. Clearing this level would signal progress toward recouping losses recorded earlier this month.

Solana Price Analysis.
Solana Price Analysis. Source: TradingView

Downside risks persist if selling resumes or broader markets weaken. Solana’s price dropping below $123 could expose the $118 support. Losing that level would invalidate the bullish thesis and delay any recovery driven by ecosystem or institutional catalysts.

The post Solana Eyes Recovery as Investors Quitely Accumulate $345 Million Worth of SOL appeared first on BeInCrypto.

  •  

Ethereum Price is Overheated Due to New Holders Hitting 5-Month High

Ethereum continues to struggle near the $3,000 level as repeated recovery attempts lose momentum. ETH trades just below this psychological barrier, reflecting cautious sentiment. 

While investor interest is rising, on-chain activity remains muted. This imbalance is raising concerns that Ethereum’s price may be overheating without sufficient network usage to sustain gains.

Ethereum Holders Are Rising

Ethereum is recording a steady rise in new wallet creation. The network now averages about 163,000 new addresses per day. This compares with roughly 124,000 daily additions during July, previously considered a peak period for network growth.

The increase highlights strong investor curiosity around Ethereum despite weak price performance. Growing wallet creation suggests demand for exposure remains intact. However, new addresses alone do not guarantee price strength.

Want more token insights like this? Sign up for Editor Harsh Notariya’s Daily Crypto Newsletter here.

Ethereum Network Growth
Ethereum Network Growth. Source: Santiment

Macro indicators present a mixed picture. Ethereum’s network value-to-transactions ratio is rising sharply. The indicator currently sits at a 16-month high, signaling potential overheating conditions.

A high NVT ratio suggests market valuation is growing faster than transaction activity. Optimism around recovery appears to be driving interest, but real usage has yet to follow. Without increased on-chain activity, price advances risk stalling as valuation outpaces fundamentals.

Ethereum NVT Ratio
Ethereum NVT Ratio. Source: Glassnode

ETH Price Is Yet To Find Strength To Escape

Ethereum trades near $2,986 at the time of writing, sitting just below the $3,000 resistance. This level has been tested repeatedly in recent sessions. Failure to break above it has reinforced caution among traders watching for confirmation.

ETH may continue consolidating below $3,000 or briefly breach it without holding support. If transaction activity remains weak, downside pressure could return. In that case, the $2,798 support may be tested again, reflecting unresolved macro imbalances.

ETH Price Analysis.
ETH Price Analysis. Source: TradingView

Improving conditions could shift the outlook. A rise in transaction volume would help Ethereum secure $3,000 as support. Holding that level could open a path toward $3,131. A sustained break beyond this barrier would invalidate the bearish thesis and allow ETH to target $3,287, restoring confidence.

The post Ethereum Price is Overheated Due to New Holders Hitting 5-Month High appeared first on BeInCrypto.

  •  

Cardano’s Midnight Token Hits New All-Time High Amid a 50% Rally

Midnight has extended its sharp rally as strong investor demand pushed the token to a new all-time high. The project associated with Cardano founder Charles Hoskinson continues to attract attention after sustaining upside momentum. 

While NIGHT has already delivered outsized gains, technical and macro signals suggest additional upside potential remains.

Midnight Holders Are Watching A New Sunrise

Investor support for NIGHT remains firm. The Chaikin Money Flow sits in positive territory above the zero line, confirming net inflows. Although the indicator dipped slightly over the past 48 hours, capital continues entering the asset, signaling ongoing confidence rather than distribution.

Much of this demand is linked to Midnight’s association with Charles Hoskinson, the founder of Cardano. That connection has boosted credibility and visibility.

In the short term, this narrative-driven interest is likely to keep capital rotating into NIGHT, supporting elevated price levels.

Want more token insights like this? Sign up for Editor Harsh Notariya’s Daily Crypto Newsletter here.

NIGHT CMF
NIGHT CMF. Source: TradingView

Macro conditions also favor NIGHT’s performance. The token shows a weak correlation with Bitcoin, insulating it from broader market uncertainty. This independence has allowed NIGHT to trend higher even as Bitcoin struggles to regain momentum.

Low correlation often benefits emerging assets during periods of BTC consolidation. With Bitcoin lacking a clear recovery signal, NIGHT’s ability to move on its own fundamentals remains a key advantage. This dynamic could continue supporting relative outperformance in the near term.

NIGHT Correlation To Bitcoin
NIGHT Correlation To Bitcoin. Source: TradingView

NIGHT Price Forms New All-Time High

Midnight price surged 42.7% over the past 24 hours, trading near $0.093 at the time of writing. The rally resulted in a new intraday all-time high of $0.096. Momentum remains strong, reflecting aggressive buying and sustained interest following the breakout.

Bullish sentiment and favorable macro conditions support further upside. If current trends persist, NIGHT could push beyond the $0.100 level. Entering the 10-cent range would mark a psychological milestone, potentially drawing additional speculative interest and reinforcing momentum.

NIGHT Price Analysis.
NIGHT Price Analysis. Source: TradingView

Risks remain if holders begin taking profits. A wave of selling could pull NIGHT back toward the $0.075 support. Losing that level would weaken the bullish structure. Further downside could extend to $0.060, invalidating the current bullish thesis and increasing volatility.

The post Cardano’s Midnight Token Hits New All-Time High Amid a 50% Rally appeared first on BeInCrypto.

  •  

Bitcoin Critical Holders’ Profit Crashes To Monthly Low: Will Price Further Suffer?

Bitcoin has shown mixed price action in recent sessions, marked by sharp fluctuations and tentative recovery attempts. BTC rebounded after a brief breakdown, yet momentum remains fragile. 

A key concern is weakening confidence among one of Bitcoin’s most influential cohorts, which could complicate efforts to sustain a broader price recovery.

Bitcoin Holders Witness A Dip In Gains

Bitcoin long-term holders have increased selling activity over the past several days. On-chain data shows the 30-day change in long-term holder supply has dropped to a 20-month low.

Similar levels were last recorded in April 2024, signaling elevated distribution pressure.

This behavior suggests long-term holders are reducing exposure to protect remaining gains. As unrealized profits shrink, selling accelerates to avoid losses. Such actions often weigh on price recovery, as supply increases without a matching rise in new demand.

Want more token insights like this? Sign up for Editor Harsh Notariya’s Daily Crypto Newsletter here.

Bitcoin LTH Position Change
Bitcoin LTH Position Change. Source: Glassnode

Macro indicators provide additional context. The long-term holder net unrealized profit or loss metric has declined to a monthly low. This drop indicates profits among this group are eroding, increasing sensitivity to further downside moves.

Historically, falling LTH NUPL readings trigger defensive selling. However, once the indicator declines further, selling pressure often slows.

At those levels, long-term holders typically pause distribution, allowing Bitcoin price to stabilize and potentially recover if demand improves.

Bitcoin LTH NUPL
Bitcoin LTH NUPL. Source: Glassnode

BTC Price Is Awaiting Stronger Cues

Bitcoin trades near $87,900 at the time of writing, remaining below the $88,210 resistance. The asset recently bounced after briefly slipping under the $86,247 support. This recovery shows buyers are still active at lower levels, though conviction remains cautious.

A short-term climb toward $90,308 remains possible. However, resistance near that level could cap gains. Given ongoing long-term holder selling, Bitcoin may continue consolidating near the $88,201 zone while the market absorbs excess supply.

Bitcoin Price Analysis.
Bitcoin Price Analysis. Source: TradingView

Upside potential improves if long-term holders shift their stance. A slowdown in selling could reduce overhead pressure.

In that scenario, Bitcoin may break above $90,308 and target $92,933. Such a move would invalidate the bearish thesis and signal renewed confidence among key market participants.

The post Bitcoin Critical Holders’ Profit Crashes To Monthly Low: Will Price Further Suffer? appeared first on BeInCrypto.

  •  

Pi Coin Price Analysis: Claiming This Fibonacci Level Is the Key To Recovery

Pi Coin has faced renewed selling pressure after its recent decline pushed the price below the $0.200 level. The drop reflected weak market confidence and broader hesitation among investors. 

However, recent activity suggests holders are actively attempting to reverse the trend and stabilize Pi Coin’s price action.

Pi Coin Holders Change Their Stance

Momentum indicators point to a shift in sentiment. The moving average convergence divergence is forming a bullish crossover. The MACD line has crossed above the signal line, indicating strengthening upside momentum after an extended corrective phase.

This crossover ends a nearly 20-day stretch of bearish momentum. Such signals often precede short-term recoveries when supported by capital inflows.

For Pi Coin, this development suggests buyers are regaining control and attempting to rebuild confidence at current levels.

Want more token insights like this? Sign up for Editor Harsh Notariya’s Daily Crypto Newsletter here.

Pi Coin MACD
Pi Coin MACD. Source: TradingView

Macro indicators reinforce the improving outlook. The Chaikin Money Flow shows a clear change in capital behavior. Outflows observed earlier this month have flipped into inflows during the past 24 hours.

The CMF has moved above the zero line, confirming net buying activity. This shift highlights growing conviction among Pi Coin holders. Sustained inflows are essential for recovery, as price advances rely on consistent demand rather than short-lived speculative interest.

Pi Coin CMF
Pi Coin CMF. Source: TradingView

PI Price at a Critical Juncture

Pi Coin trades near $0.207 at the time of writing, sitting just below the $0.213 resistance. This level aligns with the 23.6% Fibonacci retracement. The overlap increases its technical importance for defining near-term direction.

Reclaiming $0.213 as support would strengthen the recovery structure. In an uptrend, holding this Fibonacci level often signals continuation. Supported by improving momentum and inflows, Pi Coin could advance toward $0.224, with scope for further gains if buying pressure persists.

Pi Coin Price Analysis.
Pi Coin Price Analysis. Source: TradingView

Downside risks remain if sentiment shifts again. Renewed selling could push Pi Coin below $0.207. A breakdown may expose $0.199 as initial support, followed by $0.188. Losing these levels would invalidate the bullish thesis and reinforce downside vulnerability.

The post Pi Coin Price Analysis: Claiming This Fibonacci Level Is the Key To Recovery appeared first on BeInCrypto.

  •  

Solana Price Depends On Existing SOL Holders, Here’s Why

Solana has struggled to recover after a recent price decline, with SOL remaining capped below the $130 resistance. The altcoin has shown attempts to stabilize, yet momentum remains fragile. 

Unlike previous rallies driven by new inflows, the next move appears dependent on existing Solana holders rather than fresh market entrants.

Some Solana Holders Show Resilience

On-chain data shows early signs of stabilization. The Chaikin Money Flow has posted a sharp uptick over the past few days. Although the indicator remains below the zero line, the upward movement suggests that capital outflows are slowing.

This shift is critical for Solana’s recovery outlook. Declining outflows often precede a transition toward inflows. Once buying pressure outweighs selling, SOL price can respond quickly. Sustained improvement in CMF would signal returning confidence among current holders.

Want more token insights like this? Sign up for Editor Harsh Notariya’s Daily Crypto Newsletter here.

Solana CMF
Solana CMF. Source: TradingView

Macro indicators present a more cautious picture. The number of new Solana addresses has dropped sharply in recent sessions. New addresses declined from 6.077 million to 5.390 million, an 11.3% decrease over ten days.

Falling network participation suggests weaker speculative interest. New investors appear hesitant, citing limited short-term incentives. This lack of fresh demand places greater importance on existing holders to support price stability and any recovery attempt.

Solana New Addresses
Solana New Addresses. Source: Glassnode

SOL Price Recovery Is Possible

Solana trades near $126 at the time of writing, remaining below the $130 resistance level. Price action shows consolidation rather than a breakout. The immediate goal for SOL is reclaiming $130, which would mark a shift in short-term momentum.

Declining outflows improve the probability of a rebound. If current holders maintain accumulation and inflows emerge, buying pressure could lift SOL toward $130. A sustained move above this level would require consistent support rather than brief speculative spikes.

Solana Price Analysis.
Solana Price Analysis. Source: TradingView

Downside risks persist if sentiment deteriorates. Renewed selling could push Solana below the $123 support. A breakdown at that level may expose $118 as the next downside target. Losing this support would invalidate the bullish outlook and reinforce short-term weakness.

The post Solana Price Depends On Existing SOL Holders, Here’s Why appeared first on BeInCrypto.

  •  

XRP Whales Bought $640 Million, What are They Anticipating?

XRP has struggled to sustain a recovery over the past several days, with price repeatedly failing to gain traction near key resistance levels. Despite the hesitation, investor behavior is shifting. 

Large holders appear to be increasing exposure, signaling growing confidence that current prices may offer an attractive entry point.

XRP Holders Are Imbuing Confidence

On-chain data shows a notable increase in whale accumulation. Addresses holding between 100 million and 1 billion XRP added roughly 330 million tokens over the past 48 hours.

This accumulation is valued at approximately $642 million, highlighting renewed demand from large investors.

Such behavior suggests XRP whales are capitalizing on depressed prices rather than exiting positions. Accumulation during consolidation phases often reflects expectations of recovery.

This demand can provide structural support, reducing downside risk while improving the probability of a sustained rebound.

Want more token insights like this? Sign up for Editor Harsh Notariya’s Daily Crypto Newsletter here.

XRP Whale Holding
XRP Whale Holding. Source: Santiment

Macro indicators further support the constructive outlook. XRP’s liveliness metric has declined over the past week, signaling reduced coin movement. This trend suggests that long-term holders are shifting away from a selling behavior.

Lower liveliness readings often reflect accumulation or holding patterns. Even a pause in selling by long-term holders can stabilize price action.

Reduced distribution helps absorb short-term volatility, improving conditions for recovery when new demand enters the market.

XRP Liveliness
XRP Liveliness. Source: Glassnode

XRP Price Can Escape

XRP trades near $1.94 at the time of writing, sitting just below a month-long downtrend that has capped upside. The immediate recovery target stands at $2.02. A break above this level would signal renewed strength and an improvement in the trend.

Accumulation by whales and declining long-term selling pressure favor a bullish scenario. If these factors persist, XRP could push past $2.02 and advance toward $2.20. Such a move would mark a clear breakout from the prevailing downtrend.

XRP Price Analysis.
XRP Price Analysis. Source: TradingView

Downside risks remain if bearish pressure regains control. A failure to sustain momentum could pull XRP back toward $1.85. Further weakness may expose the $1.79 support. Losing that level would invalidate the bullish thesis and reinforce near-term downside risk.

The post XRP Whales Bought $640 Million, What are They Anticipating? appeared first on BeInCrypto.

  •  

HBAR Price Looks Closely Tried to Bitcoin, What’s Next?

Hedera’s HBAR continues to trade under pressure as a persistent downtrend limits upside attempts. Multiple breakout efforts have failed, keeping the altcoin from establishing higher levels.

The broader market environment has added strain, preventing HBAR from gaining traction despite brief stabilization near key support zones.

Hedera Is Facing Bearishness

Technical indicators show growing bearish momentum. The Squeeze Momentum Indicator was released earlier last week, triggering heightened volatility. Instead of an upside move, the release resulted in a sharp price drop, reinforcing negative sentiment among short-term traders.

The indicator’s histogram continues to deepen in bearish territory. This pattern suggests selling pressure remains dominant. Strengthening downside momentum reduces the likelihood of HBAR price recovery, as traders hesitate to reenter positions amid weak technical confirmation.

HBAR Squeeze Momentum Indicator
HBAR Squeeze Momentum Indicator. Source: TradingView

HBAR’s macro outlook is closely tied to Bitcoin’s performance. The altcoin currently shows a strong correlation of 0.79 with BTC. This relationship indicates HBAR is largely mirroring Bitcoin’s price movements rather than acting independently.

Bitcoin’s struggle to recover has therefore weighed heavily on HBAR. When BTC lacks momentum, correlated assets often face similar constraints. Unless Bitcoin stages a sustained rebound, HBAR’s ability to break its downtrend remains limited by broader market weakness.

HBAR Correlation With Bitcoin
HBAR Correlation With Bitcoin. Source: TradingView

HBAR Price Could Note Further Decline

HBAR trades near $0.111 at the time of writing, holding slightly above the $0.110 support. The token dropped 24.5% earlier last week after failing to escape its month-long downtrend. Current price action suggests cautious stabilization rather than reversal.

Given prevailing conditions, HBAR may continue to struggle below the $0.120 level. Persistent bearish momentum could drag the price toward $0.099. A move to this zone would extend losses and reinforce the downtrend that has dominated recent trading sessions.

HBAR Price Analysis.
HBAR Price Analysis. Source: TradingView

A bullish alternative depends on renewed investor inflows. Increased buying interest could help HBAR reclaim $0.120 and break free from its downward structure. A sustained push toward $0.125 would invalidate the bearish thesis and signal improving confidence among market participants.

The post HBAR Price Looks Closely Tried to Bitcoin, What’s Next? appeared first on BeInCrypto.

  •  

Will Zcash (ZEC) Price Rally Beyond $500? Here’s What the Charts Say

Zcash has recorded a sharp upside move, gaining 13% over the past 24 hours and pushing closer to the $500 level. 

The rally reflects improving holder confidence and supportive technical momentum. Unlike many altcoins, ZEC is maintaining relative strength despite broader market uncertainty.

Zcash Holders Seem To Be Changing Stance

Momentum indicators highlight Zcash’s improving sentiment. The Relative Strength Index (RSI) has climbed above the neutral 50.0 level and entered the positive zone. This shift places ZEC among a small group of altcoins currently showing bullish momentum.

An RSI above 50.0 suggests buyers are gaining control. This positioning may help Zcash resist short-term bearish pressure affecting the wider market. Strong momentum readings often support trend continuation when paired with stable demand from holders.

Want more token insights like this? Sign up for Editor Harsh Notariya’s Daily Crypto Newsletter here.

ZEC RSI
ZEC RSI. Source: TradingView

Macro indicators reinforce the constructive outlook. The Chaikin Money Flow is trending higher, signaling a slowdown in capital outflows. Although the indicator remains below the zero line, the upward move suggests selling pressure is easing.

Retracing outflows is significant during recovery phases. If market conditions remain steady, declining outflows could transition into net inflows. Such a shift would confirm improving conviction and provide the liquidity needed to sustain ZEC’s upward trajectory.

ZEC CMF
ZEC CMF. Source: TradingView

Is ZEC Price Looking At Recovery?

Zcash price is standing near $438 at the time of writing, marking a 13% gain in one day. The price is now testing the $442 resistance zone. Clearing this level is critical for confirming the continuation of the current rally.

Bullish technical signals support further upside. If momentum indicators remain positive and capital flows stabilize, ZEC could advance toward $500. The move would require only a 13.8% increase from current levels, making the target technically achievable in favorable conditions.

ZEC Price Analysis
ZEC Price Analysis. Source: TradingView

Downside risks persist if resistance holds. Failure to breach $442 or renewed selling could pull ZEC back toward the $403 support. A breakdown below that level would weaken the bullish outlook and open the door to a deeper correction toward $370.

The post Will Zcash (ZEC) Price Rally Beyond $500? Here’s What the Charts Say appeared first on BeInCrypto.

  •  

3 Altcoins To Watch This Weekend | December 20 – 21

The crypto market is heading into the final week of 2025, and this will be the second last weekend of the year. As Bitcoin and the altcoins alike have been directionless, external factors may act as catalysts in the coming days.

BeInCrypto has analysed three such altcoins that present interesting opportunities for investors this weekend.

Midnight (NIGHT)

NIGHT has emerged as the best-performing altcoin of the week, gaining 61% since launch. Strong early momentum continues to attract speculative interest. The sharp rise reflects heightened demand from traders seeking exposure to newly launched assets with high growth narratives.

Investor interest is driven by NIGHT’s development ties to Charles Hoskinson and the Cardano ecosystem through the Midnight blockchain. The token now exceeds a $1 billion market cap. Trading near $0.064, NIGHT could break $0.065 and $0.075, targeting the $0.088 all-time high.

Want more token insights like this? Sign up for Editor Harsh Notariya’s Daily Crypto Newsletter here.

NIGHT Price Analysis.
NIGHT Price Analysis. Source: TradingView

Downside risks remain elevated for a newly launched token. Premature profit-taking could reverse momentum quickly. If selling pressure increases, NIGHT may fall toward $0.045. Such a move would erase recent gains, invalidate the bullish thesis, and increase short-term volatility.

Pump.fun (PUMP)

PUMP has moved opposite to NIGHT, ranking among the worst-performing altcoins this week. The token has fallen more than 35%, trading near $0.00197. Persistent selling pressure reflects weak sentiment, as investors continue reducing exposure amid broader market uncertainty.

Despite losses, technical indicators offer a potential rebound signal. The relative strength index has entered oversold territory, suggesting selling pressure may be exhausting. If buyers step in, PUMP could rebound above $0.00212 and extend gains toward the $0.00242 resistance level.

PUMP Price Analysis.
PUMP Price Analysis. Source: TradingView

The recovery scenario remains fragile. Failure to attract buying interest could extend losses. A breakdown below current levels may send PUMP toward the $0.00171 support. Such a move would invalidate the bullish outlook and reinforce continued downside risk.

Bitcoin Cash (BCH)

Bitcoin Cash jumped 8% today on asset-specific activity rather than broader Bitcoin moves. The rally followed speculation surrounding ShapeShift founder Erik Voorhees swapping 4,619 ETH, valued at $13.42 million, for 24,950 BCH from a wallet inactive for nine years, reigniting market interest.

However, Erik Voorhees confirmed that the wallet did not belong to him, nor does he own any BCH. Nevertheless, the rally ignited by the speculation may likely extend into the weekend.

Continued investor inflows, confirmed by a rising Chaikin Money Flow, support the upside case. If demand holds, BCH could break above $593 and advance toward $624, signaling short-term recovery strength driven by renewed confidence.

BCH Price Analysis.
BCH Price Analysis. Source: TradingView

Downside risks persist if momentum fades. Failure to reclaim $593 could keep Bitcoin Cash capped below $600. In that scenario, weakening demand may pull BCH toward $555 or lower, reinforcing consolidation and invalidating the near-term bullish outlook.

The post 3 Altcoins To Watch This Weekend | December 20 – 21 appeared first on BeInCrypto.

  •  

Ethereum Outshines Bitcoin Even As Price Remains Stuck Under $3,000

Ethereum continues to struggle with price recovery as it repeatedly fails to close above the $3,000 level. ETH has shown brief upside attempts, only to retreat under selling pressure. 

While price action remains frustrating for holders, underlying network data points to strengthening fundamentals that may support future recovery.

Ethereum Holders Are Staying

Ethereum leads all major cryptocurrencies in non-empty wallet count. The network hosts more than 167.9 million active addresses holding balances. Bitcoin, by comparison, has about 57.62 million. Other top-cap assets trail significantly behind both networks.

This dominance highlights Ethereum’s broad user base and diverse use cases. Decentralized finance, NFTs, and smart contract activity continue to drive engagement. Strong participation reflects confidence, which plays a critical role in sustaining demand.

Want more token insights like this? Sign up for Editor Harsh Notariya’s Daily Crypto Newsletter here.

Ethereum Holders Data
Ethereum Holders Data. Source: Santiment

Macro indicators further support a constructive outlook. Ethereum balances on centralized exchanges have declined steadily. Since the start of the month, roughly 397,495 ETH have been withdrawn from exchanges, reducing immediate sell-side supply.

These outflows suggest accumulation at current price levels. The withdrawn ETH is valued at over $1.17 billion, signaling confidence among long-term investors. Lower exchange balances often precede reduced selling pressure, which can support price recovery when demand strengthens.

Ethereum Balance on Exchanges
Ethereum Balance on Exchanges. Source: Glassnode

ETH Price Could Breach The Critical Barrier

Ethereum trades near $2,946 at the time of writing, remaining below the psychological $3,000 level. The asset has consistently bounced off the $2,762 support zone over recent weeks. This behavior indicates buyers are defending lower levels despite broader uncertainty.

If supportive trends continue, ETH could attempt another breakout above $3,000. A successful move may open the path toward $3,131. Continued momentum could extend gains toward $3,287, signaling improving confidence among both retail and institutional participants.

ETH Price Analysis.
ETH Price Analysis. Source: TradingView

Risks persist if selling pressure intensifies. A breakdown below $2,762 would weaken the recovery narrative. Losing this support could send Ethereum toward the $2,681 level, marking a four-week low and invalidating the bullish thesis outlined by improving on-chain metrics.

The post Ethereum Outshines Bitcoin Even As Price Remains Stuck Under $3,000 appeared first on BeInCrypto.

  •  

Pi Coin’s Decline Continues, Yet the Data Tells a More Complex Story

Pi Coin has extended its decline for a third straight week, falling sharply from its recent local top. The altcoin has struggled amid weak investor support and broader market hesitation. 

While selling pressure dominated earlier sessions, on-chain signals now suggest at least one key factor may be improving.

Pi Coin Holders Are Capitalizing

The Chaikin Money Flow has shown a gradual uptick over the past few days. This shift indicates capital is slowly returning to Pi Coin. Investors appear to be adjusting their stance, likely viewing current prices as attractive accumulation zones.

Rising CMF readings often reflect improving conviction. Fresh inflows are critical for any recovery attempt, as sustained buying helps absorb sell pressure. If this trend continues, Pi Coin could gain the momentum needed to stabilize and attempt a short-term rebound.

Want more token insights like this? Sign up for Editor Harsh Notariya’s Daily Crypto Newsletter here.

Pi Coin CMF
Pi Coin CMF. Source: TradingView

Despite improving inflows, macro indicators remain mixed. The average directional index shows the recent downtrend is close to strengthening. A move above the 25.0 threshold would confirm dominant bearish momentum, reinforcing control by sellers.

However, failure to cross this level would signal weakening trend strength. In such a scenario, selling pressure could fade. This would give Pi Coin room to recover, especially if buying interest continues to increase alongside supportive market conditions.

Pi Coin ADX
Pi Coin ADX. Source: TradingView

PI Price Could End Up Rangebound

Pi Coin trades near $0.203 at the time of writing, holding above the $0.198 support and below the $0.208 resistance. The token remains down about 28% from its $0.284 local top. Price action suggests consolidation rather than a decisive move.

If the downtrend strengthens, Pi Coin may remain range-bound between $0.198 and $0.208. This structure would limit upside potential and delay recovery. Prolonged consolidation could further test investor patience during ongoing market uncertainty.

Pi Coin Price Analysis.
Pi Coin Price Analysis. Source: TradingView

A bullish scenario depends on sustained capital inflows. Continued accumulation could help Pi Coin reclaim $0.208 as support. A successful breakout may drive price toward $0.217, with further upside to $0.224. Such a move would invalidate the bearish thesis.

The post Pi Coin’s Decline Continues, Yet the Data Tells a More Complex Story appeared first on BeInCrypto.

  •  

Bitcoin Whales Moved — But Not in the Way Markets Assumed

Bitcoin’s recent pullback below $85,000 briefly suggested renewed accumulation among large investors. Instead, on-chain data shows a different picture forming beneath the surface. 

While price has stabilized above key support, the underlying behavior points to balance restructuring rather than fresh capital entering the market.

Bitcoin Holders Are Not Too Bullish

Wallets holding between 100 and 1,000 BTC recently showed an increase, initially signaling potential whale accumulation. However, Glassnode’s senior researcher clarified that this rise reflects wallet reshuffling rather than new buying. These movements do not represent additional demand entering the Bitcoin market.

Wallet reshuffling occurs when large entities split or consolidate balances across addresses. The process helps manage custody, internal risk, or accounting needs. Ownership does not change. Coinbase recently reshuffled about 640,000 BTC internally, offering a clear example of this behavior influencing cohort data.

Because reshuffling does not introduce new capital, its impact on price is zero. The activity can distort accumulation metrics, leading to false bullish signals. 

Want more token insights like this? Sign up for Editor Harsh Notariya’s Daily Crypto Newsletter here.

Bitcoin Supply Held By Large Entities.
Bitcoin Supply Held By Large Entities. Source: Glassnode

Macro indicators add further caution. The MVRV Long/Short Difference currently shows profits concentrated among short-term Bitcoin holders rather than long-term holders. This imbalance raises downside risk, as short-term holders historically react quickly to price fluctuations.

When profits sit with short-term participants, selling pressure often increases during periods of uncertainty. These holders are more likely to secure gains at the first sign of weakness. This dynamic can suppress upside momentum and prolong consolidation across key price ranges.

Bitcoin MVRV Long/Short Difference
Bitcoin MVRV Long/Short Difference. Source: Santiment

BTC Price May See Some Struggle

Bitcoin is trading near $87,108 at the time of writing, holding above the $86,361 support level. While this zone provides near-term stability, recovery remains fragile. BTC must reclaim higher levels before signaling a meaningful trend reversal.

Short-term holders continue to pose a risk to upside progress. If they begin taking profits, Bitcoin could remain range-bound below $88,210. A failure to maintain this structure could result in another test of $84,698, a level already visited during recent volatility.

Bitcoin Price Analysis.
Bitcoin Price Analysis. Source: TradingView

A stronger recovery requires Bitcoin to convincingly breach $88,210. A push toward $90,401 would signal improving momentum. Achieving this move depends on renewed investor support, which may emerge as value-oriented buyers respond to current price discounts.

The post Bitcoin Whales Moved — But Not in the Way Markets Assumed appeared first on BeInCrypto.

  •  

XRP Struggles Below $2.00 as Network Activity Remains Weak

XRP remains under pressure after extending its downtrend and slipping well below the $2.00 level. The pullback has dampened short-term momentum despite pockets of investor optimism. 

That confidence has yet to translate into stronger network activity, limiting XRP’s ability to stage a meaningful price recovery.

XRP Holders Are Doing Their Part

HODL Waves data shows growing conviction among longer-term XRP holders. Since the start of the month, wallets holding XRP for one to two years increased their supply share by 3%. This cohort now controls roughly 11% of circulating XRP.

The shift reflects mid-term holders maturing into long-term holders. Such behavior often signals confidence during periods of price weakness. These investors appear willing to endure volatility, anticipating a future recovery rather than reacting to short-term price swings.

However, this also indicates that the mid-term holders are underwater. Hence, they are forced to hold XRP tokens.

Want more token insights like this? Sign up for Editor Harsh Notariya’s Daily Crypto Newsletter here.

XRP HODL Waves
XRP HODL Waves. Source: Glassnode

Nonetheless, macro indicators suggest challenges persist. The network value to transactions ratio shows elevated readings. Rising NVT levels often suggest valuation is outpacing on-chain utility.

The indicator recently reached a three-month high, pointing to potential overheating. XRP’s transaction activity has not kept pace with market expectations. This imbalance weakens recovery attempts, as price advances lack confirmation from network usage and sustained demand.

XRP NVT Ratio
XRP NVT Ratio. Source: Glassnode

XRP Price May Be Safe From A Crash

XRP trades near $1.86 at the time of writing, remaining well below the $2.00 mark lost last week. The decline followed a failed attempt to break out of a month-long downtrend earlier this month. Momentum remains fragile under current conditions.

The token is holding above the $1.85 support level, which has been tested previously. XRP may consolidate below $1.94 if selling pressure eases. However, worsening sentiment could push the price toward $1.79, extending short-term losses.

XRP Price Analysis.
XRP Price Analysis. Source: TradingView

A recovery scenario depends on improving network activity and broader market stability. A break above $1.94 would be the first step toward reclaiming $2.00. Flipping $2.02 into support could drive XRP toward $2.20, invalidating the bearish trend.

The post XRP Struggles Below $2.00 as Network Activity Remains Weak appeared first on BeInCrypto.

  •  

PUMP Price Crashes to 5-Month Low After 33% Decline This Week

Pump.fun has suffered a sharp price decline, pushing PUMP to a five-month low. The drop reflects sustained capital outflows from holders who see limited near-term value in the token. 

Broader market weakness has worsened the situation, with Bitcoin’s instability adding pressure to already fragile sentiment.

Pump.fun Holders Move To Sell

On-chain indicators point to a decisive loss of confidence among PUMP holders. The Chaikin Money Flow sits deep below the zero line, confirming aggressive capital withdrawals. Furthermore, this reading shows investors are exiting positions rather than positioning for a recovery.

The CMF has now reached an all-time low, marking the largest outflows in PUMP’s trading history. Such extreme readings typically reflect bearish conviction. Additionally, persistent selling reduces liquidity support, making short-term stabilization difficult and keeping downside risks elevated.

Want more token insights like this? Sign up for Editor Harsh Notariya’s Daily Crypto Newsletter here.

PUMP CMF
PUMP CMF. Source: TradingView

PUMP’s macro outlook remains closely tied to Bitcoin’s performance. Its correlation with Bitcoin recently rebounded to 0.78 after a brief decline. This indicates PUMP is once again closely tracking Bitcoin’s price movements.

This relationship is problematic given Bitcoin’s uncertainty near the $86,000 level. Besides, weakness in the broader market often amplifies losses in smaller tokens. Thus, if Bitcoin declines further, PUMP is likely to follow, extending losses for remaining holders.

PUMP Correlation To Bitcoin
PUMP Correlation To Bitcoin. Source: TradingView

PUMP Price May See Further Correction

PUMP is trading near $0.002031 at the time of writing, its lowest level in five months. As it stands, the token has fallen by more than 33.8% in just one week. Accelerating losses reflect worsening sentiment and the absence of consistent buying interest.

Continued holder exits could push PUMP toward the $0.001917 support. This level is critical for near-term stability. Additionally, the breakdown below it may open the door to $0.001711, reinforcing the bearish trend and intensifying downside volatility.

PUMP Price Analysis
PUMP Price Analysis. Source: TradingView

A recovery scenario depends on improved market conditions and renewed inflows of capital. Reclaiming $0.002123 as support would be an early signal of stabilization. Furthermore, if buying interest returns, PUMP could advance toward $0.002428, invalidating the bearish thesis and restoring short-term confidence.

The post PUMP Price Crashes to 5-Month Low After 33% Decline This Week appeared first on BeInCrypto.

  •  

3 Altcoins to Watch Ahead of the 2025 Santa Rally Season

During the festival season, the crypto markets, much like traditional financial markets, often lean bullish as liquidity improves, sentiment turns optimistic, and traders position themselves for a year-end push. While Christmas-themed tokens might see a spike in this duration, the focus is on altcoins with strong momentum.

BeInCrypto has analysed three such altcoins that could note a “Santa” rally within the coming week.

MYX Finance (MYX)

MYX Finance signaled a potential catalyst after confirming MYX V2 has been in development for several months. A launch near Christmas or New Year appears plausible. Historically bullish seasonal conditions could amplify market interest, positioning MYX for increased volatility.

The MYX token has maintained an uptrend for over six weeks, reflecting improving momentum. Trading near $3.55, the price could break above $3.71 if optimism builds. A successful breakout may drive MYX toward $4.00, marking its highest level in roughly two months.

Want more token insights like this? Sign up for Editor Harsh Notariya’s Daily Crypto Newsletter here.

MYX Price Analysis
MYX Price Analysis. Source: TradingView

Technical indicators support upside risks. The relative strength index remains in bullish territory, signaling sustained demand. However, an overbought reading could trigger profit-taking.

If selling pressure accelerates, MYX may retreat toward $3.00 or lower, invalidating the bullish outlook.

Memecore (M)

Memecore has gained 25% over the past week as it attempts to recover losses from late November. The rebound reflects improving short-term momentum. If buying pressure persists, the altcoin may challenge the $2.00 level, signaling a broader recovery phase supported by renewed investor interest.

Technical indicators support the upside scenario. The Parabolic SAR confirms an active uptrend, while ongoing Christmas events may bolster demand. Memecore must clear the $1.88 resistance to advance beyond $2.00. A breakout could open the path toward $2.12, reinforcing bullish momentum.

Memecore Price Analysis
Memecore Price Analysis. Source: TradingView

Downside risks remain if sentiment shifts. Selling pressure could push M below recent levels, exposing the $1.42 support. A decline in this zone would invalidate the bullish outlook and weaken market confidence.

Mantle (MNT)

Mantle has outperformed several major altcoins despite broader market volatility. MNT is up 15% over the past week, trading near $1.28. The move signals short-term strength as investors rotate toward assets showing relative resilience amid uncertain cryptocurrency market conditions.

On-balance volume has risen over recent sessions, indicating growing buying interest. This shift may support a bullish reversal or short-term relief rally. If momentum continues, MNT could break above $1.34. A successful move may open a path toward $1.50 in the near term.

MNT Price Analysis
MNT Price Analysis. Source: TradingView

Risks remain if buying pressure fades. Failure to clear the $1.34 resistance could stall the rally. MNT may consolidate or slip toward $1.30. A breakdown below this level would invalidate the bullish outlook and reinforce sideways or bearish price action.

The post 3 Altcoins to Watch Ahead of the 2025 Santa Rally Season appeared first on BeInCrypto.

  •  
❌