Reading view

3 Altcoins To Watch This Weekend | December 20 – 21

The crypto market is heading into the final week of 2025, and this will be the second last weekend of the year. As Bitcoin and the altcoins alike have been directionless, external factors may act as catalysts in the coming days.

BeInCrypto has analysed three such altcoins that present interesting opportunities for investors this weekend.

Midnight (NIGHT)

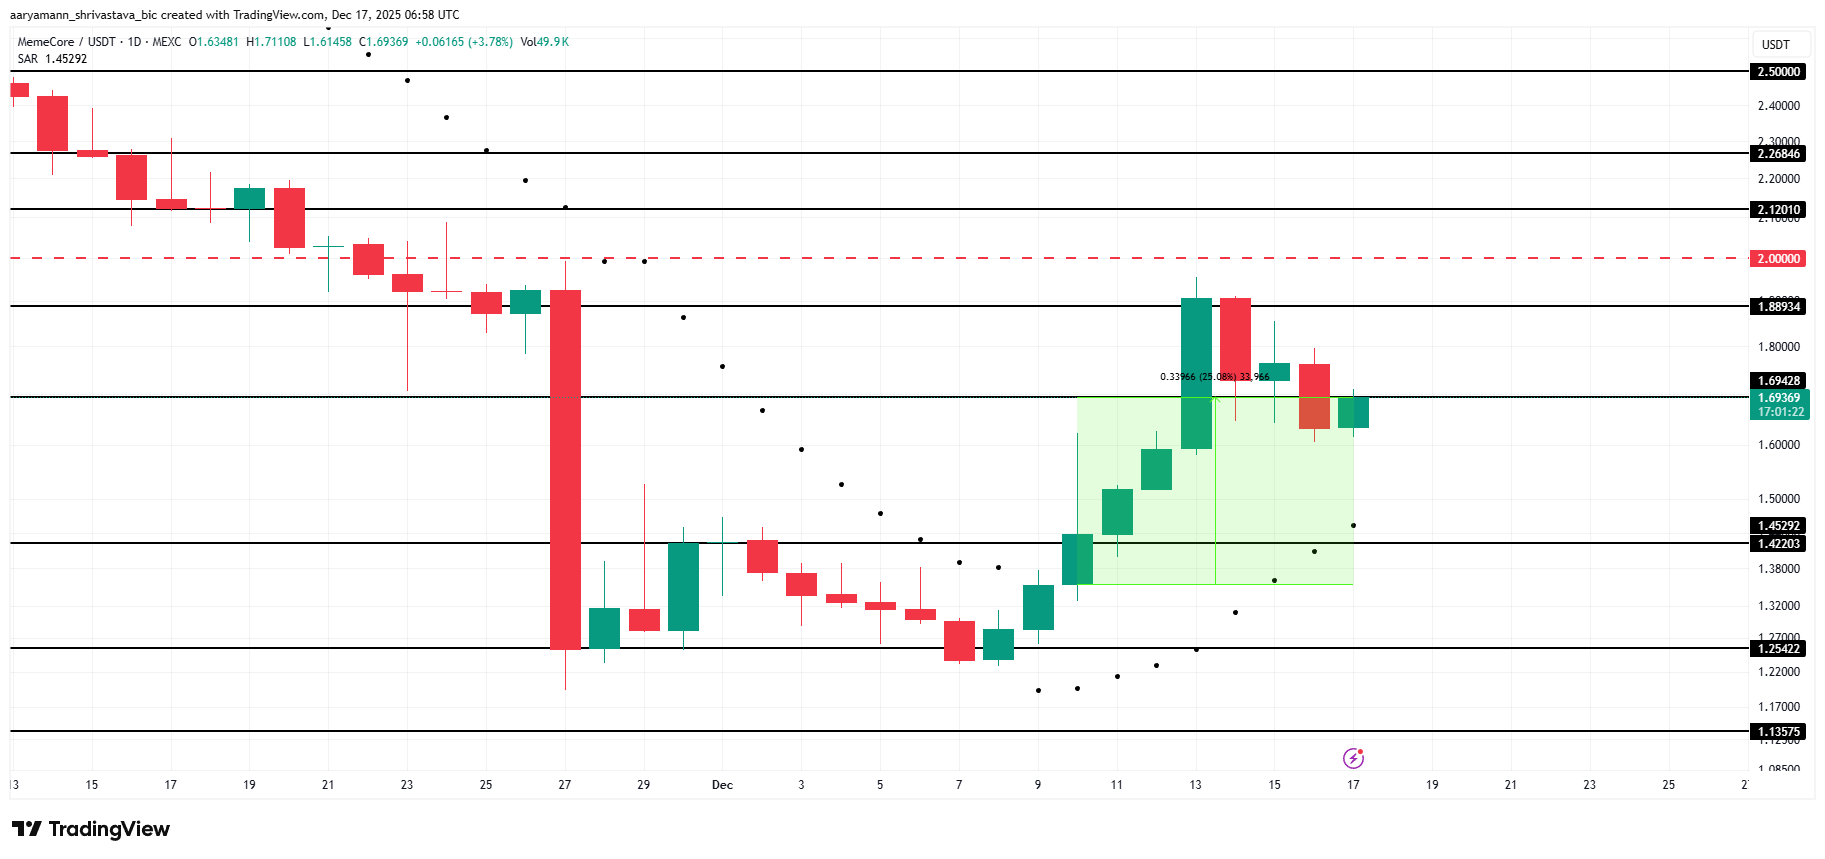
NIGHT has emerged as the best-performing altcoin of the week, gaining 61% since launch. Strong early momentum continues to attract speculative interest. The sharp rise reflects heightened demand from traders seeking exposure to newly launched assets with high growth narratives.

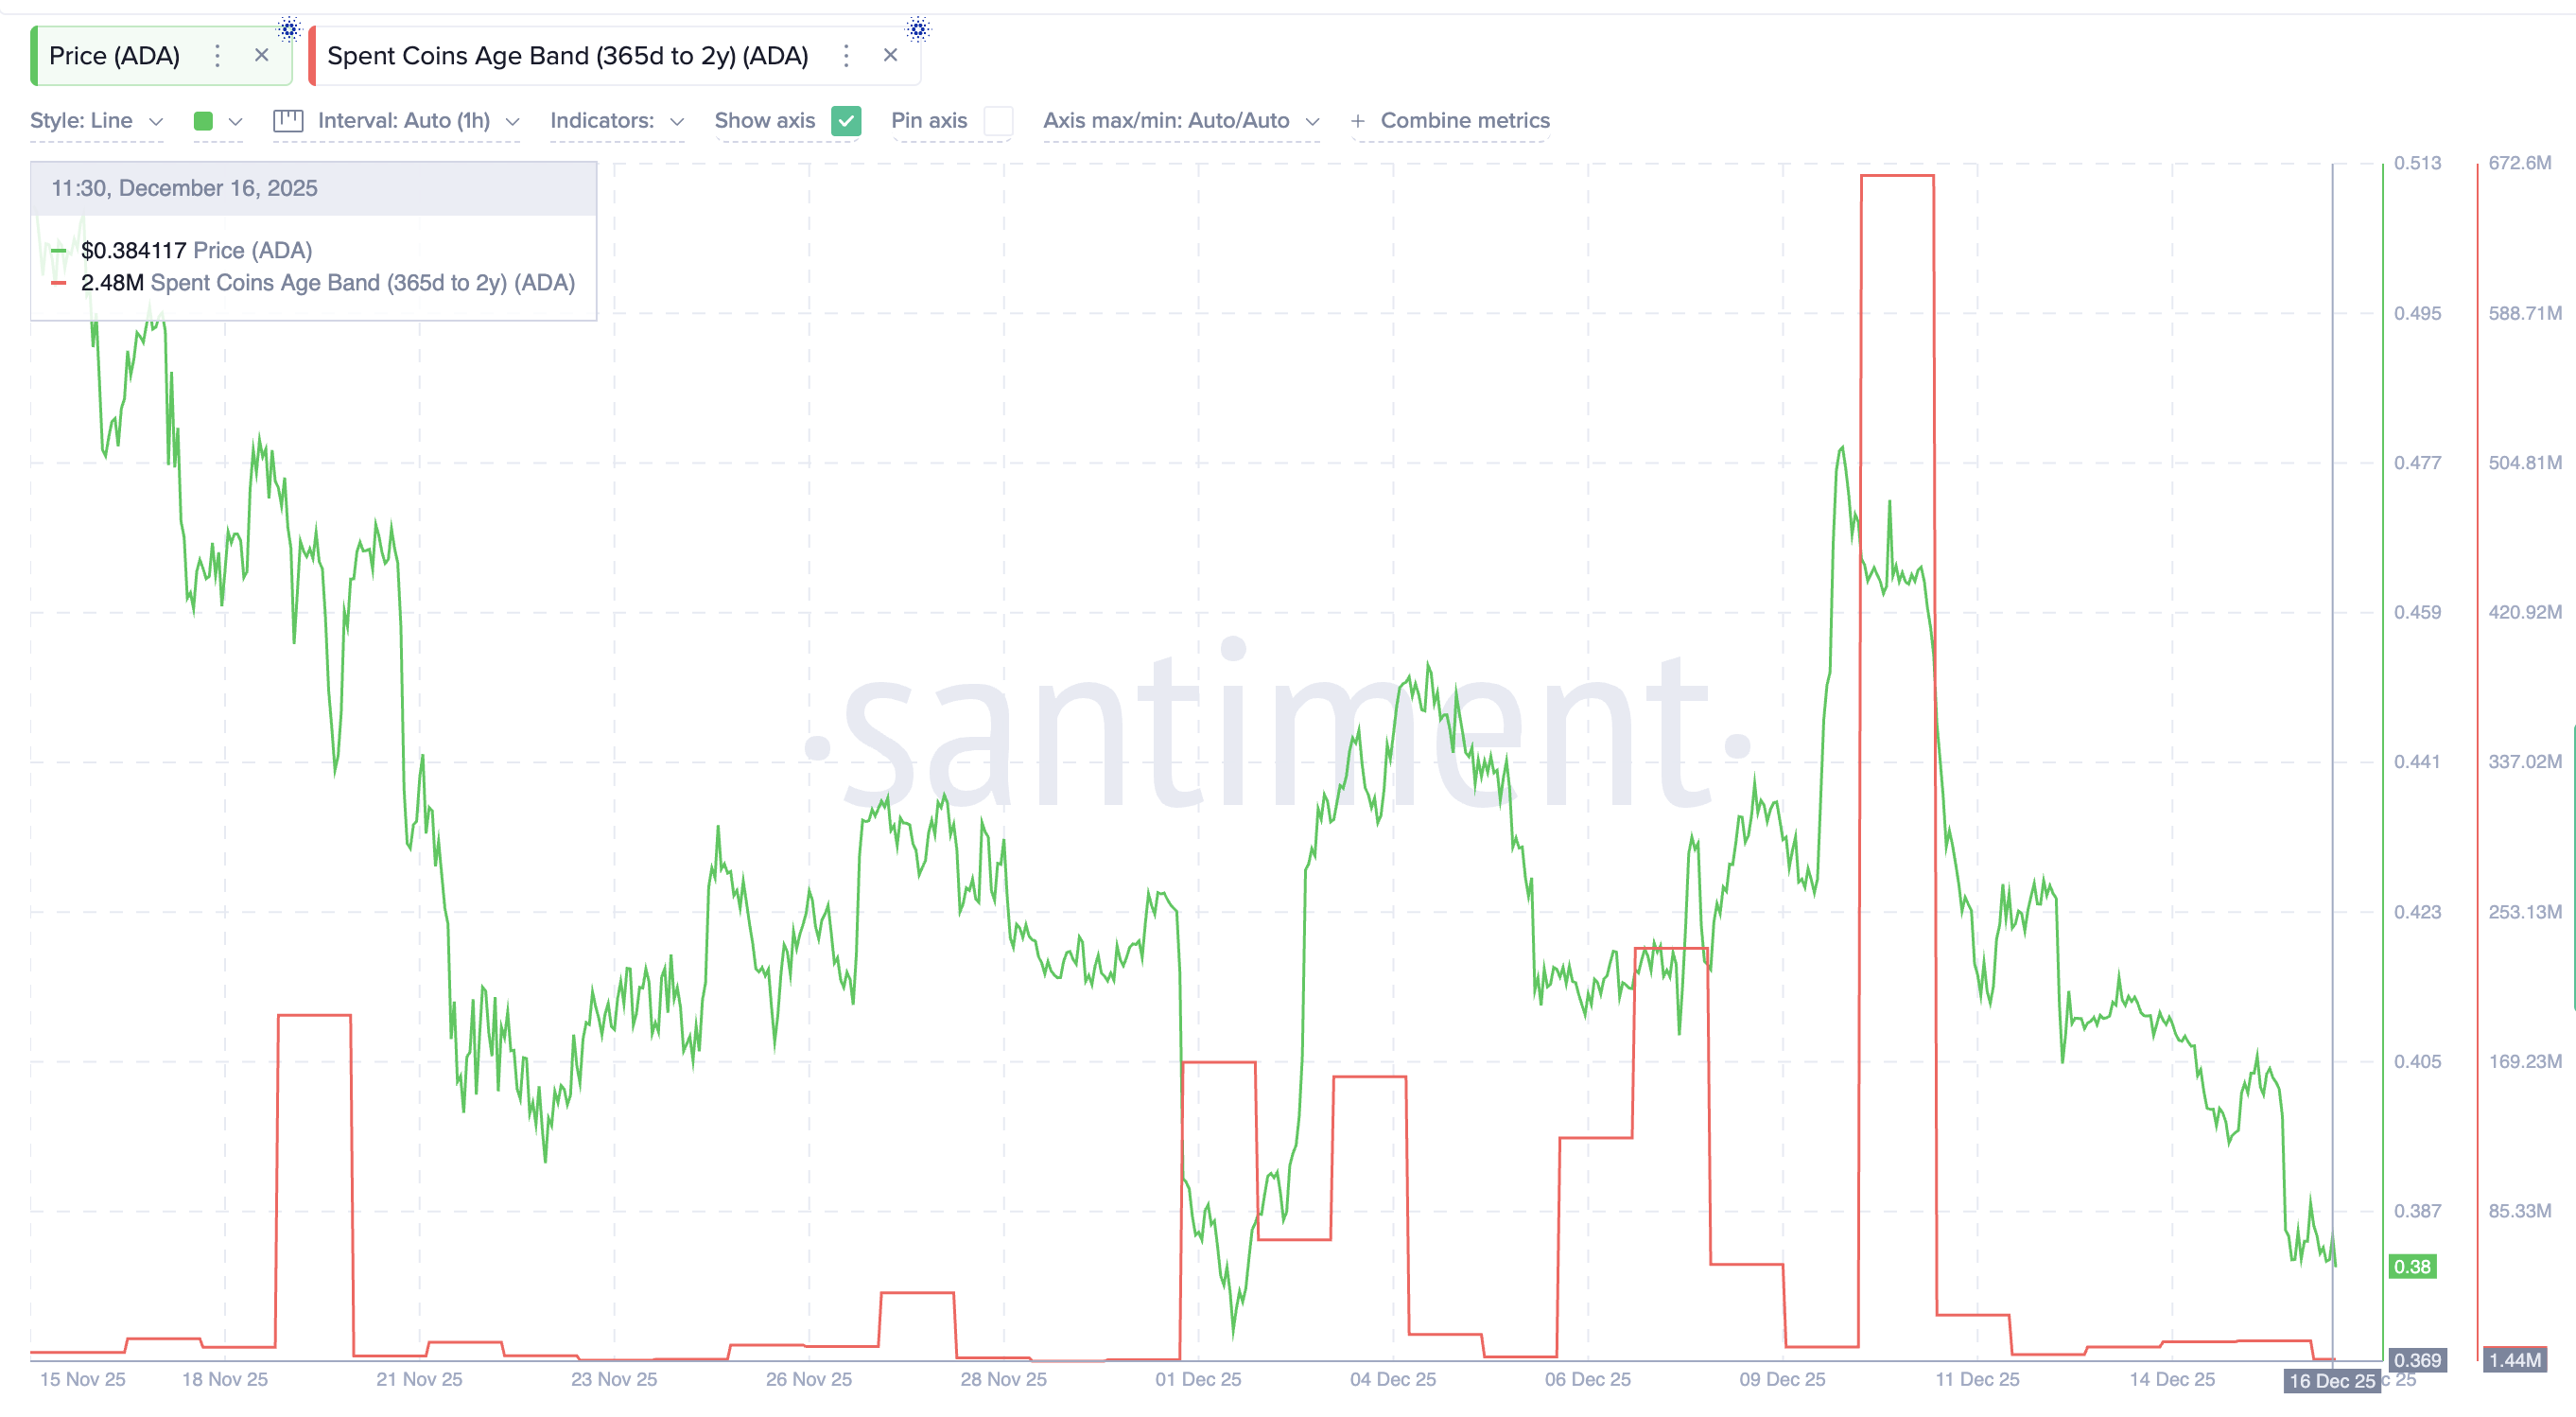
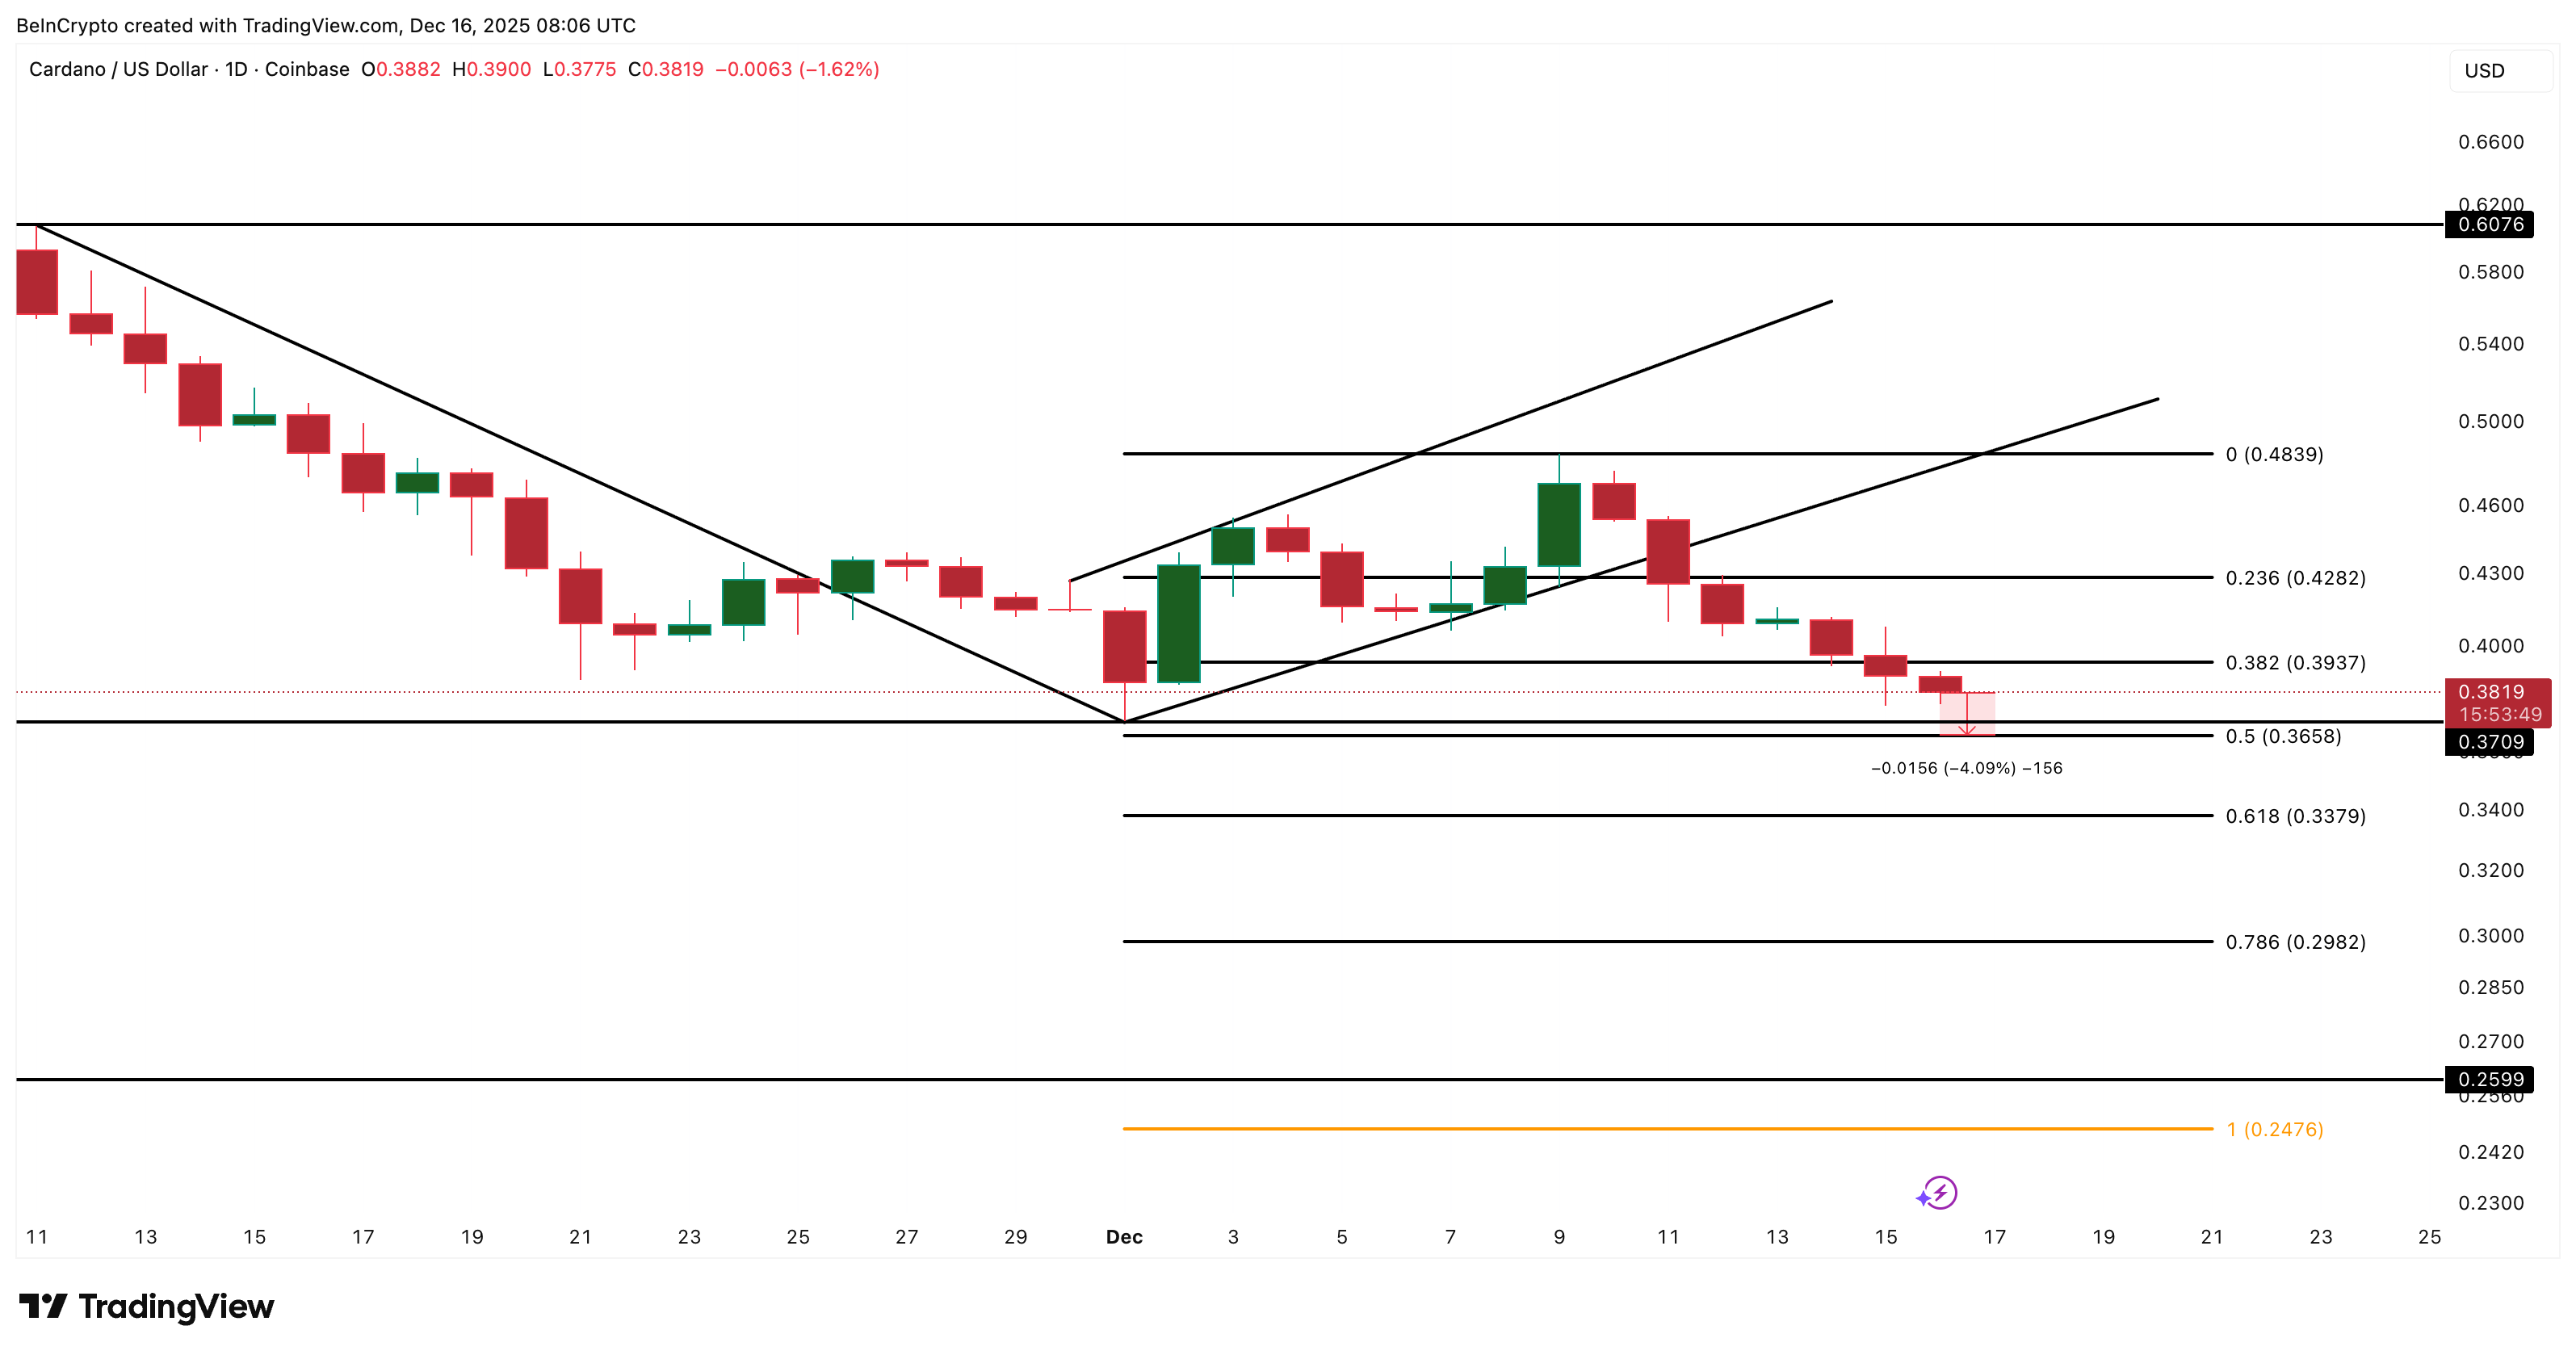
Investor interest is driven by NIGHT’s development ties to Charles Hoskinson and the Cardano ecosystem through the Midnight blockchain. The token now exceeds a $1 billion market cap. Trading near $0.064, NIGHT could break $0.065 and $0.075, targeting the $0.088 all-time high.

Want more token insights like this? Sign up for Editor Harsh Notariya’s Daily Crypto Newsletter here.

NIGHT Price Analysis.
NIGHT Price Analysis. Source: TradingView

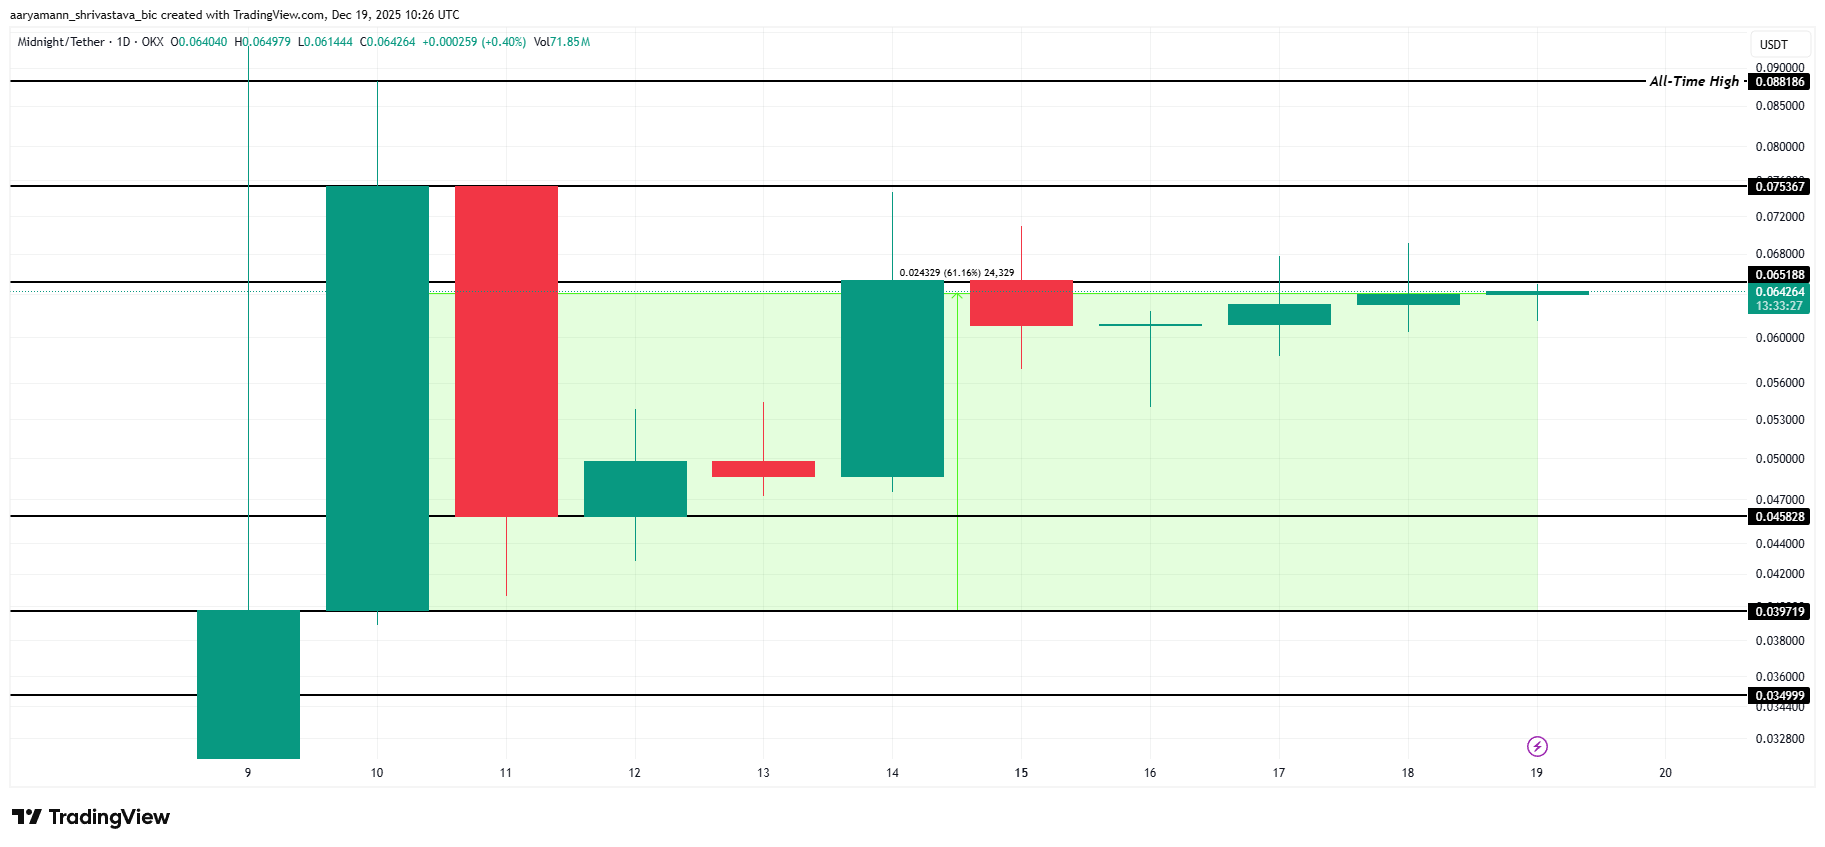
Downside risks remain elevated for a newly launched token. Premature profit-taking could reverse momentum quickly. If selling pressure increases, NIGHT may fall toward $0.045. Such a move would erase recent gains, invalidate the bullish thesis, and increase short-term volatility.
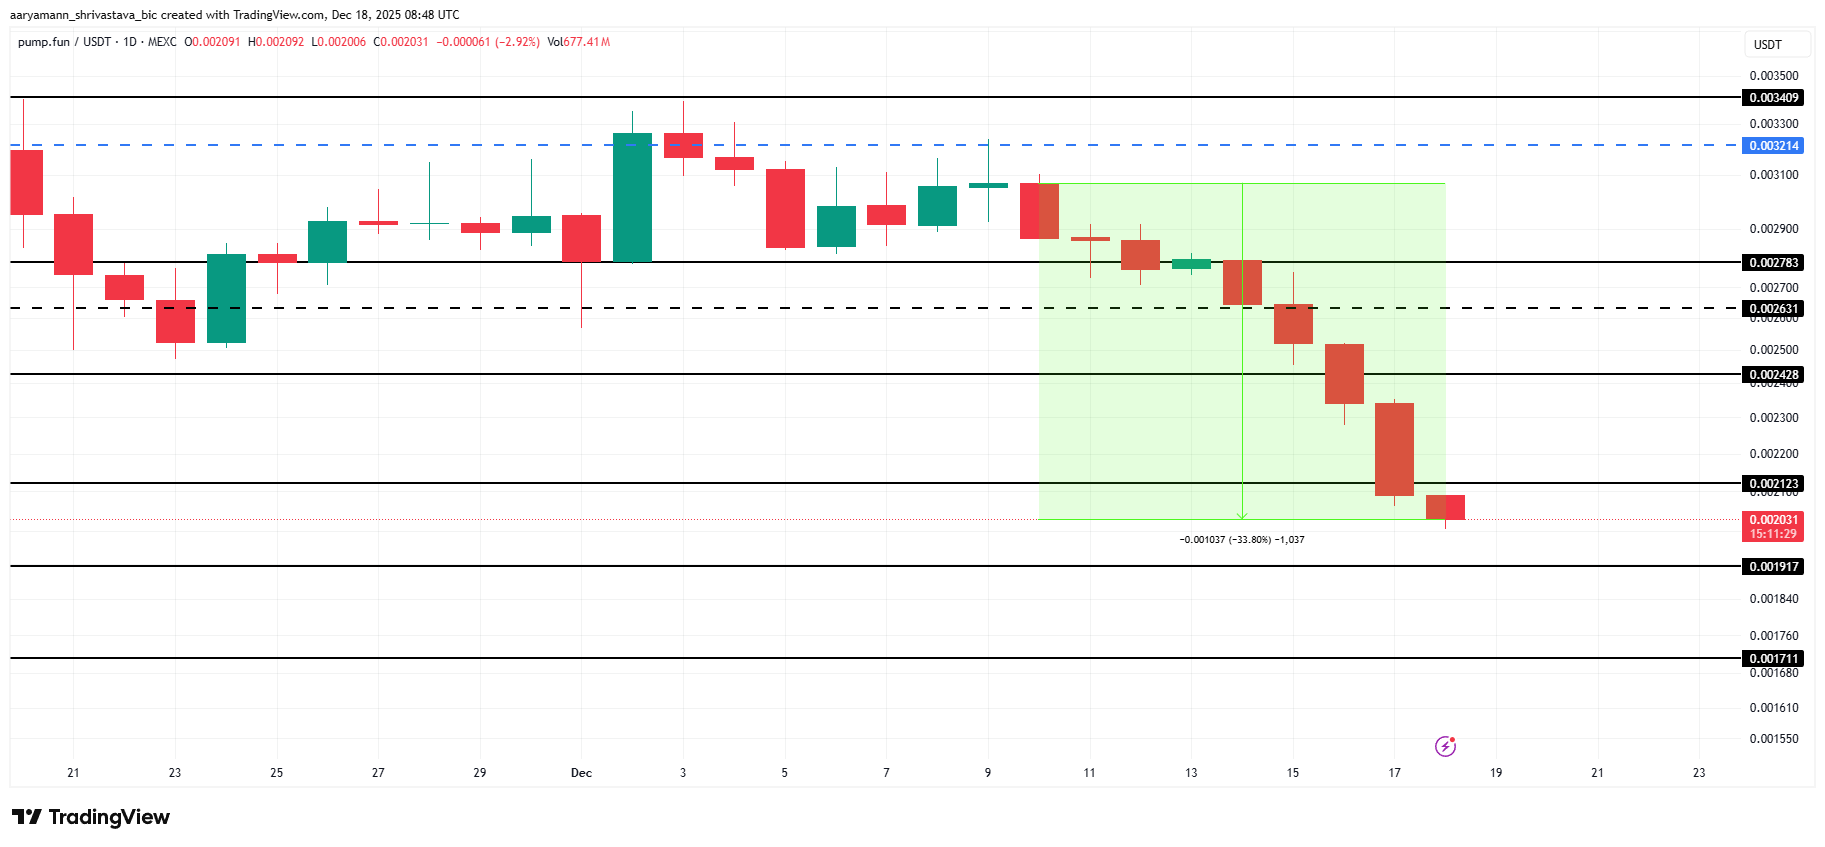
Pump.fun (PUMP)

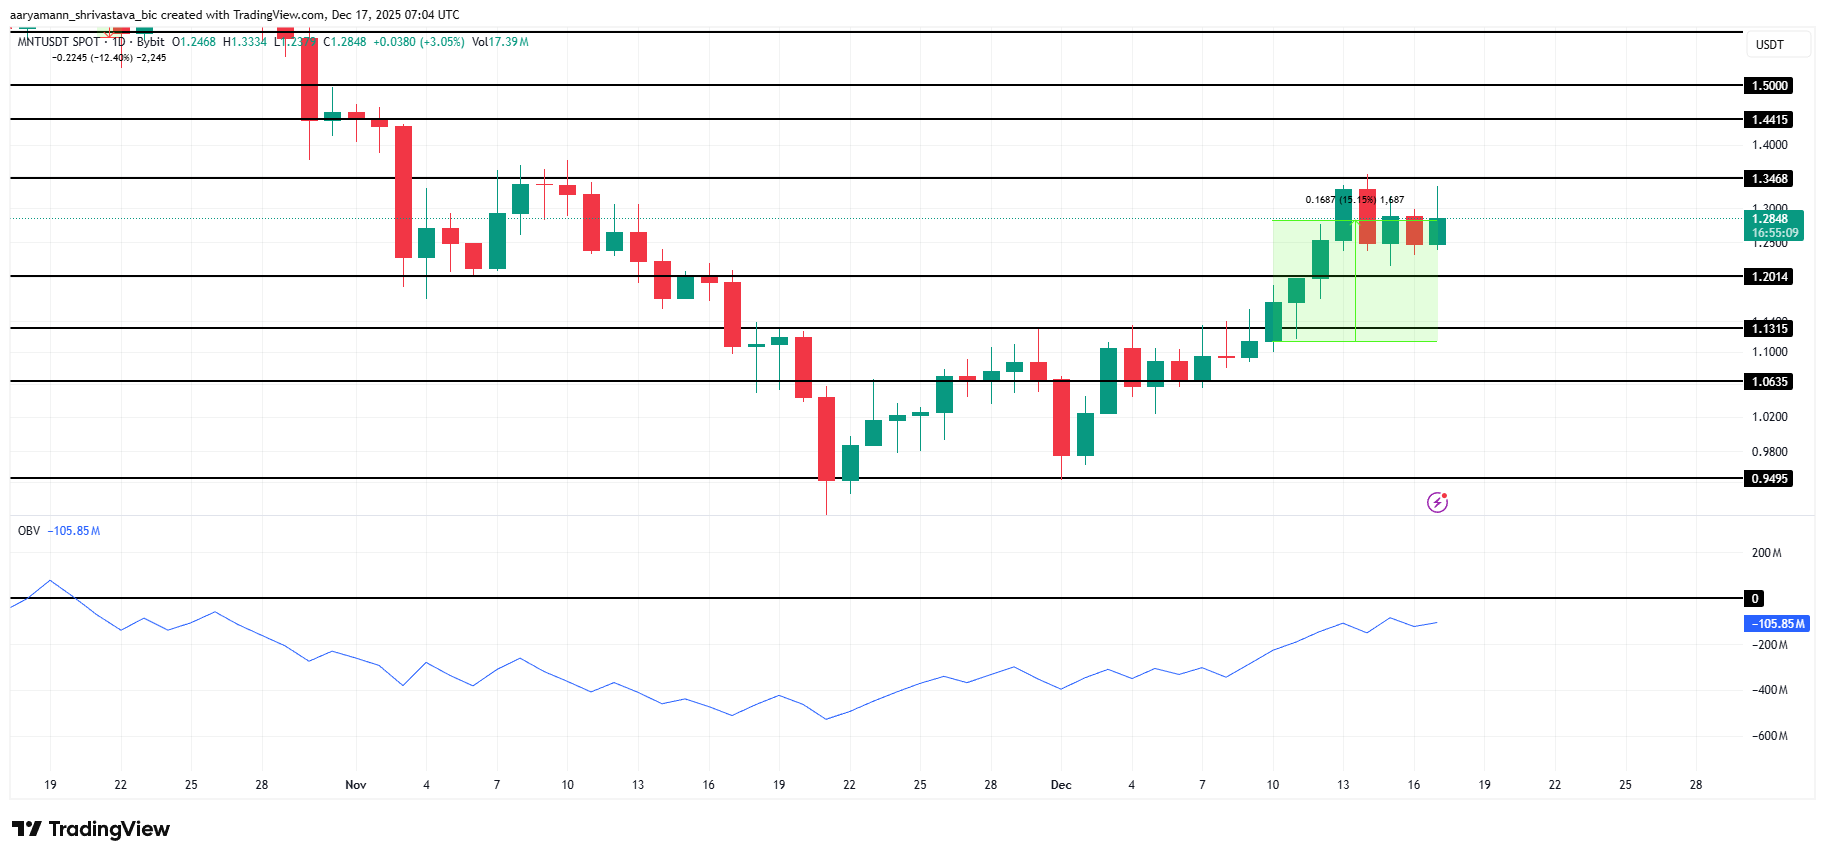
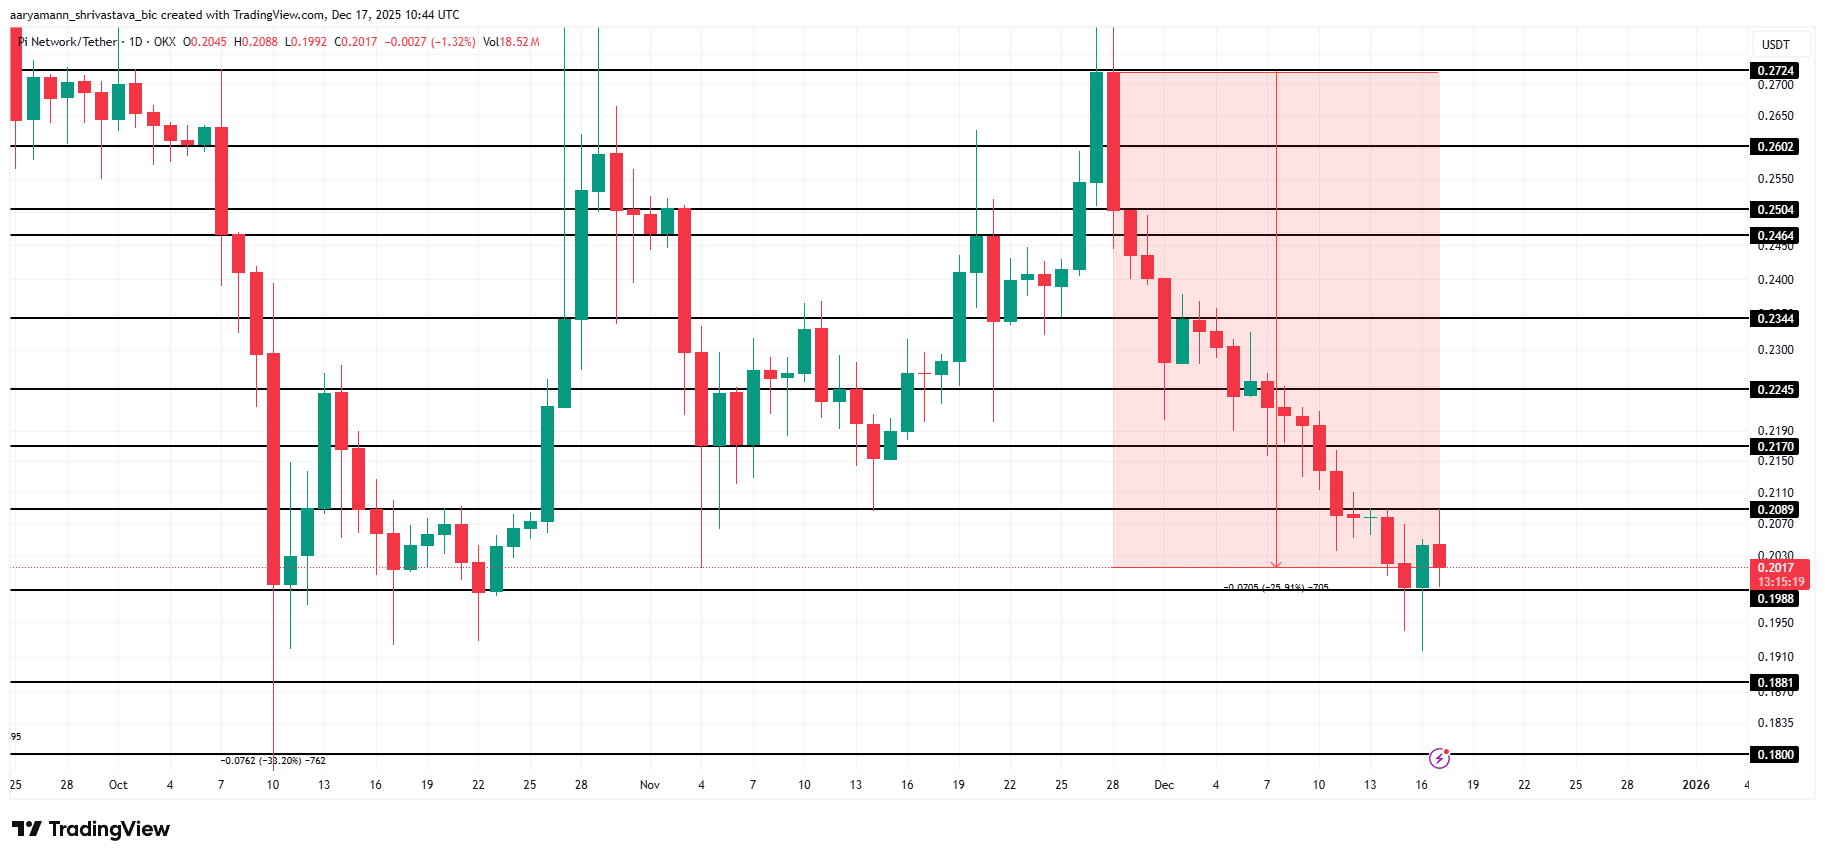
PUMP has moved opposite to NIGHT, ranking among the worst-performing altcoins this week. The token has fallen more than 35%, trading near $0.00197. Persistent selling pressure reflects weak sentiment, as investors continue reducing exposure amid broader market uncertainty.

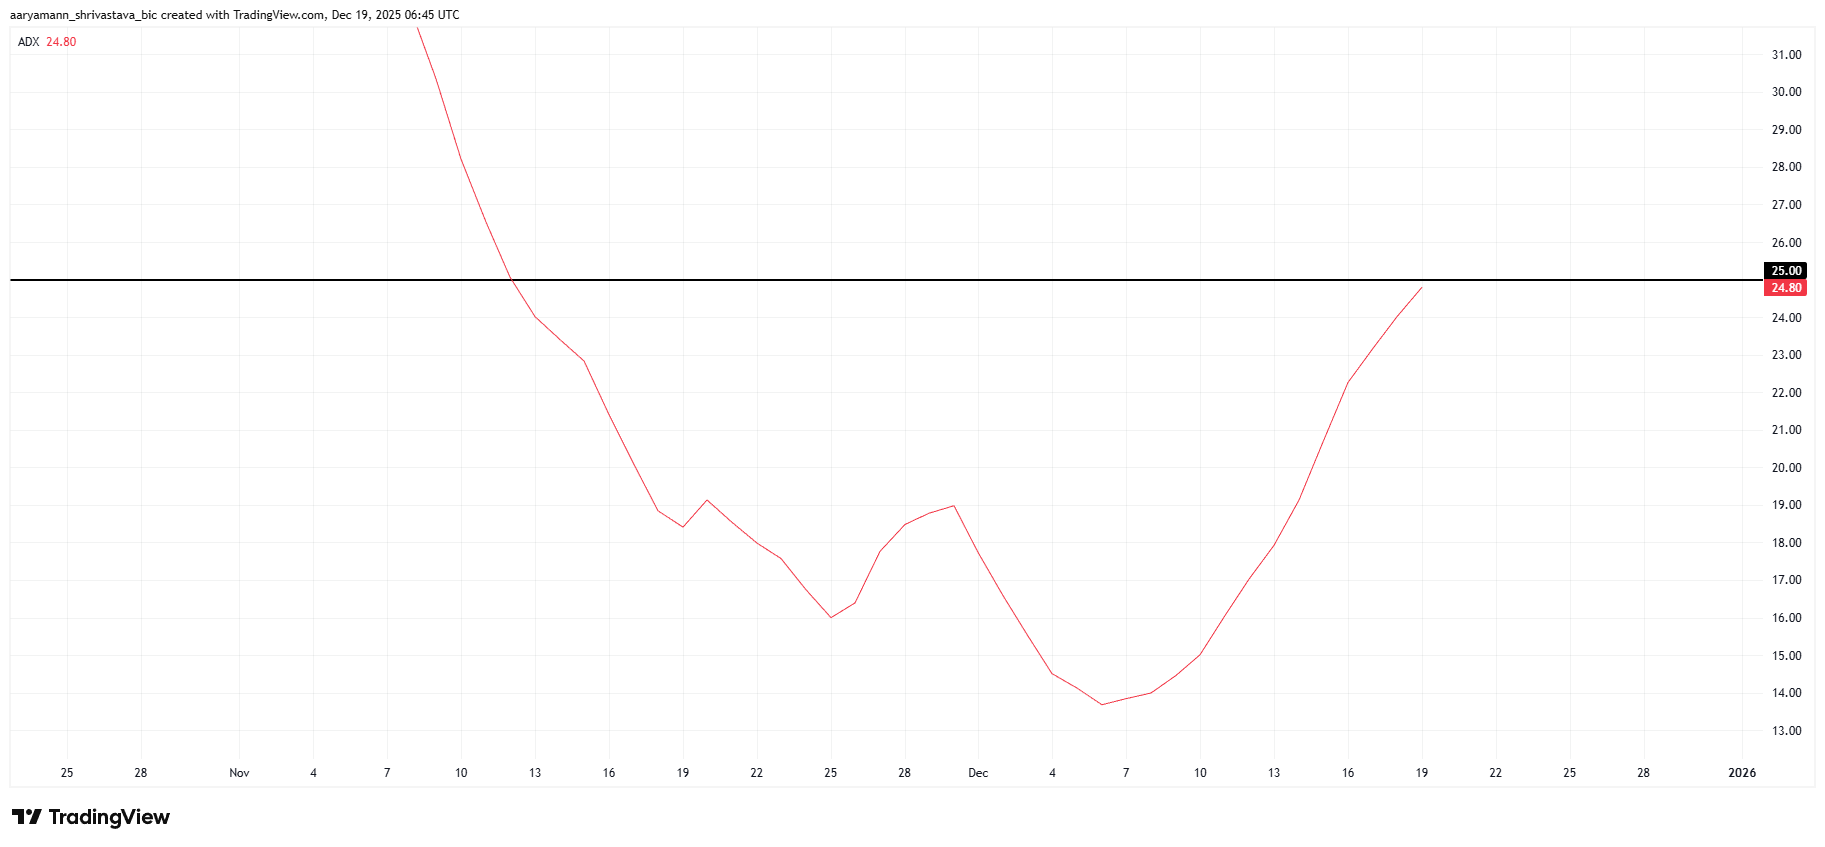
Despite losses, technical indicators offer a potential rebound signal. The relative strength index has entered oversold territory, suggesting selling pressure may be exhausting. If buyers step in, PUMP could rebound above $0.00212 and extend gains toward the $0.00242 resistance level.

PUMP Price Analysis.
PUMP Price Analysis. Source: TradingView

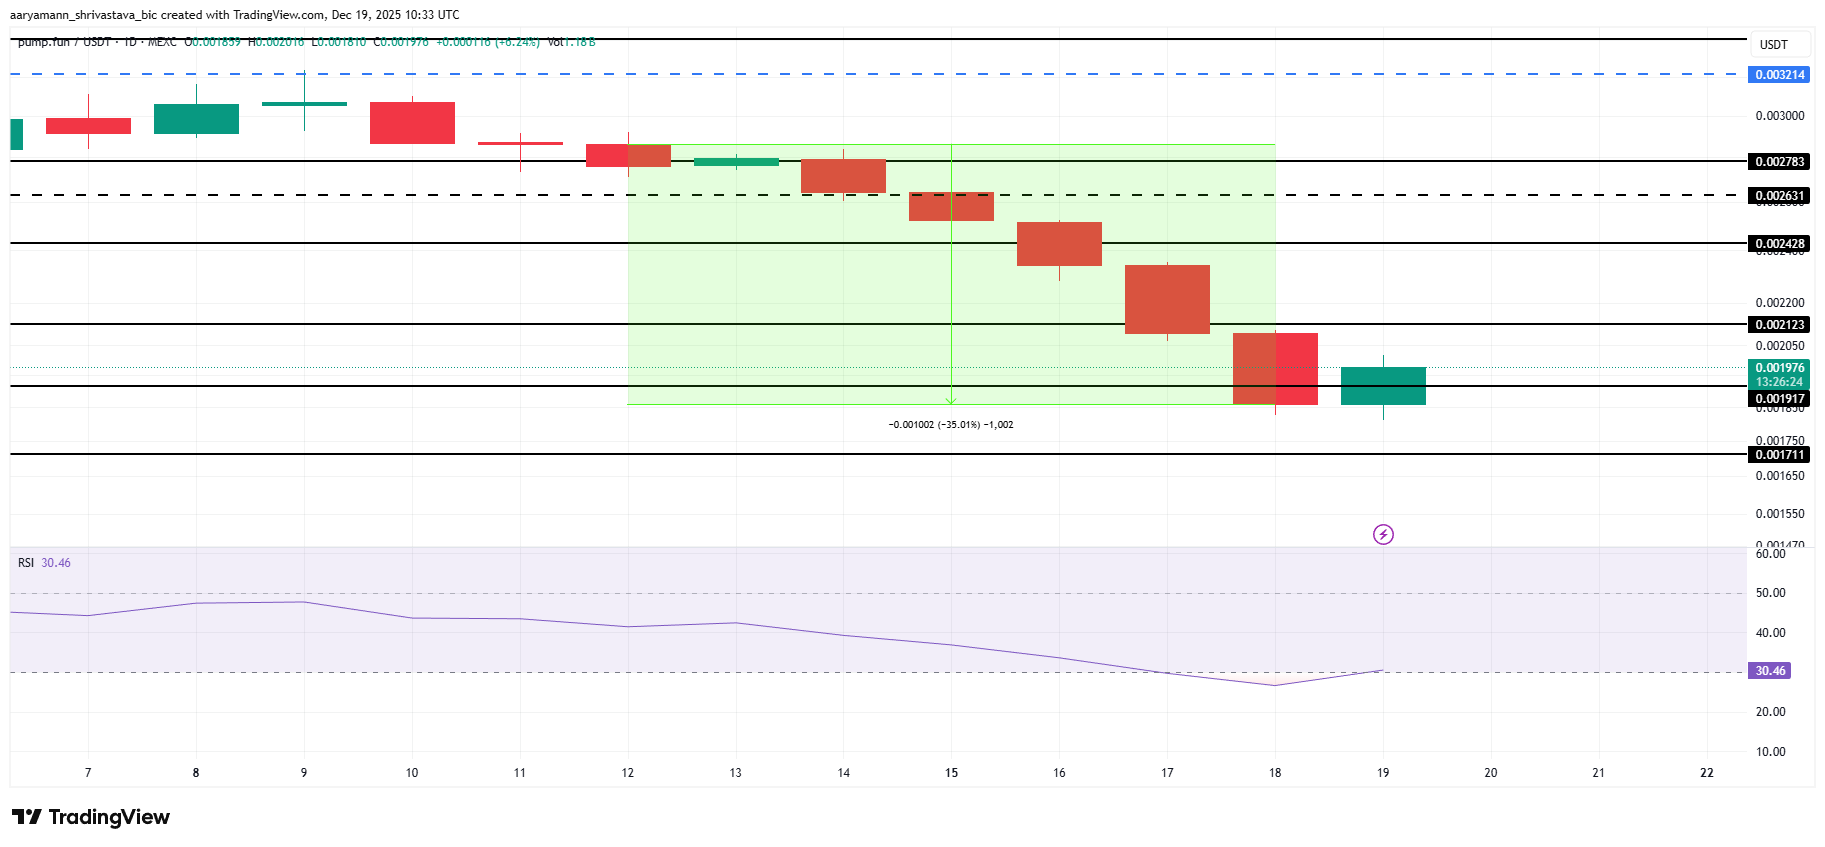
The recovery scenario remains fragile. Failure to attract buying interest could extend losses. A breakdown below current levels may send PUMP toward the $0.00171 support. Such a move would invalidate the bullish outlook and reinforce continued downside risk.
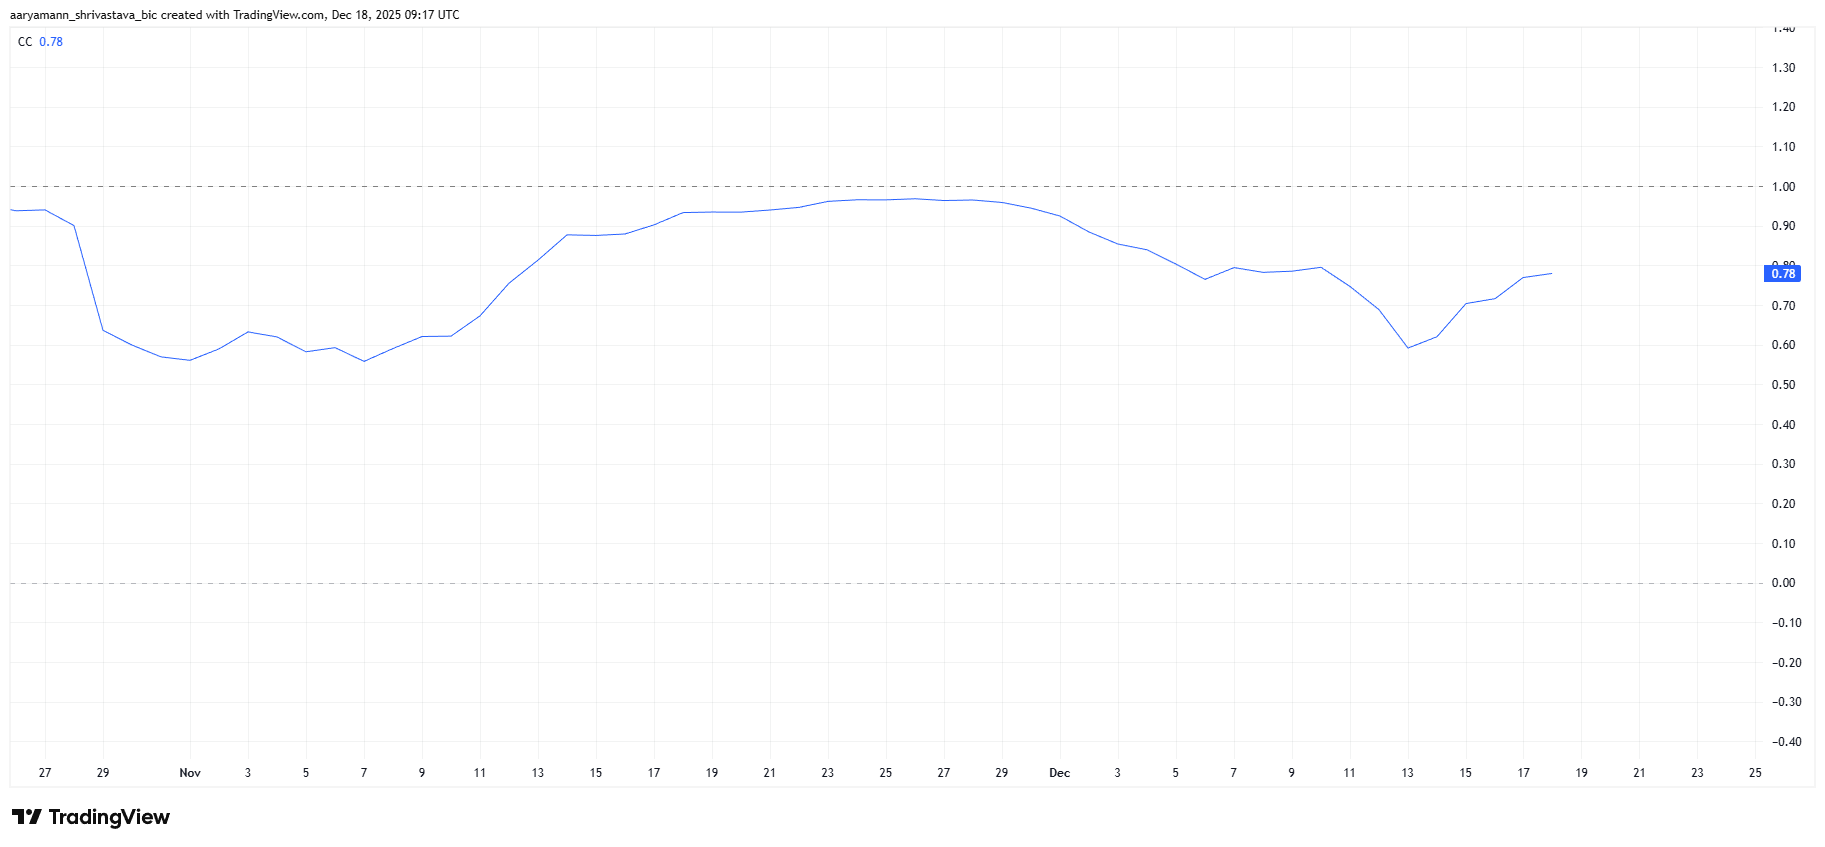
Bitcoin Cash (BCH)

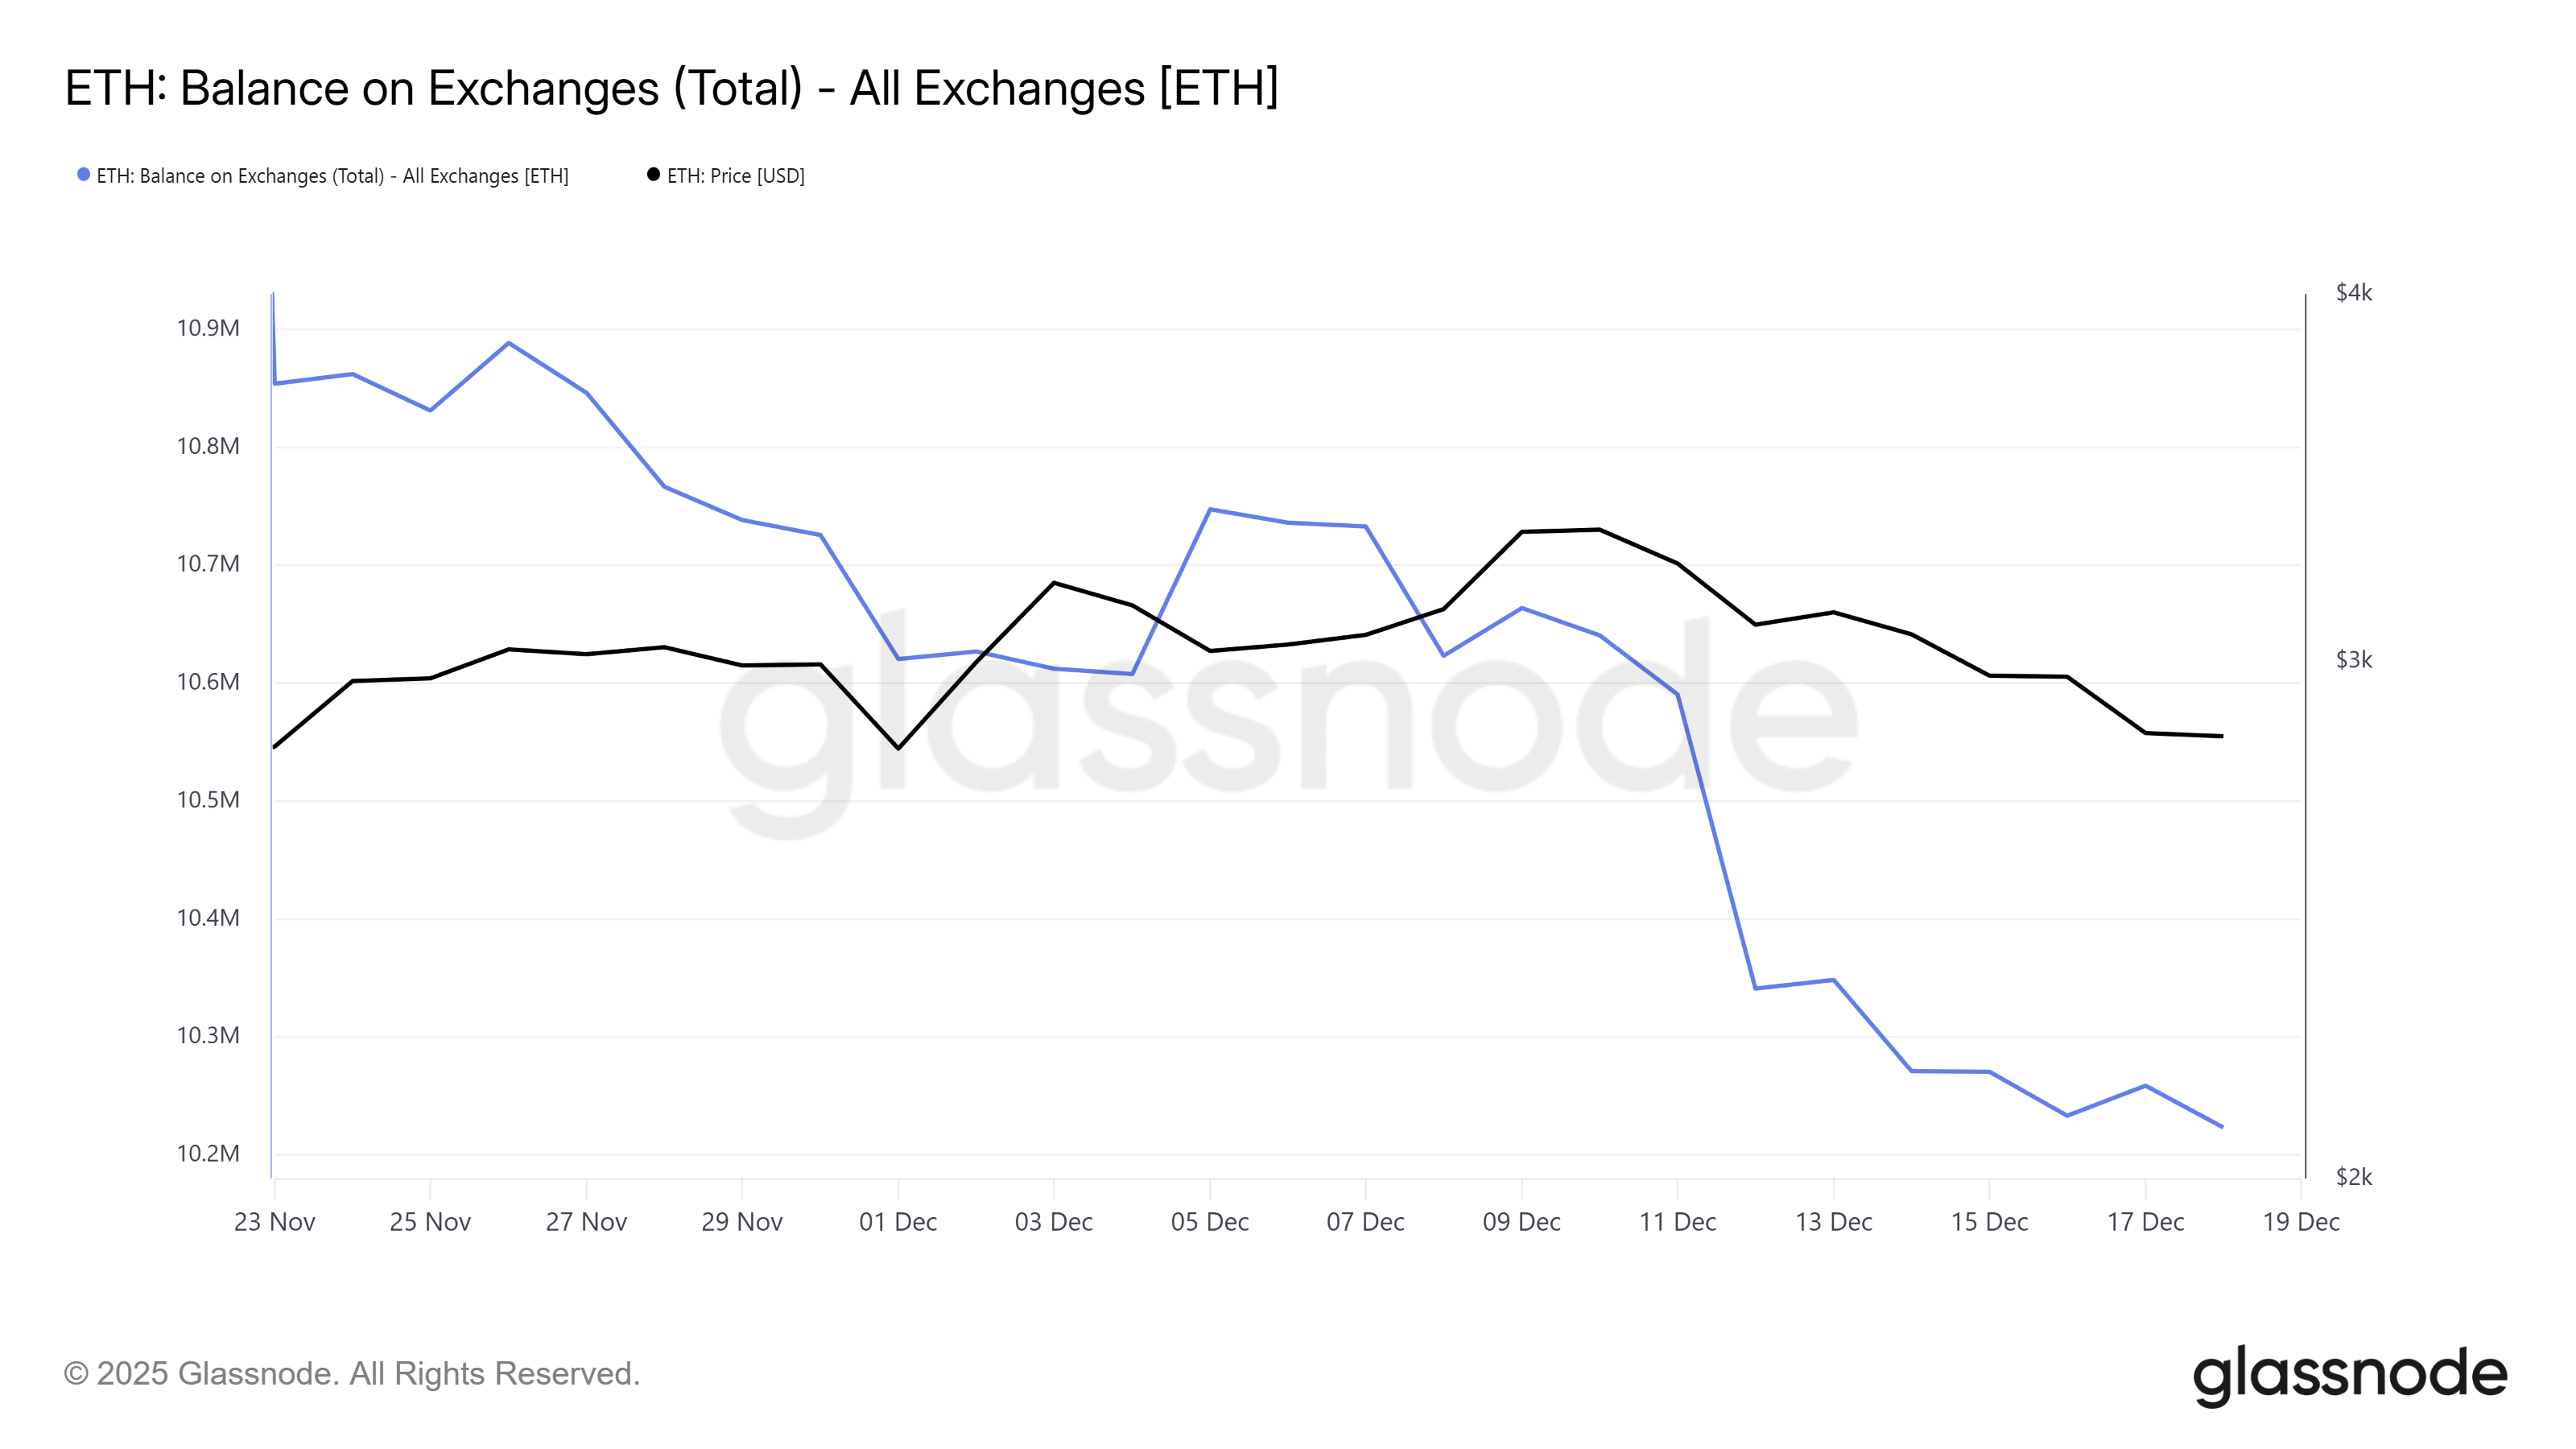
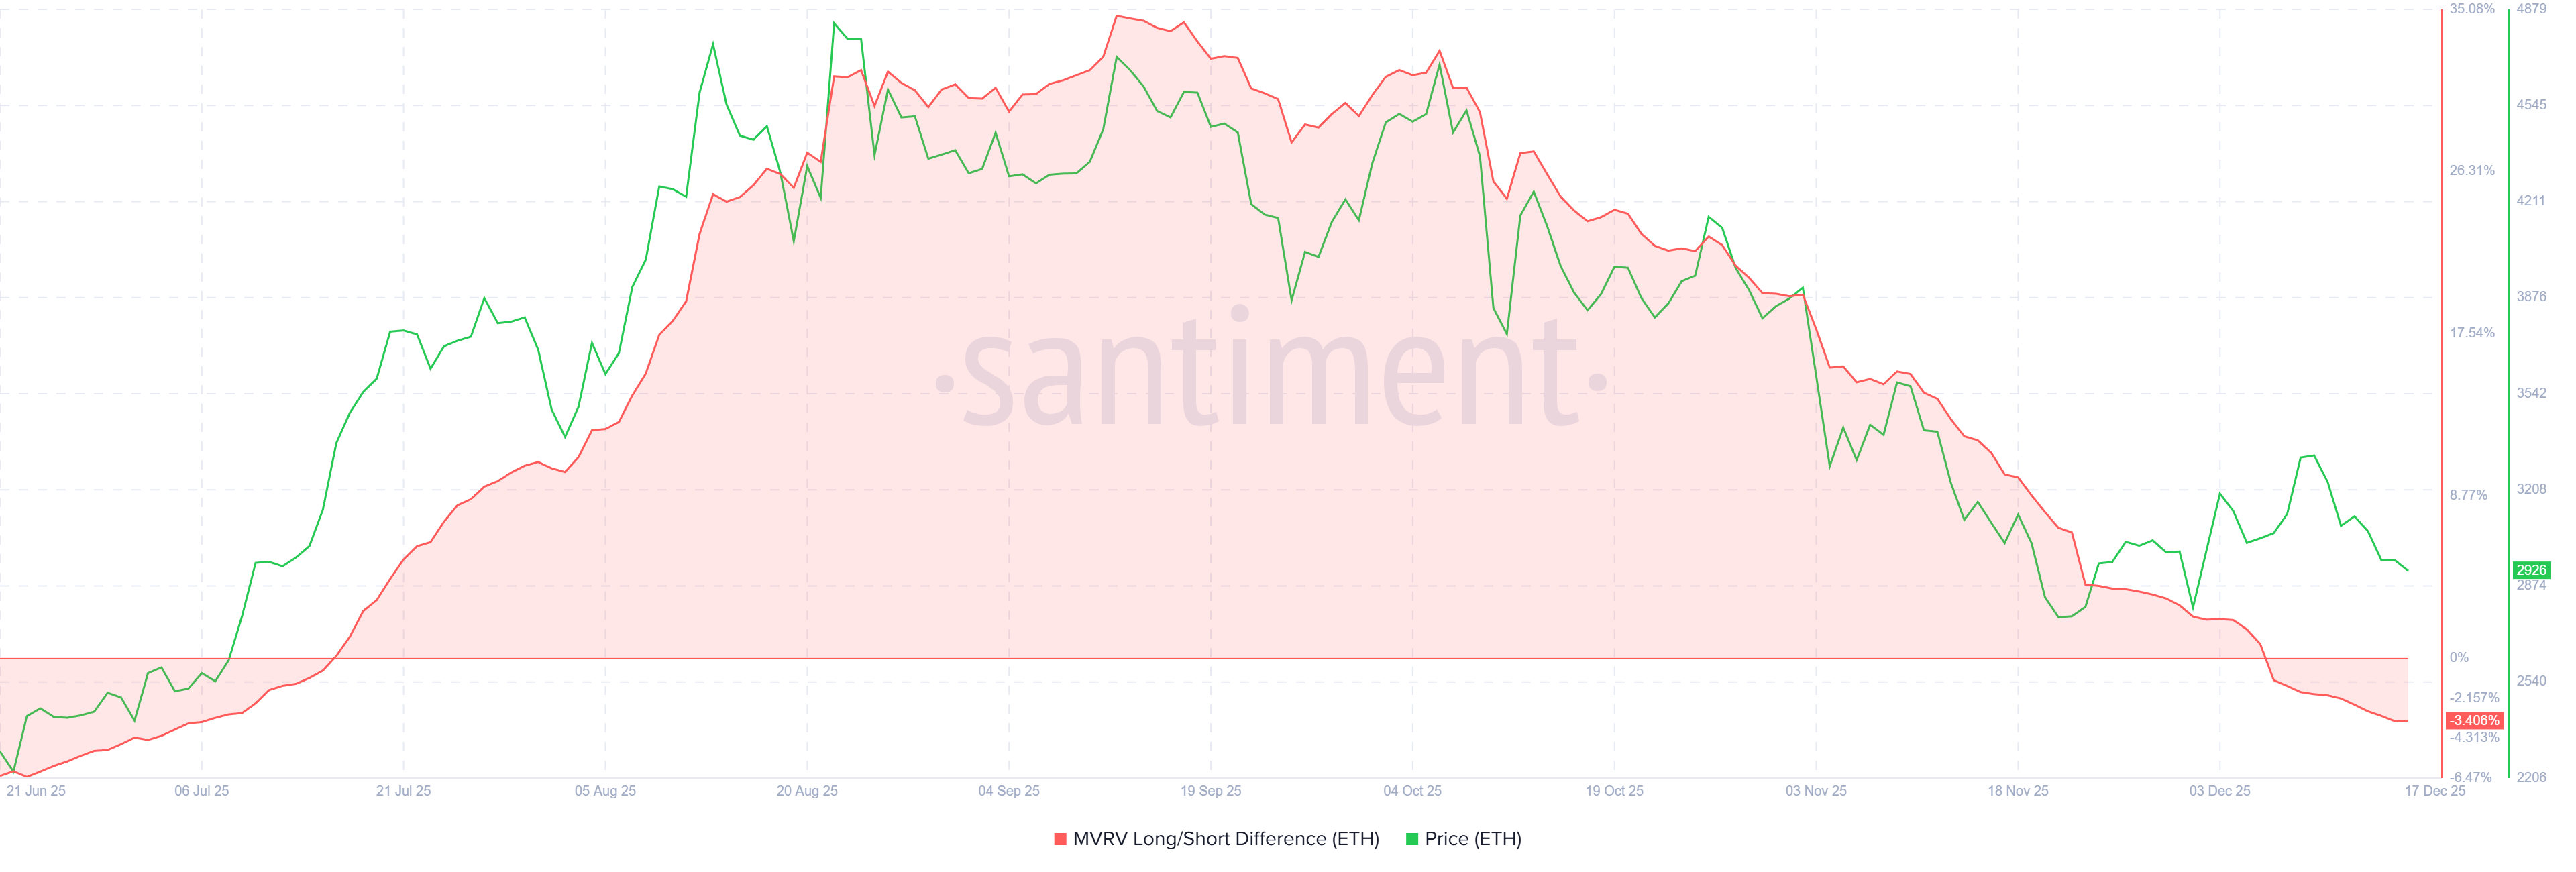
Bitcoin Cash jumped 8% today on asset-specific activity rather than broader Bitcoin moves. The rally followed speculation surrounding ShapeShift founder Erik Voorhees swapping 4,619 ETH, valued at $13.42 million, for 24,950 BCH from a wallet inactive for nine years, reigniting market interest.

However, Erik Voorhees confirmed that the wallet did not belong to him, nor does he own any BCH. Nevertheless, the rally ignited by the speculation may likely extend into the weekend.

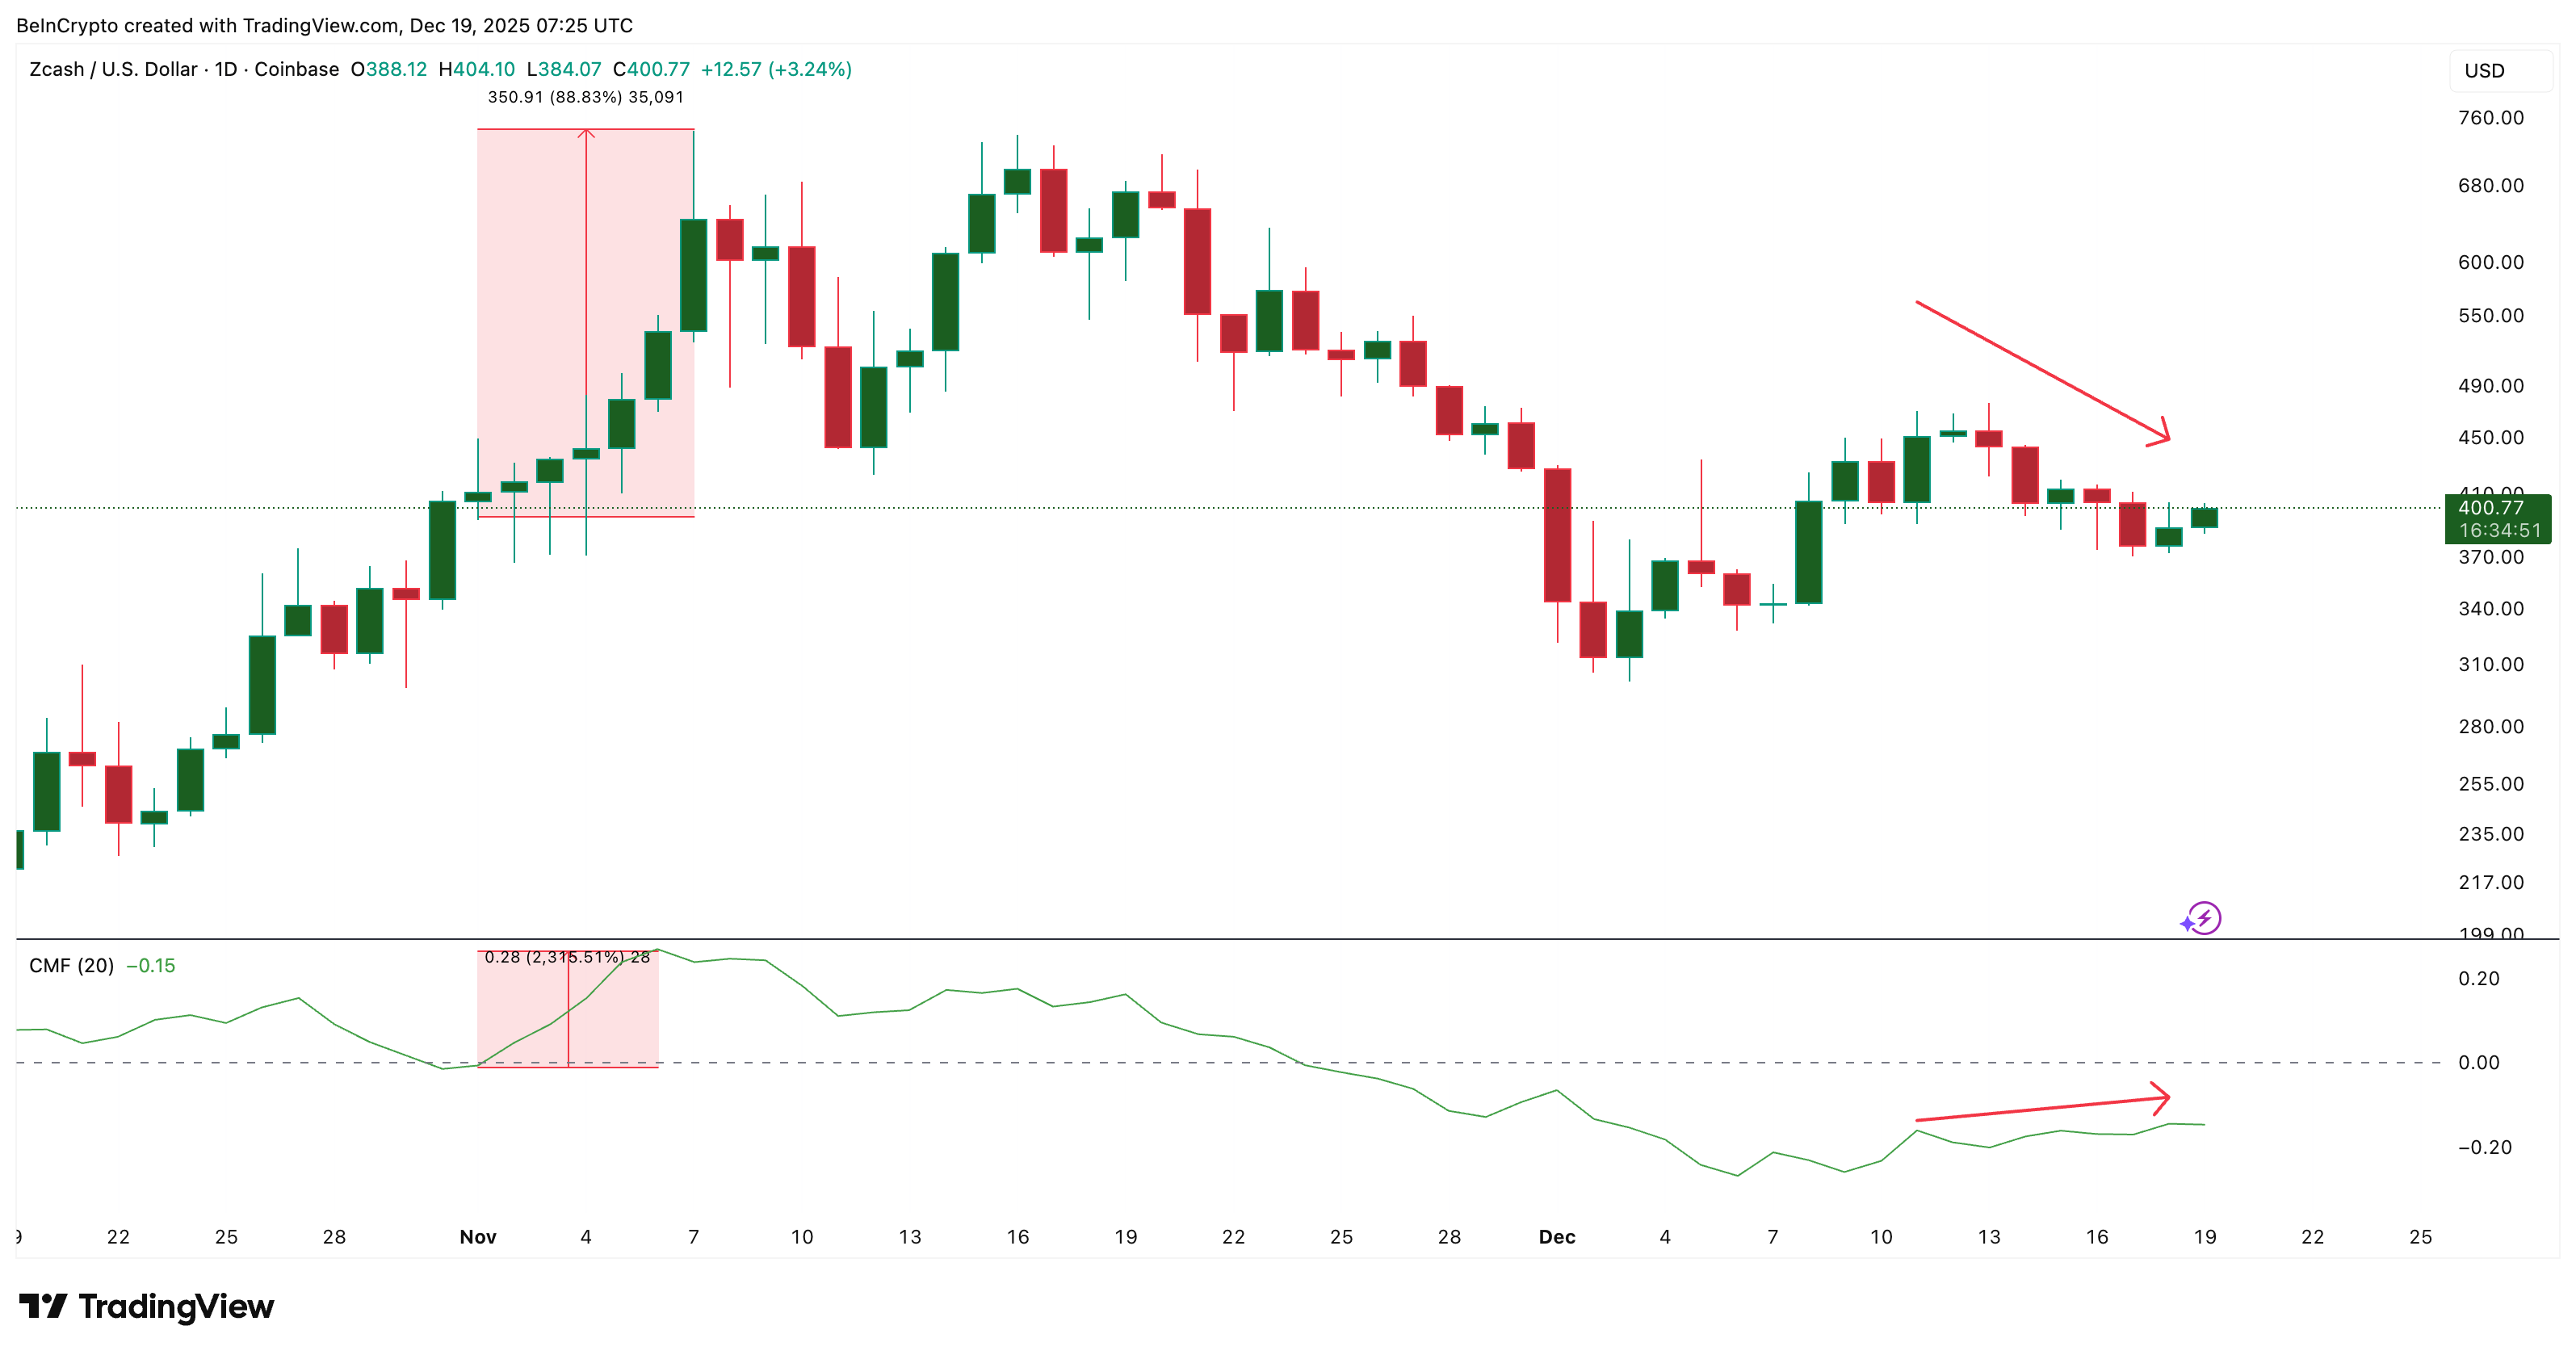
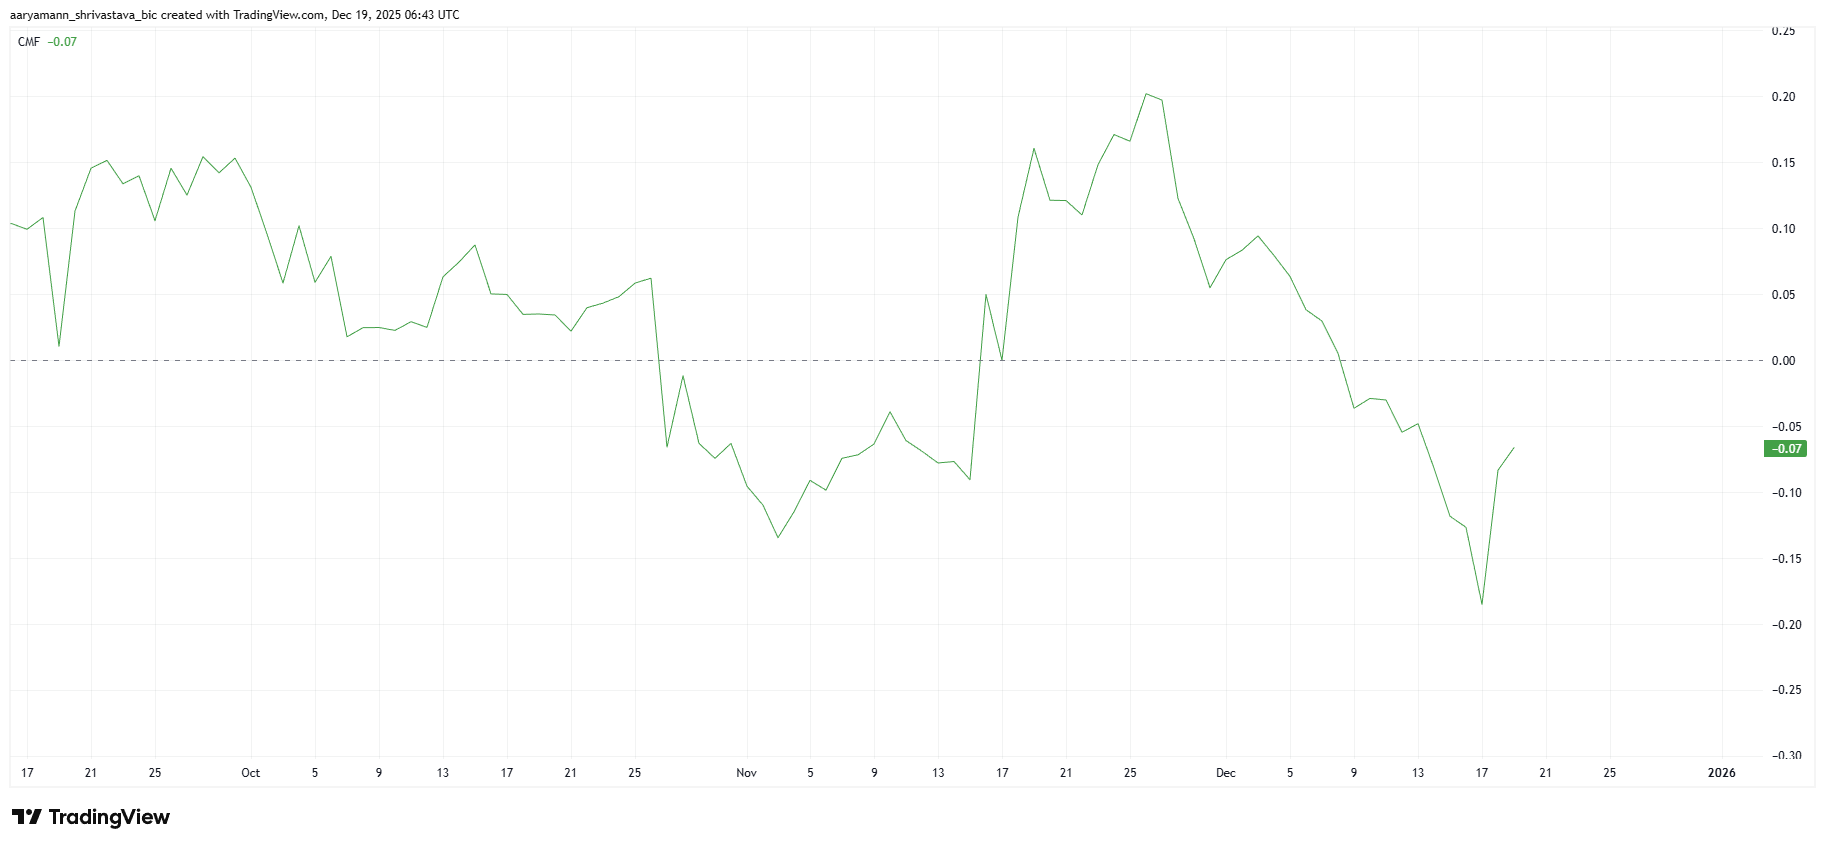
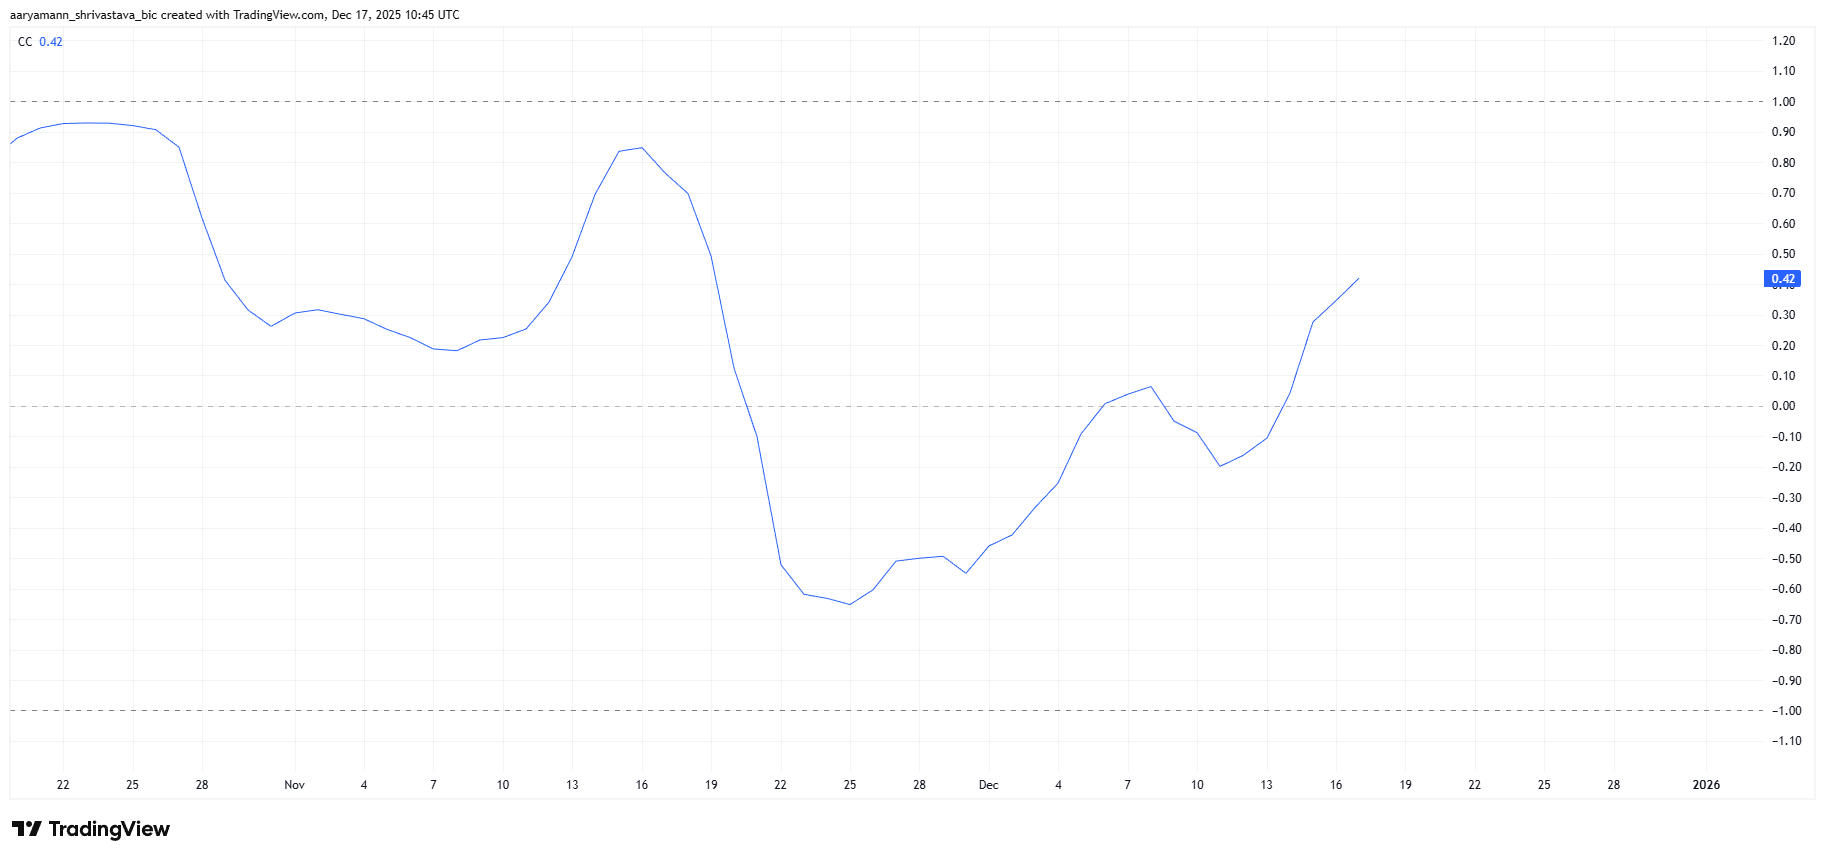
Continued investor inflows, confirmed by a rising Chaikin Money Flow, support the upside case. If demand holds, BCH could break above $593 and advance toward $624, signaling short-term recovery strength driven by renewed confidence.

BCH Price Analysis.
BCH Price Analysis. Source: TradingView

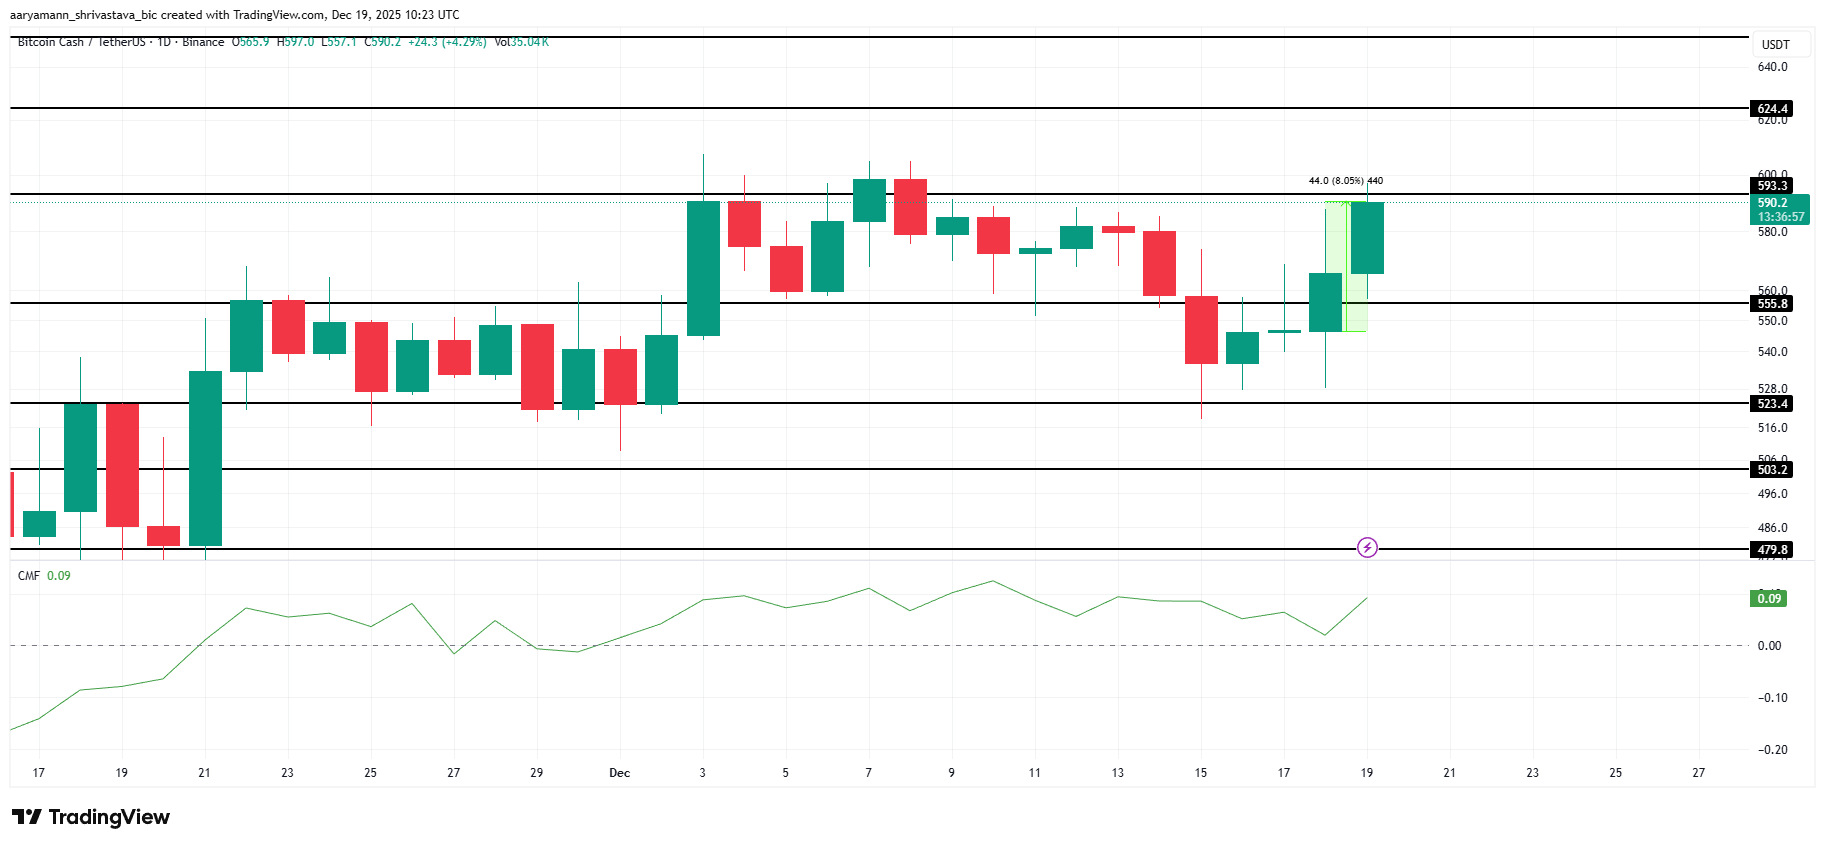
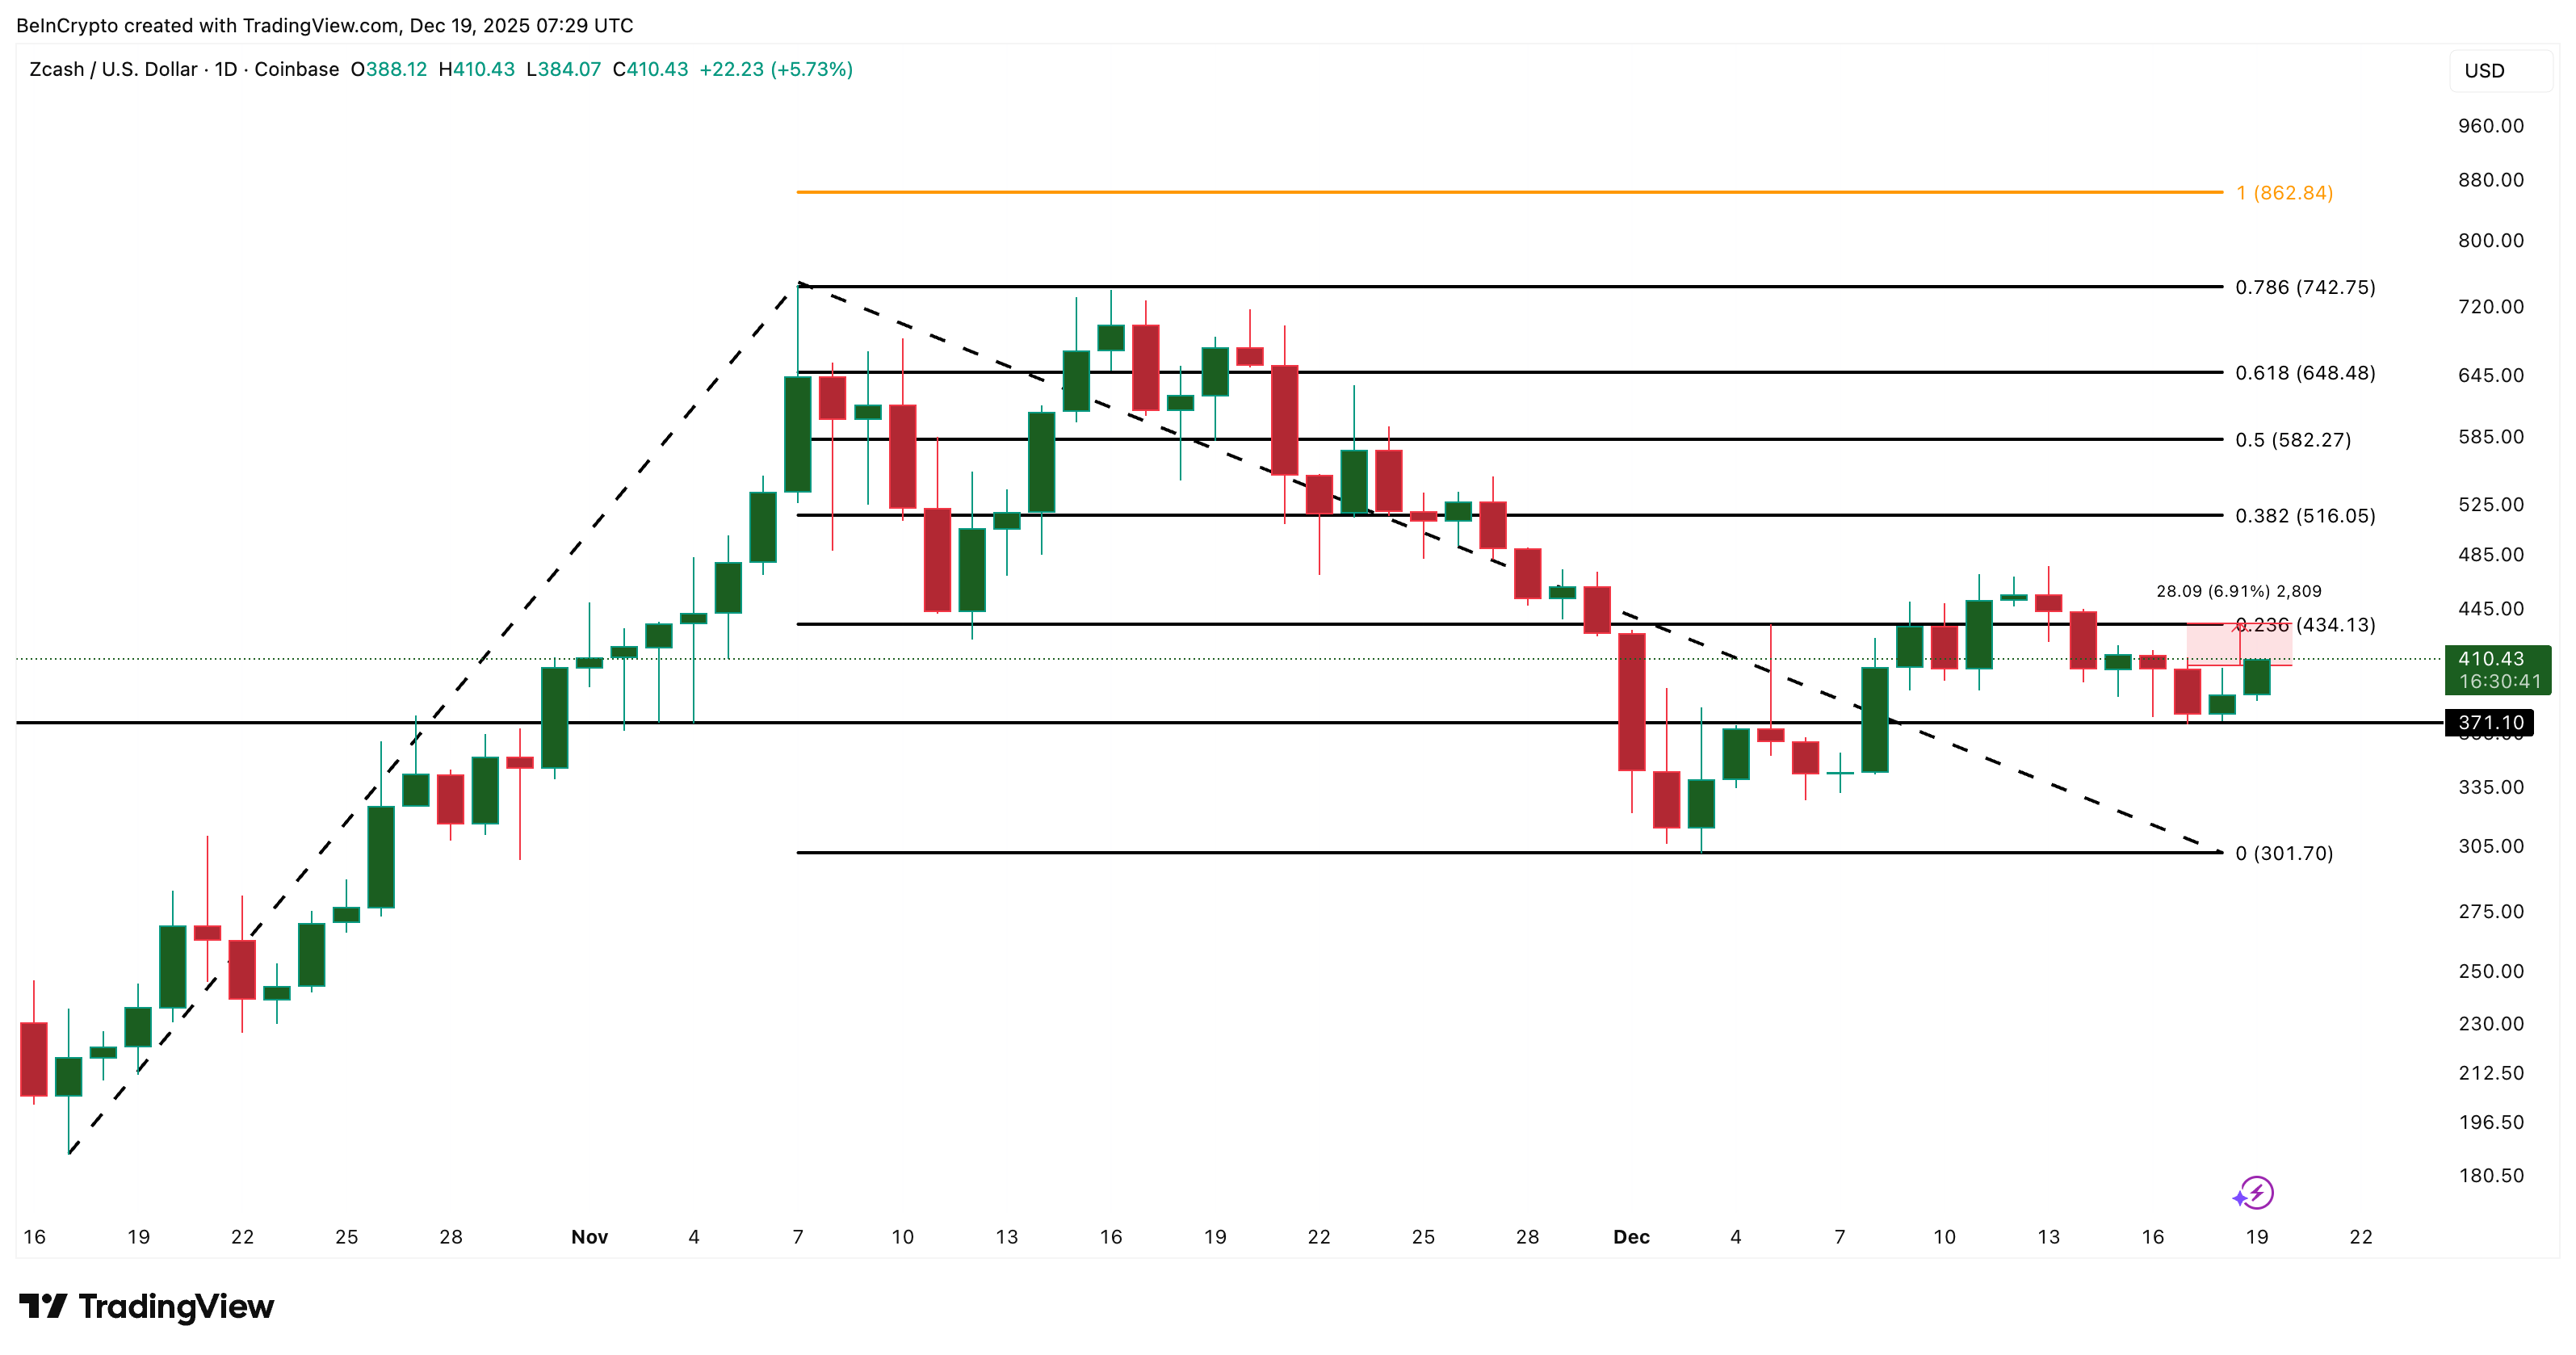
Downside risks persist if momentum fades. Failure to reclaim $593 could keep Bitcoin Cash capped below $600. In that scenario, weakening demand may pull BCH toward $555 or lower, reinforcing consolidation and invalidating the near-term bullish outlook.

The post 3 Altcoins To Watch This Weekend | December 20 – 21 appeared first on BeInCrypto.

  •  

90% of HBAR Buyers Are Gone — Is Price Breakdown Now the Base Case?

Hedera is moving into a risky zone. Over the past month, buying pressure has dropped by nearly 90%, even as the HBAR price continues to slide. While the broader crypto market is trying to stabilize, Hedera is not seeing the same response, especially on the charts.

Buyers are stepping away instead of buying dips. At this point, a downside break is no longer a low-chance outcome. It is starting to look like the base case.

Spot Buying Has Almost Vanished as Downtrend Stays Intact

The HBAR spot market shows the clearest warning.

In the week ending November 10, Hedera recorded spot outflows of approximately $26.7 million, indicating strong buying as coins moved off exchanges. By the week ending December 15, that number fell to just $2.4 million. That is a collapse of roughly 90% in buying pressure in little more than a month.

Buyers Leaving
Buyers Leaving: Coinglass

This is significant because the price is already trading within a descending channel, a bearish pattern. When buyers disappear during a downtrend, sellers need little force to push the price lower. The market becomes fragile.

The Money Flow Index, or MFI, confirms this weakness. MFI tracks how much money is entering or leaving an asset using both price and volume. In HBAR’s case, MFI has been making lower lows along with price and has now slipped into oversold territory. Instead of bouncing, it keeps trending down.

Want more token insights like this? Sign up for Editor Harsh Notariya’s Daily Crypto Newsletter here.

No Dip Buying Visible
No Dip Buying Visible: TradingView

That indicates that dips are not being bought, suggesting minimal price-specific conviction.

Why the HBAR Price Breakdown Scenario Is Gaining Weight

With weak spot demand and falling money flow, the HBAR price action becomes the final judge.

HBAR is sitting near the lower boundary of its descending channel. The first key level to watch is $0.106. If price loses this level on a daily close, the next downside target comes in near $0.095, which is about 12% lower than current levels. Reaching there would mean a confirmed bearish breakdown, bringing even $0.078 into the mix.

That move would confirm continuation of the downtrend rather than a temporary dip.

HBAR Price Analysis
HBAR Price Analysis: TradingView

For the bearish case to break, HBAR would need a major shift. Price would have to reclaim several resistance zones and close near $0.155. Given the collapse in spot buying and the persistence of weak MFI, that outcome appears unlikely at present.

The conclusion is straightforward. With buyers largely gone, money flow falling, and price already trapped in a bearish structure, a breakdown is no longer just a risk. For now, it is the base case, or rather a likely outcome.

The post 90% of HBAR Buyers Are Gone — Is Price Breakdown Now the Base Case? appeared first on BeInCrypto.

  •  

Ethereum Outshines Bitcoin Even As Price Remains Stuck Under $3,000

Ethereum continues to struggle with price recovery as it repeatedly fails to close above the $3,000 level. ETH has shown brief upside attempts, only to retreat under selling pressure. 

While price action remains frustrating for holders, underlying network data points to strengthening fundamentals that may support future recovery.

Ethereum Holders Are Staying

Ethereum leads all major cryptocurrencies in non-empty wallet count. The network hosts more than 167.9 million active addresses holding balances. Bitcoin, by comparison, has about 57.62 million. Other top-cap assets trail significantly behind both networks.

This dominance highlights Ethereum’s broad user base and diverse use cases. Decentralized finance, NFTs, and smart contract activity continue to drive engagement. Strong participation reflects confidence, which plays a critical role in sustaining demand.

Want more token insights like this? Sign up for Editor Harsh Notariya’s Daily Crypto Newsletter here.

Ethereum Holders Data
Ethereum Holders Data. Source: Santiment

Macro indicators further support a constructive outlook. Ethereum balances on centralized exchanges have declined steadily. Since the start of the month, roughly 397,495 ETH have been withdrawn from exchanges, reducing immediate sell-side supply.

These outflows suggest accumulation at current price levels. The withdrawn ETH is valued at over $1.17 billion, signaling confidence among long-term investors. Lower exchange balances often precede reduced selling pressure, which can support price recovery when demand strengthens.

Ethereum Balance on Exchanges
Ethereum Balance on Exchanges. Source: Glassnode

ETH Price Could Breach The Critical Barrier

Ethereum trades near $2,946 at the time of writing, remaining below the psychological $3,000 level. The asset has consistently bounced off the $2,762 support zone over recent weeks. This behavior indicates buyers are defending lower levels despite broader uncertainty.

If supportive trends continue, ETH could attempt another breakout above $3,000. A successful move may open the path toward $3,131. Continued momentum could extend gains toward $3,287, signaling improving confidence among both retail and institutional participants.

ETH Price Analysis.
ETH Price Analysis. Source: TradingView

Risks persist if selling pressure intensifies. A breakdown below $2,762 would weaken the recovery narrative. Losing this support could send Ethereum toward the $2,681 level, marking a four-week low and invalidating the bullish thesis outlined by improving on-chain metrics.

The post Ethereum Outshines Bitcoin Even As Price Remains Stuck Under $3,000 appeared first on BeInCrypto.

  •  

Zcash Price Awaits Direction Despite Arthur Hayes Favoring Its Privacy Model — But Why?

Zcash price has struggled to find a clear direction over the past few weeks, despite being up over 600% in the 3-month window. The token is moving sideways even as other parts of the crypto market attempt small rebounds.

This comes despite fresh attention from a high-profile voice in crypto. In a recent interview, Arthur Hayes spoke positively about Zcash’s design.

Still, the ZEC price action shows hesitation despite the near 4% uptick, day-on-day. Traders are now weighing whether this support matters in the short term or if charts will decide first.

Arthur Hayes Said This About The Privacy Model

Arthur Hayes is the co-founder of BitMEX and a well-known crypto market figure. In a recent interview with Kyle Chasse, Hayes explained why his view on privacy coins has changed over time.

GET ALL THE ALPHAhttps://t.co/BvfWWoPVMr

— Kyle Chassé 🐸 (@Kylechasse) December 18, 2025

He said that while Monero was once seen as the strongest privacy option, new data and upgrades shifted his thinking. Hayes highlighted Zcash’s progress, particularly in shielded transactions and cryptographic improvements.

“That’s one of the reasons why I moved from the Monero camp into the Zcash camp when we talk about privacy coins,” he said, 30 minutes into interview.

What matters here is context. Hayes did not talk about Zcash price targets. He did not say buyers should rush in. His comments focused on technology and design, not market timing.

That distinction explains why the price has not reacted yet.

Why Zcash Price Has Not Reacted Yet

Despite the attention from Arthur Hayes, the Zcash price has not moved much. The reason is visible on the chart.

First, a bearish EMA crossover is forming. EMA means exponential moving average. It shows the average price but gives more weight to recent moves.

When the 20-day moves below the 50-day, it usually means short-term sellers are stronger than buyers. Right now, the 20-day EMA is very close to crossing below the 50-day. This keeps traders cautious.

Want more token insights like this? Sign up for Editor Harsh Notariya’s Daily Crypto Newsletter here.

Bearish Cross Looms
Bearish Cross Looms: TradingView

Second, on-balance volume (OBV) is not helping the price. OBV tracks whether volume is flowing in or out. Between December 12 and December 18, the Zcash price trended lower, and OBV also weakened. This indicates that buyers are not yet adding strength. Without a rising OBV, rallies often fail, and downside moves usually do not reverse.

Volume Support Lacks
Volume Support Lacks: TradingView

Put together, the picture is clear. The EMA crossover warns of short-term pressure. OBV shows weak follow-through from buyers. This explains why the Zcash price remains stuck and waits for a clear direction.

Arthur Hayes’ comments provide long-term confidence, but charts indicate that traders are waiting for technical evidence. Until buyers step in with volume, the price is likely to remain undecided.

What Could Decide the Next Zcash Price Move

Large capital flows provide the clearest clue. The CMF or Chaikin Money Flow indicator has been rising between December 11 and December 18, while the ZEC price corrected. This pattern means larger holders are showing interest even while the prices remain weak.

However, CMF is still below the zero line. That matters. A move above zero often confirms real buying. In past cases, like in early November, the price followed strongly once the CMF crossed that level.

ZEC CMF Rising
ZEC CMF Rising: TradingView

For Zcash, the levels are clear. A clean daily close above $434 would show buyers are taking control again. If that happens, the next important zone sits near $516.

Zcash Price Analysis
Zcash Price Analysis: TradingView

On the downside, $371 is the first key support. If the price slips below that level, sellers could push it toward $301, where previous buying interest appeared.

The post Zcash Price Awaits Direction Despite Arthur Hayes Favoring Its Privacy Model — But Why? appeared first on BeInCrypto.

  •  

Pi Coin’s Decline Continues, Yet the Data Tells a More Complex Story

Pi Coin has extended its decline for a third straight week, falling sharply from its recent local top. The altcoin has struggled amid weak investor support and broader market hesitation. 

While selling pressure dominated earlier sessions, on-chain signals now suggest at least one key factor may be improving.

Pi Coin Holders Are Capitalizing

The Chaikin Money Flow has shown a gradual uptick over the past few days. This shift indicates capital is slowly returning to Pi Coin. Investors appear to be adjusting their stance, likely viewing current prices as attractive accumulation zones.

Rising CMF readings often reflect improving conviction. Fresh inflows are critical for any recovery attempt, as sustained buying helps absorb sell pressure. If this trend continues, Pi Coin could gain the momentum needed to stabilize and attempt a short-term rebound.

Want more token insights like this? Sign up for Editor Harsh Notariya’s Daily Crypto Newsletter here.

Pi Coin CMF
Pi Coin CMF. Source: TradingView

Despite improving inflows, macro indicators remain mixed. The average directional index shows the recent downtrend is close to strengthening. A move above the 25.0 threshold would confirm dominant bearish momentum, reinforcing control by sellers.

However, failure to cross this level would signal weakening trend strength. In such a scenario, selling pressure could fade. This would give Pi Coin room to recover, especially if buying interest continues to increase alongside supportive market conditions.

Pi Coin ADX
Pi Coin ADX. Source: TradingView

PI Price Could End Up Rangebound

Pi Coin trades near $0.203 at the time of writing, holding above the $0.198 support and below the $0.208 resistance. The token remains down about 28% from its $0.284 local top. Price action suggests consolidation rather than a decisive move.

If the downtrend strengthens, Pi Coin may remain range-bound between $0.198 and $0.208. This structure would limit upside potential and delay recovery. Prolonged consolidation could further test investor patience during ongoing market uncertainty.

Pi Coin Price Analysis.
Pi Coin Price Analysis. Source: TradingView

A bullish scenario depends on sustained capital inflows. Continued accumulation could help Pi Coin reclaim $0.208 as support. A successful breakout may drive price toward $0.217, with further upside to $0.224. Such a move would invalidate the bearish thesis.

The post Pi Coin’s Decline Continues, Yet the Data Tells a More Complex Story appeared first on BeInCrypto.

  •  

XRP Selling Pressure Collapses 39%, But This Price Level Still Controls the Outcome

XRP price is nearing a critical decision point as 2025 approaches its final stretch. Price remains weak on higher timeframes, almost 16% down month-on-month. But cracks are starting to appear in selling pressure. Momentum indicators and on-chain data now suggest that sellers are losing control, even though price has not yet confirmed a reversal.

The setup is no longer about guessing a rally. It is about whether fading sell pressure is enough to push the XRP price through a known supply wall. And that wall still matters.

Sellers Are Losing Control?

Early signs of a rebound are showing up on the 12-hour chart, where trend shifts often appear first.

Between November 21 and December 18, the XRP price made a lower low. During the same period, the RSI made a higher low. RSI (Relative Strength Index) measures momentum. When price falls, but RSI improves, it signals bullish divergence.

Bullish Divergence
Bullish Divergence: TradingView

Want more token insights like this? Sign up for Editor Harsh Notariya’s Daily Crypto Newsletter here.

This pattern suggests that, although the XRP price continued to decline, the selling momentum weakened. Sellers were still active, but they were no longer able to push momentum lower with the same force.

On-chain data supports this shift.

The XRP HODLer Net Position Change tracks whether long-term holders are adding or selling coins. On December 11, net selling peaked at roughly 216.9 million XRP. By December 18, that figure dropped to about 132.2 million XRP.

That is a decline of roughly 39% in daily selling pressure.

XRP Holders Sell Fewer Coins
XRP Holders Sell Fewer Coins: Glassnode

In simple terms, sellers are still present, but far fewer coins are being pushed onto the market. This aligns with the RSI divergence and strengthens the case that downside pressure is fading.

This does not guarantee a rally. But it does mean the market is no longer in full control of sellers.

Why One XRP Price Level Still Decides the Outcome

Even if selling pressure continues to ease, XRP still faces a major structural test overhead.

On-chain cost basis data shows a heavy supply cluster between $1.96 and $1.97. Around 1.82 billion XRP were accumulated in this zone. Cost basis data tracks where holders bought their coins. When price returns to those levels, many holders reach break-even and tend to sell.

This makes the $1.96–$1.97 range a powerful resistance zone.

Strong XRP Supply Cluster
Strong XRP Supply Cluster: Glassnode

The price chart confirms this. The XRP price has repeatedly failed to hold above $1.96, and rebounds have stalled near the same area. If a bounce develops from current levels, this is where sellers are most likely to reappear.

For the rebound to become a genuine trend shift, the XRP price must post a clean daily close above $1.96. Without that confirmation, any upside move risks becoming another failed rally.

XRP Price Analysis
XRP Price Analysis: TradingView

On the downside, $1.76 remains the key invalidation level. A break below it would suggest that seller control is returning, opening the door to deeper losses.

The takeaway is clear. Selling pressure has dropped sharply, and momentum is improving. But until XRP clears $1.96 with conviction, the market remains trapped between weakening sellers and a stubborn supply wall.

The post XRP Selling Pressure Collapses 39%, But This Price Level Still Controls the Outcome appeared first on BeInCrypto.

  •  

XRP Struggles Below $2.00 as Network Activity Remains Weak

XRP remains under pressure after extending its downtrend and slipping well below the $2.00 level. The pullback has dampened short-term momentum despite pockets of investor optimism. 

That confidence has yet to translate into stronger network activity, limiting XRP’s ability to stage a meaningful price recovery.

XRP Holders Are Doing Their Part

HODL Waves data shows growing conviction among longer-term XRP holders. Since the start of the month, wallets holding XRP for one to two years increased their supply share by 3%. This cohort now controls roughly 11% of circulating XRP.

The shift reflects mid-term holders maturing into long-term holders. Such behavior often signals confidence during periods of price weakness. These investors appear willing to endure volatility, anticipating a future recovery rather than reacting to short-term price swings.

However, this also indicates that the mid-term holders are underwater. Hence, they are forced to hold XRP tokens.

Want more token insights like this? Sign up for Editor Harsh Notariya’s Daily Crypto Newsletter here.

XRP HODL Waves
XRP HODL Waves. Source: Glassnode

Nonetheless, macro indicators suggest challenges persist. The network value to transactions ratio shows elevated readings. Rising NVT levels often suggest valuation is outpacing on-chain utility.

The indicator recently reached a three-month high, pointing to potential overheating. XRP’s transaction activity has not kept pace with market expectations. This imbalance weakens recovery attempts, as price advances lack confirmation from network usage and sustained demand.

XRP NVT Ratio
XRP NVT Ratio. Source: Glassnode

XRP Price May Be Safe From A Crash

XRP trades near $1.86 at the time of writing, remaining well below the $2.00 mark lost last week. The decline followed a failed attempt to break out of a month-long downtrend earlier this month. Momentum remains fragile under current conditions.

The token is holding above the $1.85 support level, which has been tested previously. XRP may consolidate below $1.94 if selling pressure eases. However, worsening sentiment could push the price toward $1.79, extending short-term losses.

XRP Price Analysis.
XRP Price Analysis. Source: TradingView

A recovery scenario depends on improving network activity and broader market stability. A break above $1.94 would be the first step toward reclaiming $2.00. Flipping $2.02 into support could drive XRP toward $2.20, invalidating the bearish trend.

The post XRP Struggles Below $2.00 as Network Activity Remains Weak appeared first on BeInCrypto.

  •  

PUMP Price Crashes to 5-Month Low After 33% Decline This Week

Pump.fun has suffered a sharp price decline, pushing PUMP to a five-month low. The drop reflects sustained capital outflows from holders who see limited near-term value in the token. 

Broader market weakness has worsened the situation, with Bitcoin’s instability adding pressure to already fragile sentiment.

Pump.fun Holders Move To Sell

On-chain indicators point to a decisive loss of confidence among PUMP holders. The Chaikin Money Flow sits deep below the zero line, confirming aggressive capital withdrawals. Furthermore, this reading shows investors are exiting positions rather than positioning for a recovery.

The CMF has now reached an all-time low, marking the largest outflows in PUMP’s trading history. Such extreme readings typically reflect bearish conviction. Additionally, persistent selling reduces liquidity support, making short-term stabilization difficult and keeping downside risks elevated.

Want more token insights like this? Sign up for Editor Harsh Notariya’s Daily Crypto Newsletter here.

PUMP CMF
PUMP CMF. Source: TradingView

PUMP’s macro outlook remains closely tied to Bitcoin’s performance. Its correlation with Bitcoin recently rebounded to 0.78 after a brief decline. This indicates PUMP is once again closely tracking Bitcoin’s price movements.

This relationship is problematic given Bitcoin’s uncertainty near the $86,000 level. Besides, weakness in the broader market often amplifies losses in smaller tokens. Thus, if Bitcoin declines further, PUMP is likely to follow, extending losses for remaining holders.

PUMP Correlation To Bitcoin
PUMP Correlation To Bitcoin. Source: TradingView

PUMP Price May See Further Correction

PUMP is trading near $0.002031 at the time of writing, its lowest level in five months. As it stands, the token has fallen by more than 33.8% in just one week. Accelerating losses reflect worsening sentiment and the absence of consistent buying interest.

Continued holder exits could push PUMP toward the $0.001917 support. This level is critical for near-term stability. Additionally, the breakdown below it may open the door to $0.001711, reinforcing the bearish trend and intensifying downside volatility.

PUMP Price Analysis
PUMP Price Analysis. Source: TradingView

A recovery scenario depends on improved market conditions and renewed inflows of capital. Reclaiming $0.002123 as support would be an early signal of stabilization. Furthermore, if buying interest returns, PUMP could advance toward $0.002428, invalidating the bearish thesis and restoring short-term confidence.

The post PUMP Price Crashes to 5-Month Low After 33% Decline This Week appeared first on BeInCrypto.

  •  

Pi Coin Likely to Consolidate in a Tight Range as Buying Rises Without Strong Conviction

Pi Coin price is showing early signs of support after a sharp mid-December drop. Since the December 16 low, Pi Coin has bounced over 8%, helped by steady exchange-side buying.

But while buying pressure has picked up, not all capital groups are convinced yet. The result is a market caught between support and hesitation, setting up a likely range move rather than a clean breakout. Right now, Pi Coin sits at a crossroads where inflows are improving, but conviction remains uneven.

Buying Pressure Builds as Capital Flows Turn Supportive

Exchange wallet data shows clear net buying over the past 24 hours.

Across major centralized exchanges, Pi Coin recorded a net outflow of roughly 414,420 PI, meaning more tokens left exchanges than entered. That usually points to buying rather than selling.

At current prices, this net buying represents approximately $83,000 in accumulation over a short period. Despite being a small exchange-based purchase, it is significant given PI’s seller-driven history.

Net Buying Across CEXs
Net Buying Across CEXs: Pi Scan

Want more token insights like this? Sign up for Editor Harsh Notariya’s Daily Crypto Newsletter here.

Flow-based momentum supports this shift.

The Chaikin Money Flow (CMF) indicator has risen by over 40% from its recent lows. CMF tracks whether big money is flowing into or out of an asset. Rising CMF alongside price stabilization suggests that large buyers are absorbing supply rather than chasing price.

The combined rise in buying pressure could have helped Pi Coin recover nearly 8% from its December 16 low, pushing the price back above the $0.19 line.

Big Money Flows Surges
Big Money Flows Surges: TradingView

CMF is also nearing a breakout from a descending trendline. A clean break above that line, followed by a move above the zero level, would strengthen the case that this bounce has real backing. So far, the signals say buying is real, but still measured.

Why Pi Coin Price Likely Stays Range-Bound

Despite improving flows, smart money behavior remains cautious. The Smart Money Index continues to trend lower and has not confirmed the recent price rebound. That indicates that informed, longer-term buyers are not yet aggressively stepping in.

When buying pressure rises without smart money confirmation, the price often stabilizes instead of trending immediately.

Pi Coin Must Gain Smart Money Attention
Pi Coin Must Gain Smart Money Attention: TradingView

That matches Pi Coin’s current structure.

The key support zone sits near $0.19, which has held multiple tests. A clean break below it would reopen downside risk toward $0.15.

On the upside, $0.21 acts as the first barrier. Without a strong push above that level, rallies are likely to stall.

Pi Coin Price Analysis: TradingView

This creates a roughly 10% range, with about 5% upside and 5% downside from current prices.

In short, Pi Coin is being supported by steady buying and improving money flow, but the lack of smart money participation suggests consolidation rather than continuation. Until that changes, Pi Coin is more likely to trade sideways than trend hard in either direction.

The post Pi Coin Likely to Consolidate in a Tight Range as Buying Rises Without Strong Conviction appeared first on BeInCrypto.

  •  

Ethereum Price Nears Possible Breakdown — Yet A Bounce Hope Emerges

Ethereum price action is sending mixed signals. After correcting over 3% in a day, ETH is flashing early rebound signs, but downside risk has not cleared yet. The chart structure, momentum data, and on-chain cost levels all point to a narrow decision zone.

Right now, Ethereum is stuck between a possible bounce and a deeper breakdown. And the gap between those two outcomes is smaller than it looks. What’s worth noting is that the breakdown zone looms closer!

Rebound Signal Sits Inside a Tight Triangle

Ethereum is trading inside a narrowing triangle, a structure that reflects growing buyer-seller indecision. Price has compressed toward the lower trendline, often a zone where selling pressure starts to fade.

Between December 1 and December 17, ETH printed a higher low on price. At the same time, the RSI (Relative Strength Index), a momentum measuring tool, made a lower low. This creates hidden bullish divergence, meaning selling momentum is weakening.

Hidden Bullish Divergence
Hidden Bullish Divergence: TradingView

Want more token insights like this? Sign up for Editor Harsh Notariya’s Daily Crypto Newsletter here.

This setup does not guarantee a rally. But it does suggest downside pressure may be exhausting as Ethereum approaches structural support, the lower triangle trendline. In simple terms, sellers are losing strength, but buyers have not taken control yet.

That makes the next move highly sensitive to key levels.

Cost Basis Data Shows Where Ethereum Price Rebound Could Stall

On-chain cost basis data helps explain why upside may remain capped.

The strongest near-term resistance sits between $3,154 and $3,179, where roughly 2.8 million ETH were accumulated. This is a heavy supply zone. When price revisits this range, many holders reach break-even and tend to sell.

Key Supply Cluster
Key Supply Cluster: Glassnode

This aligns closely with the chart resistance at $3,149, which marks an 11% upside from current levels. Even if the Ethereum price rebounds, this zone is likely to attract selling unless the price closes cleanly above it. That is why any bounce without a daily close above this area would still be considered corrective, not trend-changing.

The downside picture is more fragile.

The most important support cluster sits between $2,801 and $2,823. This range has acted as a key demand zone. A clean daily close below $2,801 (which also shows up on the price chart) would be a warning signal.

ETH Support Clusters
ETH Support Clusters: Glassnode

That move would represent barely a 1% downside break, but it could open the door toward $2,617, the next major support level on the chart.

Ethereum Price Analysis
Ethereum Price Analysis: TradingView

This is what makes Ethereum’s current position dangerous. Upside could stall near 11%, but downside risk begins with just a 1% failure.

The post Ethereum Price Nears Possible Breakdown — Yet A Bounce Hope Emerges appeared first on BeInCrypto.

  •  

3 Altcoins to Watch Ahead of the 2025 Santa Rally Season

During the festival season, the crypto markets, much like traditional financial markets, often lean bullish as liquidity improves, sentiment turns optimistic, and traders position themselves for a year-end push. While Christmas-themed tokens might see a spike in this duration, the focus is on altcoins with strong momentum.

BeInCrypto has analysed three such altcoins that could note a “Santa” rally within the coming week.

MYX Finance (MYX)

MYX Finance signaled a potential catalyst after confirming MYX V2 has been in development for several months. A launch near Christmas or New Year appears plausible. Historically bullish seasonal conditions could amplify market interest, positioning MYX for increased volatility.

The MYX token has maintained an uptrend for over six weeks, reflecting improving momentum. Trading near $3.55, the price could break above $3.71 if optimism builds. A successful breakout may drive MYX toward $4.00, marking its highest level in roughly two months.

Want more token insights like this? Sign up for Editor Harsh Notariya’s Daily Crypto Newsletter here.

MYX Price Analysis
MYX Price Analysis. Source: TradingView

Technical indicators support upside risks. The relative strength index remains in bullish territory, signaling sustained demand. However, an overbought reading could trigger profit-taking.

If selling pressure accelerates, MYX may retreat toward $3.00 or lower, invalidating the bullish outlook.

Memecore (M)

Memecore has gained 25% over the past week as it attempts to recover losses from late November. The rebound reflects improving short-term momentum. If buying pressure persists, the altcoin may challenge the $2.00 level, signaling a broader recovery phase supported by renewed investor interest.

Technical indicators support the upside scenario. The Parabolic SAR confirms an active uptrend, while ongoing Christmas events may bolster demand. Memecore must clear the $1.88 resistance to advance beyond $2.00. A breakout could open the path toward $2.12, reinforcing bullish momentum.

Memecore Price Analysis
Memecore Price Analysis. Source: TradingView

Downside risks remain if sentiment shifts. Selling pressure could push M below recent levels, exposing the $1.42 support. A decline in this zone would invalidate the bullish outlook and weaken market confidence.

Mantle (MNT)

Mantle has outperformed several major altcoins despite broader market volatility. MNT is up 15% over the past week, trading near $1.28. The move signals short-term strength as investors rotate toward assets showing relative resilience amid uncertain cryptocurrency market conditions.

On-balance volume has risen over recent sessions, indicating growing buying interest. This shift may support a bullish reversal or short-term relief rally. If momentum continues, MNT could break above $1.34. A successful move may open a path toward $1.50 in the near term.

MNT Price Analysis
MNT Price Analysis. Source: TradingView

Risks remain if buying pressure fades. Failure to clear the $1.34 resistance could stall the rally. MNT may consolidate or slip toward $1.30. A breakdown below this level would invalidate the bullish outlook and reinforce sideways or bearish price action.

The post 3 Altcoins to Watch Ahead of the 2025 Santa Rally Season appeared first on BeInCrypto.

  •  

Can Solana’s Brazil ETP Narrative Spark a Price Breakout? Charts Hold the Clue

Solana price action has gone quiet after weeks of pressure. SOL is down roughly 10% over the past 30 days, yet it has traded nearly flat over the last 24 hours, even as the broader market weakens. That pause matters.

It comes as Solana quietly seeks to gain institutional exposure in Brazil through Valour’s Solana ETP (Exchange-Traded Product), which is expected to list on the B3 exchange. This move reinforces a steady channel for regulated demand at a time when charts show breakout signs. The question now is simple. Can this backdrop help Solana resolve a difficult technical setup, or do sellers still control the trend?

ETP Hype Meets a Sloping Breakdown Structure

Valour’s Solana ETP offers regulated exposure to SOL for Brazilian investors and institutions. While it is not a short-term price driver, it adds steady absorption during periods of selling pressure. That matters most when charts show key patterns. And it also could be a sentimental trigger in a market where every asset is looking at narratives.

DeFi Technologies' Subsidiary @ValourFunds Approved to List Valour Solana (VSOL) ETP on Brazil's B3 Exchange (@B3_Oficial) https://t.co/xy0ILbKzdU $DEFT pic.twitter.com/PKGZfHN1Kp

— DeFi Technologies (@DeFiTechGlobal) December 16, 2025

Technically, Solana is trading inside a down-sloping head-and-shoulders structure, not a clean textbook pattern. When the neckline slopes lower, breakouts require stronger confirmation because sellers continue pressing at lower levels over time.

Weak Breakout Pattern
Weak Breakout Pattern: TradingView

Want more token insights like this? Sign up for Editor Harsh Notariya’s Daily Crypto Newsletter here.

However, some buyer-specific signs are appearing, which could help combat the sellers and help the Solana price aim for a clean neckline breakout.

Quiet Accumulation Appears Beneath the Surface

While price struggles, on-chain data shows early signs of accumulation.

The 3-month to 6-month holder cohort has increased its supply share meaningfully. This group held 11.756% of the supply on November 16, which has now risen to 16.126% by December 16. That is a sharp increase over one month and points to mid-term buyers stepping in during weakness.

Solana Buyers Surface
Solana Buyers Surface: Glassnode

At the same time, the Chaikin Money Flow (CMF) is sending a constructive signal. Between November 3 and December 15, the Solana price made a lower low, but the CMF formed a higher low. This divergence suggests buying pressure is building underneath, even as price drifts lower.

Big Money Divergence Surfaces
Big Money Divergence Surfaces: TradingView

However, CMF remains below zero. That indicates that large capital remains cautious. Buyers are present but are not yet aggressive. Together, these signals point to positioning, not confirmation.

Solana Price Levels That Decide the Next Leg

The Solana price now carries the full weight of the story. $141 is the first level to watch. Reclaiming it would mark a break of the sloping neckline, but not a trend change. Remember, the neckline slopes down and therefore requires a stronger confirmation.

$153 is therefore the key. A daily close above $153 would confirm that buyers have overpowered the sloping structure and could open a move toward higher resistance zones.

Solana Price Analysis
Solana Price Analysis: TradingView

On the downside, $121 remains the critical support. A failure there would invalidate the accumulation thesis and breakout pattern, shifting focus back to the deeper downside.

The post Can Solana’s Brazil ETP Narrative Spark a Price Breakout? Charts Hold the Clue appeared first on BeInCrypto.

  •  

Pi Coin Declines 25% in 20 Days as Investor Outflows Increase

Pi Coin has faced sustained selling pressure over recent weeks, pushing its price to a multi-week low. The altcoin has declined sharply alongside broader market weakness, with Bitcoin acting as a key drag. 

Waning investor support and rising withdrawals have intensified downside pressure, limiting any meaningful recovery attempts.

Pi Coin Follows Bitcoin

On-chain indicators reflect deteriorating sentiment among Pi Coin holders. The Chaikin Money Flow shows heavy withdrawals, with the indicator dropping to an eight-month low. This reading signals strong capital outflows, suggesting investors are reducing exposure amid continued price weakness.

The sustained selling reflects fading confidence following repeated failed recovery attempts. Many holders appear unwilling to wait for a rebound, choosing instead to exit positions. 

Want more token insights like this? Sign up for Editor Harsh Notariya’s Daily Crypto Newsletter here.

Pi Coin CMF
Pi Coin CMF. Source: TradingView

Pi Coin’s macro momentum remains closely tied to Bitcoin’s performance. The correlation between PI and Bitcoin currently stands at 0.42. This relationship turned positive after steadily improving over nearly three weeks, mirroring the period of Pi Coin’s recent price decline.

This alignment has worked against PI. As Bitcoin corrected, Pi Coin followed lower, magnifying losses. A rising correlation during a downtrend often increases vulnerability, as independent recovery becomes less likely without broader market stabilization or asset-specific catalysts.

Pi Coin Correlation To Bitcoin
Pi Coin Correlation To Bitcoin. Source: TradingView

PI Price Falls To Its Critical Support

At the time of writing, Pi Coin trades at $0.201, reflecting a 25% decline over the past 20 days. The drop followed a failed attempt to break above the $0.272 resistance. Rejection at that level marked a clear shift toward sustained bearish momentum.

Pi Coin is now testing the $0.198 support, an eight-week low that has previously acted as a floor. This level remains critical. However, bearish signals persist, and a breakdown could push PI toward $0.188 or even $0.180, extending the downtrend.

Pi Coin Price Analysis.
Pi Coin Price Analysis. Source: TradingView

A recovery scenario remains possible if historical patterns repeat. A successful bounce from $0.198 could restore short-term confidence. If Pi Coin reclaims $0.208 as support, the bearish thesis would weaken. Such a move may allow PI to rise toward $0.217, signaling temporary relief.

The post Pi Coin Declines 25% in 20 Days as Investor Outflows Increase appeared first on BeInCrypto.

  •  

Ethereum Price Drops Below $3,000 Amid Declining Holder Conviction

Ethereum’s price has come under renewed pressure after failing to break out of a two-month downtrend. ETH briefly attempted a recovery last week but quickly lost momentum. 

Weak investor support has pushed Ethereum lower, raising concerns about its ability to sustain a meaningful recovery in the near term.

Ethereum Is Losing Investors’ Backing

On-chain data indicate that profit levels for both long-term and short-term holders have declined. Both cohorts now sit at similar profitability levels, signaling reduced conviction across the market. This convergence suggests neither group is realizing meaningful gains at current price levels.

The MVRV Long/Short Difference has slipped below the zero line, reinforcing this trend. The reading indicates neither long-term nor short-term holders hold dominant unrealized profits. If the indicator declines further, Ethereum short-term holder profits could dominate, increasing downside risk and reflecting fragile investor sentiment.

Want more token insights like this? Sign up for Editor Harsh Notariya’s Daily Crypto Newsletter here.

Ethereum MVRV Long/Short Difference
Ethereum MVRV Long/Short Difference. Source: Santiment

Ethereum’s macro activity has weakened noticeably. Active addresses on the network have fallen to a seven-month low. This decline highlights reduced participation from ETH holders, signaling less engagement with the network during the ongoing price weakness.

Lower activity suggests investors see limited incentive to transact amid stalled price action. Reduced network usage often reflects fading confidence. Without renewed demand or catalyst-driven activity, Ethereum may struggle to regain momentum in the short term.

Ethereum Active Addresses
Ethereum Active Addresses. Source: Glassnode

ETH Price Is Below $3,000 Again

ETH is trading at $2,929, marking its third drop below $3,000 this month. Ethereum price’s breakout attempt earlier last week failed to hold. The rejection reinforced the prevailing downtrend and signaled limited buying interest at higher levels.

Bearish indicators suggest Ethereum could retest the $2,762 support level. This zone has historically acted as a critical floor. While downside pressure exists, a deeper decline appears limited unless broader market conditions deteriorate significantly.

ETH Price Analysis.
ETH Price Analysis. Source: TradingView

A shift in investor sentiment could alter the outlook. Reclaiming $3,000 as support remains essential. A sustained move above this level could allow ETH to challenge $3,131. Such a recovery would invalidate the bearish thesis and signal a breakout from the downtrend.

The post Ethereum Price Drops Below $3,000 Amid Declining Holder Conviction appeared first on BeInCrypto.

  •  

Cardano Price Sends a Clear Warning After Back-to-Back Breakdowns— $0.25 Now in Focus

Cardano price is trading near its weakest levels of the year. The token is down roughly 24% over the past 30 days and about 5% over the past 24 hours, hovering close to its yearly low near $0.37. What makes this move stand out is not just the size of the drop, but the structure behind it.

In the span of just two months, Cardano has completed two separate bearish continuation breakdowns, putting fresh pressure on the chart and raising the risk of a deeper move.


Two Bearish Breakdowns in Two Months Signal Structural Weakness

The first breakdown formed in early November. ADA built a bearish flag through late October, then broke down around November 11. That move led to a sharp decline, with the price falling roughly 38% from the flag’s high.

After a brief consolidation, Cardano repeated the pattern. A second bearish flag developed through late November and early December. On December 11, ADA broke down again, confirming a second continuation move in just two months.

Want more token insights like this? Sign up for Editor Harsh Notariya’s Daily Crypto Newsletter here.

Price Breakdown Highlighted
Price Breakdown Highlighted: TradingView

When markets print repeated bearish continuation patterns without meaningful recovery, it signals sustained seller control rather than panic selling. If the current breakdown follows the same measured-move logic as the first, downside targets begin clustering near the $0.25 zone.


Why This Weakness Itself Could Limit Further Damage

Despite the bearish structure, there are two factors that slightly soften the downside risk.

First, derivatives positioning is already skewed heavily bearish. Gate’s liquidation data shows long leverage is thin, with only about $27 million in long positions, while short exposure sits near $135 million, 5x more. Most long liquidation clusters end around $0.36, meaning forced selling pressure drops sharply at that level. Fewer crowded longs reduces the chance of a liquidation cascade.

ADA Liquidation Map
ADA Liquidation Map: Coinglass

Second, long-term holder behavior has stabilized. The 1-year-to-2-year cohort, often viewed as higher-conviction holders, has sharply reduced spending, as seen via the Spent Coin metric, which groups coin movements by cohorts.

Coins moved by this group fell from 666.24 million ADA to just 2.48 million ADA since December 10, a decline of almost 99.6%. That suggests selling pressure from committed holders is drying up, even as the price remains weak.

Spent Coins Go Down
Spent Coins Go Down: Santiment

In simple terms, ADA’s weakness has scared off leverage and slowed long-term selling, which can act as a temporary brake during broader market stress.


Key ADA Price Levels to Watch

The Cardano price chart remains fragile. $0.36 is the most important near-term support. The same level is highlighted by the liquidation map shared earlier.

A clean break below it opens the door to $0.33, and from there, the measured breakdown target near $0.25 comes into focus.

For any bullish reset, ADA would need to reclaim $0.48. Without that, rallies remain corrective, not trend-changing.

Cardano Price Analysis
Cardano Price Analysis: TradingView

For now, Cardano sits in a dangerous spot.

Two breakdowns in two months define the trend. Weakness itself may slow the fall; however, unless the structure improves, the risk of a $0.25 test cannot be ignored.

The post Cardano Price Sends a Clear Warning After Back-to-Back Breakdowns— $0.25 Now in Focus appeared first on BeInCrypto.

  •  

3 Altcoins To Watch In The Third Week Of December 2025

The crypto market remains cautious, but some tokens are facing important tests this week. As prices move sideways, attention is shifting toward three altcoins to watch in the third week of December. Each has a specific catalyst approaching, from supply changes to network events and shifting holder behavior.

These setups could drive sharp moves if buyers or sellers take control in the days ahead.

Sei (SEI)

SEI has been under steady pressure heading into mid-December, and price action reflects that caution. The token is down roughly 23% over the past month and more than 60% over the last three months, keeping sentiment fragile as the market looks for direction.

At the time of writing, SEI trades near $0.124, consolidating inside a broader falling wedge structure on the daily chart. This pattern often appears late in downtrends, where selling pressure slows, and the price begins to compress. For now, SEI is hovering just above the lower boundary of that structure, making the next few sessions critical. That tension qualifies SEI to be on the altcoins to watch list.

Momentum indicators offer a mixed but interesting signal. Between December 5 and December 14, the SEI price made a lower low, while the Relative Strength Index (RSI) formed a higher low. RSI measures momentum strength, and this bullish divergence suggests sellers may be losing control, even as price remains weak.

SEI Price Analysis
SEI Price Analysis: TradingView

Want more token insights like this? Sign up for Editor Harsh Notariya’s Daily Crypto Newsletter here.

That said, near-term risk remains elevated due to SEI’s scheduled token unlock on December 15. Around 55.56 million SEI, roughly 1.08% of the circulating supply, is set to enter the market. Token unlocks often increase short-term selling pressure, especially when broader sentiment is cautious.

Key levels define the setup clearly. A clean move above $0.159 would signal that buyers are absorbing unlock-related supply and could open a rebound toward higher resistance zones. That includes $0.193 and even higher.

On the downside, a drop of roughly 3% from current levels, to $0.120, risks a breakdown toward the lower trendline. That would weaken the bullish divergence thesis.

Bittensor (TAO)

Bittensor price action has compressed into a tight range ahead of its upcoming halving, setting up a clear decision point. TAO has been trading inside a symmetrical triangle on the daily chart, showing balance between buyers and sellers after weeks of downside pressure. That kind of buyer-seller tussle makes it one of the top altcoins to watch in the third week of December.

1/

The TAO Halving is approaching, Here’s what changes and what stays the same…
🧵 pic.twitter.com/0pwLdZLeCD

— Openτensor Foundaτion (@opentensor) December 11, 2025

TAO is down around 15.5% over the past month and roughly 6.6% over the last seven days. Short-term weakness continues, but volatility has dropped, which often appears before larger moves. This structure reflects indecision rather than outright bearish control.

The halving acts as the key backdrop. Bittensor’s halving reduces token emissions, tightening new supply. Historically, such events do not guarantee immediate upside, but they often act as a catalyst when the price is already compressed.

From a technical view, the first bullish trigger sits near $301. A daily close above this level would break the upper trendline of the triangle and signal renewed strength. That move opens a path toward $321, followed by $396 if momentum builds and broader market conditions cooperate.

TAO Price Analysis
TAO Price Analysis: TradingView

Downside risk remains. $277 is critical support. A breakdown below it weakens the structure and exposes $255, with $199 as a deeper risk zone if sentiment deteriorates.

Aster (ASTER)

Aster stands out as one of the altcoins to watch in the third week of December because of a clear tug-of-war between whales and the broader market.

On-chain data shows aggressive whale accumulation heading into this week. Over the past seven days, whale-held ASTER balances jumped by about 42.7 million tokens, rising from roughly 39.85 million to 82.54 million ASTER. That is a 107% increase, signaling strong conviction from large holders ahead of the third week of December.

ASTER Holders
ASTER Holders: Nansen

At the same time, exchanges tell a different story. Exchange balances took a 10.48% jump. This suggests possible retail selling even as whales accumulate.

That buyer-seller conflict is also visible on the chart. ASTER has been correcting since November 19 but is now compressing inside a triangle pattern, reflecting indecision. During this phase, a hidden bullish divergence has formed. Between November 3 and December 14, the price made a higher low while the Relative Strength Index (RSI) made a lower low, which often signals exhausting selling pressure.

ASTER Price Analysis
ASTER Price Analysis: TradingView

That’s often associated with price rebounds. If this setup plays out, the first level to watch is $0.94. A daily close above it would break the triangle resistance and open the path toward $0.98, followed by a potential 16% move to $1.08 if momentum builds and whale support persists.

On the downside, losing $0.88 would invalidate the bullish divergence and expose $0.81, shifting control back to sellers.

The post 3 Altcoins To Watch In The Third Week Of December 2025 appeared first on BeInCrypto.

  •  

One Critical XRP Price Level Surfaces — Holding It Could Trigger a 9% Bounce

XRP is trading near $1.99, down about 1% over the past 24 hours. Despite broader market volatility, it is only around 4% lower on the week, showing relative stability compared to many altcoins like ADA and BCH.

More importantly, the chart is flashing an early bullish reversal signal. The setup is not confirmed yet, but if one key level continues to hold, the odds of a short-term rebound, at least 9%, increase meaningfully.

Bullish Divergence Appears as the XRP Price Defends Key Support

XRP has formed a bullish divergence on the daily chart between December 1 and December 14. A bullish divergence happens when the price makes a lower low, but the Relative Strength Index (RSI) makes a higher low. RSI is a momentum indicator that measures buying and selling strength. When RSI improves while price weakens, it often signals that selling pressure is fading.

On the daily chart, a standard bullish divergence like this can lead to trend reversal — from bearish to bullish.

Yet, this divergence alone is not enough. It only matters if the XRP price holds support.

Bullish Divergence
Bullish Divergence: TradingView

Want more token insights like this? Sign up for Editor Harsh Notariya’s Daily Crypto Newsletter here.

That support sits near $1.97. XRP has repeatedly defended this zone, and on-chain data helps explain why.

The cost basis heatmap shows a dense cluster of XRP bought between roughly $1.97 and $1.98.

Strong Support Cluster: Glassnode

Around 1.79 billion XRP were accumulated in this range. A cost basis heatmap shows where large groups of holders bought their coins. When price trades near these levels, holders are less likely to sell at a loss, which strengthens support.

As long as XRP stays above $1.97, the bullish divergence theory remains valid, provided the RSI reading stays strong.

Why $2.17 Is the First Real Test for the Bulls

If support holds, XRP has room to move higher. The first upside target sits near $2.17, which is roughly a 9% move from current levels.

This level matters because the cost basis heatmap shows heavy supply between $2.16 and $2.17. About 1.36 billion XRP were acquired in this zone. That makes it a strong resistance area, where selling pressure is likely to appear.

XRP Price Can Face Resistance At This Level
XRP Price Can Face Resistance At This Level: Glassnode

If the XRP price pushes through $2.17 with a daily candle close, it could open the path toward $2.28, then $2.69, and eventually $3.10. Yet, those levels remain secondary for now and depend on broader market conditions.

The invalidation is clear. A daily close below $1.97 would weaken the reversal setup and expose downside toward $1.81 and $1.77.

XRP Price Analysis
XRP Price Analysis: TradingView

For now, the XRP price sits at a decision point. The bullish reversal signal is active, but only if the most important support level continues to hold.

The post One Critical XRP Price Level Surfaces — Holding It Could Trigger a 9% Bounce appeared first on BeInCrypto.

  •  

HBAR Has One Bullish Play Left — Is It Enough to Avoid a 13% Breakdown?

HBAR is running out of time. The token is down nearly 2% over the past 24 hours and close to 10% for the week. In the process, HBAR price has broken several short-term support levels and is now hovering near $0.12.

This level is critical. HBAR is barely 1% above a breakdown zone that could drag the price toward $0.10. That move would translate into a 12% to 13% decline from current levels. But one bullish signal is still holding the structure together. If it fails, the downside could accelerate.

Big Money Stepping Away Weakens the Setup

The main source of pressure comes from how large HBAR holders are behaving.

This is visible through the Chaikin Money Flow (CMF), which tracks whether big money is entering or exiting an asset by combining price movement with trading volume. When CMF is above zero, large buyers are active. When it falls below zero, the distribution is taking place.

For HBAR, CMF has deteriorated sharply. Since December 7, CMF has dropped by more than 400% and moved deep into negative territory. Earlier pullbacks still saw CMF stay positive, meaning buyers absorbed selling pressure. This time, that support is gone.


Big Money Dumping HBAR
Big Money Dumping HBAR: TradingView

Want more token insights like this? Sign up for Editor Harsh Notariya’s Daily Crypto Newsletter here.

There is also a clear bearish divergence. Between October 10 and December 14, the HBAR price formed higher lows, while the CMF formed lower lows. This shows that recent price stability was not backed by strong demand from large players.

In simple terms, price tried to hold up while big money quietly exited. That imbalance makes the HBAR price vulnerable.

One Bullish Signal Is Still Holding the Floor

Despite the weak big-money picture, one momentum indicator is still flashing a bullish sign.

That indicator is the Relative Strength Index (RSI), which measures the strength and speed of recent price moves. It helps identify when selling pressure may be getting exhausted. Readings near 30 usually suggest oversold conditions.

On HBAR’s daily chart, RSI has formed a bullish divergence. Between November 21 and December 14, the HBAR price made a lower low, while the RSI made a higher low. This is a classic bullish divergence and often appears as a trend reversal sign.

P.S. The HBAR price is in a clear downtrend, losing over 48% in the 3-month horizon.

Bullish Divergence In Play: TradingView

This tells us sellers are still pushing prices lower, but with less force each time. The decline continues, but the seller-driven momentum behind it is weakening. At the moment, this RSI divergence is the only bullish play HBAR has left.

HBAR Price Breaks Down or Turns the Tide?

Price action defines the final outcome. HBAR is trading below a descending trend line that has capped every rally for weeks. At the same time, price is sitting on a trend-based Fibonacci support near $0.12. That line acts as the base of the descending triangle pattern, completed by the descending trendline.

This zone is the last line of defense.

If $0.12 breaks decisively, the next major support sits near $0.10. That move would confirm a 12% to 13% breakdown and extend the bearish trend.

HBAR Price Analysis
HBAR Price Analysis: TradingView

To stabilize, the HBAR price must reclaim $0.13. That level lines up with a key Fibonacci retracement zone and would signal buyers stepping back in.

A stronger shift would only come above $0.13. That would place the price back above the descending trend line and reset the structure from bearish to neutral.

The post HBAR Has One Bullish Play Left — Is It Enough to Avoid a 13% Breakdown? appeared first on BeInCrypto.

  •  

Ethereum Price Could Be Silently Nearing a Breakout, Here’s Why

Ethereum price action looks quiet, but the entire formation is slowly turning bullish. Over the past 24 hours, ETH has traded almost flat, while the past seven days show a modest 2.6% gain. Price has remained above $3,100 for several sessions, suggesting strength rather than exhaustion.

This sideways move is not random. Ethereum is compressing near key levels, where breakouts often form. The next move depends on whether buyers, who are gradually returning, can turn this consolidation into a continuation.

Bull Flag Structure Holds as the Breakout Zone Appears

Ethereum appears to be breaking out after consolidating inside a bull flag. A bull flag forms when the price pauses after a strong upward move, then trades in a narrow range before the next leg higher. This pattern signals consolidation, not weakness.

The structure remains intact as long as ETH holds above $3,090. That means, unless there is a daily candle close below this level, the much-anticipated breakout might hold.

This level has acted as firm support, absorbing selling pressure during recent pullbacks. Price has repeatedly bounced from this zone, showing buyers are still defending it.

Breakout Setup Forms
Breakout Setup Forms: TradingView

Want more token insights like this? Sign up for Editor Harsh Notariya’s Daily Crypto Newsletter here.

A clean daily close above $3,130 would be the first confirmation that the flag is resolving higher. That move would signal that consolidation is ending and buyers are regaining control. Without that close, Ethereum remains in compression, but the bullish structure stays valid.

Selling Pressure Eases as Key Ethereum Price Levels Emerge

On-chain data support the price structure. Holder Net Position Change, which tracks whether long-term investors are adding or selling ETH, shows that selling pressure has eased compared to earlier sessions.

On December 12, Ethereum holders distributed roughly 958,771 ETH. By December 13, net selling dropped to around 877,958 ETH, marking a decline of roughly 8.4% in selling pressure within 24 hours.

Ethereum Holders Are Selling Fewer Coins
Ethereum Holders Are Selling Fewer Coins: Glassnode

That shift matters. Ethereum is still seeing net distribution, but the pace of selling is slowing as the price compresses near resistance. This behavior typically appears during late-stage consolidation, not during breakdowns.

When selling pressure eases near a key level without price slipping lower, it increases the odds that buyers step in once a breakout confirms. Ethereum is not seeing panic exits. Instead, holders appear more willing to wait.

Ethereum Price Analysis
Ethereum Price Analysis: TradingView

If the Ethereum price secures a daily close above $3,130, the next resistance sits near $3,390. Clearing that zone would open the path toward the $4,000–$4,020 area, aligning with the measured move from the bull flag structure.

However, the bullish structure would weaken if the Ethereum price drops under $3,090 or even $2,910. Closing below the latter would break the pattern completely.

The post Ethereum Price Could Be Silently Nearing a Breakout, Here’s Why appeared first on BeInCrypto.

  •  

Will Shiba Inu Die Out In 2026? On-Chain Data Hold the Answer

Shiba Inu price has had a rough year. The token is down nearly 70% year-on-year and more than 90% from its all-time high. With meme coin interest fading, many now question whether SHIB is slowly dying.

That concern grew after CryptoQuant CEO Ki Young Ju said meme coins are “dead,” citing collapsing dominance and shrinking speculation. On the surface, Shiba Inu seems to fit that narrative. But on-chain data adds more layers to the story.

Meme Coin Weakness Is Real, and Shiba Inu Reflects It

The broader meme coin market has clearly weakened. CryptoQuant data shows meme coin dominance has fallen to early-2024 lows, signaling reduced speculative activity across altcoins.

Memecoin markets are dead. pic.twitter.com/6kymLWH4JX

— Ki Young Ju (@ki_young_ju) December 11, 2025

Shiba Inu mirrors that trend. Price has stayed under long-term resistance, and rallies have failed to hold. Smart money wallets, which track experienced and active traders, have steadily reduced SHIB exposure throughout the year.

That suggests traders are not positioning for short-term rebounds. Simply put, informed traders are not relying on price surges, let alone rallies.

Year-Long SHIB Holders
Year-Long SHIB Holders: Nansen

Want more token insights like this? Sign up for Editor Harsh Notariya’s Daily Crypto Newsletter here.

A recent chunk of derivatives data reinforces this view. Over the past 30 days, most perpetual futures traders have cut exposure. Outside of the largest addresses, leverage remains light. This shows traders are cautious and not expecting a fast or explosive move.

Derivatives Positioning
Derivatives Positioning: Nansen

In simple terms, speculation has dried up. That supports the idea that meme coins are no longer driving the market the way they once did. But speculation is only one side of the equation.

Whales and Holders Keep Adding as Coins Leave Exchanges

Despite weak price action, long-term behavior tells a different story.

Shiba Inu’s holder count, which tracks how many wallets hold SHIB, has continued to rise throughout the year. It started near 1.46 million and has grown to roughly 1.54 million. The growth has not been smooth, but the trend remains positive, even as prices fell sharply.

Holders Keep Increasing
Holders Keep Increasing: Santiment

Whale data is more striking.

Over the past year, large holders have increased their SHIB balances by about 249%, per the image shared earlier. Mega-whale balances are up roughly 28.5%. At the same time, exchange balances, which show how many tokens sit on trading platforms, have dropped by nearly 22%. Fewer coins on exchanges usually mean less immediate selling pressure.

This trend accelerated recently. Over the past 30 days alone, whale balances rose more than 61%, while most of the exchange outflows happened during the same period.

Recent SHIB Holdings
Recent SHIB Holdings: Nansen

That does not look like panic or abandonment. It looks like slow accumulation.

However, it is important to note that derivatives traders are not joining in. Outside of top addresses, leverage positioning remains muted. Whales appear early, but are not aggressive.

Shiba Inu Price Structure Still Weak, but a Reversal Setup Is Emerging

SHIB price action remains fragile, but it is not hopeless.

On the three-day chart, Shiba Inu is trading inside a long-term falling wedge, a pattern that often turns bullish if the price breaks upward. Recently, a key signal appeared.

Between December 3 and December 12, the Shiba Inu price made a lower low while the Relative Strength Index (RSI), a momentum indicator, made a higher low. This bullish divergence suggests selling pressure is weakening, raising the odds of a trend reversal.

Key levels now matter more than narratives.

The first resistance sits near $0.0000092. A clean break above this level would mark a breakout from the upper trendline that has capped the price since September. If confirmed, the next resistance zones lie near $0.000010, $0.000011, and $0.000014, which align with the last major swing high. Do note that only a level break beyond $0.0000092 could completely invalidate the “dead coin” claims.

Shiba Inu Price Analysis
Shiba Inu Price Analysis: TradingView

On the downside, the structure weakens below $0.0000075. A sustained move under that level would invalidate the reversal setup and reopen downside risk.

Shiba Inu is not dead, but it is not strong either. Speculation is gone, traders remain cautious, and quick gains are unlikely. Still, rising holder counts, heavy whale accumulation, and falling exchange balances suggest the chain is far from abandoned.

If an altcoin cycle returns, Shiba Inu still has a path to revival. For now, it remains in survival mode, waiting for stronger confirmation.

The post Will Shiba Inu Die Out In 2026? On-Chain Data Hold the Answer appeared first on BeInCrypto.

  •