Reading view

CPI AS di Sorot saat Investor Menimbang Outlook Suku Bunga The Fed Januari

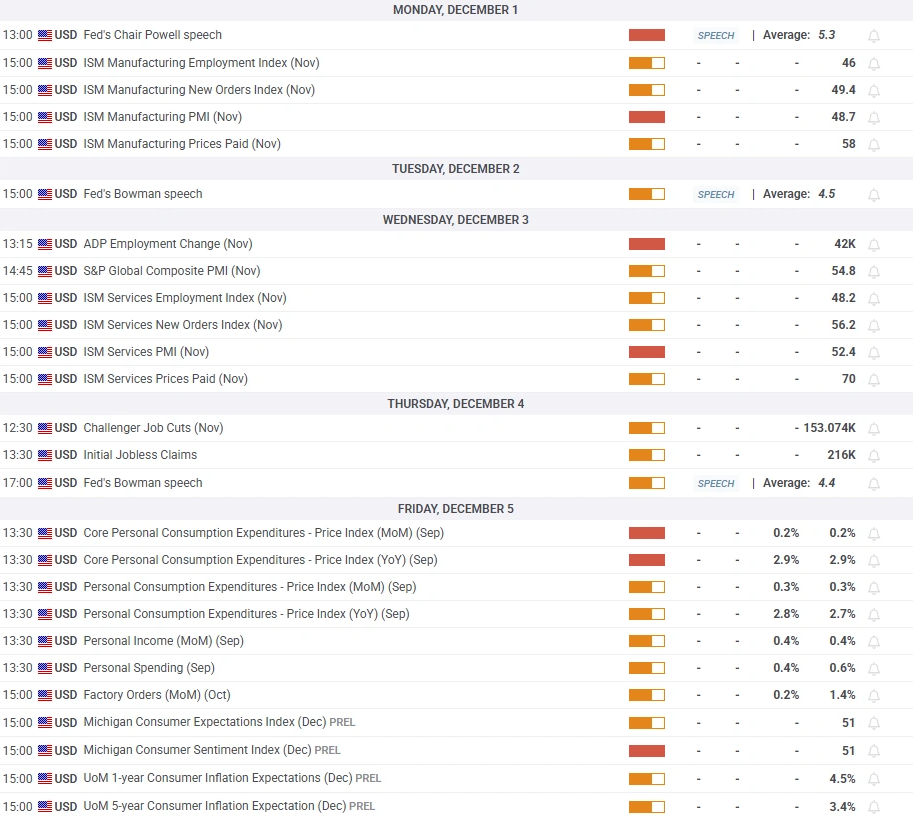
Biro Statistik Tenaga Kerja Amerika Serikat (AS) akan merilis data Consumer Price Index (CPI) yang sangat penting untuk bulan November pada hari Kamis pukul 13:30 GMT.

Laporan inflasi ini tidak akan mencantumkan angka CPI untuk Oktober dan juga tidak menyajikan data CPI bulanan untuk November karena tidak ada pengumpulan data selama penutupan pemerintahan. Oleh karena itu, para investor akan memperhatikan data CPI tahunan dan core CPI untuk menilai bagaimana dinamika inflasi bisa memengaruhi prospek kebijakan The Fed ke depan.

Apa yang bisa diharapkan pada laporan data CPI berikutnya?

Berdasarkan perubahan pada CPI, inflasi di AS diperkirakan naik dengan laju tahunan sebesar 3,1% pada bulan November, sedikit di atas angka bulan September. Inflasi core CPI yang tidak termasuk kategori makanan dan energi yang volatil, juga diprediksi meningkat 3% di periode ini.

Analis TD Securities memperkirakan inflasi tahunan akan naik lebih tinggi dari perkiraan, namun melihat inflasi inti tetap stabil.

“Kami memperkirakan CPI AS akan naik 3,2% y/y pada November – laju tercepat sejak 2024. Peningkatannya akan dipicu oleh kenaikan harga energi, sementara kami prediksi core CPI tetap stabil di 3,0%,” terang mereka.

Bagaimana laporan Consumer Price Index AS bisa memengaruhi US$?

Menjelang pertarungan data inflasi AS pada hari Kamis, investor melihat kemungkinan hampir 20% adanya pemotongan suku bunga The Fed sebesar 25 basis poin di Januari mendatang, menurut alat CME FedWatch.

Laporan ketenagakerjaan resmi BLS yang tertunda menunjukkan pada Selasa bahwa Nonfarm Payrolls turun sebanyak 105.000 di Oktober dan naik sebesar 64.000 di November. Selain itu, Tingkat Pengangguran meningkat menjadi 4,6% dari 4,4% di September. Angka-angka ini tidak mengubah ekspektasi pasar terhadap keputusan The Fed di Januari, sebab penurunan tajam payrolls di Oktober sudah diperkirakan karena hilangnya pekerjaan pemerintah saat penutupan pemerintahan.

Dalam sebuah postingan blog yang dirilis Selasa malam, Presiden The Fed Atlanta Raphael Bostic menyatakan bahwa laporan pekerjaan yang beragam tersebut tidak mengubah prospek kebijakan, dan menambahkan bahwa ada “banyak survei” yang mengindikasikan peningkatan biaya input dan perusahaan bertekad menjaga margin mereka dengan menaikkan harga.

Peningkatan yang nyata, dengan hasil inflasi CPI tahunan sebesar 3,3% atau lebih, bisa memperkuat kebijakan The Fed untuk menahan suku bunga pada Januari dan langsung mendorong US Dollar (USD). Sementara itu, jika inflasi tahunan turun menjadi 2,8% atau lebih rendah, para pelaku pasar bisa mulai memprediksi adanya pemotongan suku bunga The Fed di Januari. Dalam keadaan seperti ini, USD bisa langsung mendapatkan tekanan jual yang cukup berat.

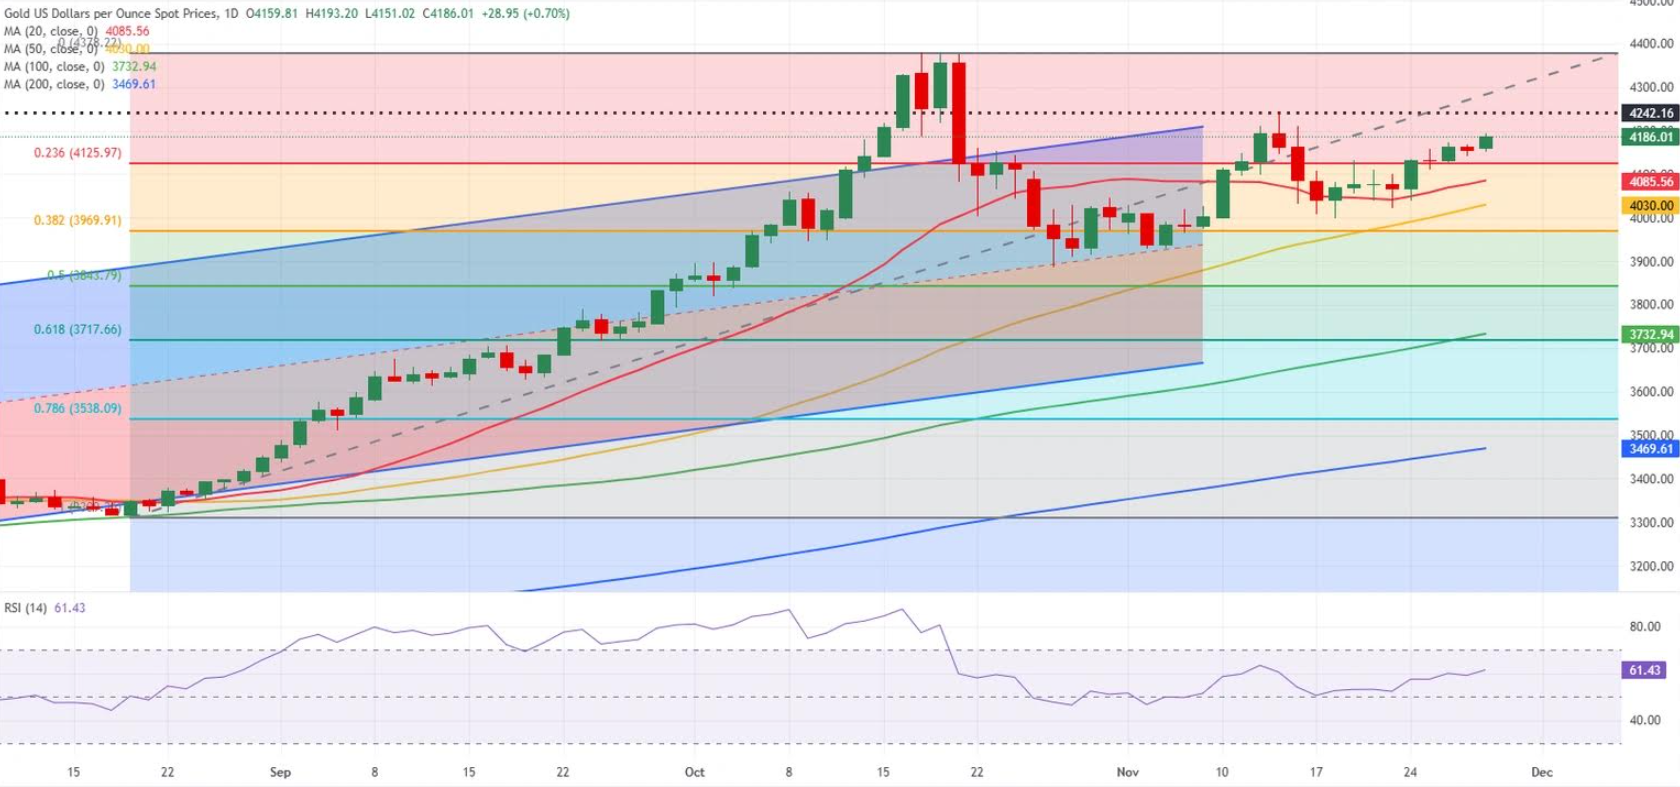
Eren Sengezer, European Session Lead Analyst di FXStreet, membagikan pandangan teknikal singkat untuk US Dollar Index (DXY) dan menguraikan:

“Outlook teknikal jangka pendek menunjukkan bias bearish di USD Index masih bertahan, tapi ada beberapa tanda yang menunjukkan momentum negatif mulai berkurang. Indikator Relative Strength Index (RSI) di grafik harian sudah kembali naik ke atas 40 dan USD Index masih bertahan di atas retracement Fibonacci 50% dari tren naik September-November.”

“Simple Moving Average (SMA) 100-hari berada di level pivot 98,60. Jika USD Index naik di atas level ini dan menegaskannya sebagai support, para penjual teknikal bisa kehilangan kepercayaan. Dalam skenario ini, retracement Fibonacci 38,2% bisa menjadi resistance berikutnya di 98,85 sebelum mencapai area 99,25-99,40, tempat di mana terdapat SMA 200-hari dan retracement Fibonacci 23,6%.”

“Pada sisi bawah, level retracement Fibonacci 61,8% berada di 98,00 sebagai support utama sebelum ke 97,40 (retracement Fibonacci 78,6%) dan 97,00 (angka bulat).”

  •  

US CPI in Focus as Investors Weigh Fed’s January Rate Outlook

The United States (US) Bureau of Labor Statistics (BLS) will publish the all-important Consumer Price Index (CPI) data for November on Thursday at 13:30 GMT. 

The inflation report will not include CPI figures for October and will not offer monthly CPI prints for November due to a lack of data collection during the government shutdown. Hence, investors will scrutinize the annual CPI and core CPI prints to assess how inflation dynamics could influence the Federal Reserve’s (Fed) policy outlook. 

What to expect in the next CPI data report? 

As measured by the change in the CPI, inflation in the US is expected to rise at an annual rate of 3.1% in November, mildly above September’s reading. The core CPI inflation, which excludes the volatile food and energy categories, is also forecast to rise 3% in this period. 

TD Securities analysts expect annual inflation to rise at a stronger pace than anticipated, but see the core inflation holding steady.

“We look for the US CPI to rise 3.2% y/y in November – its fastest pace since 2024. The increase will be driven by rising energy prices, as we look for the core CPI to remain steady at 3.0%,” they explain. 

How could the US Consumer Price Index report affect the US Dollar? 

Heading into the US inflation showdown on Thursday, investors see a nearly 20% probability of another 25-basis-point Fed rate cut in January, according to the CME FedWatch Tool. 

The BLS’ delayed official employment report showed on Tuesday that Nonfarm Payrolls declined by 105,000 in October and rose by 64,000 in November. Additionally, the Unemployment Rate climbed to 4.6% from 4.4% in September. These figures failed to alter the market pricing of the January Fed decision, as the sharp decline seen in payrolls in October was not surprising, given the loss of government jobs during the shutdown.

In a blog post published late Tuesday, Atlanta Fed President Raphael Bostic argued that the mixed jobs report did not change the policy outlook and added that there are “multiple surveys” that suggest there are higher input costs and that firms are determined to preserve their margins by increasing prices. 

A noticeable increase, with a print of 3.3% or higher, in the headline annual CPI inflation, could reaffirm a Fed policy hold in January and boost the US Dollar (USD) with the immediate reaction. On the flip side, a soft annual inflation print of 2.8% or lower could cause market participants to lean toward a January Fed rate cut. In this scenario, the USD could come under heavy selling pressure with the immediate reaction. 

Eren Sengezer, European Session Lead Analyst at FXStreet, offers a brief technical outlook for the US Dollar Index (DXY) and explains: 

“The near-term technical outlook suggests that the bearish bias remains intact for the USD Index, but there are signs pointing to a loss in negative momentum. The Relative Strength Index (RSI) indicator on the daily chart recovers above 40 and the USD Index holds above the Fibonacci 50% retracement of the September-November uptrend.”

“The 100-day Simple Moving Average (SMA) aligns as a pivot level at 98.60. In case the USD Index rises above this level and confirms it as support, technical sellers could be discouraged. In this scenario, the Fibonacci 38.2% retracement could act as the next resistance level at 98.85 ahead of the 99.25-99.40 region, where the 200-day SMA and the Fibonacci 23.6% retracement are located.” 

“On the downside, the Fibonacci 61.8% retracement level forms a key support level at 98.00 before 97.40 (Fibonacci 78.6% retracement) and 97.00 (round level).”

The post US CPI in Focus as Investors Weigh Fed’s January Rate Outlook appeared first on BeInCrypto.

  •  

Prediksi Mingguan Bitcoin: The Fed Umumkan Kebijakan Baru, Tapi Belum Berhasil Meyakinkan Trader BTC

Bitcoin (BTC) masih bergerak di fase konsolidasi terbaru, berada di sekitar US$90.000 pada waktu publikasi hari Jumat, karena investor mencerna keputusan hati-hati The Fed soal pemangkasan suku bunga Desember dan dampaknya pada aset berisiko.

Pergerakan harga BTC mendekati garis tren turun kunci yang bisa menentukan arah selanjutnya. Sementara itu, arus institusi ke exchange-traded fund (ETF) Bitcoin spot menunjukkan masuknya dana yang ringan, dan Strategy menambah lebih banyak BTC ke cadangan treasury mereka.

Tone kebijakan The Fed picu konsolidasi pada Bitcoin

Harga Bitcoin memulai minggu dengan positif, memperpanjang pemulihan akhir pekan di paruh pertama minggu tersebut dan bertahan di atas US$92.600 pada hari Selasa.

namun, momennya melunak pada hari Rabu, dengan BTC ditutup di US$92.015 setelah rapat Federal Open Market Committee (FOMC).

Sesuai perkiraan banyak pihak, The Fed memangkas suku bunga sebesar 25 basis poin. tapi, rapat FOMC memberi sinyal kemungkinan jeda pada bulan Januari.

Menambah suasana hati-hati, para pembuat kebijakan hanya memproyeksikan pemotongan suku bunga satu langkah kecil untuk pandangan keseluruhan tahun 2026, sama seperti proyeksi bulan September, sehingga ekspektasi pasar soal dua kali pemotongan suku bunga pun menurun dan menambah tekanan jangka pendek pada aset berisiko.

Nada hati-hati The Fed, ditambah pendapatan Oracle yang mengecewakan, mendorong aksi risk-off untuk sementara waktu.

Semua faktor ini membebani aset berisiko, di mana aset kripto dengan kapitalisasi pasar terbesar ini turun ke level terendah US$89.260 sebelum akhirnya rebound dan ditutup di atas US$92.500 pada hari Kamis.

Dengan tidak adanya rilis data besar dari AS, pasar kripto kini akan memperhatikan pidato anggota FOMC dan sentimen risiko yang lebih luas untuk menentukan arah

menjelang akhir pekan.

BTC kemungkinan akan bergerak konsolidasi dalam waktu dekat kecuali ada katalis kuat yang muncul.

Ketidakpastian Rusia-Ukraina membatasi momentum risk-on

Dari aspek geopolitik, Presiden AS Donald Trump “sangat frustrasi” dengan Rusia dan Ukraina, dan ia tak mau ada pembicaraan lagi, ucap juru bicaranya pada hari Kamis.

Sebelumnya, Presiden Ukraina Volodymyr Zelenskyy mengatakan bahwa AS mendorong negaranya untuk menyerahkan wilayah ke Rusia sebagai bagian dari kesepakatan untuk mengakhiri perang yang hampir berlangsung empat tahun tersebut.

Ketegangan geopolitik yang masih terjadi dan negosiasi damai yang buntu ini terus membebani sentimen risiko global, sehingga minat mengambil risiko pun terbatas dan Bitcoin pun bergerak konsolidasi sejauh pekan ini.

Permintaan institusional mulai menunjukkan tanda-tanda perbaikan

Permintaan institusi untuk Bitcoin menunjukkan tanda-tanda perbaikan ringan.

Berdasarkan data SoSoValue, exchange-traded fund (ETF) Bitcoin spot yang terdaftar di AS mencatat arus masuk total sebesar US$237,44 juta hingga hari Kamis, setelah sebelumnya tercatat arus keluar ringan US$87,77 juta seminggu sebelumnya, menandakan minat investor institusi mulai sedikit meningkat.

namun, arus masuk mingguan ini masih terbilang kecil dibandingkan pertengahan September. Agar BTC bisa melanjutkan pemulihan, arus dana masuk ETF harus semakin besar.

Grafik Arus Bersih Masuk Total ETF Bitcoin Spot | Sumber: SoSoValue 

Dari sisi korporat, Strategy Inc. (MSTR) mengumumkan pada hari Senin bahwa mereka membeli 10.624 Bitcoin senilai US$962,7 juta pada periode 1–7 Desember dengan rata-rata harga US$90.615.

Perusahaan kini memiliki 660.624 BTC, senilai US$49,35 miliar. Strategy masih punya kapasitas besar untuk menghimpun modal tambahan, sehingga masih mungkin mengakumulasi Bitcoin dalam skala besar ke depannya.

Data on-chain menunjukkan tekanan jual mulai mereda

Laporan mingguan CryptoQuant pada hari Rabu menyoroti bahwa tekanan jual atas Bitcoin mulai mereda.

Laporan tersebut menerangkan bahwa deposit ke exchange berkurang seiring pemain besar menurunkan transfer mereka ke exchange.

Grafik di bawah ini memperlihatkan porsi deposit total dari pemain besar telah turun dari rata-rata 24 jam tertinggi 47% di pertengahan November menjadi 21% pada hari Rabu.

Pada saat bersamaan, rata-rata deposit juga turun 36% dari 1,1 BTC pada 22 November menjadi 0,7 BTC.

Arus Bitcoin di Exchange | Sumber: CryptoQuant

CryptoQuant menyimpulkan jika tekanan jual tetap rendah, reli pemulihan bisa mendorong Bitcoin kembali ke US$99.000. Level ini adalah batas bawah Trader On-chain Realized Price bands, yaitu resistance harga di masa bear market.

Setelah level ini, resistance harga kunci berikutnya ada di US$102.000 (rata-rata pergerakan satu tahun) dan US$112.000 (Trader On-chain Realized price).

Rentang Harga Realisasi Trader Bitcoin

Laporan riset Copper juga menunjukkan sikap optimistis terhadap Bitcoin. Laporan tersebut menyarankan bahwa siklus empat tahun BTC belumlah berakhir; melainkan telah digantikan.

Sejak peluncuran exchange-traded fund (ETF) Bitcoin spot, Bitcoin memperlihatkan siklus Cost-Basis Return yang berulang, seperti yang ditampilkan pada grafik di bawah ini.

Harga Bitcoin USD Vs Biaya Dasar ETF

Fadi Aboualfa, Kepala Riset di Copper, menyampaikan kepada FXStreet bahwa “Sejak ETF spot diluncurkan, Bitcoin bergerak dalam mini-siklus yang berulang di mana harga turun ke biaya dasarnya lalu rebound sekitar 70%.”

Saat ini BTC diperdagangkan dekat biaya dasarnya di kisaran US$84.000, sehingga pola ini mengisyaratkan potensi kenaikan melampaui US$140.000 dalam 180 hari ke depan.

Jika biaya dasar naik 10-15%, seperti pada siklus sebelumnya, maka premium yang terjadi di puncak sebelumnya menghasilkan target kisaran antara US$138.000 sampai US$148.000.

Reli Santa Bitcoin di Depan Mata?

Bitcoin mengalami penurunan sebesar 17,67% di bulan November, yang mengecewakan trader karena mereka berharap reli berdasarkan performa historis yang kuat untuk bulan tersebut (lihat data CoinGlass di bawah).

Desember secara historis menjadi bulan positif untuk raja aset kripto ini, dengan rata-rata kenaikan sebesar 4,55%.

Imbal Hasil Bulanan Bitcoin | Sumber: CoinGlass

Jika melihat data kuartal, kuartal keempat (Q4) biasanya menjadi periode terbaik untuk BTC, dengan rata-rata imbal hasil mencapai 77,38%.

tetapi, kinerja dalam tiga bulan terakhir di tahun 2025 sejauh ini belum memuaskan, karena tercatat mengalami penurunan sebesar 19% hingga saat ini.

Apakah BTC sedang membentuk bottom?

Grafik mingguan Bitcoin menunjukkan harga menemukan support di sekitar Exponential Moving Average (EMA) 100-mingguan di US$85.809, di mana tercatat dua candle hijau berturut-turut setelah empat minggu koreksi yang dimulai sejak akhir Oktober.

Pada pekan ini, BTC diperdagangkan sedikit menguat dan bertahan di atas US$92.400.

Jika BTC melanjutkan pemulihannya, reli bisa berlanjut menuju EMA 50-mingguan di US$99.182.

Pada grafik mingguan, nilai Relative Strength Index (RSI) berada di angka 40, mengarah naik serta menandakan tekanan bearish mulai mereda. Untuk memperkuat reli pemulihan, RSI sebaiknya bergerak di atas level netral 50.

Grafik mingguan BTC/USDT

Pada grafik harian, harga Bitcoin tertahan di level 61,8% Fibonacci retracement pada US$94.253 (yang ditarik dari harga terendah April di US$74.508 sampai rekor tertinggi sepanjang masa di US$126.199 pada Oktober) pada hari Rabu.

namun, pada hari Kamis, BTC kembali naik setelah melakukan retest di level psikologis US$90.000.

Jika BTC mampu menembus descending trendline (yang ditarik dengan menghubungkan beberapa titik tertinggi sejak awal Oktober) dan ditutup di atas level resistance US$94.253

maka reli bisa berlanjut menuju level psikologis US$100.000.

Pada grafik harian, Relative Strength Index (RSI) stabil di kisaran netral 50, yang menandakan tidak ada momentum signifikan ke salah satu arah dalam jangka pendek.

Agar momentum bullish berlanjut, RSI perlu bergerak di atas level netral tersebut.

Sementara itu, Moving Average Convergence Divergence (MACD) menunjukkan bullish crossover di akhir November dan masih bertahan, sehingga mendukung pandangan optimistis.

Grafik Harian BTC/USDT

Jika BTC kembali melanjutkan koreksi turun, support utama pertama berada di US$85.569, yang sejajar dengan level Fibonacci retracement 78,6%.

  •  

Bitcoin Weekly Forecast: Fed Delivers, Yet Fails to Impress BTC Traders

Bitcoin (BTC) continues to trade within the recent consolidation phase, hovering around $90,000 at the time of writing on Friday, as investors digest the Federal Reserve’s (Fed) cautious December rate cut and its implications for risk assets. 

BTC price action approaches a key descending trendline that could determine its next directional move. Meanwhile, institutional flows into Spot Bitcoin ETFs showed mild inflows, and Strategy added more BTC to its treasury reserve.

Fed’s Policy Tone Triggers Consolidation in Bitcoin

Bitcoin price started the week on a positive note, extending its weekend recovery during the first half of the week and holding above $92,600 on Tuesday. 

However, momentum softened on Wednesday, with BTC closing at $92,015 after the Federal Open Market Committee (FOMC) meeting. 

In a widely expected move, the Fed lowered interest rates by 25 basis points. But the FOMC meeting signaled a likely pause in January. 

Adding to the cautious tone, policymakers projected only a one-quarter-percentage-point cut for the overall 2026 outlook. This was the same outlook as in September, which tempered market expectations of two rate cuts and contributed to short-term pressure on risk assets. 

The Fed’s cautious tone, combined with disappointing Oracle earnings, contributed to a brief risk-off move. 

All these factors weighed on riskier assets, with the largest cryptocurrency by market capitalization sliding to a low of $89,260 before rebounding and finishing above $92,500 on Thursday. 

With no major US data releases ahead, crypto markets will now look to FOMC member speeches and broader risk sentiment for direction

at the end of the week. 

BTC is likely to consolidate in the near term unless a significant catalyst emerges. 

Russia-Ukraine Uncertainty Limits Risk-on Momentum 

On the geopolitical front, US President Donald Trump is “extremely frustrated” with Russia and Ukraine, and he doesn’t want any more talk, his spokeswoman said on Thursday. 

Earlier, Ukrainian President Volodymyr Zelenskyy said that the US was pushing the country to cede land to Russia as part of an agreement to end a nearly four-year war. 

These lingering geopolitical tensions and stalled peace talks continue to weigh on global risk sentiment, limiting risk-on appetite and contributing to Bitcoin’s consolidation so far this week

Institutional Demand Sees Mild Signs of Improvement 

Institutional demand for Bitcoin shows mild signs of improvement. 

According to SoSoValue data, US-listed spot Bitcoin ETFs recorded a total inflow of $237.44 million through Thursday, following a mild outflow of $87.77 million a week earlier, signaling that institutional investor interest improved somewhat. 

However, these weekly inflows remain small relative to those observed in mid-September. For BTC to continue its recovery, the ETF inflows should intensify. 

Total Bitcoin Spot ETF Net Inflow Chart. Source: SoSoValue 

On the corporate front, Strategy Inc. (MSTR) announced on Monday that it purchased 10,624 Bitcoin for $962.7 million between December 1 and 7 at an average price of $90,615. 

The firm currently holds 660,624 BTC, valued at $49.35 billion. Strategy still retains substantial capacity to raise additional capital, potentially allowing for further large-scale Bitcoin accumulation. 

On-Chain Data Shows Easing Selling Pressure 

CryptoQuant’s weekly report on Wednesday highlights that selling pressure on Bitcoin is beginning to ease.

The report notes that exchange deposits eased as large players reduced their transfers to exchanges. 

The graph below shows that the share of total deposits from large players has declined from a 24-hour average high of 47% in mid-November to 21% as of Wednesday. 

At the same time, the average deposit has declined by 36%, from 1.1 BTC in November 22 to 0.7 BTC. 

Bitcoin Exchange Flows. Source: CryptoQuant

CryptoQuant concludes that, if selling pressure remains low, a relief rally could push Bitcoin back to $99,000. This level is the lower band of the Trader On-chain Realized Price bands, which is a price resistance during bear markets. 

After this level, the key price resistances are $102,000 (one-year moving average) and $112,000 (the Trader On-chain Realized price).

Bitcoin Trader’s Realized Price Bands

The Copper Research report also signaled optimism about Bitcoin. The report suggests that BTC’s four-year cycle hasn’t died; it has been replaced. 

Since the launch of spot ETFs, Bitcoin has exhibited repeatable Cost-Basis Return Cycles, as shown in the graph below.

Bitcoin USD Price Vs ETF Cost Basis

Fadi Aboualfa, Head of Research at Copper, told FXStreet that “Since spot ETFs launched, Bitcoin has moved in repeatable mini-cycles where it pulls back to its cost basis and then rebounds by around 70%. 

With BTC now trading near its $84,000 cost basis, this pattern suggests a move north of $140,000 in the next 180 days. 

If the cost basis rises 10-15%, as in prior cycles, the resulting premium seen at past peaks produces a target range of $138,000 to $148,000. 

Bitcoin Santa Rally Ahead? 

Bitcoin posted a 17.67% loss in November, disappointing traders who had anticipated a rally based on its strong historical returns for the month (see CoinGlass data below). 

December has historically been a positive month for the king crypto, delivering an average return of 4.55%.

Bitcoin Monthly Returns. Source: CoinGlass

Looking at quarterly data, the fourth quarter (Q4) has been the best quarter for BTC in general, with an average return of 77.38%. 

Still, the performance in the last three months of 2025 has been underwhelming so far, posting for now a 19% loss.

Is BTC Setting a Bottom? 

Bitcoin’s weekly chart shows the price finding support around the 100-week Exponential Moving Average (EMA) at $85,809, posting two consecutive green candles following a four-week correction that began in late October. 

As of this week, BTC is trading slightly higher, holding above $92,400. 

If BTC continues its recovery, it could extend the rally toward the 50-week EMA at $99,182.

The Relative Strength Index (RSI) on the weekly chart reads 40, pointing upward and indicating fading bearish momentum. For the recovery rally to be sustained, the RSI should move above the neutral level of 50. 

BTC/USDT weekly chart 

On the daily chart, Bitcoin’s price was rejected at the 61.8% Fibonacci retracement level at $94,253 (drawn from the April low of $74,508 to the all-time high of $126,199 set in October) on Wednesday. 

However, on Thursday, BTC rebounded after retesting its $90,000 psychological level. 

If BTC breaks above the descending trendline (drawn by connecting multiple highs since early October) and closes above the $94,253

resistance level, it could extend the rally toward the $100,000 psychological level. 

The Relative Strength Index (RSI) on the daily chart is stable near the neutral 50 level, suggesting the lack of near-term momentum in either side. 

For the bullish momentum to be sustained, the RSI should move above the neutral level. 

Meanwhile, the Moving Average Convergence Divergence (MACD) showed a bullish crossover at the end of November, which remains intact, supporting the bullish thesis. 

BTC/USDT Daily Chart 

If BTC were to resume its downward correction, the first key support is at $85,569, which aligns with the 78.6% Fibonacci retracement level.

The post Bitcoin Weekly Forecast: Fed Delivers, Yet Fails to Impress BTC Traders appeared first on BeInCrypto.

  •  

Gold Weekly Forecast: Bulls Show Interest as Fed Cut Odds Grow

Gold (XAU/USD) gained momentum early in the week as expectations for a Federal Reserve rate cut strengthened. Markets then slowed due to the US Thanksgiving holiday, yet the metal still rose more than 2% on the week. 

With the Fed’s blackout period starting on Saturday, investors will now shift focus to incoming US data.

Gold Rises as Fed Doves Grow Louder

Gold opened the week strong as traders reassessed the probability of a 25-basis-point cut in December. 

Late last week, Fed Governor Stephen Miran said he would support a 25 bps cut if his vote became decisive. His recent stance contrasts with his earlier preference for a 50 bps cut in previous meetings.

New York Fed President John Williams also signaled openness to easing. He said monetary policy remained “modestly restrictive,” adding there was room for a further adjustment soon.

Gold jumped more than 1.5% on Monday. It edged higher again on Tuesday before closing flat. ADP data showed that private employers shed an average of 13,500 jobs each week through November 8.

Gold to silver ratio (GTS) broke down a 14-year rising support. Immediate support comes at 72.
With gold price at $4,500 and GTS 72, silver to reach at least $62. This could be the case already next week…

This post is not an investment advice… pic.twitter.com/3rLptnAwpu

— Rashad Hajiyev (@hajiyev_rashad) November 28, 2025

Fresh US data on Wednesday showed 216,000 initial jobless claims for the week ending November 22, down 6,000 from the prior period. 

Durable goods orders rose 0.5% in September, beating expectations of 0.3%. These numbers did not alter Fed expectations, and Gold held firm above $4,100 ahead of the holiday.

Trading remained thin on Friday, but Gold stayed near the upper end of its weekly range.

Gold Investors Turn to US Data

Fed officials cannot comment again until the December 9–10 meeting. As a result, markets will rely on US data to gauge the likelihood of a rate cut.

According to the CME FedWatch Tool, traders now assign roughly an 85% chance of a 25 bps cut in December.

The US calendar begins with ISM Manufacturing PMI on Monday. A stronger employment index — especially a reading above 50 — could support the US dollar and weigh on XAU/USD.

The ISM Services PMI follows on Wednesday. A drop below 50 would signal contraction and could pressure the USD, offering support to Gold.

US Economic Calender For the First Week of December

Investors will also watch Thursday’s Challenger Job Cuts report. Layoffs surged to 153,074 in October, the highest level in 22 years. A sharp drop would ease labor-market concerns and may support the USD.

The BEA releases PCE Price Index data on Friday. However, this report covers September due to earlier backlog and is unlikely to move markets.

Gold Technical Analysis

The short-term technical view remains constructive, though momentum has not strengthened further. 

On the daily chart, Gold trades comfortably above the 20-day Simple Moving Average and the 23.6% Fibonacci retracement of the August–October rally at $4,125. The RSI holds near 60 and moves sideways.

Gold Price Chart

Support sits at $4,125 before $4,085 (20-day SMA), $4,030 (50-day SMA), and $3,970 (38.2% Fibonacci retracement). On the upside, resistance stands at $4,245, followed by $4,300 and $4,380.

The post Gold Weekly Forecast: Bulls Show Interest as Fed Cut Odds Grow appeared first on BeInCrypto.

  •  

RBNZ Diprediksi Akan Memotong Suku Bunga Menjadi 2,25% pada November

Diperkirakan Bank Sentral Selandia Baru (RBNZ) akan memangkas Suku Bunga Acuan (OCR) menjadi 2,25% dari 2,5%, mengikuti pertemuan kebijakan moneter November pada hari Rabu.

Keputusan ini akan diumumkan pada pukul 01:00 GMT, diikuti oleh Pernyataan Kebijakan Moneter (MPS) dan konferensi pers Gubernur RBNZ Christian Hawkesby pada pukul 02:00 GMT. Dolar Selandia Baru (NZD) kemungkinan besar mengalami reaksi besar terhadap pengumuman kebijakan bank sentral tersebut.

Apa yang diharapkan dari keputusan suku bunga RBNZ?

Setelah pemangkasan suku bunga sebesar 25 basis poin (bps) yang standar pada bulan Agustus dan langkah kejutan sebesar 50 bps pada bulan Oktober, RBNZ diharapkan memberikan hat-trick, dengan pemangkasan 25 bps sepenuhnya disiapkan untuk pertemuan kebijakan moneter November.

Bank sentral memutuskan untuk memilih pemangkasan suku bunga besar dalam keputusan kebijakan terakhirnya di tengah perlambatan ekonomi dan keyakinan bahwa inflasi sudah terkendali.

Dalam Tinjauan Kebijakan Moneter (MPR) bulan Oktober, RBNZ mencatat bahwa “komite tetap terbuka untuk penurunan lebih lanjut dalam OCR sebagaimana diperlukan agar inflasi bisa mencapai target 2 persen secara berkelanjutan dalam jangka menengah.”

Oleh karena itu, pemangkasan suku bunga lainnya pada hari Rabu tidak akan menjadi kejutan.

Maka, semua mata akan tertuju pada diskusi di antara para pembuat kebijakan tentang pelonggaran kebijakan moneter lebih lanjut menuju tahun 2026.

Revisi proyeksi OCR di paruh pertama tahun depan juga akan sangat diperhatikan untuk menilai langkah bank ke depan terkait suku bunga.

Inflasi NZ Terus Meningkat

Sejak pertemuan 8 Oktober, inflasi Indeks Harga Konsumen (CPI) tahunan Selandia Baru meningkat di kuartal ketiga (Q3), mencapai 3,0%, sesuai dengan perkiraan dan di ujung atas rentang target 1% hingga 3% dari bank sentral.

namun, RBNZ menegaskan pada bulan Oktober bahwa inflasi telah meningkat, tetapi mencatat bahwa kapasitas cadangan dalam ekonomi harus membawanya kembali ke 2% pada pertengahan 2026, menunjukkan bahwa para pembuat kebijakan tidak mengharapkan inflasi yang persisten.

Selain itu, inflasi non-perdagangan tahunan turun menjadi 3,5% di Q3, dibandingkan dengan 3,7% di kuartal kedua.

Tambahan lagi, survei kondisi moneter RBNZ menunjukkan pada tanggal 11 November bahwa ekspektasi inflasi dua tahun, yang dipandang sebagai kerangka waktu ketika tindakan kebijakan bank sentral akan berpengaruh terhadap harga, stabil pada 2,28% pada Q4 2025.

Sementara itu, Tingkat Pengangguran Selandia Baru naik menjadi 5,3% di Q3 dari 5,2% di kuartal kedua, menurut data resmi yang dirilis oleh Statistik Selandia Baru pada tanggal 4 November. Angka ini sejalan dengan konsensus pasar.

Di tengah ekspektasi bahwa inflasi dasar sebagian besar melambat, pemangkasan suku bunga lainnya oleh RBNZ dianggap tepat.

Ekonom di Westpac NZ mengatakan: “Kami mengharapkan penurunan 25bp dalam OCR menjadi 2,25%.”

Kami melihat revisi ke bawah pada jalur proyeksi OCR sekitar 30-35bp, dengan titik terendah dalam proyeksi sekitar 2,20% di paruh pertama 2026. Implikasinya adalah bias pelonggaran yang ringan dan bergantung pada data untuk tahun depan.”

Bagaimana keputusan suku bunga RBNZ mempengaruhi Dolar Selandia Baru? 

P pasangan NZD/USD berkutat di posisi terendah tujuh bulan seiring risiko acara RBNZ semakin dekat. Ekspektasi yang tinggi akan pemangkasan suku bunga November telah memberikan tekanan berat pada NZD sejak akhir Oktober.

Jika bank sentral menurunkan perkiraan inflasi dan/atau OCR sambil mempertahankan bias pelonggaran, Dolar Kiwi dapat memperpanjang penurunan saat ini.

Sebaliknya, NZD dapat mengalami reli besar-besaran seandainya RBNZ menandakan berakhirnya siklus pemangkasan suku bunga di tengah prospek ekonomi yang membaik dan meredanya kekhawatiran tarif AS.

Dhwani Mehta, Analis Utama Sesi Asia di FXStreet, menawarkan pandangan teknis singkat untuk NZD/USD dan menjelaskan:

“Dari perspektif teknis jangka pendek, potensi bearish tetap utuh untuk pasangan Kiwi karena Relative Strength Index (RSI) 14-hari tetap rentan jauh di bawah garis tengah.”

“Jika penjual menunjukkan kekuatan pada pemangkasan RBNZ yang dovish, pasangan NZD/USD dapat turun lebih jauh menuju dukungan garis tren menurun di 0,5550. Lebih jauh ke selatan, level bulat 0,5500 dan level terendah April di 0,5486 dapat diuji. Sebaliknya, pasangan ini perlu melewati Simple Moving Average (SMA) 21-hari di 0,5663 secara berkelanjutan untuk pemulihan yang berarti. Target atas yang relevan berikutnya sejajar dengan SMA 50-hari di 0,5735 dan ambang batas 0,5800,” tambah Dhwani.

  •  

RBNZ Expected To Cut Interest Rates To 2.25% In November

The Reserve Bank of New Zealand (RBNZ) is expected to cut the Official Cash Rate (OCR) to 2.25% from 2.5%, following the conclusion of the November monetary policy meeting on Wednesday. 

The decision will be announced at 01:00 GMT, accompanied by the Monetary Policy Statement (MPS) and followed by RBNZ Governor Christian Hawkesby’s press conference at 02:00 GMT. The New Zealand Dollar (NZD) will likely experience a big reaction to the central bank’s policy announcements.  

What to expect from the RBNZ interest rate decision?

Following a standard 25-basis-point (bps) rate cut in August and a surprise 50-bps move in October, the RBNZ is expected to deliver a hat-trick, with a 25-bps reduction fully baked in for the November monetary policy meeting.  

The central bank decided to opt for a big rate cut in its last policy decision in the face of a slowing economy and confidence that inflation was under control

In its October Monetary Policy Review (MPR), the RBNZ noted that the “committee remains open to further reductions in the OCR as required for inflation to settle sustainably near the 2 percent target midpoint in the medium term.” 

Therefore, another rate cut on Wednesday would come as no surprise. 

Hence, all eyes will be on the discussions among the policymakers on further monetary policy easing heading into 2026. 

The revisions to the OCR projection in the first half of next year will also be closely scrutinized to gauge the bank’s path forward on rates. 

NZ Inflation Continues to Accelerate

Since the October 8 meeting, New Zealand’s annual Consumer Price Index (CPI) inflation accelerated in the third quarter (Q3), coming in at 3.0%, in line with the forecasts and at the top end of the central bank’s 1% to 3% target range. 

However, the RBNZ made it clear in October that inflation was ticking higher, but noted that spare capacity in the economy should bring it back to 2% by mid-2026, suggesting that policymakers don’t expect inflation to be persistent. 

On top of that, the annual non-tradeable inflation decreased to 3.5% in Q3, compared with 3.7% in the second quarter. 

Additionally, the RBNZ’s monetary conditions survey showed on November 11 that two-year inflation expectations, seen as the time frame when the central bank policy action will filter through to prices, steadied at 2.28% in Q4 2025. 

Meanwhile, New Zealand’s Unemployment Rate rose to 5.3% in Q3 from 5.2% in the second quarter, according to the official data released by Statistics New Zealand on November 4. The figure aligned with the market consensus. 

Amidst expectations that underlying inflation is largely slowing, another rate cut by the RBNZ is justified. 

Economists at Westpac NZ said: “We expect a 25bp cut in the OCR to 2.25%. 

We see a downward revision in the projected OCR track of around 30-35bp, with a low point in the projection of around 2.20% in the first half of 2026. The implication is a mild and data-dependent easing bias for next year.” 

How will the RBNZ interest rate decision impact the New Zealand Dollar? 

The NZD/USD pair is miring in seven-month lows as the RBNZ event risk looms. Heightened expectations of a November rate cut have weighed heavily on the NZD since the end of October. 

If the central bank downgrades its inflation and/or OCR forecasts while retaining the easing bias, the Kiwi Dollar could extend the current downside. 

On the contrary, the NZD could witness a big relief rally should the RBNZ signal the end of the rate-cutting cycle amid an improving economic outlook and receding US tariff fears. 

Dhwani Mehta, Asian Session Lead Analyst at FXStreet, offers a brief technical outlook for NZD/USD and explains:

“From a near-term technical perspective, bearish potential remains intact for the Kiwi pair as the 14-day Relative Strength Index (RSI) remains vulnerable well beneath the midline.” 

“If sellers flex their muscles on a dovish RBNZ cut, the NZD/USD pair could drop further toward the falling trendline support at 0.5550. Further south, the 0.5500 round level and the April low of 0.5486 could be tested. On the flip side, the pair needs to scale the 21-day Simple Moving Average (SMA) at 0.5663 on a sustained basis for any meaningful recovery. The next relevant topside targets align at the 50-day SMA at 0.5735 and the 0.5800 threshold,” Dhwani adds.

The post RBNZ Expected To Cut Interest Rates To 2.25% In November appeared first on BeInCrypto.

  •