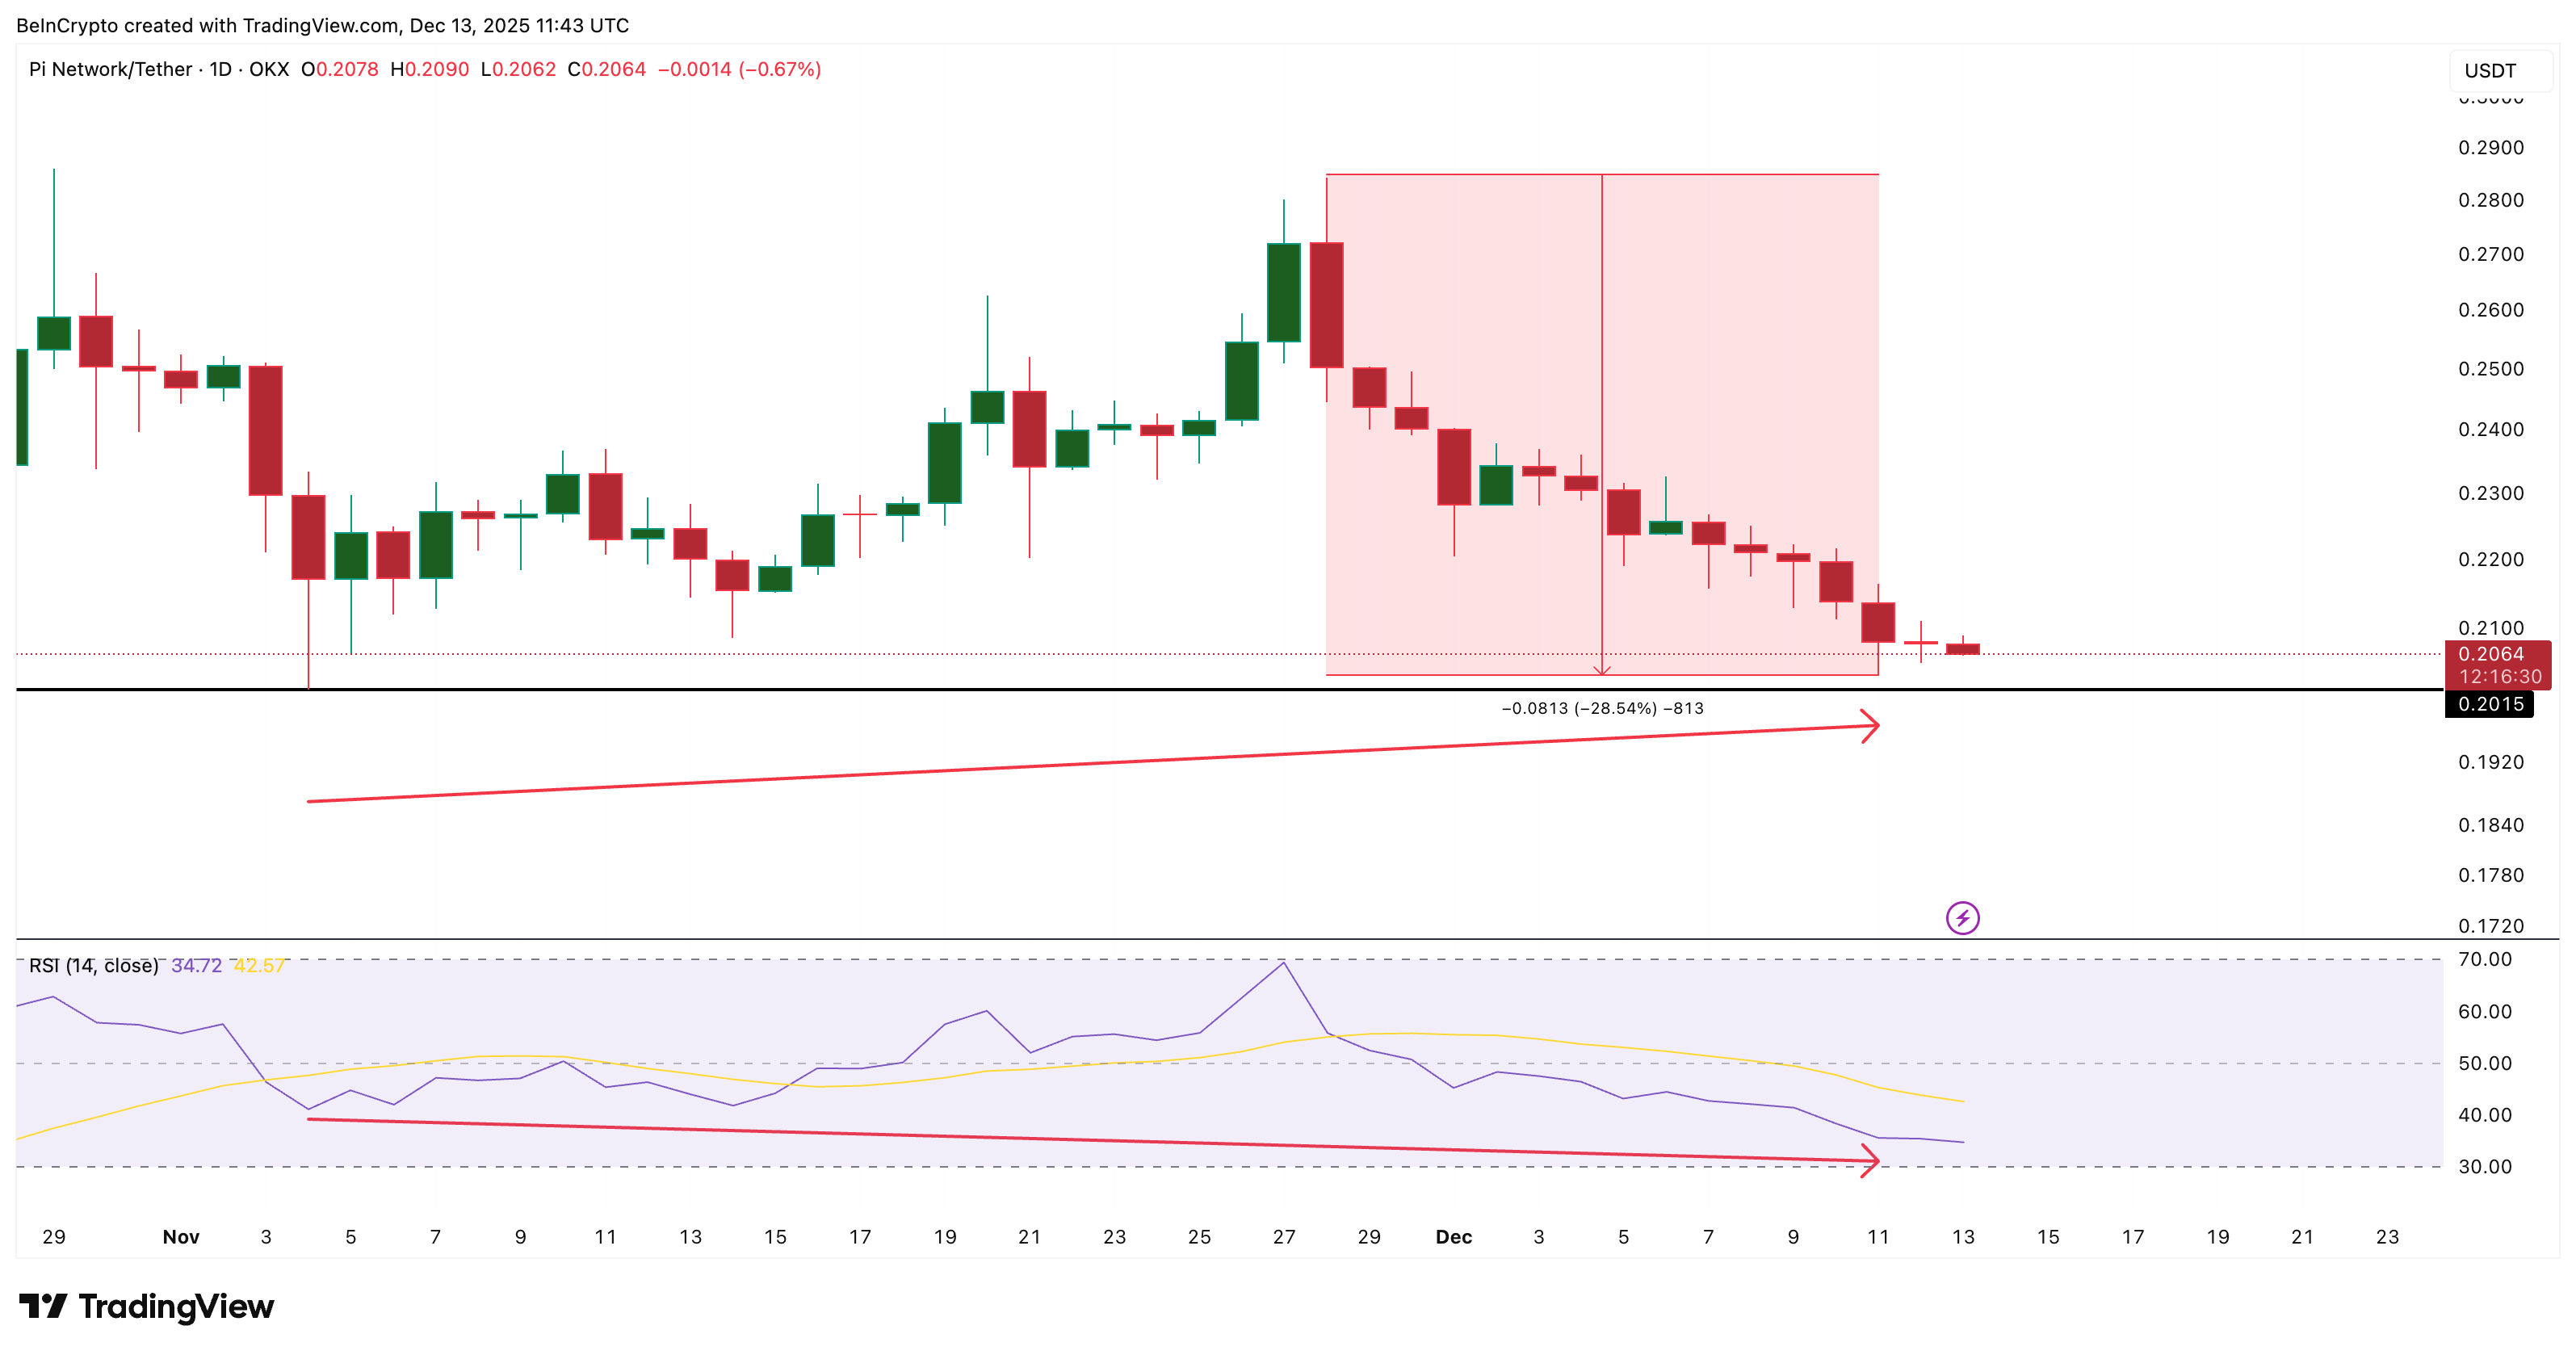
Pi Coin has struggled since late November. After peaking near the end of the month, the price has dropped roughly 28%, erasing most of its earlier gains. Over the past seven days alone, Pi Coin is down about 8.6%, and over the past three months, losses now exceed 40%.
Despite that weakness, the latest chart data shows something new forming beneath the surface. Momentum pressure is starting to shift, raising the question of whether the correction may be nearing a pause. Will the pause lead to a rebound or a complete reversal? Time to find out!
Momentum Pressure Is Easing, But Buyers Are Still Hesitant
On the daily chart, Pi Coin has formed a hidden bullish divergence between November 4 and December 11. During this period, price made a higher low while the Relative Strength Index made a lower low. RSI measures momentum by tracking the speed of buying and selling. When price holds higher levels while momentum weakens, it often signals that selling pressure is starting to fade.
Want more token insights like this? Sign up for Editor Harsh Notariya’s Daily Crypto Newsletter here.
This type of divergence usually appears near the end of sharp dips. It does not confirm a reversal by itself, but it often precedes rebound attempts when sellers begin to lose control.
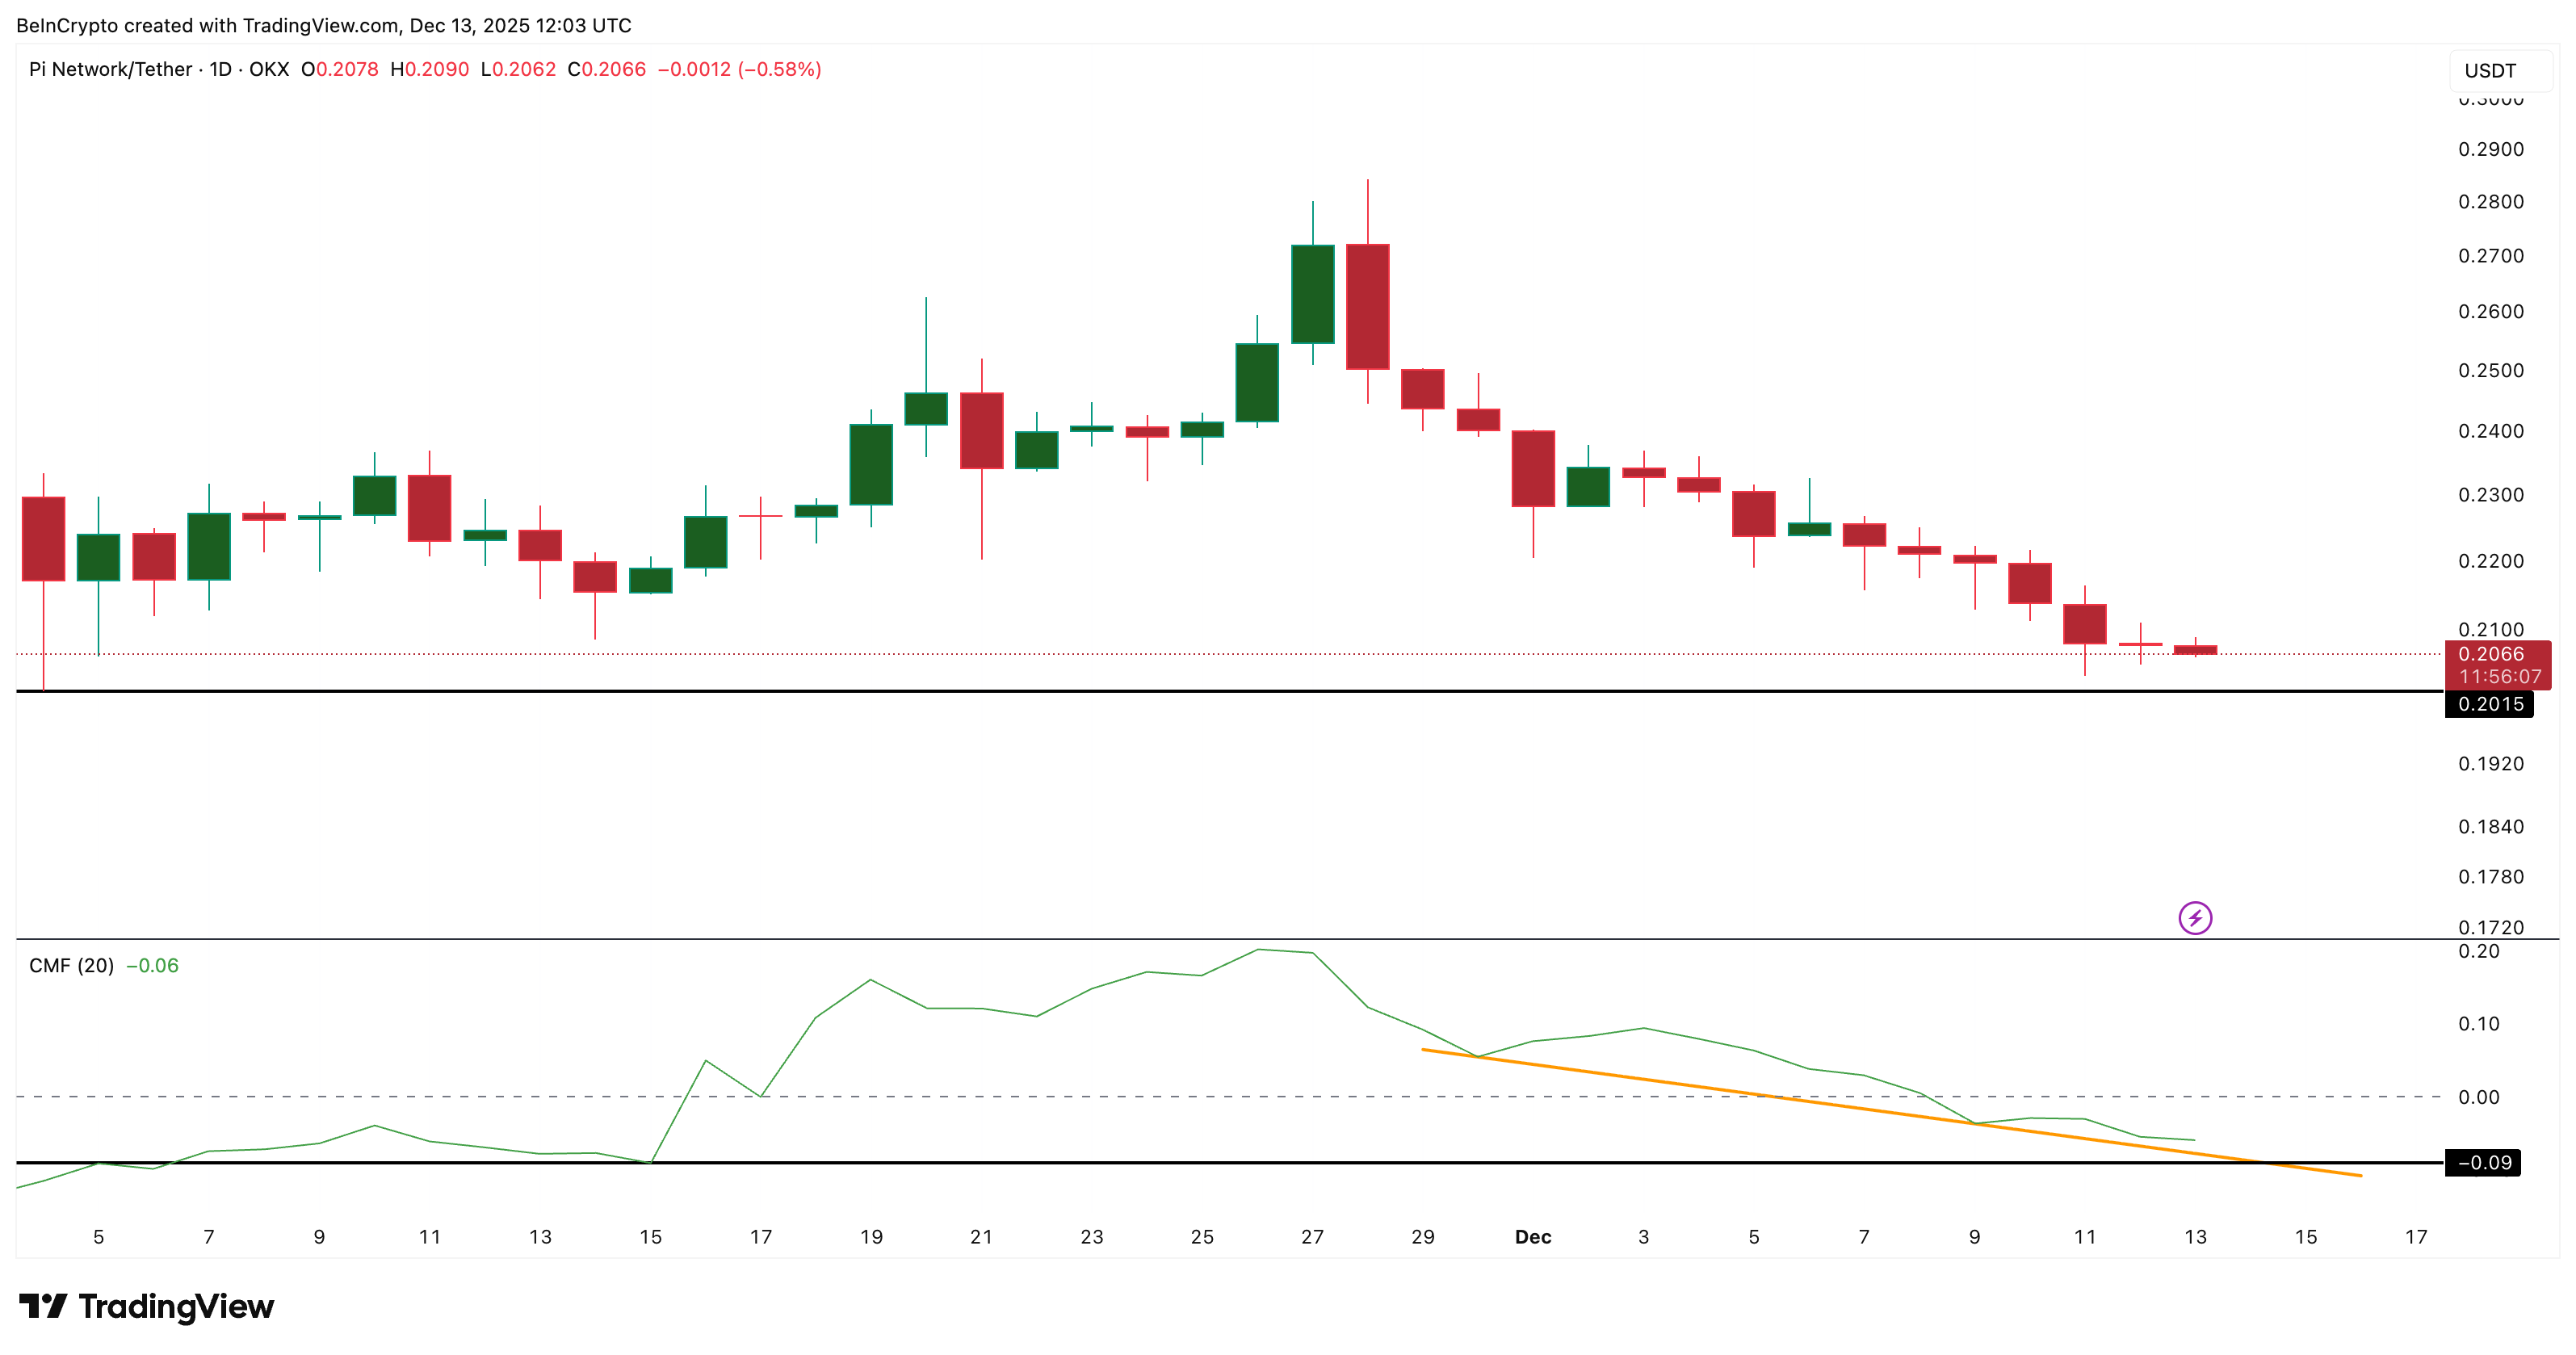
However, momentum alone is not enough. The Chaikin Money Flow, which tracks whether large buyers or sellers are dominating volume, is still flashing caution. CMF remains close to testing its descending trend line (connecting lower lows) and is also trading below the zero line. This shows that big money flows have not turned supportive towards Pi Coin, yet.
In simple terms, selling pressure looks weaker, but the big buyers are not fully committed. That keeps the rebound setup fragile. Until money flow improves, upside attempts are likely to face resistance. And if the CMF breaks below the trendline, the rebound (not reversal) setup for the Pi Network coin might get invalidated, completely.
Pi Coin Price Levels That Decide What’s Next
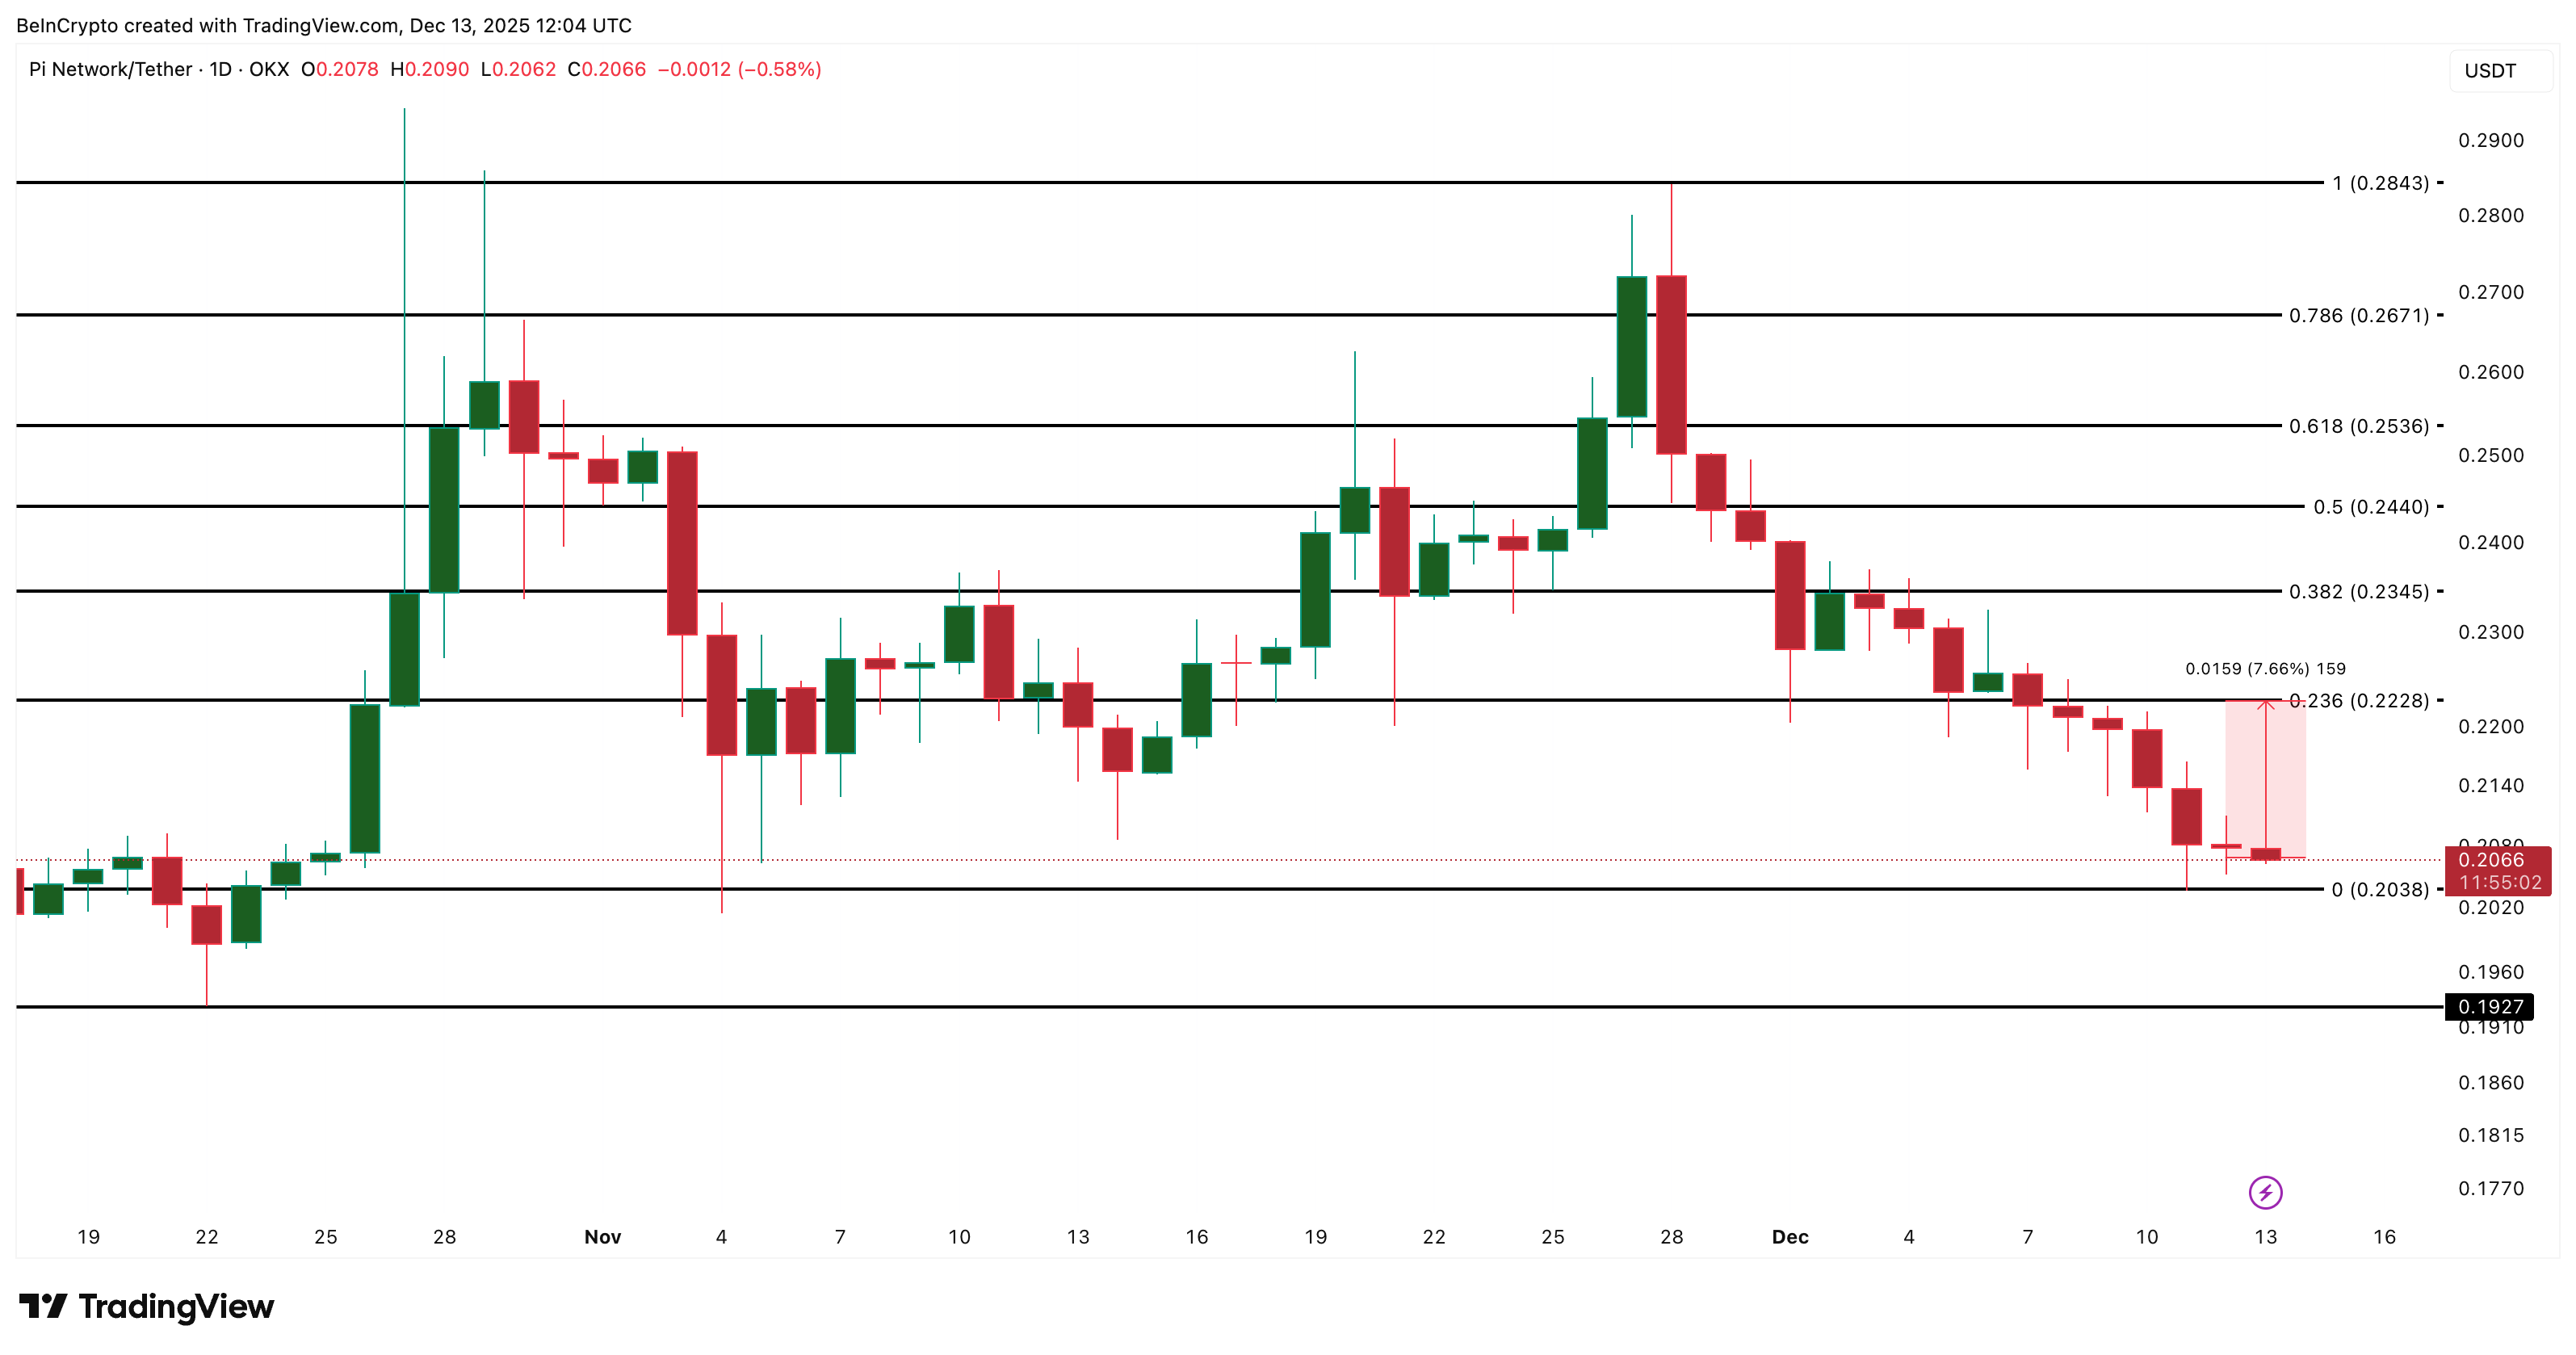
The PI price chart now sits at a decision point. For the rebound structure to gain traction, Pi Coin needs to reclaim the $0.222 area. A sustained move above this level would mark roughly a 7% advance and signal that buyers are willing to defend higher prices again. If that happens, the price could extend toward $0.244 and possibly $0.253, provided broader market conditions stabilize.
Only a price move above $0.284 (late November high) could signal a reversal attempt. That point seems to be far off now.
Support remains just below current levels. The $0.203 zone is critical. A daily close below $0.203 would weaken the rebound case significantly and expose the downside again. If that level fails, Pi Coin could retest lower areas and push the correction into a new leg.
The rebound setup only strengthens if the price moves higher while the CMF begins to rise toward zero. Without that confirmation, upside attempts risk stalling quickly.
The Zcash price has seen a sharp run this cycle, up over 700% in three months, followed by a healthy pause. After rallying strongly through the last week, the price is now pulling back, raising questions about whether momentum is fading or simply resetting.
While short-term price action looks undecided, on-chain and volume data suggest buyers may still be quietly in control. The next move depends on whether Zcash can turn consolidation into continuation.
Buyers Still Control Structure Despite Cooling Volume
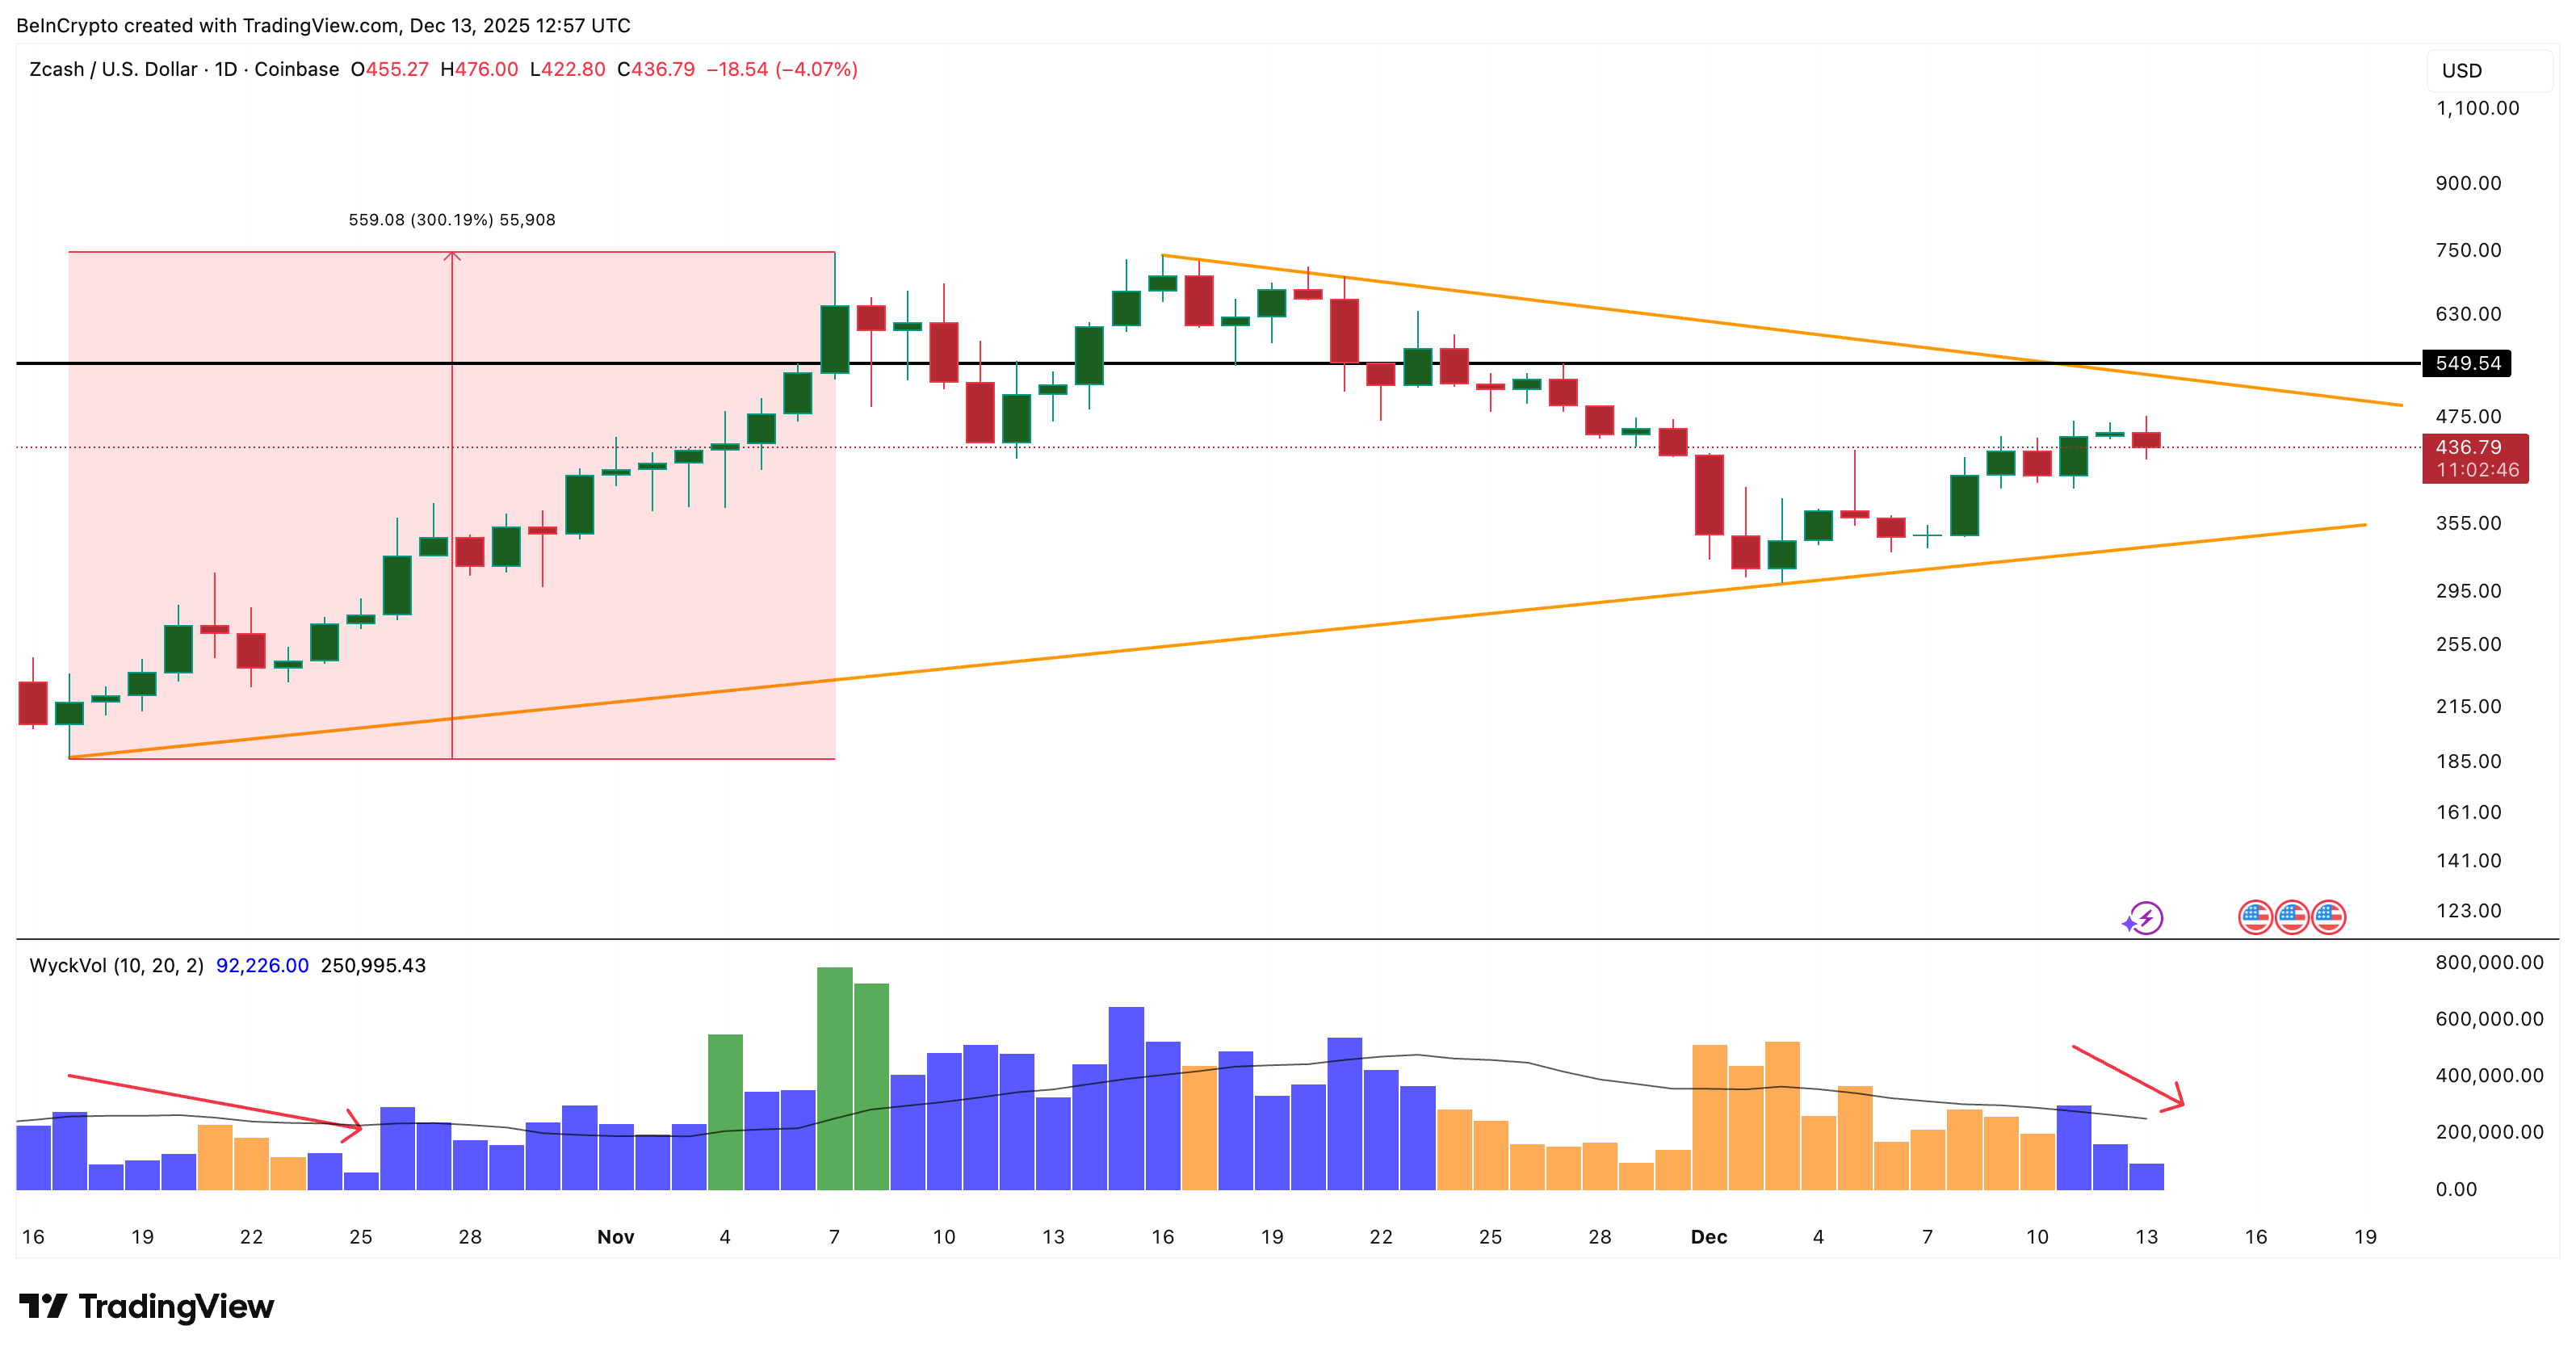
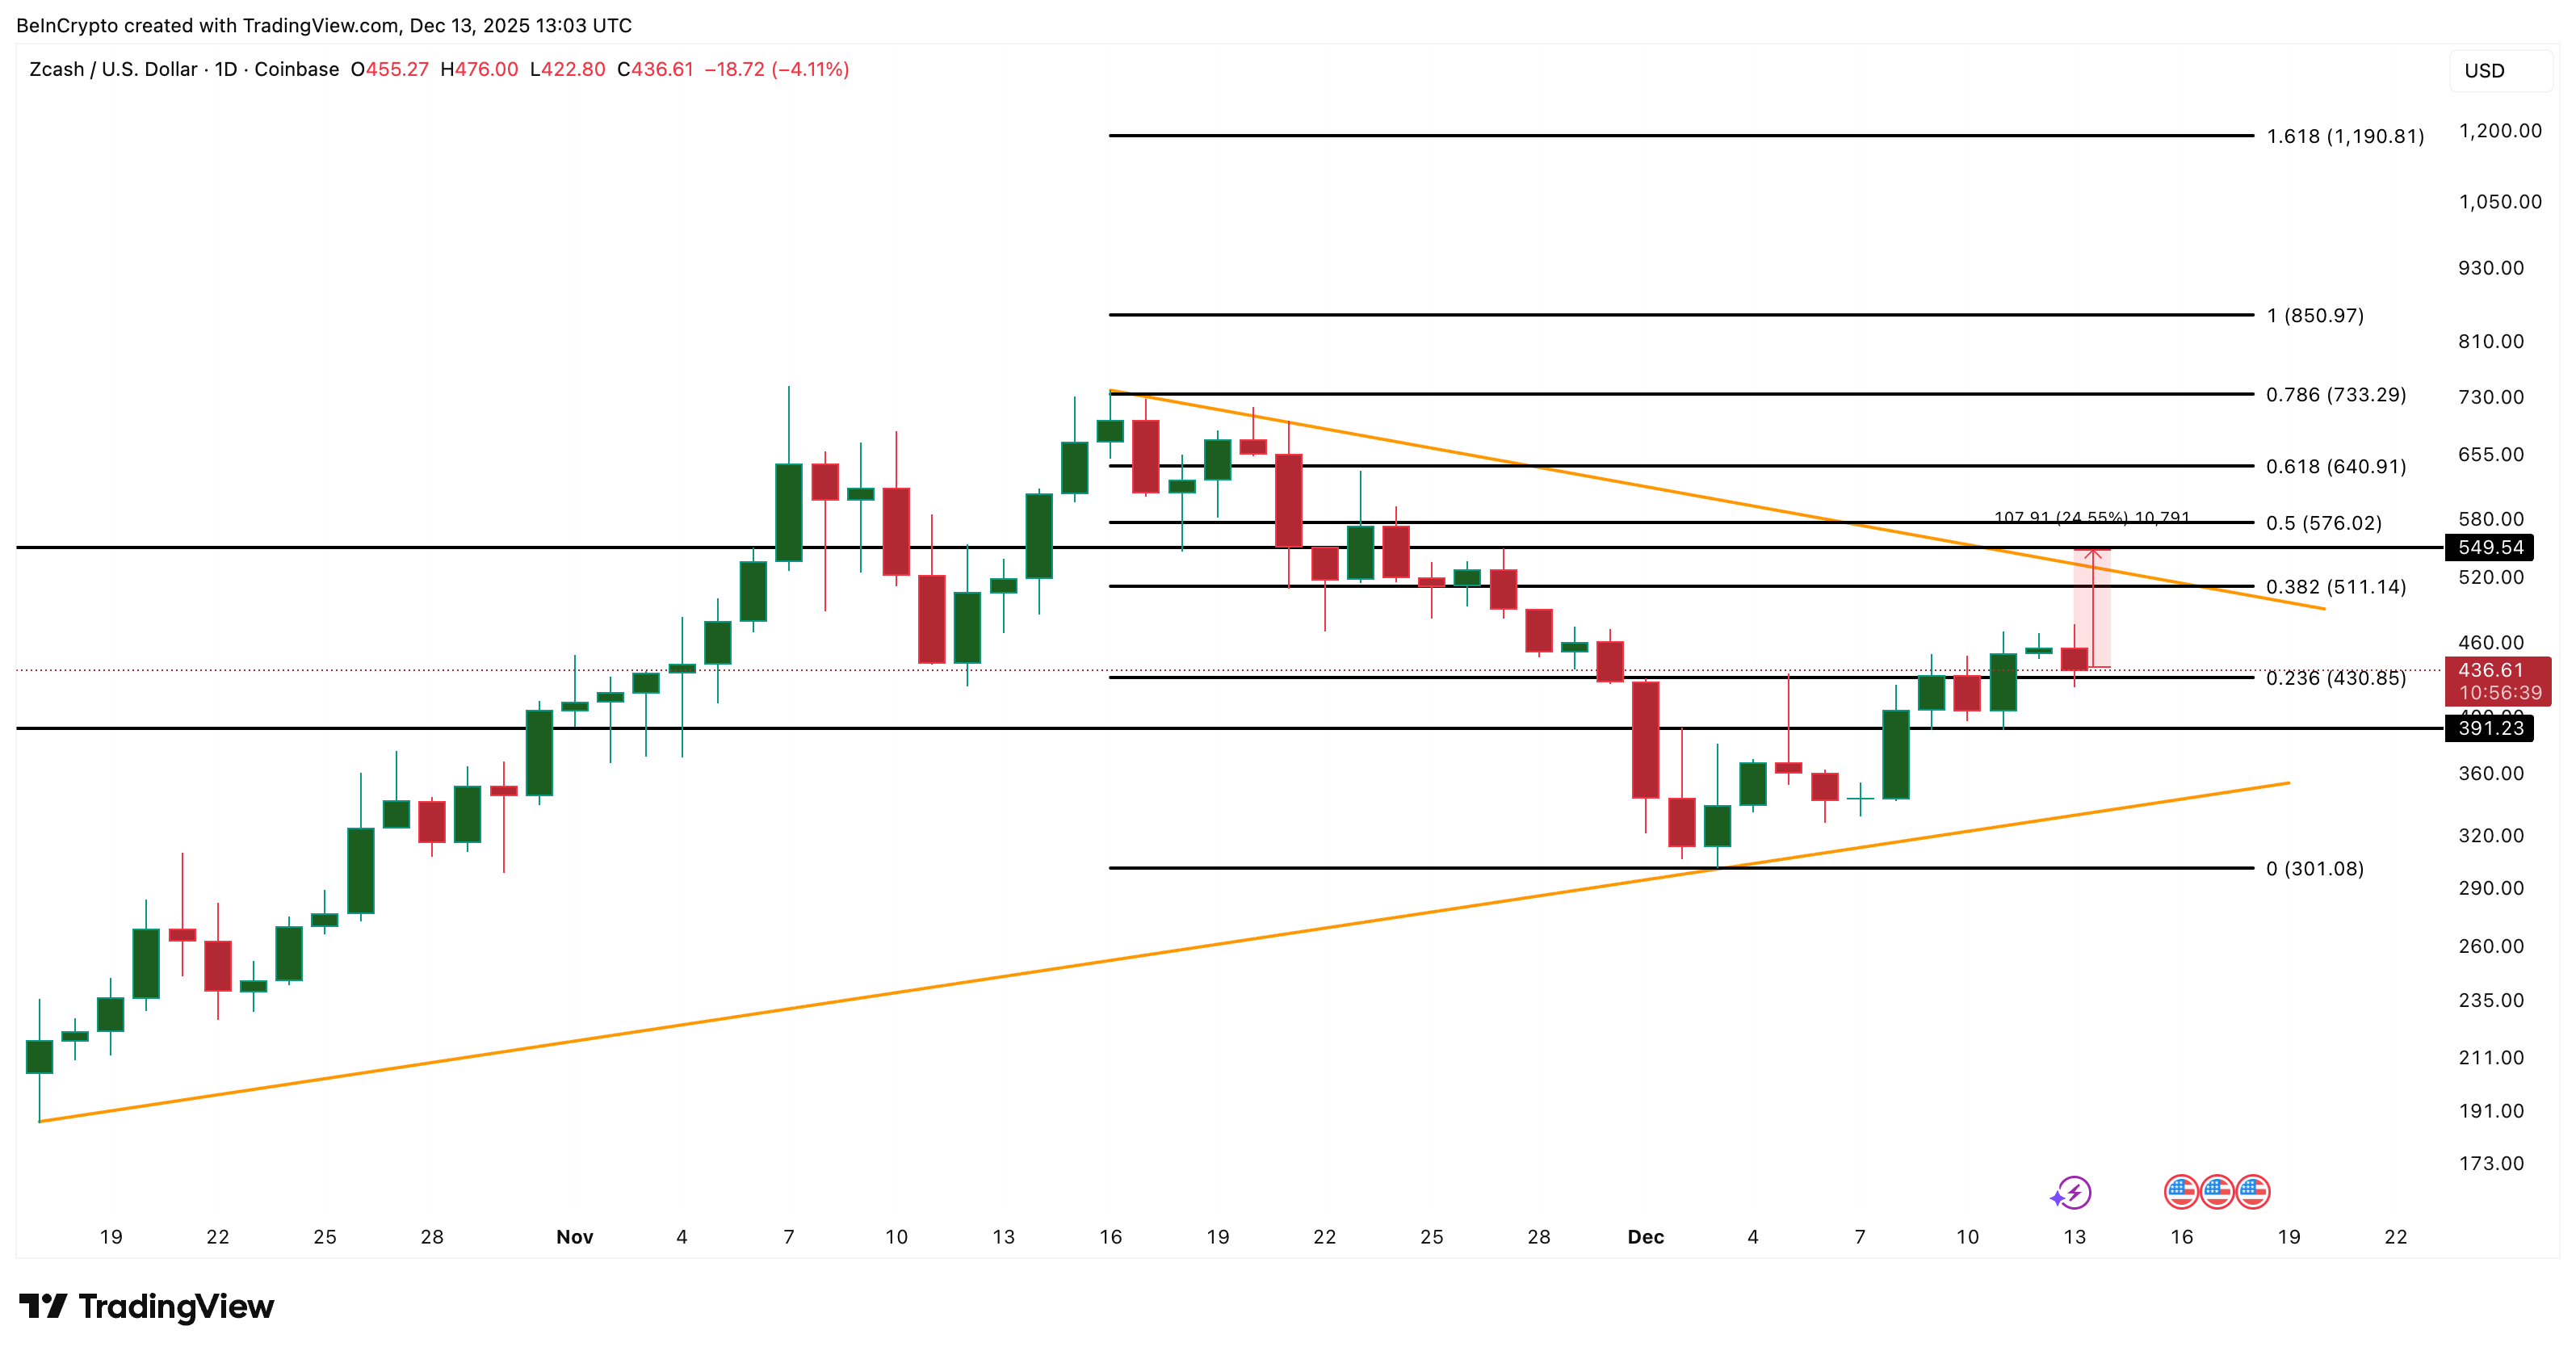
Zcash price is currently trading inside a tightening triangle pattern, which reflects short-term buyer and seller indecision rather than outright weakness. Importantly, the price continues to respect the rising trend line that has guided the uptrend this cycle. As long as that structure holds, the broader setup remains constructive.
Volume behavior adds key context. Using Wyckoff-style volume color analysis, blue bars indicate buyer-led activity, while yellow and red bars reflect increasing seller control.
Although buyer volume has cooled recently, blue bars are still dominant. A similar slowdown occurred after October 17, when buying pressure briefly weakened, before Zcash went on to rally by more than 300%.
Cooling volume alone did not end that trend. As long as the blue bars dominate, the rally is likely to remain strong, despite any pullbacks.
Want more token insights like this? Sign up for Editor Harsh Notariya’s Daily Crypto Newsletter here.
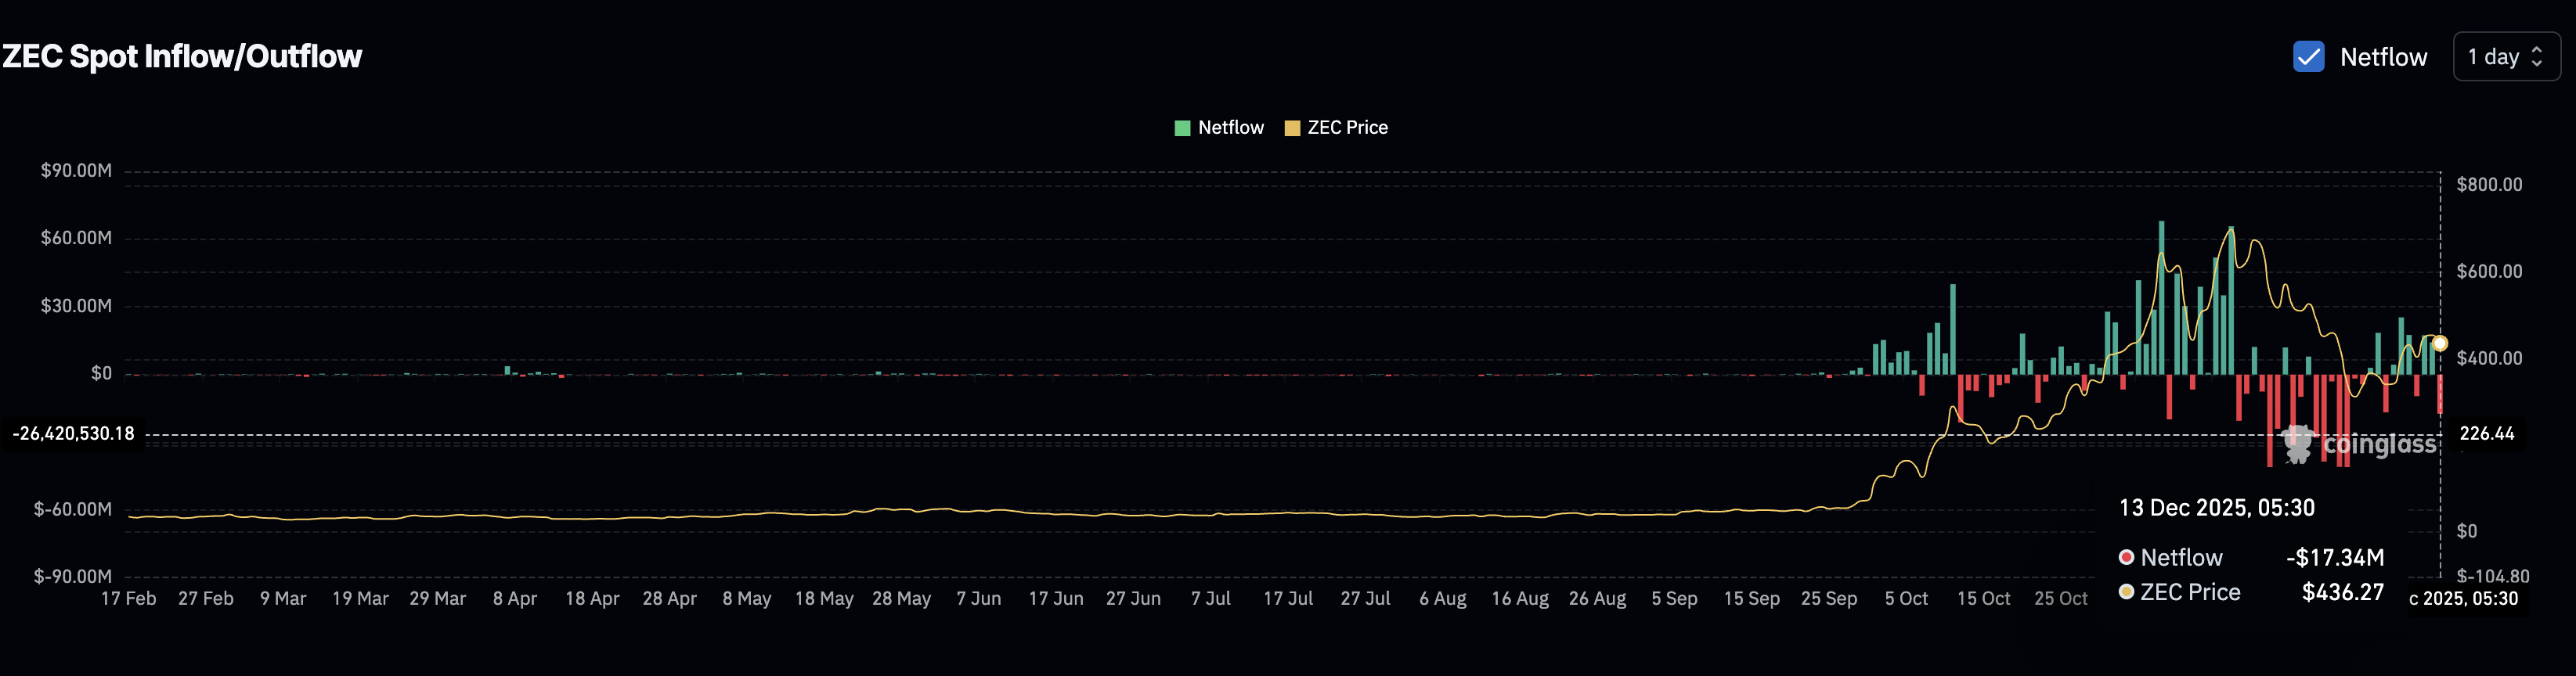
Spot flow data reinforces this picture. Spot flows track whether coins are moving onto or off exchanges.
Inflows suggest potential selling, while outflows signal accumulation. On December 12, Zcash recorded roughly $14.26 million in spot inflows, meaning coins moved onto exchanges.
By December 13, that flipped sharply to around $17.34 million in net outflows, showing coins being pulled off exchanges instead.
That shift matters. Exchange outflows reduce immediate sell pressure and often reflect spot buyers stepping in during pullbacks rather than distributing into strength.
Despite a mild pullback of about 2.5% over the past 24 hours, Zcash remains up roughly 20% over the past week and more than 700% over the past three months. The trend has not broken. It is consolidating.
Zcash Price Levels That Define the Next Move
For the bullish structure to continue, the Zcash price needs to break out of the triangle. The key level to watch is $511, a 24% move from current levels. A clean daily close above this level would confirm a bullish resolution and signal renewed buyer control.
If that breakout occurs, the first upside target sits near $549, followed by $733, which capped rallies earlier in the cycle. Higher resistance zones exist near $850 and $1,190, though reaching those would require sustained momentum and supportive broader market conditions.
Downside risk remains clearly defined. If the Zcash price loses $430, the triangle structure weakens. Strong support sits near $391, and a deeper breakdown could open the door to $301 if risk-off pressure spreads across the market.
Itaú Unibanco Holding SA, Latin America’s largest private bank, has advised clients to allocate up to 3% of their portfolios to Bitcoin for 2026.
The bank framed the cryptocurrency not as a speculative asset, but as a hedge against the erosion of the Brazilian real.
Why Itau Wants Clients’ Funds in Bitcoin
In a strategy note, analysts at the Sao Paulo-based lender said investors face a dual challenge from global price uncertainty and domestic currency fluctuations. They argued that these conditions necessitate a new approach to portfolio construction.
The bank recommends a Bitcoin weight of 1% to 3% to capture returns uncorrelated with domestic cycles.
“Bitcoin [is] an asset distinct from fixed income, traditional stocks, or domestic markets, with its own dynamics, return potential, and — due to its global and decentralized nature — a currency hedging function,” the bank wrote.
Itau emphasized that Bitcoin should not become a core holding. Instead, the bank framed the asset as a complementary allocation calibrated to an investor’s risk profile.
The objective is to capture returns that are not closely tied to domestic economic cycles and to provide partial protection against currency depreciation. It also aims to preserve exposure to long-term appreciation.
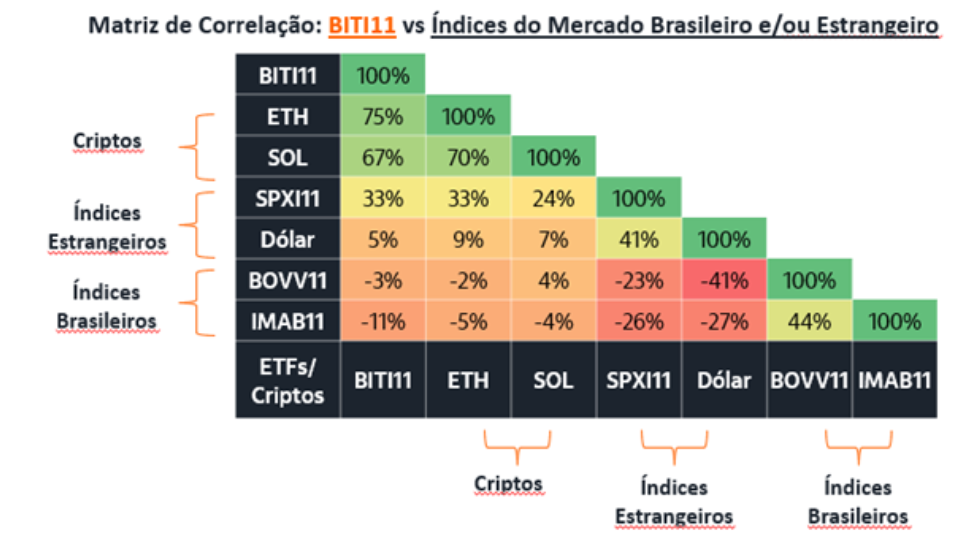
The bank pointed to the relatively low correlation between Bitcoin and traditional asset classes. It argued that an allocation of 1% to 3% can enhance diversification without overwhelming overall portfolio risk.
Bitcoin Performance vs Traditional Assets. Source: Itau
The approach, the note said, requires moderation, discipline, and a long-term horizon, rather than reactions to short-term price swings.
“Attempting ‘perfect timing’ in assets like Bitcoin or other international markets is risky — and often counterproductive,” the bank warned.
Itaú’s 3% ceiling places it squarely in line with the most forward-looking global guidance, narrowing the gap with US counterparts.
Itaú said that in a world of shortening economic cycles and more frequent external shocks, Bitcoin’s “hybrid character” sets it apart from traditional assets.
The bank described the flagship cryptocurrency as part high-risk asset and part global store of value. It argued that this combination offers a form of resilience that fixed income can no longer guarantee.
The Commodity Futures Trading Commission (CFTC) is quietly laying the plumbing for a market structure where US Treasuries and cryptocurrencies could eventually live side-by-side.
On December 12, the CFTC approved an expansion of cross-margining for US Treasuries.
How CFTC’s New Order Impacts Crypto
This change allows certain customers, not just clearing members, to offset margin requirements between Treasury futures cleared at CME Group. CME Group is one of the largest crypto derivatives trading platform in the US.
“Expanding cross-margining to customers will provide capital efficiencies that can increase liquidity and resiliency in US Treasuries, the most important market in the world,” Caroline Pham, CFTC’s Acting Chair, said.
Cross-margining allows firms to reduce total collateral by netting correlated positions within a portfolio. Extending that mechanism from dealer balance sheets to end customers in Treasuries represents a significant structural shift.
Market participants view it as a practical test of risk models. Those frameworks could eventually support portfolios holding Treasuries, tokenized funds and crypto assets within a single clearing ecosystem.
For crypto derivatives traded on CME, the orders could have significant market implications.
If Treasuries and Treasury futures can be cross-margined at scale, similar frameworks could eventually support more complex portfolios. Those portfolios could include tokenized Treasury bills and spot Bitcoin backing positions in CME Bitcoin and ETH futures, all governed by unified margin and risk controls.
Meanwhile, this order’s timing places it squarely within a broader crypto regulatory effort that spans both the CFTC and the Securities and Exchange Commission (SEC).
It also echoes the SEC’s parallel work on market structure and clearing reform, as regulators assess how tokenized securities and digital collateral might fit within established settlement and custody frameworks.
These moves reflect a regulatory focus on capital efficiency and risk management across asset classes that increasingly blur the line between traditional and digital markets.
The entire category featuring Made in USA coins has traded almost flat over the past week, even as broader crypto volatility picked up. That lack of movement stands out heading into Christmas, when thin liquidity often exposes which projects are quietly building pressure.
Several US-based tokens are now sitting at clear technical decision points, where small moves could shift the short-term trend. This piece lists three such Made in USA coins to watch before Christmas 2025, led by improving price structures, rising breakdown risks, and setups that could move sharply in either direction.
Cardano (ADA)
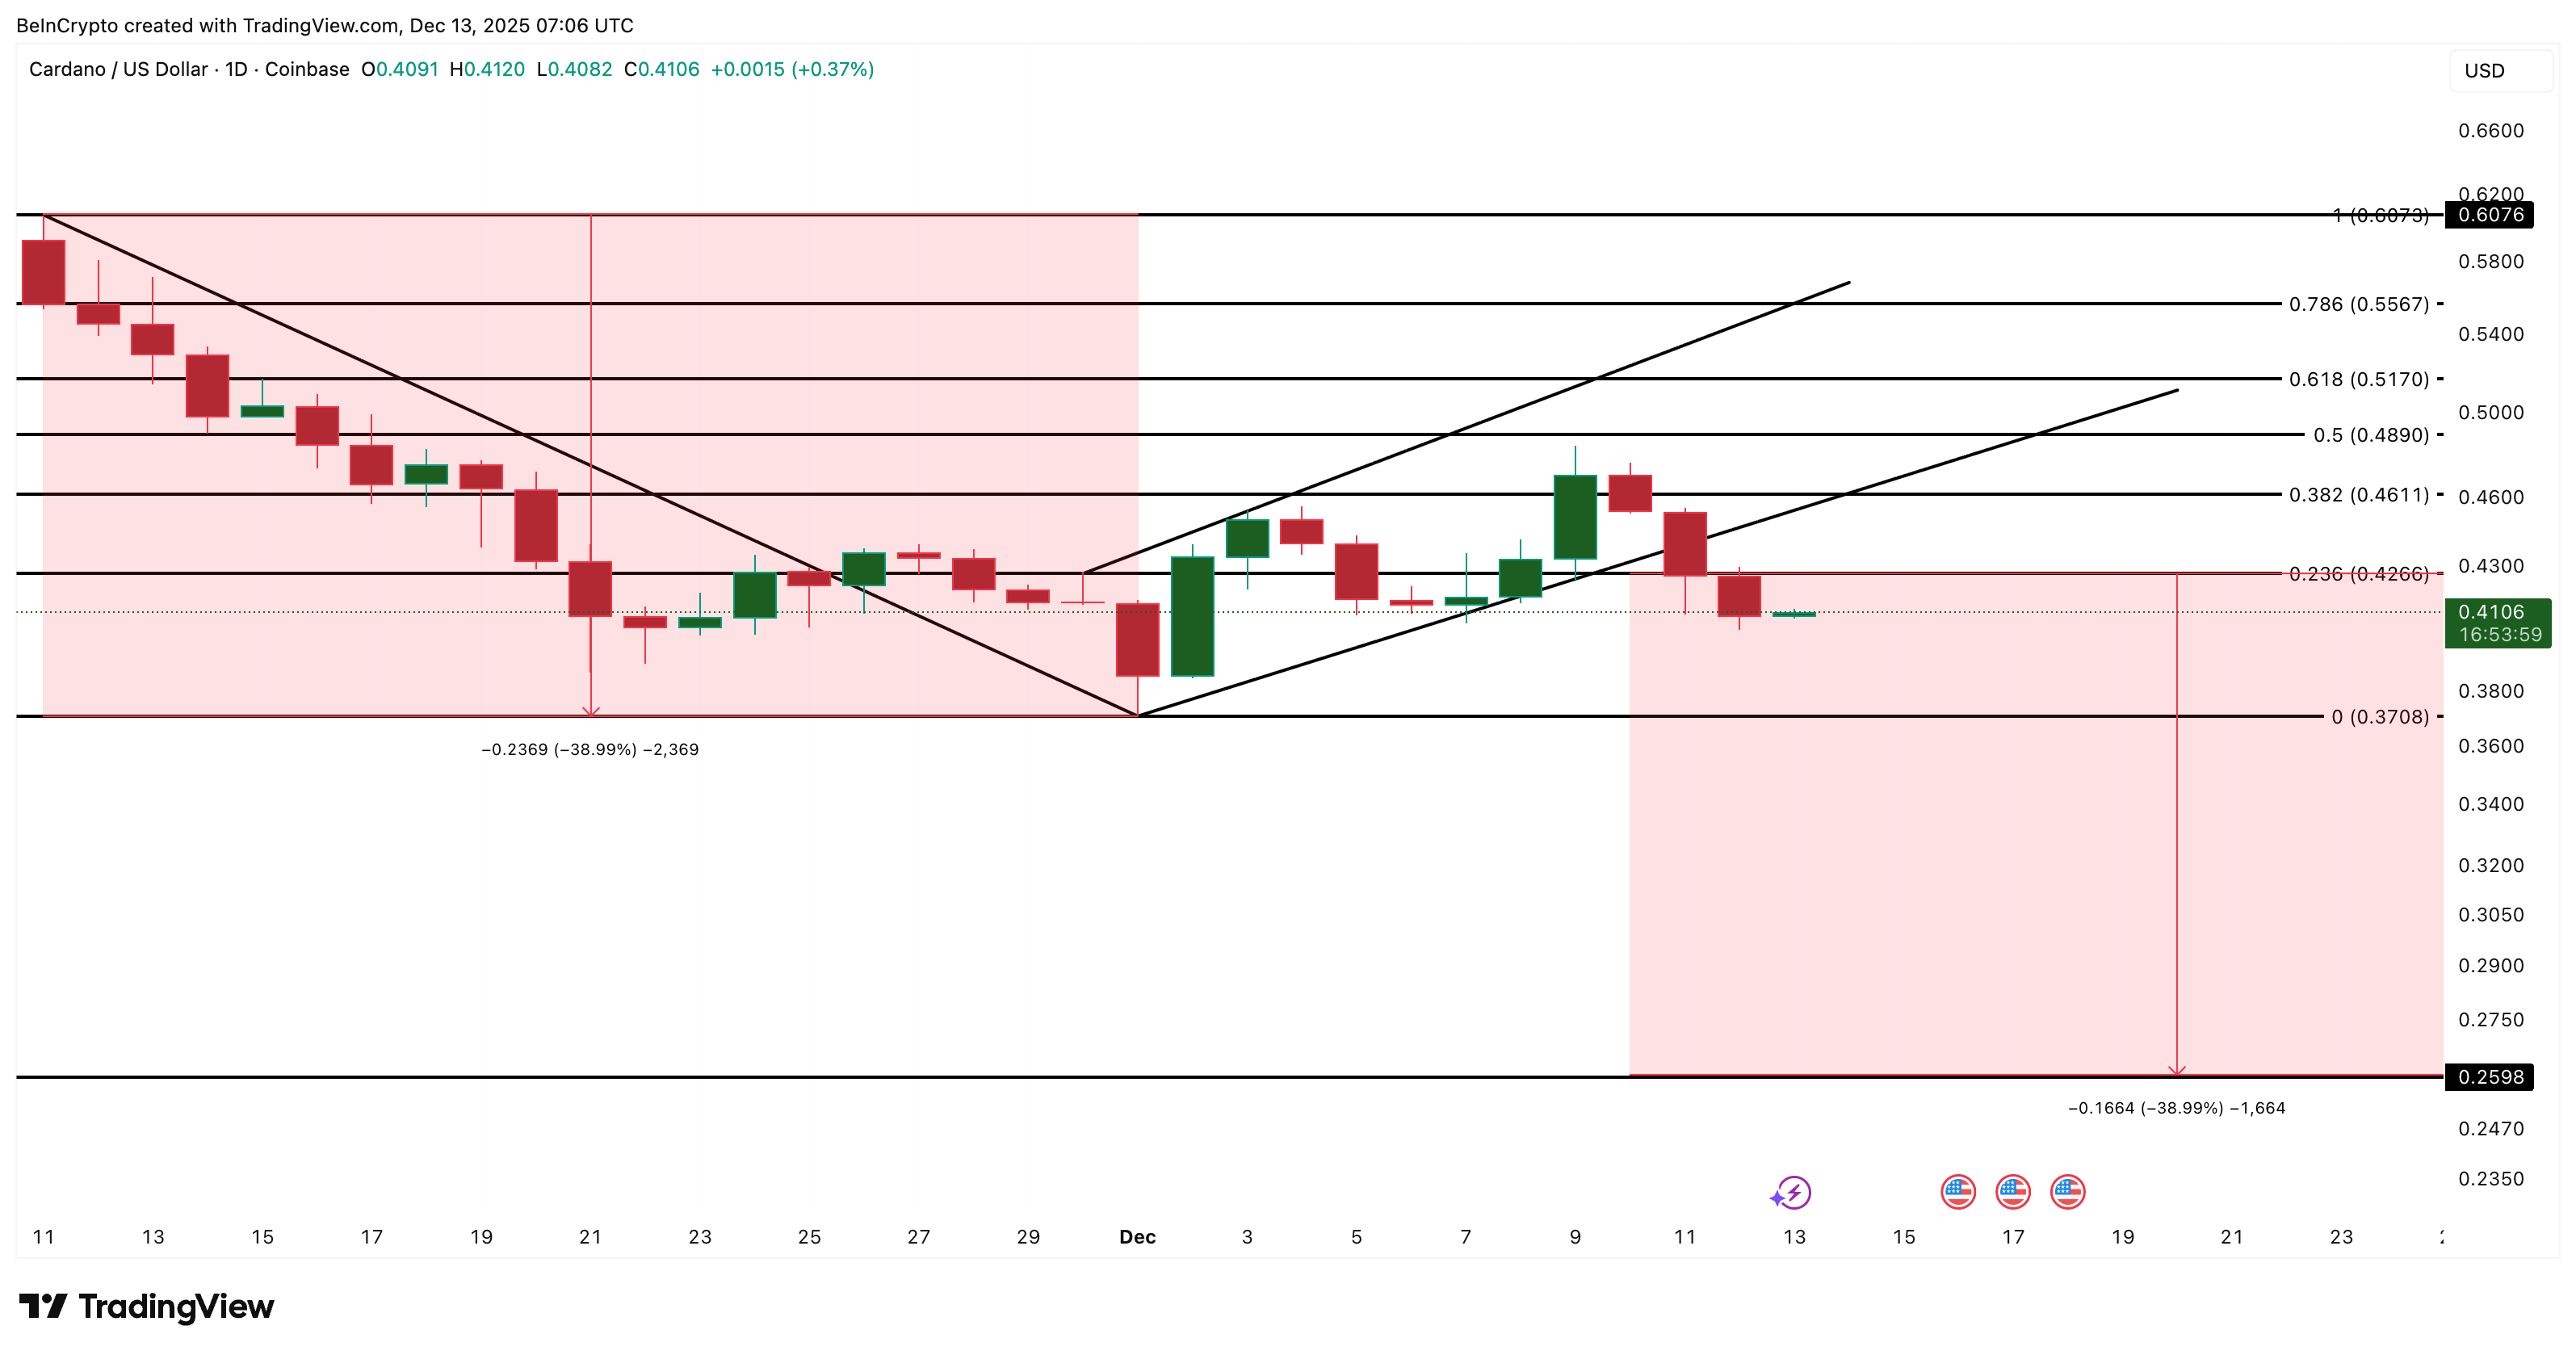
Cardano is one of the Made in USA coins that traders could be watching ahead of Christmas 2025. It is down around 3.5% over the past 24 hours, extending its monthly losses to over 27%.
The recent Midnight upgrade failed to shift sentiment, and downside pressure has returned as the broader market weakens.
On the daily chart, Cardano has broken down from a bearish continuation structure — the bearish pole-and-flag. The prior consolidation resolved lower, confirming sellers remain in control.
This keeps the broader downside projection active, which still points to a potential drop of nearly 39% from the earlier breakdown zone.
Want more token insights like this? Sign up for Editor Harsh Notariya’s Daily Crypto Newsletter here.
The first level that matters now is $0.370. This area has acted as strong support in recent weeks, but the price is already drifting toward it. A daily close below $0.370 would increase downside risk and bring $0.259 into focus, which aligns with the full bearish projection.
For the Cardano price to stabilize, selling pressure must ease near $0.370. To invalidate the bearish setup and regain momentum, Cardano needs to reclaim $0.489, followed by $0.517. Those levels mark key Fibonacci resistances and would signal buyers stepping back in.
Until then, Cardano remains vulnerable into Christmas, especially if weakness across the Made in USA category continues.
Stellar (XLM)
Stellar sits at an important decision point among Made in USA coins ahead of Christmas, as price action begins to test whether long-term adoption can still support value in the short term.
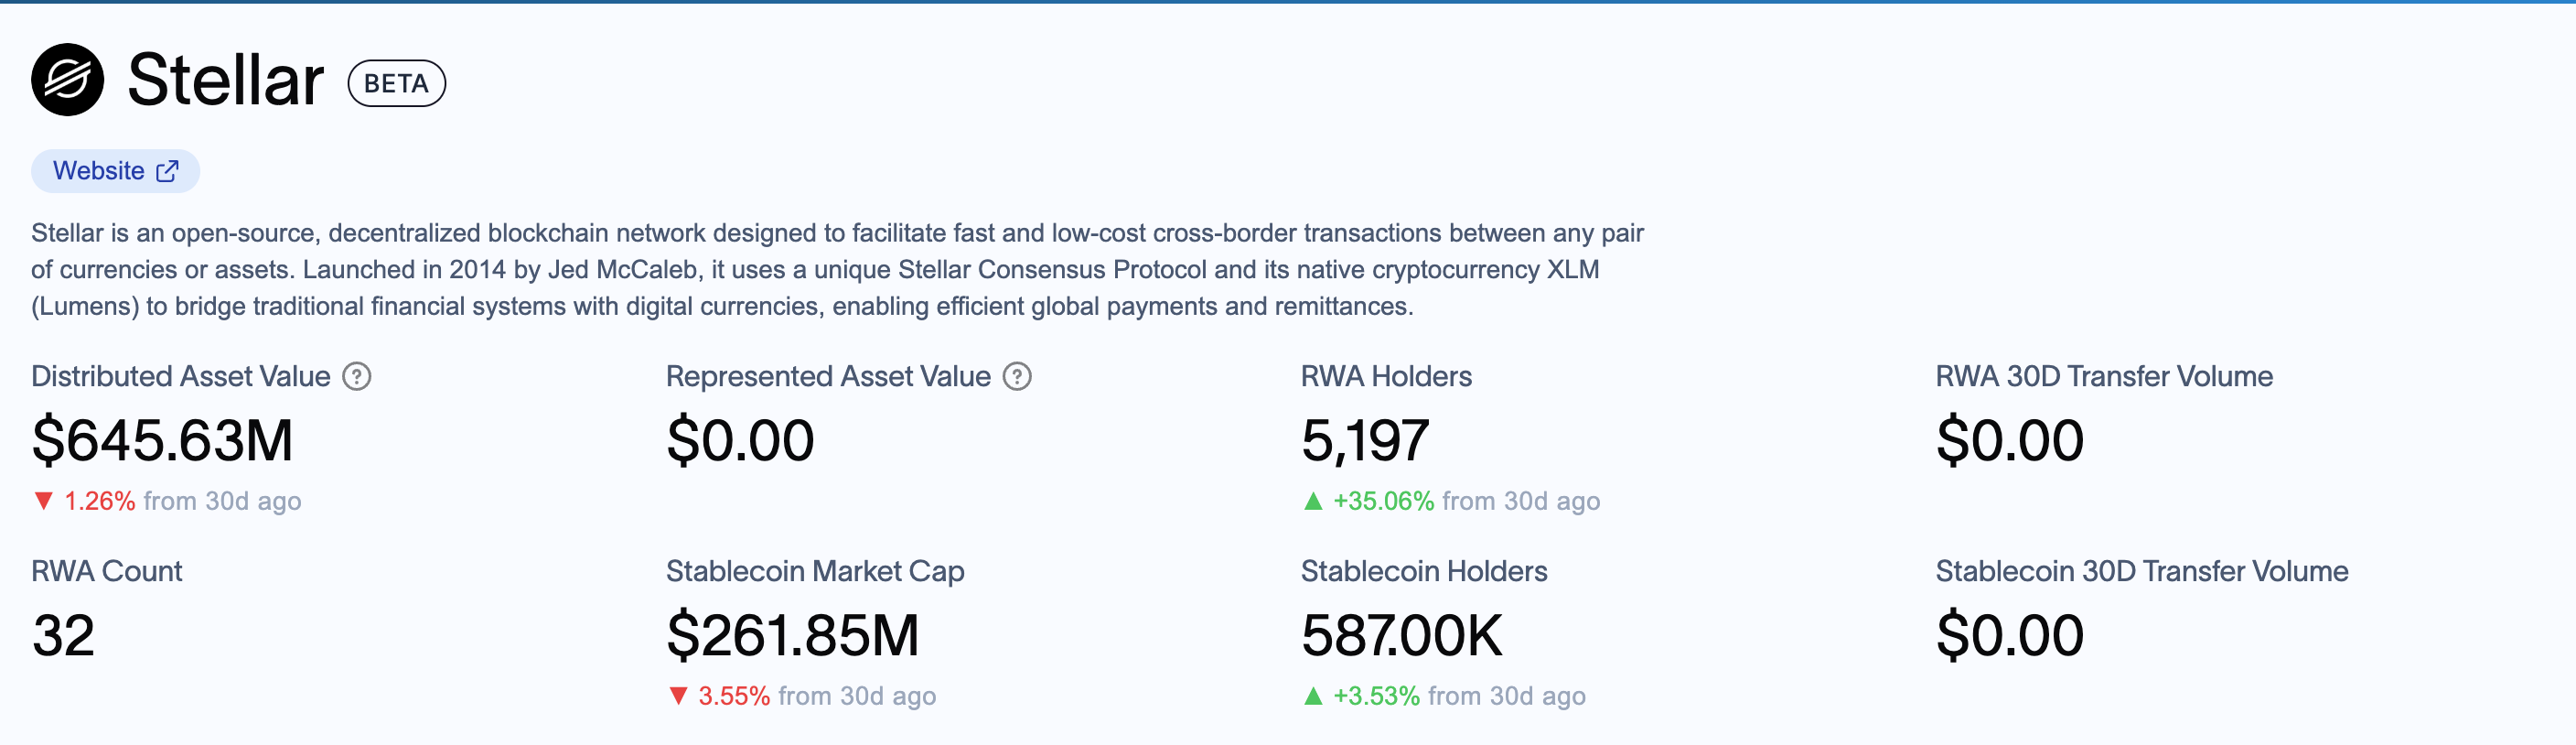
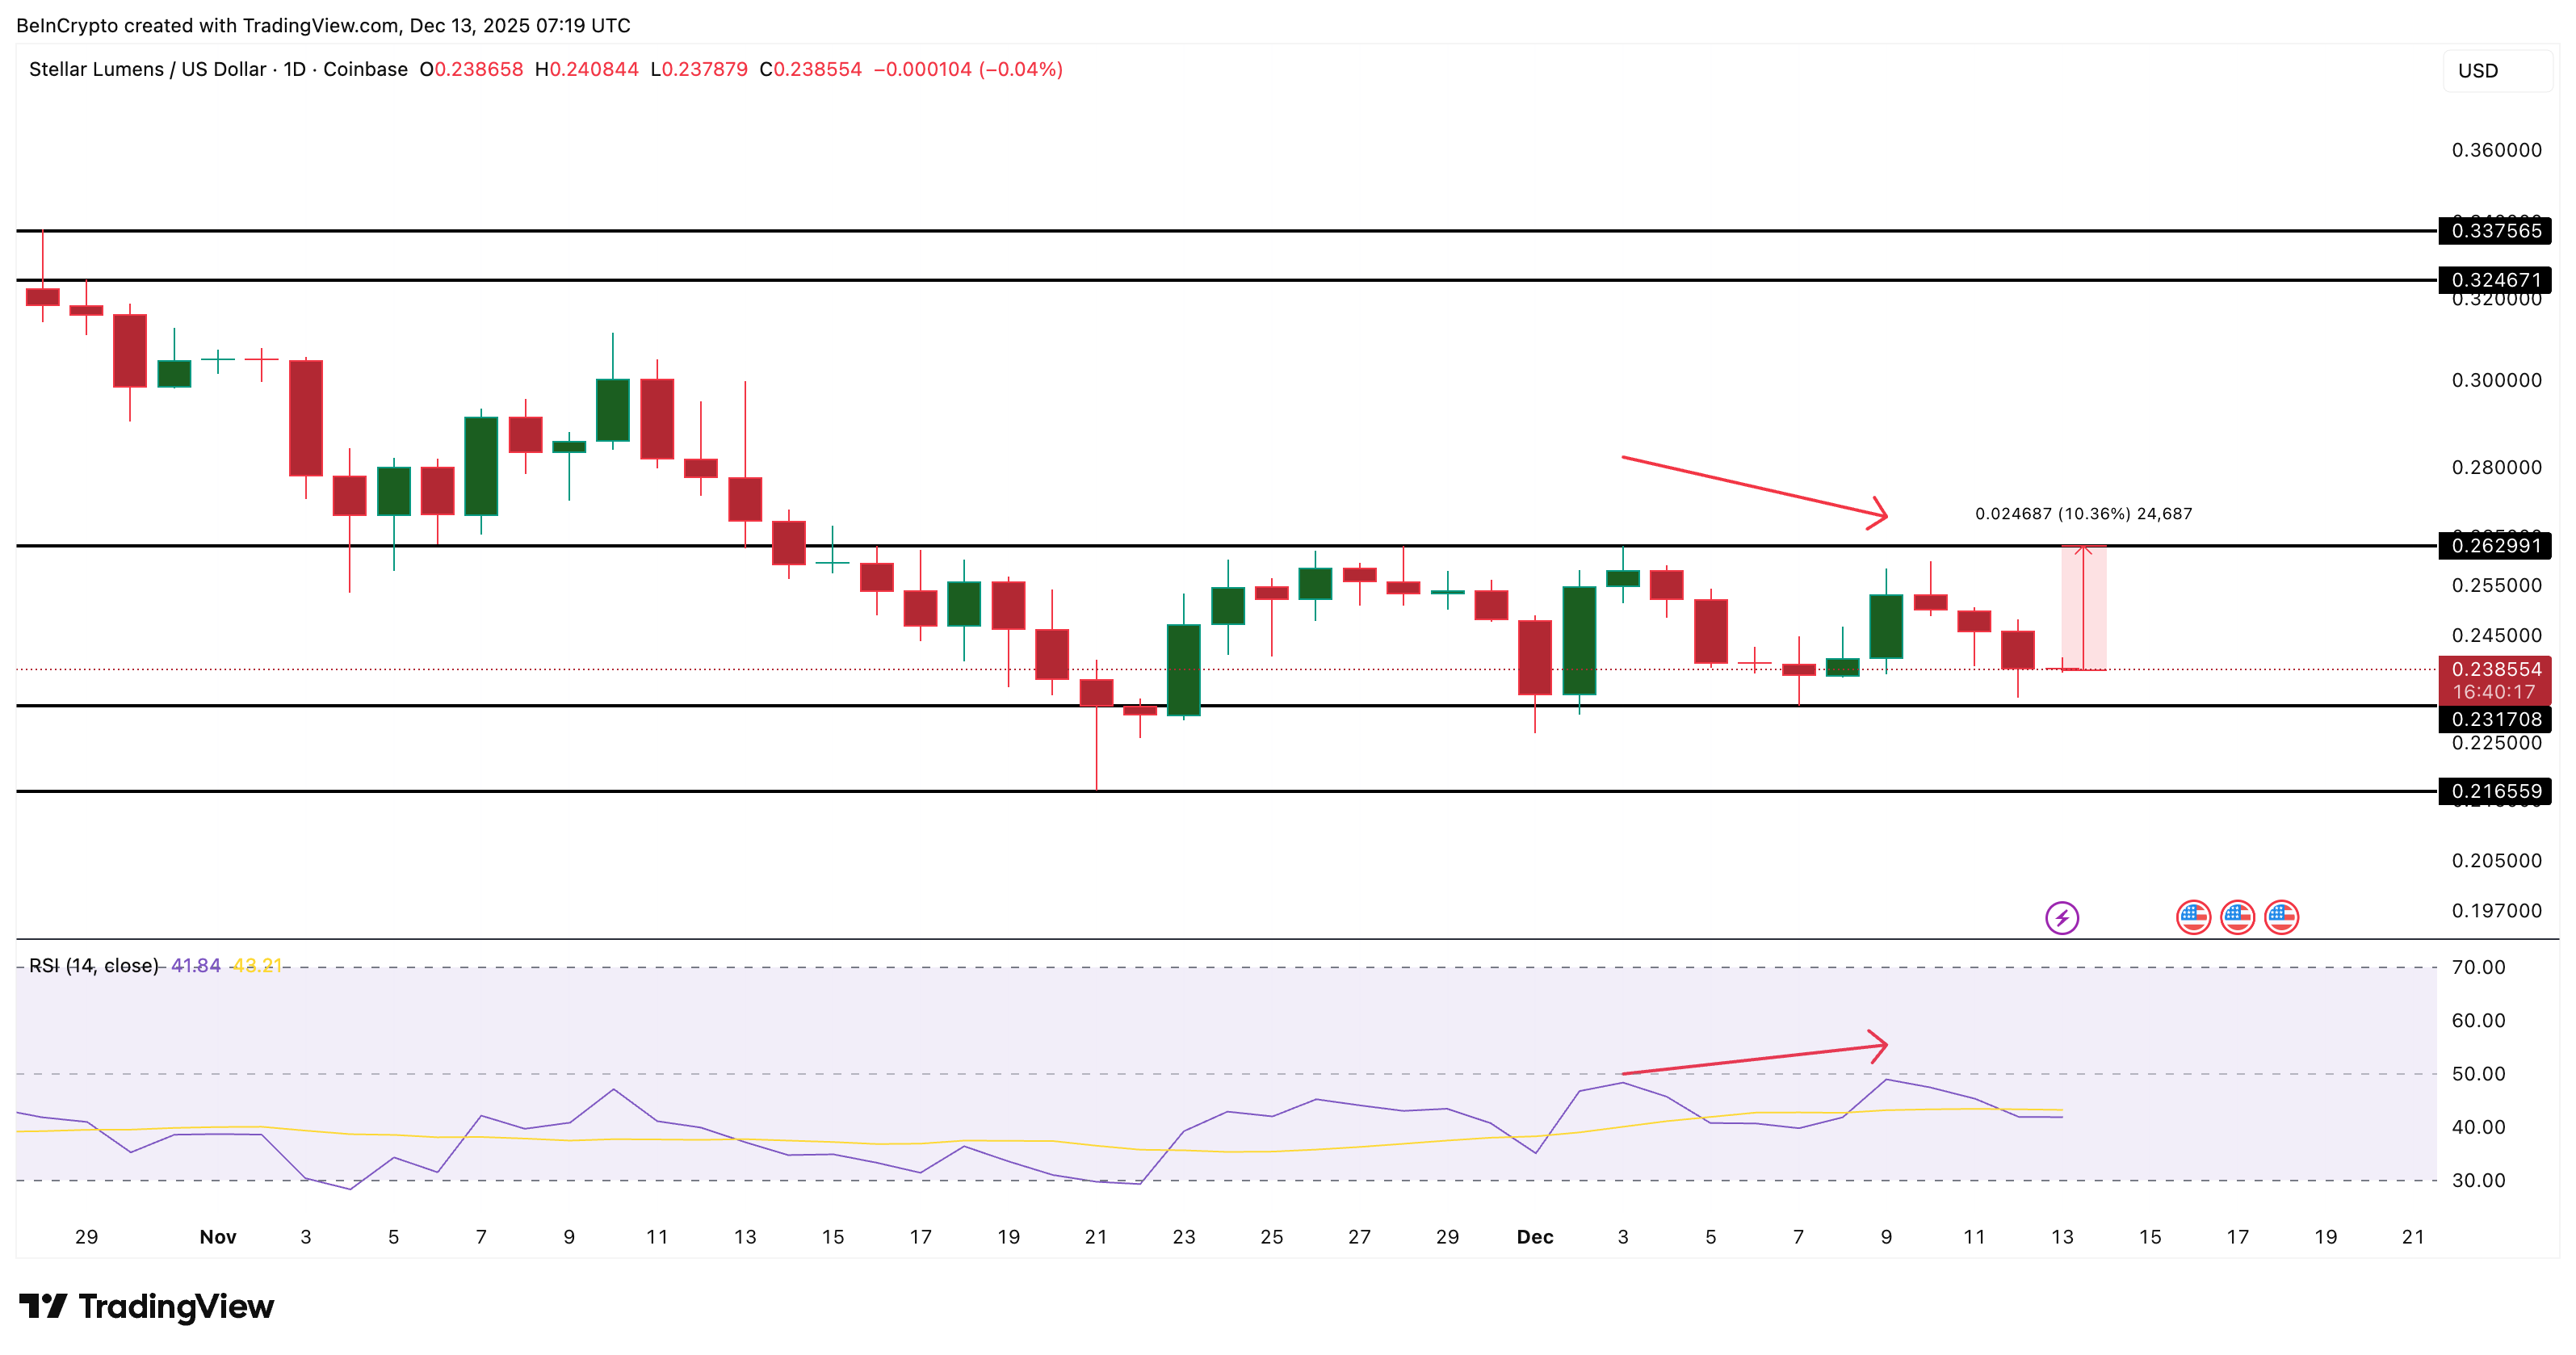
XLM is down around 2.5% over the past 24 hours, extending its monthly decline to nearly 18%. That caution becomes clearer when looking at adoption data.
While the number of RWA holders on Stellar has increased sharply over the past month, the total value of assets on the network has declined.
The price chart reinforces that message. Between December 3 and December 9, Stellar formed a hidden bearish divergence. Price made a lower high while the RSI made a higher high. RSI, or Relative Strength Index, tracks momentum. Since that divergence appeared, XLM has continued drifting lower, confirming that the broader downtrend remains intact.
The key level now is $0.231. This zone has acted as short-term support during recent pullbacks. Holding above it would suggest sellers are slowing, especially into the thin Christmas trading period. A daily close below $0.231 would expose $0.216 next, opening the door to further downside if market weakness persists.
For the bearish structure to break, Stellar needs to reclaim $0.262. That level has capped every rally attempt since mid-November.
A move above it would require roughly a 10% push and would signal that buyers are finally willing to defend higher prices again. Some hope of reclaiming that level remains as analysts on X highlight XLM flashing a buy signal.
The last time the TD Sequential flashed a buy signal around these levels, Stellar $XLM jumped 95%. pic.twitter.com/KZYIAbOQME
Until then, Stellar remains a Made in USA coin where the trend still favors caution, making this support test especially important heading into Christmas.
Litecoin (LTC)
Litecoin is one of the few Made in USA coins showing relative stability heading into Christmas.
LTC is up around 1.5% on the week, making it an outlier among Made in USA coins. At the same time, it has remained down roughly 19% over the past month. This mixed performance lines up with recent fundamentals. Reports show institutions and funds have quietly accumulated around 3.7 million LTC, even as retail interest stayed muted.
That accumulation has not translated into immediate upside, but it helps explain why Litecoin has avoided deeper breakdowns compared to peers. For Made in USA projects, that kind of steady demand matters more than short-lived hype, especially into year-end.
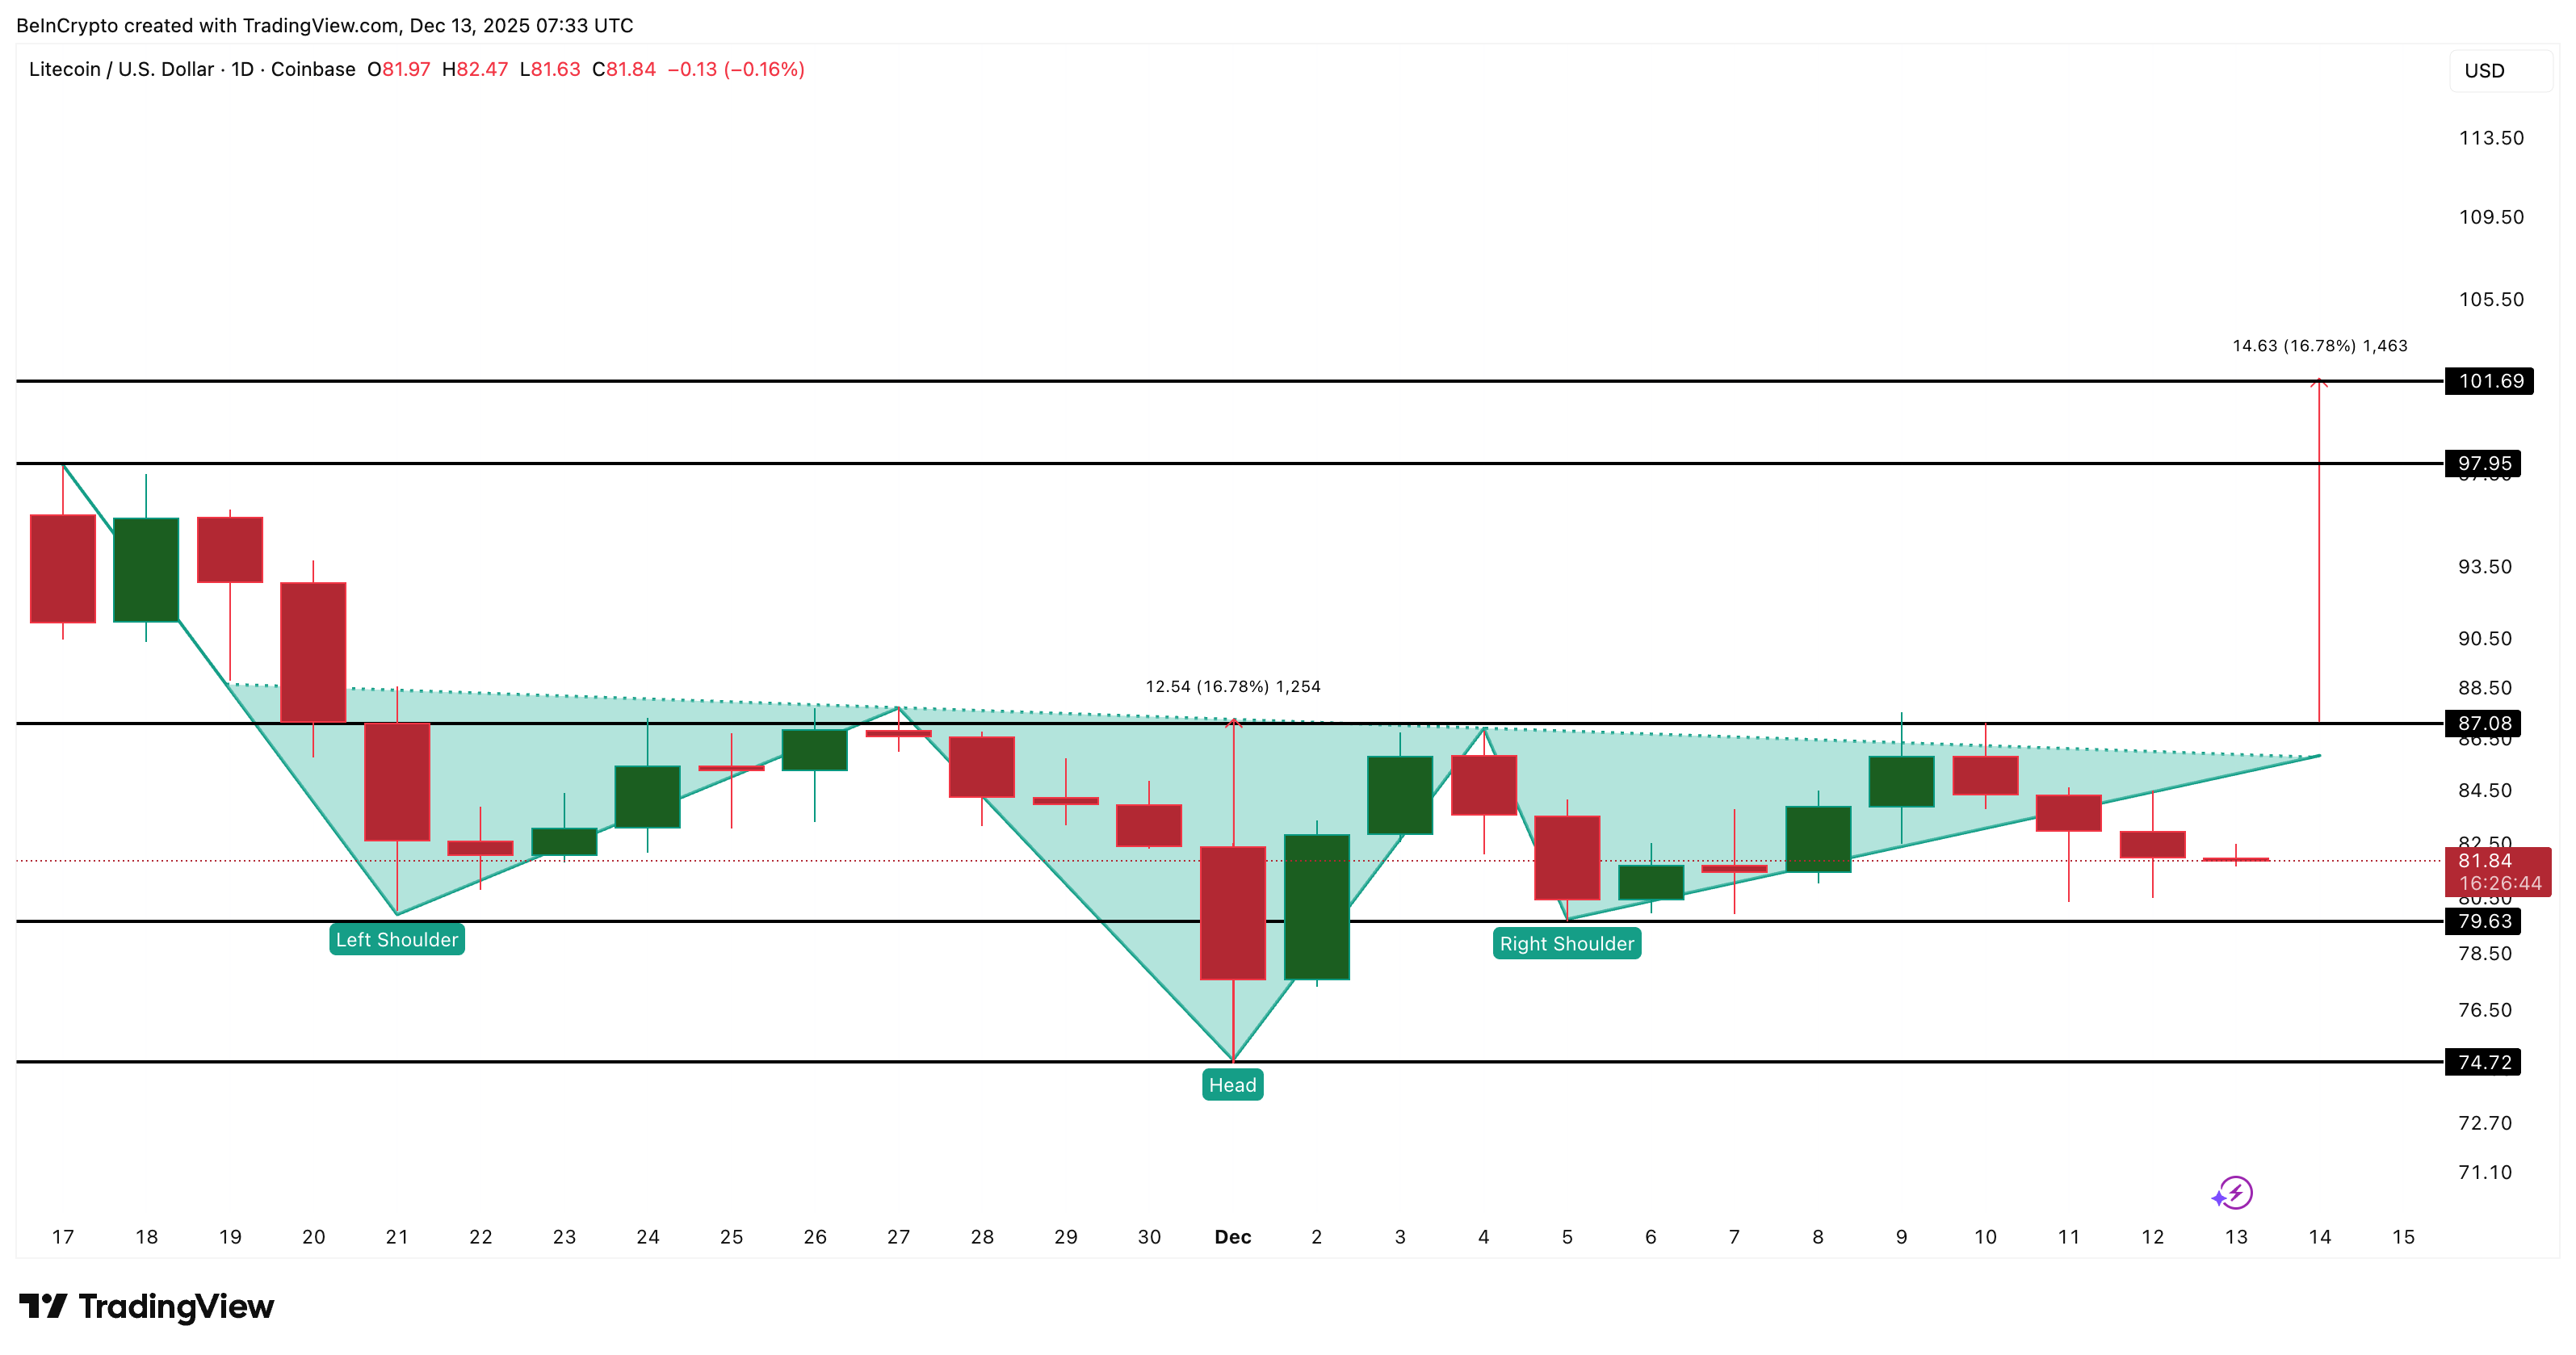
On the price chart, Litecoin is forming an inverse head-and-shoulders pattern, which is typically bullish. This structure reflects the fading of selling pressure over time, followed by buyers slowly regaining control. The pattern attempted a breakout on December 9 but failed to hold, pushing the price back into consolidation rather than triggering a reversal.
The structure remains valid as long as Litecoin holds above $79.63. A drop below this level would weaken the setup and delay any upside attempt. A deeper move below $74.72 would invalidate the pattern entirely and shift the outlook back to bearish continuation.
For confirmation, Litecoin needs a clean daily close above the neckline near $87.08. That break would signal the pattern is active again and open a path toward $97.95 first, with $101.69 as the full measured target.
Until that happens, Litecoin remains a US-based project (token) at a decision point, where steady institutional interest contrasts with still-cautious price action ahead of Christmas 2025.
The US banking industry has mounted a coordinated challenge to the Office of the Comptroller of the Currency’s (OCC) approach. The pushback targets the regulator’s efforts to integrate cryptocurrency firms into the federal banking system.
On December 12, OCC issued conditional approval of national trust charters for five digital asset firms, including Ripple, Fidelity, Paxos, First National Digital Currency Bank, and BitGo. The bank regulator stressed that the crypto applicants underwent the same “rigorous review” as any national bank charter applicant.
US Banking Industry Challenges OCC’s Move
However, the American Bankers Association (ABA) and the Independent Community Bankers of America (ICBA) argue that the OCC’s actions create a two-tier banking system.
Their central claim is that fintech and crypto firms are being granted prestigious national charters without carrying Federal Deposit Insurance Corp. (FDIC) coverage or meeting traditional capital and liquidity standards required of full-service banks.
The groups contend that this structure encourages what they describe as regulatory arbitrage at the federal level.
By securing a national charter, the crypto firms can benefit from federal preemption of state money transmitter laws. At the same time, they avoid many of the compliance obligations that apply to insured depository institutions.
ABA President Rob Nichols said the approvals “blur the lines” of what constitutes a bank. He further argues that this erosion of definitions risks weakening the integrity of the charter itself.
In his view, expanding trust powers to firms that do not perform traditional fiduciary duties creates a class of institutions that resemble banks in name and scope but lack comparable oversight.
Meanwhile, their concern extends beyond competition.
Banking groups warn that consumers may struggle to distinguish between insured banks and national trust institutions holding large volumes of uninsured crypto assets.
They argue that the OCC has not adequately explained how it would manage the failure of such an entity, particularly if it were holding billions of dollars in digital assets outside the traditional safety net.
ICBA Wants the Charters Halted
The ICBA also directly challenged the OCC’s statutory authority to issue the charters.
We oppose the OCC’s conditional approval of five national trust bank charter applications from nonbank fintechs. We have repeatedly said the OCC lacks statutory authority to expand trust powers and that the sudden influx of applications threatens consumers and the financial…
— Independent Community Bankers of America (@ICBA) December 12, 2025
The group focused its criticism on Interpretive Letter No. 1176. This guidance enabled trust banks to engage in non-fiduciary activities such as custody of stablecoin reserves.
ICBA President Rebeca Romero Rainey described the move as a “dramatic policy change” that stretches the national trust charter beyond its historical purpose.
“The OCC’s dramatic policy change under Interpretive Letter #1176 is a departure from the role of conventional trust companies and allows for an inconsistent regulatory framework that threatens financial instability — requiring the agency to change course,” Rainey added.
The group argues that the OCC is allowing non-bank fintech firms to effectively borrow the credibility of the US banking system while avoiding the “full scope” of regulations imposed on insured institutions.
Considering this, both trade groups have called for an immediate pause and rescission of the approvals.
They warn that the current framework could produce institutions that the OCC is “not equipped to resolve in an orderly way.” According to them, such a failure could leave traditional banks and the broader financial system exposed.
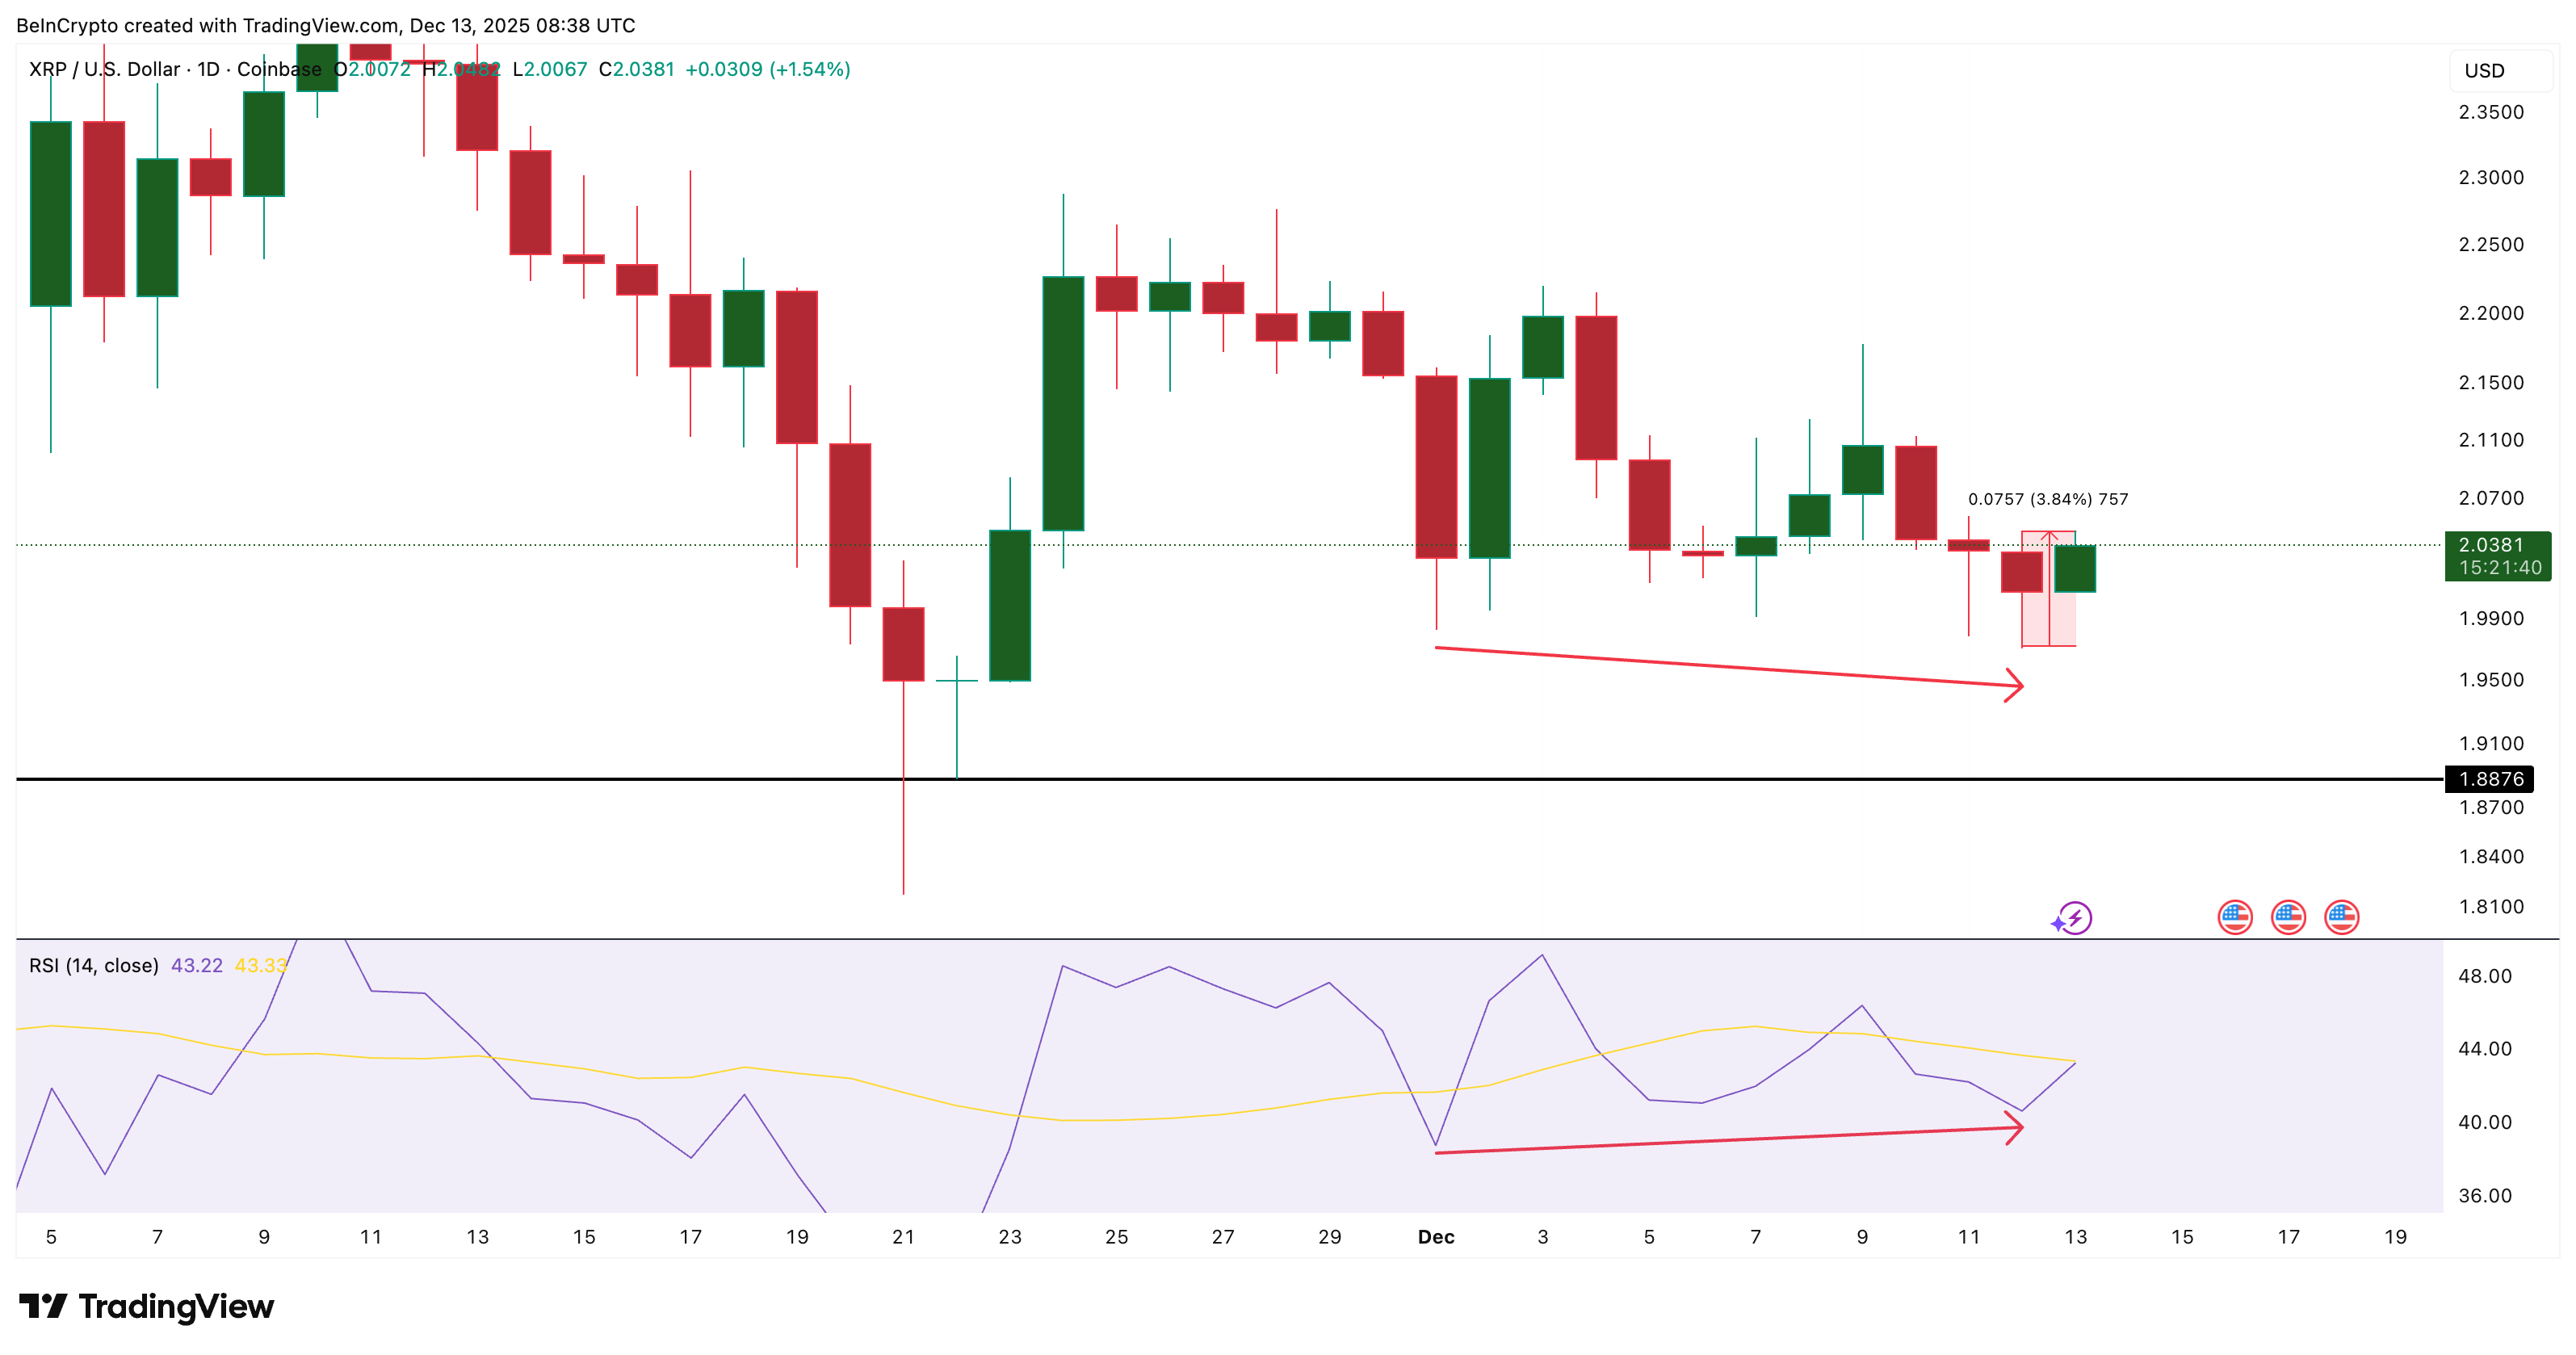
XRP price has rebounded from recent lows, rising nearly 4% from yesterday’s bottom and stabilizing after a modest pullback. While the broader trend remains cautious, a new metric suggests downside momentum may be fading.
With the XRP issuer recently moving closer to regulated-banking status, the focus now shifts to whether large holders continue to step in to confirm a real trend change.
Bullish Divergence Forms as Largest Whales Begin Adding
On the daily chart, the XRP price has flashed a bullish divergence between December 1 and December 12. During this period, price made a lower low, while the Relative Strength Index (RSI) formed a higher low. RSI measures momentum, and this pattern often appears when selling pressure weakens before a rebound.
Want more token insights like this? Sign up for Editor Harsh Notariya’s Daily Crypto Newsletter here.
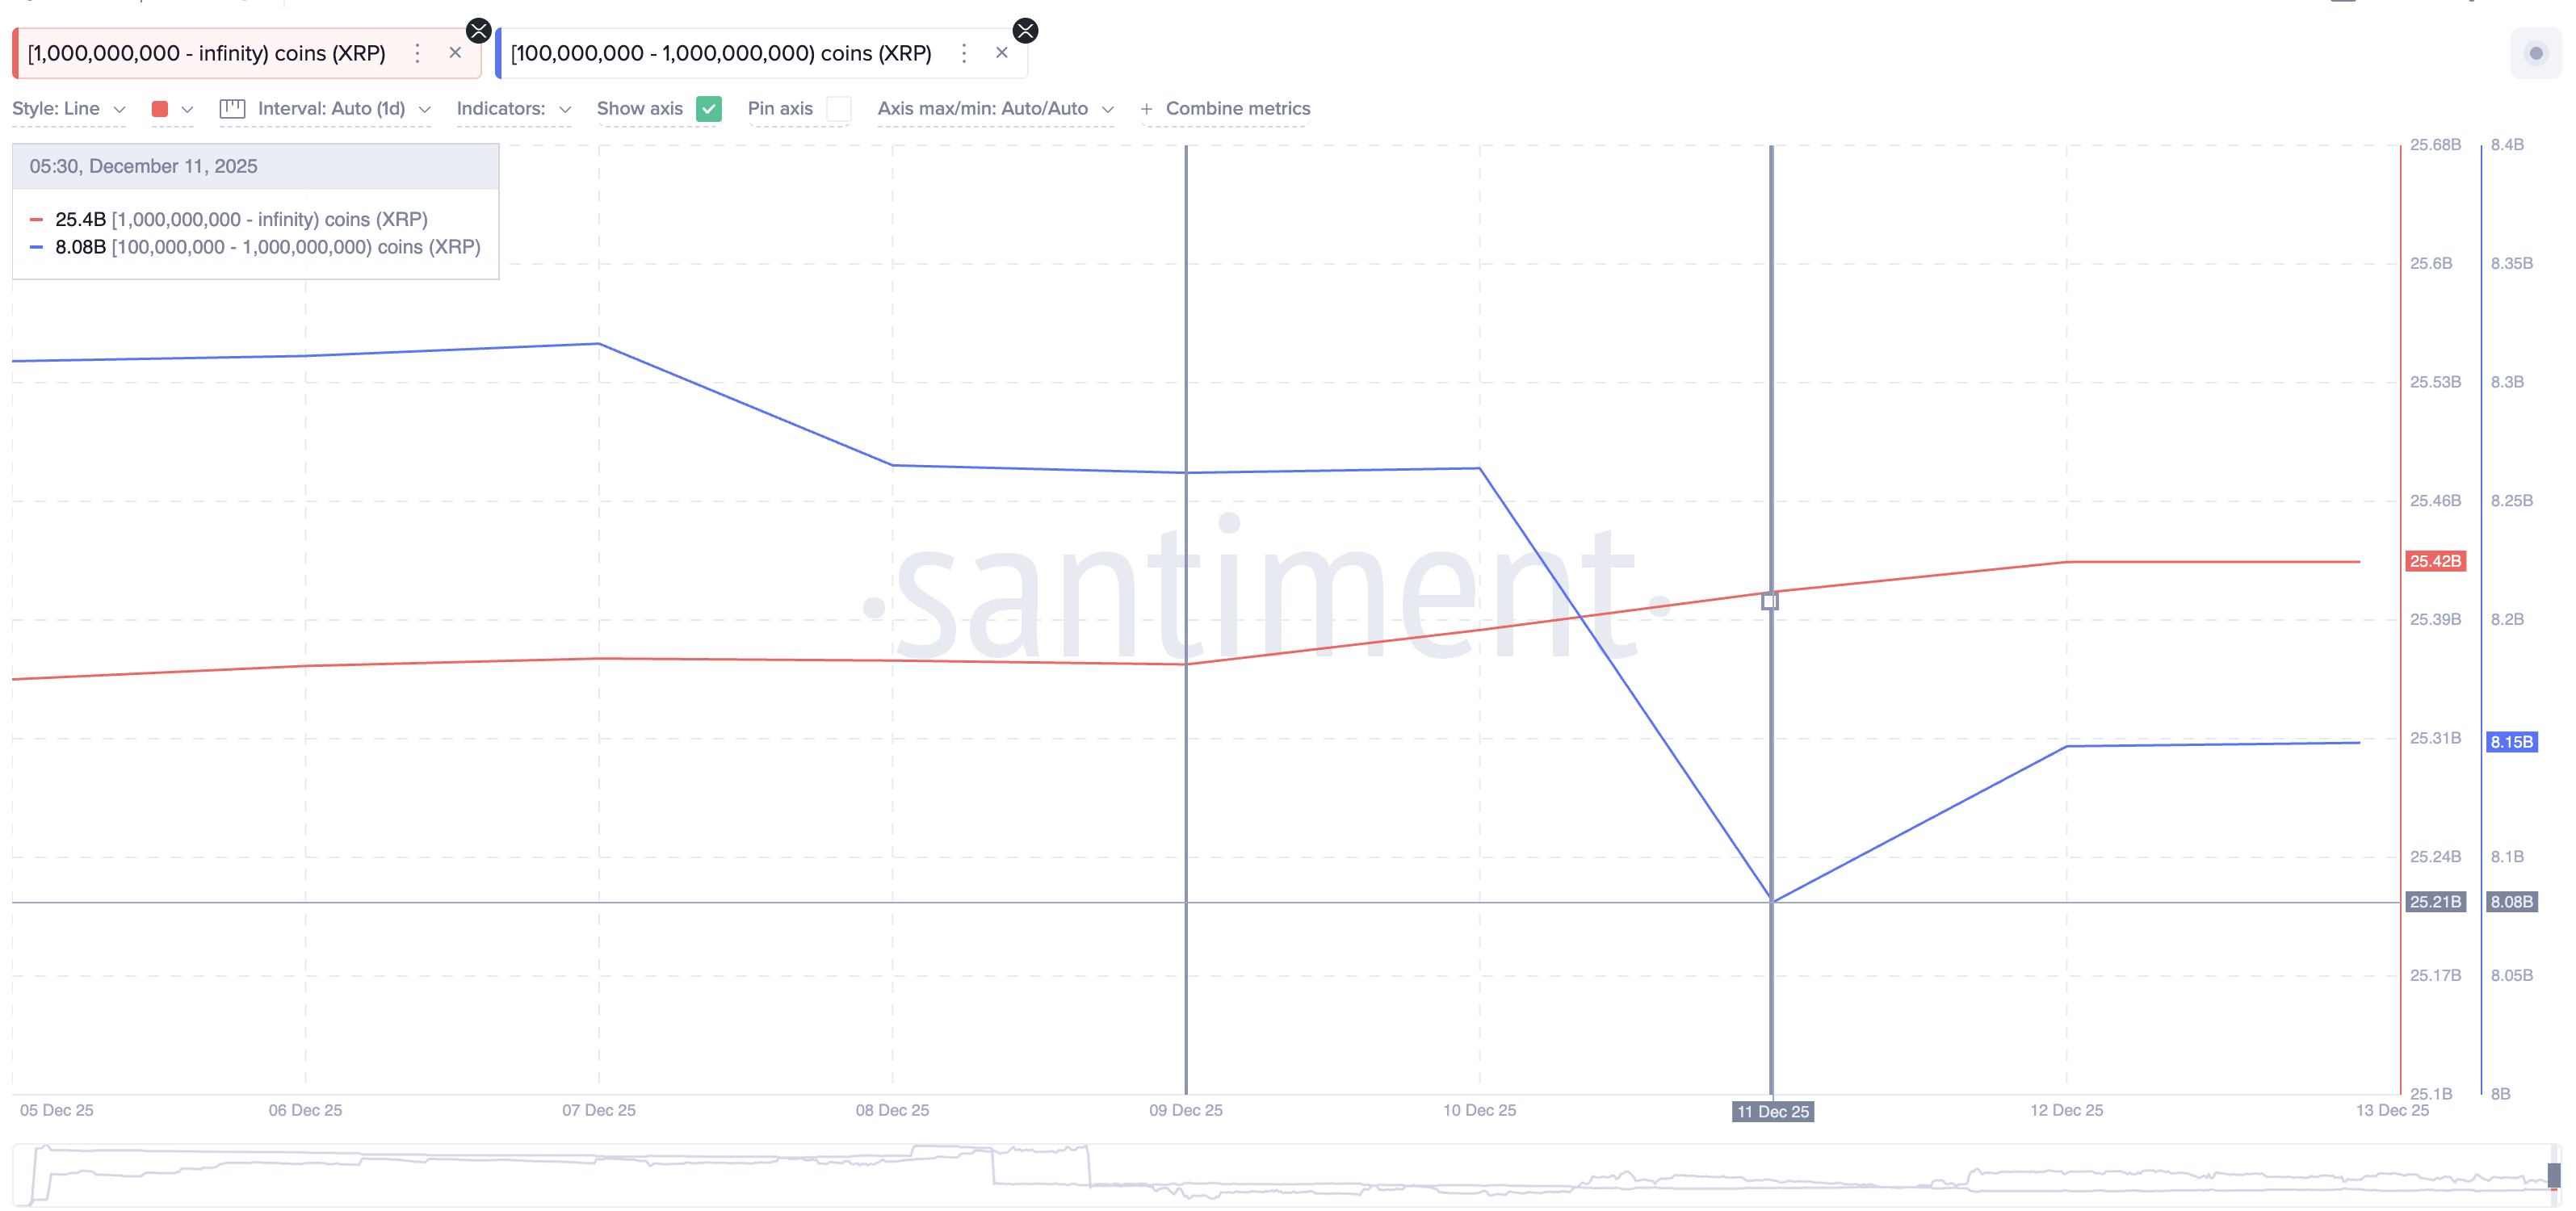
This setup has already triggered a bounce, but what makes it more compelling is whale behavior. The two largest XRP holder groups have already started responding.
Wallets holding more than 1 billion XRP increased their holdings from 25.36 billion on December 9 to 25.42 billion. At the same time, wallets holding between 100 million and 1 billion XRP reversed their selling trend, rising from 8.08 billion on December 11 to 8.15 billion at press time.
In total, these two cohorts added roughly 130 million XRP. At the current price, that equals about $265 million in net accumulation. This confirms that the biggest holders are not just watching the divergence, they are acting on it.
XRP Price Levels That Decide If the Reversal Holds
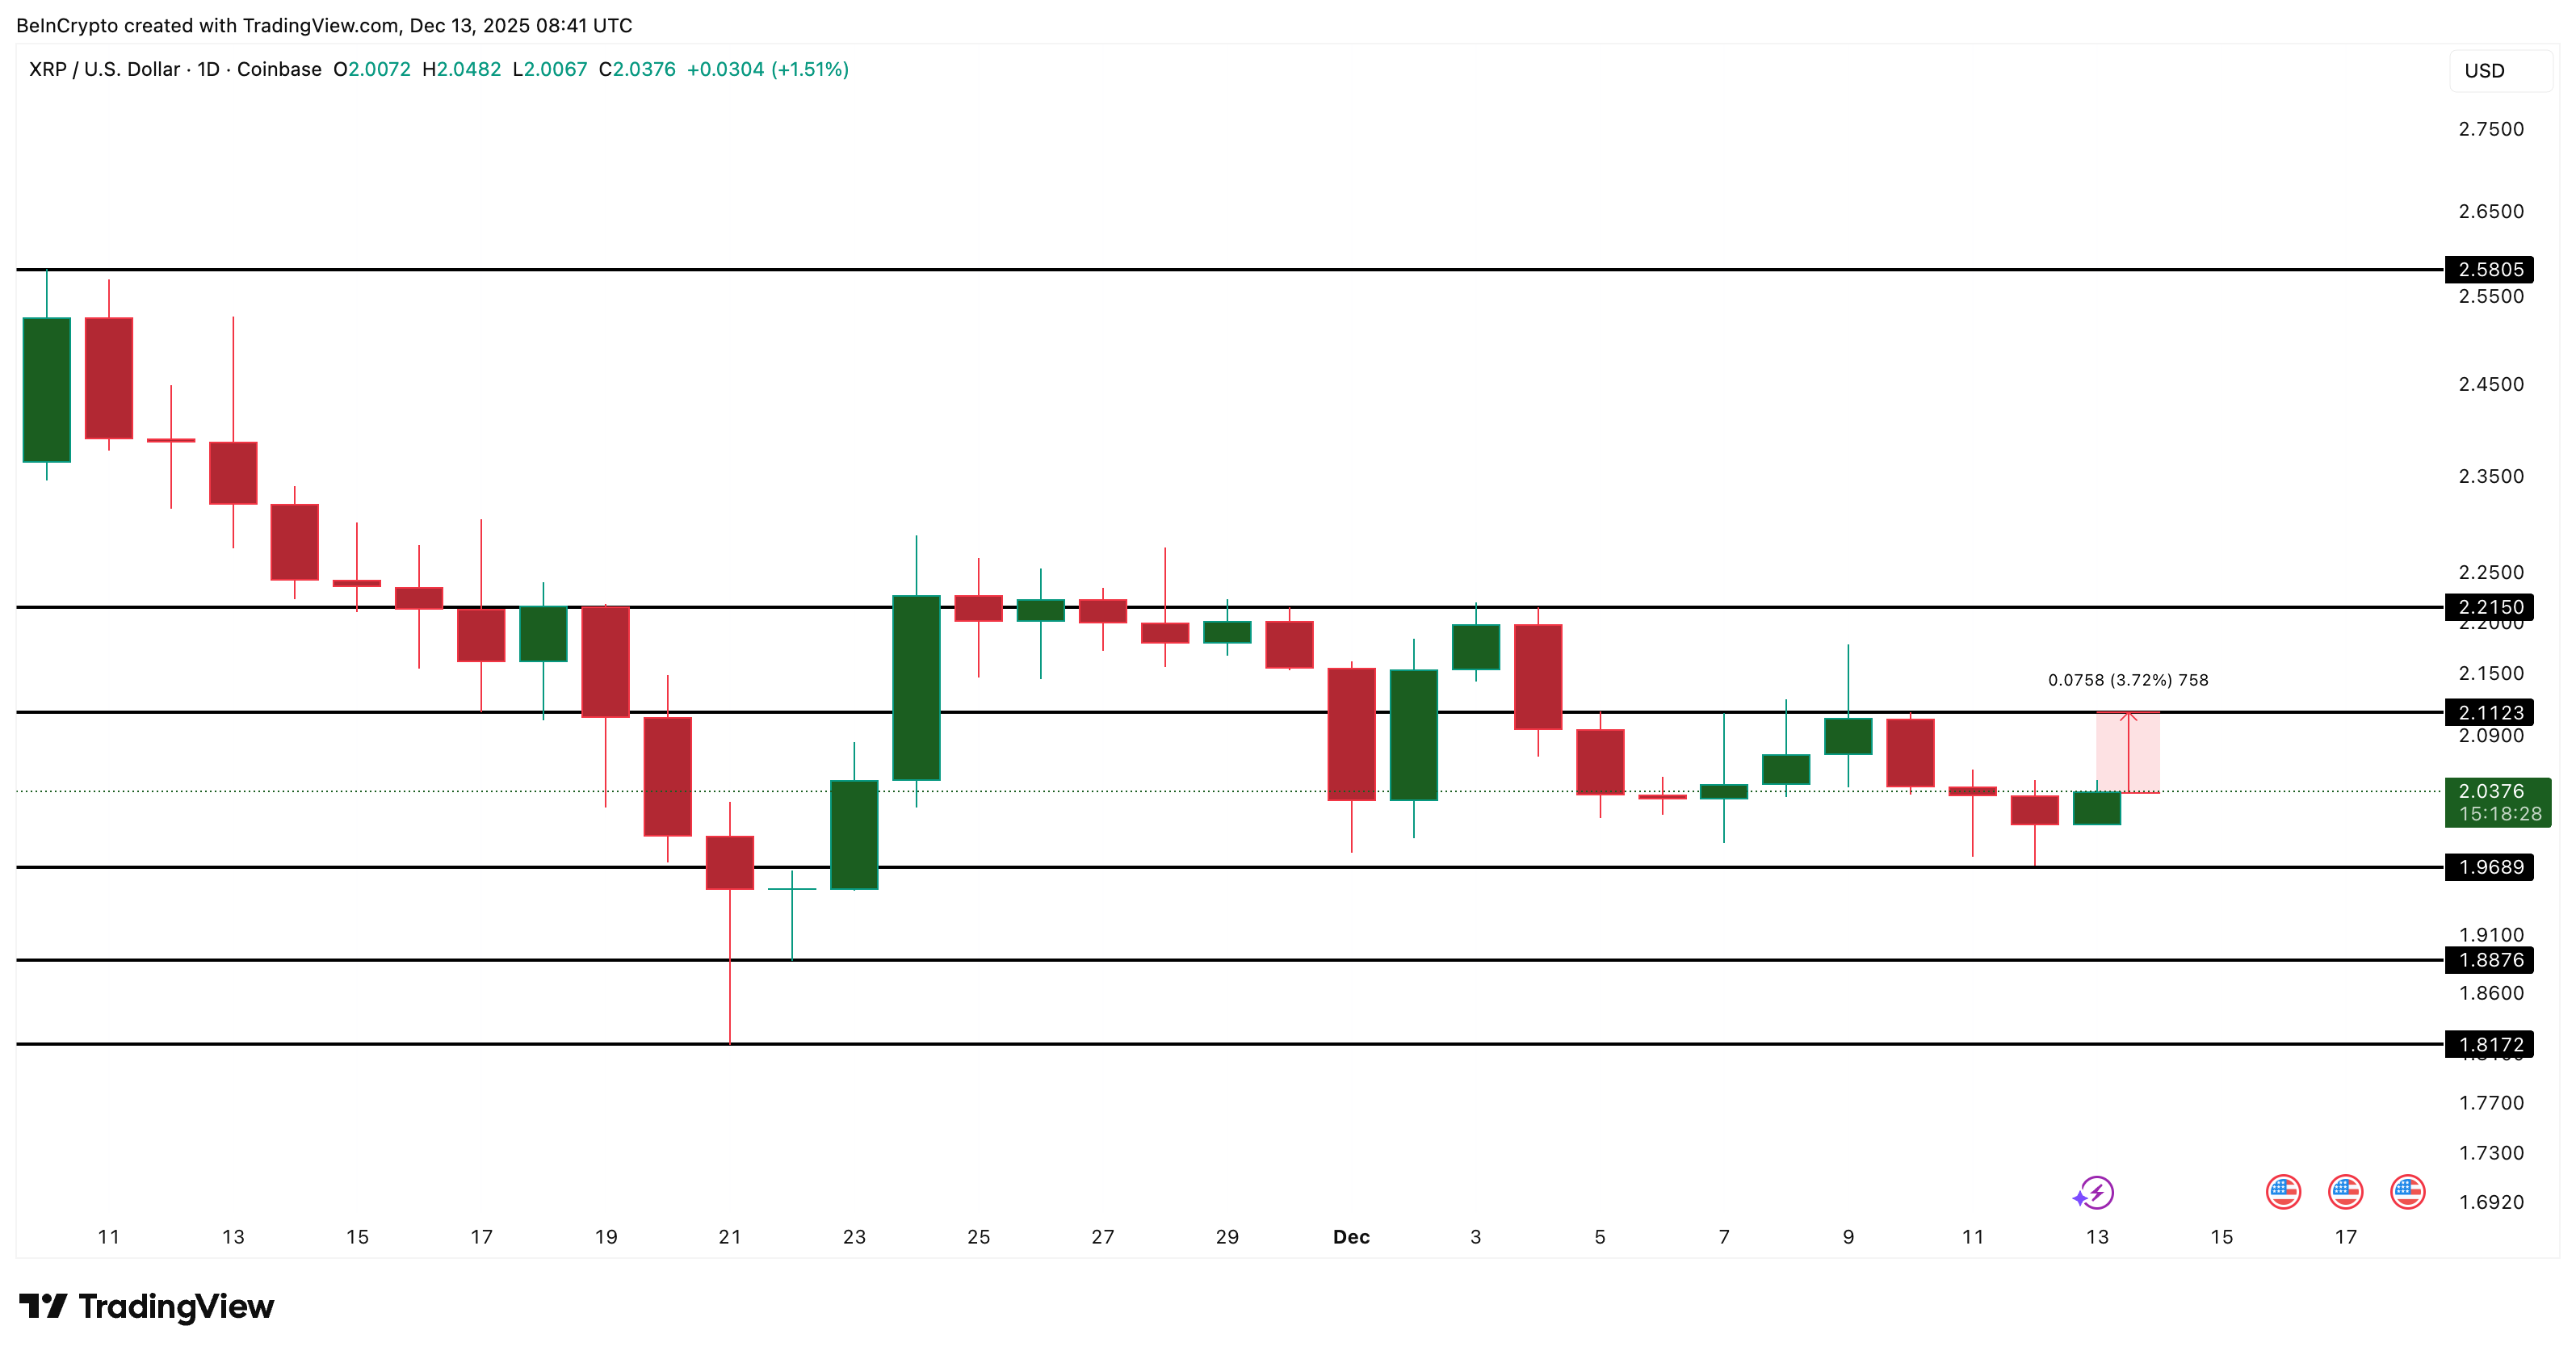
For the bullish divergence to stay valid, the XRP price needs follow-through. The first level that matters is $2.11. A daily close above it would mark a 3.72% move from current levels and confirm that buyers are regaining short-term control. XRP has not held above $2.11 since early December.
If that level breaks, the next resistance sits at $2.21. Only a sustained move above $2.21 would shift the structure bullish and reopen the path toward $2.58 or higher.
On the downside, risk remains clearly defined. If the XRP price falls below $1.96 while RSI weakens, the bullish divergence would be invalidated. That scenario would expose $1.88 first, followed by $1.81 if selling accelerates.
Right now, the setup is constructive but unfinished. Momentum indicators show improvement, and whales have already responded once. For this reversal to fully play out, those large holders need to keep adding support, not just react briefly.
A dispute over revenue sharing has erupted between the community governing DeFi lender Aave and its primary development firm, Aave Labs.
The conflict centers on Aave Labs’ recent decision to integrate CoW Swap as the underlying infrastructure for trading on the protocol’s primary website. The switch replaced ParaSwap, a previous integration that generated referral fees for the Aave DAO treasury.
DAO Members Question Economic Fallout From Interface Update
Governance delegates say the change has cut off a revenue stream of about $200,000 per week. On an annualized basis, they estimate the impact at roughly $10 million, shifting value away from token holders.
The stealth privatization of approximately 10% of Aave DAO's potential revenue, leveraging brand and IPs paid for by the DAO, represents a clear attack on the best interests of the $AAVE Token holders.
Zeller argued that Aave Labs unilaterally altered the economic arrangement without seeking approval from the DAO, which governs the underlying smart contracts.
“Aave Labs, in the pursuit of their own monetization, redirected Aave user volume towards competition. This is unacceptable. By doing this integration, the Aave protocol lost two revenue streams that cannot be easily replaced,” he wrote.
Zeller warned that the lack of communication raises concerns about how future upgrades will be handled.
“It is important to consider the picture as a whole to define if Aave Labs breached its expected fiduciary duty towards the Aave DAO and the AAVE token holders, and what we should expect from V4 in general,” Zeller concluded
Kulechov said Aave Labs bears the costs of engineering and security for the website. He added that the DAO does not subsidize ongoing product development expenses.
Consequently, the firm asserts the right to monetize the interface to ensure its sustainability.
“It’s also perfectly fine for Aave Labs to monetize its products, especially as they don’t touch the protocol itself,” he said.
The development firm also restated Kulechov’s position, acknowledging a failure to communicate the change effectively.
The firm said it switched to CoW Swap to deliver better execution prices and stronger protection against MEV (maximum extractable value), rather than to generate additional revenue.
Pi Coin mengalami tekanan sejak akhir November. Setelah sempat mencapai puncaknya di akhir bulan, harganya turun sekitar 28% dan menghapus hampir seluruh keuntungan sebelumnya. Dalam tujuh hari terakhir saja, Pi Coin melemah sekitar 8,6%, dan selama tiga bulan terakhir, kerugian meningkat lebih dari 40%.
Meski pergerakan lemah, data grafik terbaru menunjukkan ada pola baru yang mulai terbentuk di balik permukaan. Tekanan momentum mulai berubah, sehingga muncul pertanyaan apakah koreksi ini akan segera berhenti. Apakah jeda ini bisa berlanjut menjadi rebound atau justru berbalik arah sepenuhnya? Saatnya kita cari tahu!
Tekanan Momentum Mulai Mereda, tapi Pembeli Masih Ragu
Pada grafik harian, Pi Coin telah membentuk divergensi bullish tersembunyi antara 4 November sampai 11 Desember. Dalam periode ini, harga membentuk higher low sementara Relative Strength Index justru membentuk lower low. RSI mengukur momentum dengan melacak kecepatan beli dan jual. Saat harga bertahan di level lebih tinggi meski momentum melemah, biasanya hal ini menjadi sinyal tekanan jual mulai berkurang.
Ingin dapat wawasan token seperti ini? Daftar Newsletter Harian Crypto Editor Harsh Notariya di sini.
Jenis divergensi seperti ini biasanya muncul di akhir penurunan tajam. Meskipun tidak bisa menjadi tanda konfirmasi pembalikan arah, pola ini sering mendahului upaya rebound ketika penjual mulai kehilangan kontrol.
Meski begitu, momentum saja belum cukup. Chaikin Money Flow, indikator untuk melihat apakah pembeli atau penjual besar mendominasi volume, masih memberi sinyal kehati-hatian. CMF tetap mendekati area pengujian trendline turun (menghubungkan lower low) dan juga masih bergerak di bawah garis nol. Ini menunjukkan bahwa arus dana besar belum mengalir mendukung Pi Coin, setidaknya untuk saat ini.
Sederhananya, tekanan jual memang melemah, tapi para pembeli besar belum benar-benar masuk. Hal ini membuat skenario rebound jadi rapuh. Sampai arus dana mulai membaik, upaya kenaikan kemungkinan masih akan menghadapi resistance. Jika CMF menembus di bawah trendline, maka skenario rebound (bukan pembalikan) untuk koin Pi Network bisa saja benar-benar gagal.
Level Harga Pi Coin yang Menentukan Langkah Selanjutnya
Pada grafik harga PI saat ini, Pi Coin ada di titik keputusan penting. Untuk memperkuat peluang rebound, Pi Coin harus merebut kembali area US$0,222. Jika harga bisa bertahan di atas level ini, artinya ada kenaikan sekitar 7% dan mengindikasikan pembeli mulai mau mempertahankan harga lebih tinggi. Kalau itu terjadi, kemungkinan harga bisa lanjut ke US$0,244 bahkan US$0,253, selama kondisi pasar secara umum stabil.
Hanya pergerakan harga di atas US$0,284 (level tertinggi akhir November) yang bisa menjadi sinyal upaya pembalikan arah. Saat ini, titik itu sepertinya masih cukup jauh tercapai.
Support utama masih berada sedikit di bawah harga sekarang. Zona US$0,203 menjadi sangat krusial. Jika harga harian ditutup di bawah US$0,203, skenario rebound bisa makin lemah sehingga menambah risiko penurunan. Jika level itu jebol, Pi Coin bisa saja kembali menguji area bawah lainnya dan memperpanjang fase koreksi.
Skenario rebound baru bisa semakin kuat jika harga naik bersamaan dengan CMF ikut bergerak naik ke arah nol. Jika tidak ada konfirmasi seperti itu, peluang kenaikan sangat rawan untuk gagal.
Harga Zcash sudah mengalami reli tajam di siklus ini, naik lebih dari 700% dalam tiga bulan, lalu mengalami jeda sehat. Setelah reli kuat sepanjang minggu lalu, harga kini sedang mengalami koreksi, sehingga muncul pertanyaan apakah momentum mulai melemah atau hanya sedang reset sejenak.
Meskipun pergerakan harga jangka pendek terlihat belum pasti, data on-chain dan volume menunjukkan pembeli mungkin masih tenang mengendalikan pasar. Pergerakan selanjutnya tergantung apakah Zcash bisa mengubah fase konsolidasi menjadi kelanjutan tren naik.
Buyer masih kendalikan struktur meski volume mulai turun
Harga Zcash saat ini bergerak dalam pola segitiga yang semakin menyempit, yang menunjukkan keragu-raguan sementara antara pembeli dan penjual, bukan tanda kelemahan yang jelas. Penting juga, harga masih menghormati garis tren naik yang menjadi panduan tren bullish pada siklus kali ini. Selama struktur tersebut terjaga, gambaran besarnya tetap positif.
Perilaku volume menjadi konteks yang penting. Dengan analisis warna volume gaya Wyckoff, bar berwarna biru menandakan aktivitas pembelian, sementara bar kuning dan merah menunjukkan semakin kuatnya penjual.
Walaupun volume pembeli akhir-akhir ini melandai, bar biru masih tetap dominan. Perlambatan serupa juga pernah terjadi setelah 17 Oktober, ketika tekanan beli sempat melemah sebelum Zcash reli lagi lebih dari 300%.
Pelemahan volume saja tidak langsung mengakhiri tren. Selama bar biru masih dominan, reli kemungkinan tetap kuat meskipun terjadi koreksi.
Pembeli Zcash Mengendalikan Pasar | Sumber: TradingView
Ingin dapat wawasan token lain seperti ini? Daftar untuk menerima Newsletter Harian Crypto dari Editor Harsh Notariya di sini.
Data arus spot juga memperkuat gambaran ini. Data spot flow mengikuti apakah koin sedang bergerak masuk atau keluar exchange.
Arus masuk biasanya menandakan potensi aksi jual, sedangkan arus keluar mengisyaratkan akumulasi. Pada 12 Desember, Zcash mencatatkan arus masuk spot sekitar US$14,26 juta, artinya koin masuk ke exchange.
Namun pada 13 Desember, situasi berubah tajam menjadi sekitar US$17,34 juta untuk arus keluar bersih, menandakan koin justru ditarik keluar dari exchange.
Perubahan tersebut sangat penting. Arus keluar dari exchange mengurangi tekanan jual langsung dan biasanya mencerminkan aksi pembeli spot yang masuk saat harga koreksi, bukan justru jual di saat pasar kuat.
Meskipun terkoreksi sekitar 2,5% dalam 24 jam terakhir, Zcash tetap naik sekitar 20% selama sepekan terakhir dan lebih dari 700% selama tiga bulan terakhir. Trennya belum patah. Saat ini sedang konsolidasi.
Level Harga Zcash yang Menentukan Arah Pergerakan Berikutnya
Agar struktur bullish berlanjut, harga Zcash perlu breakout dari pola segitiga tersebut. Level penting yang perlu diperhatikan adalah US$511, atau 24% di atas level saat ini. Penutupan harian yang jelas di atas level ini akan mengonfirmasi sinyal bullish dan menunjukkan kembali dominasi pembeli.
Jika breakout terjadi, target kenaikan pertama ada di sekitar US$549, lalu US$733 yang sebelumnya menjadi batas atas reli di siklus ini. Resistance lebih tinggi ada di sekitar US$850 dan US$1.190, meskipun untuk mencapai itu membutuhkan momentum solid serta dukungan sentimen pasar secara menyeluruh.
Risiko ke bawah tetap jelas. Jika harga Zcash turun di bawah US$430, pola segitiga mulai melemah. Support kuat ada di sekitar US$391, dan jika terjadi penurunan lebih dalam, harga bisa turun ke US$301 jika tekanan pasar semakin besar.
Itaú Unibanco Holding SA, bank swasta terbesar di Amerika Latin, menyarankan klien untuk mengalokasikan hingga 3% portofolio mereka ke Bitcoin untuk tahun 2026.
Bank ini melihat aset kripto tersebut bukan sebagai aset spekulatif, tetapi sebagai lindung nilai terhadap penurunan nilai real Brasil.
Kenapa Itau Ingin Dana Klien di Bitcoin
Dalam catatan strategi, analis di lembaga keuangan yang berbasis di Sao Paulo ini menyebutkan bahwa investor menghadapi dua tantangan sekaligus, yaitu ketidakpastian harga global dan fluktuasi mata uang domestik. Mereka menilai, kondisi seperti ini membutuhkan pendekatan baru untuk membangun portofolio.
Bank ini merekomendasikan proporsi Bitcoin sebesar 1% hingga 3% agar bisa memperoleh imbal hasil yang tidak berkorelasi dengan siklus ekonomi dalam negeri.
“Bitcoin [adalah] aset yang berbeda dengan fixed income, saham tradisional, atau pasar domestik, dengan dinamika, potensi imbal hasil, dan — berkat sifat global serta desentralisasinya — fungsi sebagai lindung nilai terhadap mata uang,” tulis bank tersebut.
Itaú menegaskan bahwa Bitcoin sebaiknya tidak dijadikan aset inti. Sebaliknya, bank merekomendasikan alokasi Bitcoin sebagai pelengkap yang disesuaikan dengan profil risiko investor.
Tujuannya adalah meraih hasil yang tidak terlalu terpengaruh oleh siklus ekonomi domestik dan memberikan perlindungan sebagian terhadap pelemahan nilai mata uang. Selain itu, strategi ini juga menjaga eksposur terhadap potensi kenaikan harga dalam jangka panjang.
Bank ini menunjukkan bahwa korelasi antara Bitcoin dan kelas aset tradisional tergolong rendah. Mereka menilai, alokasi 1% sampai 3% dapat meningkatkan diversifikasi tanpa memperbesar risiko portofolio secara keseluruhan.
Performa Bitcoin vs Aset Tradisional | Sumber: Itau
Pendekatan ini, jelas catatan tersebut, memerlukan sikap moderat, disiplin, dan pandangan jangka panjang, bukan bereaksi pada fluktuasi harga jangka pendek.
“Mencoba melakukan ‘perfect timing’ pada aset seperti Bitcoin atau pasar internasional lain sangat berisiko — dan seringkali malah merugikan,” peringatan dari bank tersebut.
Batas 3% yang diberikan Itaú ini sejajar dengan pedoman paling progresif secara global, sehingga semakin mendekati rekomendasi bank-bank di AS.
Itaú menilai bahwa di dunia dengan siklus ekonomi yang semakin singkat dan guncangan eksternal yang lebih sering, “karakter hibrida” Bitcoin membedakannya dari aset tradisional.
Bank ini menggambarkan aset kripto utama tersebut sebagai bagian dari aset berisiko tinggi dan sekaligus penyimpan nilai global. Mereka berpendapat, kombinasi ini menawarkan daya tahan yang tidak lagi bisa dijamin oleh pasar fixed income.
Commodity Futures Trading Commission (CFTC) diam-diam sedang menyiapkan infrastruktur agar US Treasuries dan aset kripto suatu hari nanti bisa berdampingan dalam satu struktur pasar.
Pada 12 Desember, CFTC menyetujui perluasan cross-margining untuk US Treasuries.
Bagaimana Perintah Baru CFTC Berdampak pada Aset Kripto
“Ekspansi cross-margining kepada pelanggan akan memberikan efisiensi modal yang dapat meningkatkan likuiditas dan ketahanan di US Treasuries, yaitu pasar paling penting di dunia,” ujar Caroline Pham, Acting Chair CFTC, dalam pernyataannya.
Cross-margining memungkinkan perusahaan untuk mengurangi total jaminan dengan mengimbangi posisi yang berkorelasi dalam satu portofolio. Memperluas mekanisme ini dari balance sheet dealer ke pelanggan akhir di Treasuries menandai perubahan besar dalam struktur pasar.
Pelaku pasar melihat kebijakan ini sebagai ujian praktis untuk model risiko. Kerangka seperti ini nantinya juga dapat mendukung portofolio yang berisi Treasuries, dana ter-tokenisasi, dan aset kripto dalam satu ekosistem clearing.
Bagi derivatif kripto yang diperdagangkan di CME, perintah ini bisa berdampak signifikan pada pasar.
Jika Treasuries dan Treasury futures bisa cross-margin dalam skala besar, maka kerangka serupa nantinya bisa mendukung portofolio yang lebih kompleks. Portofolio tersebut dapat mencakup Treasury bill yang ter-tokenisasi serta posisi spot Bitcoin yang menjadi jaminan di Futures Bitcoin dan ETH CME—semuanya diatur dalam margin dan pengendalian risiko yang terpadu.
Sementara itu, waktu penerbitan perintah ini berada di tengah upaya regulasi aset kripto yang lebih luas, yang melibatkan CFTC dan juga Securities and Exchange Commission (SEC).
Kebijakan ini juga sejalan dengan upaya SEC yang parallell pada reformasi struktur pasar dan clearing, saat regulator menilai bagaimana sekuritas ter-tokenisasi dan jaminan digital bisa masuk di sistem penyelesaian dan kustodian yang sudah ada.
Langkah-langkah ini menunjukkan fokus regulator pada efisiensi modal dan manajemen risiko lintas kelas aset yang kini semakin mengaburkan antara pasar tradisional dan digital.
Kategori altcoin Made in USA secara keseluruhan bergerak hampir sideways selama seminggu terakhir, meski volatilitas aset kripto global mulai meningkat. Minimnya pergerakan ini jadi sorotan menjelang Natal, saat likuiditas yang tipis biasanya menampakkan proyek-proyek yang diam-diam membangun tekanan.
Beberapa token berbasis Amerika Serikat kini berada di titik teknikal krusial, di mana pergerakan kecil bisa mengubah tren jangka pendek. Artikel ini mencantumkan tiga altcoin Made in USA yang patut diperhatikan sebelum Natal 2025, karena adanya perbaikan struktur harga, peningkatan risiko breakdown, dan pola teknikal yang berpotensi bergerak tajam ke dua arah.
Cardano (ADA)
Cardano adalah salah satu altcoin Made in USA yang bisa saja jadi perhatian trader menjelang Natal 2025. Kinerjanya turun sekitar 3,5% dalam 24 jam terakhir dan memperpanjang kerugian bulanan menjadi lebih dari 27%.
Upgrade Midnight baru-baru ini gagal mengubah sentimen, sehingga tekanan turun kembali muncul seiring melemahnya pasar secara luas.
Pada grafik harian, Cardano mengalami breakdown dari struktur kelanjutan bearish — pola pole-and-flag bearish. Konsolidasi sebelumnya berakhir di bawah, yang menandakan penjual masih menguasai pasar.
Hal ini tetap membuat proyeksi penurunan harga Cardano tetap aktif, yang berarti masih ada potensi penurunan hampir 39% dari zona breakdown sebelumnya.
Ingin dapat insight token seperti ini?Langganan Newsletter Harian Aset Kripto dari Editor Harsh Notariya di sini.
Level pertama yang kini penting adalah US$0,370. Area tersebut menjadi support kuat dalam beberapa pekan terakhir, namun harga sudah bergerak mendekatinya. Jika penutupan harian terjadi di bawah US$0,370, risiko penurunan bisa makin meningkat dan harga bisa menuju US$0,259, yang sesuai dengan proyeksi bearish penuh.
Agar harga Cardano bisa stabil, tekanan jual harus berkurang di sekitar US$0,370. Untuk membatalkan pola bearish dan memulihkan momentum, Cardano perlu merebut kembali US$0,489, disusul US$0,517. Kedua level tersebut merupakan resistance Fibonacci kunci dan akan menandakan buyer mulai masuk kembali.
Sampai saat itu terjadi, Cardano tetap rentan menjelang Natal, apalagi jika pelemahan kategori Made in USA berlanjut.
Stellar (XLM)
Stellar berada di titik keputusan penting di antara altcoin Made in USA menjelang Natal, ketika pergerakan harga mulai menguji apakah adopsi jangka panjang masih bisa menjaga nilai token dalam jangka pendek.
XLM turun sekitar 2,5% dalam 24 jam terakhir, sehingga penurunan bulanannya mendekati 18%. Sikap hati-hati ini makin jelas saat melihat data adopsi.
Meskipun jumlah holder RWA di Stellar naik tajam dalam sebulan terakhir, total nilai aset di jaringan tersebut justru turun.
Grafik harga semakin menegaskan kondisi tersebut. Antara 3 Desember sampai 9 Desember, Stellar membentuk hidden bearish divergence, di mana harga membentuk lower high sementara RSI membuat higher high. RSI, atau Relative Strength Index, mengukur momentum. semenjak muncul divergence tersebut, XLM terus bergerak turun, sehingga tren turun besar masih tetap dominan.
Level kunci saat ini adalah US$0,231. Zona ini jadi support jangka pendek selama terjadi koreksi akhir-akhir ini. Jika bertahan di atasnya, berarti tekanan jual mulai mereda, terutama saat volume perdagangan Natal bakal menipis. Jika penutupan harian terjadi di bawah US$0,231, maka harga bisa menuju US$0,216 dan risiko pelemahan pun terbuka jika sentimen pasar tetap buruk.
Agar struktur bearish bisa patah, Stellar harus merebut kembali US$0,262. Level ini sudah beberapa kali menahan semua percobaan reli sejak pertengahan November.
Kenaikan di atas level tersebut membutuhkan dorongan sekitar 10% dan akan memberi sinyal bahwa buyer kembali siap mempertahankan harga yang lebih tinggi. Harapan untuk naik ke situ masih ada karena beberapa analis di X melihat XLM menampilkan sinyal beli.
The last time the TD Sequential flashed a buy signal around these levels, Stellar $XLM jumped 95%. pic.twitter.com/KZYIAbOQME
Sampai saat itu, Stellar tetap jadi altcoin Made in USA yang trennya masih perlu diwaspadai, sehingga momen retest support kali ini sangat krusial menjelang Natal.
Litecoin (LTC)
Litecoin menjadi salah satu altcoin Made in USA yang relatif stabil menjelang Natal.
LTC naik sekitar 1,5% dalam sepekan, sehingga menjadi salah satu yang berbeda di antara altcoin Made in USA. Di sisi lain, nilainya masih turun kira-kira 19% selama sebulan terakhir. Kinerja campuran ini sesuai dengan fundamental terbaru. Laporan menunjukkan institusi dan dana telah diam-diam mengakumulasi sekitar 3,7 juta LTC, meskipun minat ritel tetap rendah.
Akumulasi ini belum memberikan kenaikan harga langsung, tapi kondisi ini membantu menjelaskan kenapa Litecoin bisa menghindari penurunan lebih dalam dibandingkan proyek sejenis. Untuk proyek Made in USA, permintaan yang stabil seperti ini jauh lebih penting daripada hype sesaat, apalagi menjelang akhir tahun.
Pada grafik harganya, Litecoin sedang membentuk pola inverse head-and-shoulders yang umumnya bullish. Pola ini menandakan tekanan jual mulai memudar seiring waktu, lalu pembeli perlahan mulai mengambil alih. Pola ini sempat mencoba breakout pada 9 Desember, namun gagal bertahan dan harga kembali konsolidasi, sehingga belum mampu memicu pembalikan tren.
Pola ini masih valid selama Litecoin bertahan di atas US$79,63. Jika turun di bawah level ini, setup-nya malah jadi lemah dan upaya naik jadi tertunda. Penurunan lebih dalam di bawah US$74,72 bakal membatalkan pola sama sekali dan mengarahkan outlook ke tren bearish lanjutan.
Untuk konfirmasi, Litecoin butuh penutupan harian bersih di atas garis neckline sekitar US$87,08. Jika tembus, pola ini bakal kembali aktif dan membuka peluang menuju US$97,95 sebagai target pertama, lalu US$101,69 sebagai target lanjutan dari perhitungan penuh.
Sampai kondisi itu terjadi, Litecoin tetap menjadi proyek (token) berbasis di AS yang berada di titik penentuan, ketika minat institusi yang stabil masih kontras dengan pergerakan harga yang tetap hati-hati menjelang Natal 2025.
Industri perbankan AS kini melancarkan tantangan terkoordinasi terhadap pendekatan Office of the Comptroller of the Currency (OCC). Upaya ini menargetkan upaya regulator tersebut dalam mengintegrasikan perusahaan aset kripto ke dalam sistem perbankan federal.
Pada 12 Desember, OCC memberikan persetujuan bersyarat untuk izin trust nasional kepada lima perusahaan aset digital, termasuk Ripple, Fidelity, Paxos, First National Digital Currency Bank, dan BitGo. Regulator bank ini menegaskan bahwa para pelamar crypto telah melalui “peninjauan ketat” yang sama seperti pemohon izin bank nasional lainnya.
Industri Perbankan AS tantang langkah OCC
Namun, American Bankers Association (ABA) dan Independent Community Bankers of America (ICBA) berpendapat bahwa tindakan OCC menciptakan sistem perbankan dua tingkat.
Inti keberatan mereka adalah bahwa perusahaan fintech dan aset kripto diberikan izin nasional prestisius tanpa memiliki Federal Deposit Insurance Corp. (FDIC) atau memenuhi standar modal dan likuiditas tradisional yang wajib bagi bank layanan penuh.
Kelompok ini menilai struktur seperti ini mendorong terjadinya arbitrase regulasi di tingkat federal.
Dengan mendapatkan izin nasional, perusahaan kripto bisa mendapatkan manfaat dari pengabaian regulasi transmisi uang negara bagian oleh pemerintah federal. Namun pada saat yang sama, mereka menghindari banyak kewajiban kepatuhan yang berlaku untuk institusi penyimpanan berasuransi.
Presiden ABA Rob Nichols mengutarakan bahwa persetujuan semacam ini “mengaburkan batas” tentang apa yang dikategorikan sebagai bank. Ia juga menyebut bahwa pengaburan definisi ini berisiko melemahkan integritas dari izin tersebut.
Menurut pandangannya, perluasan fungsi trust kepada perusahaan yang tidak menjalankan tugas fidusia tradisional menciptakan kelas lembaga yang mirip bank secara nama dan lingkup, tapi tidak mendapat pengawasan setara.
Di sisi lain, kekhawatiran mereka juga bukan hanya soal persaingan.
Kelompok perbankan memperingatkan bahwa konsumen bisa kesulitan membedakan antara bank yang diasuransikan dan institusi trust nasional yang memegang aset kripto dalam jumlah besar tanpa jaminan asuransi.
Mereka menilai OCC belum cukup menjelaskan bagaimana cara mengelola kegagalan entitas semacam itu, terlebih jika institusi tersebut memegang aset digital bernilai miliaran US$ di luar perlindungan tradisional.
ICBA Ingin Pemberian Charter Dihentikan
ICBA juga secara langsung menantang kewenangan hukum OCC untuk menerbitkan izin tersebut.
We oppose the OCC’s conditional approval of five national trust bank charter applications from nonbank fintechs. We have repeatedly said the OCC lacks statutory authority to expand trust powers and that the sudden influx of applications threatens consumers and the financial…
— Independent Community Bankers of America (@ICBA) December 12, 2025
Kelompok itu memfokuskan kritik mereka pada Interpretive Letter No. 1176. Panduan ini memungkinkan bank trust untuk melakukan aktivitas non-fidusia seperti penitipan cadangan stablecoin.
Presiden ICBA Rebeca Romero Rainey menyebut langkah ini sebagai “perubahan kebijakan besar” yang melampaui tujuan historis izin trust nasional.
“Perubahan kebijakan besar OCC di bawah Interpretive Letter #1176 merupakan penyimpangan dari peran perusahaan trust konvensional dan memungkinkan adanya kerangka regulasi yang tidak konsisten, yang mengancam stabilitas keuangan — sehingga lembaga ini harus mengubah arah,” jelas Rainey.
Kelompok ini berargumen bahwa OCC mengizinkan perusahaan fintech non-bank untuk secara efektif meminjam kredibilitas sistem perbankan AS walaupun menghindari “cakupan penuh” regulasi yang dikenakan pada institusi berasuransi.
Dengan mempertimbangkan hal ini, kedua asosiasi dagang tersebut menyerukan penghentian dan pencabutan langsung atas persetujuan yang telah diberikan.
Mereka memperingatkan bahwa kerangka saat ini bisa menghasilkan institusi yang OCC “tidak siap atasi secara tertib.” Menurut mereka, kegagalan semacam ini bisa membuat bank tradisional dan sistem keuangan yang lebih luas menjadi rentan.
Harga XRP telah rebound dari level terendah baru-baru ini, naik hampir 4% dari titik terendah kemarin dan stabil setelah koreksi ringan. Walaupun tren secara umum masih hati-hati, sebuah metrik baru menunjukkan bahwa tekanan turun mulai mereda.
Dengan penerbit XRP belakangan ini semakin dekat mendapatkan status perbankan teregulasi, kini sorotan bergeser pada apakah para holder besar akan terus masuk dan mengonfirmasi perubahan tren yang nyata.
Bullish Divergence Terbentuk saat Crypto Whale Terbesar Mulai Menambah Kepemilikan
Pada grafik harian, harga XRP menunjukkan divergensi bullish antara 1 Desember dan 12 Desember. Pada periode ini, harga membentuk lower low, sementara Relative Strength Index (RSI) membentuk higher low. RSI mengukur momentum, dan pola ini biasanya muncul ketika tekanan jual mulai melemah sebelum terjadi rebound.
Ingin insight token seperti ini? Daftar Newsletter Harian Crypto dari Editor Harsh Notariya di sini.
Setup ini telah memicu terjadinya bounce, tapi yang membuatnya semakin menarik adalah perilaku whale. Dua klaster holder XRP terbesar sudah mulai merespons.
Wallet dengan lebih dari 1 miliar XRP menambah kepemilikan dari 25,36 miliar pada 9 Desember naik menjadi 25,42 miliar. Pada saat yang sama, wallet dengan saldo antara 100 juta sampai 1 miliar XRP membalikkan tren jual, naik dari 8,08 miliar pada 11 Desember ke 8,15 miliar pada saat publikasi.
Secara total, dua klaster ini menambah sekitar 130 juta XRP. Dengan harga saat ini, nilainya setara sekitar US$265 juta arus bersih akumulasi. Hal ini membuktikan bahwa para holder terbesar tidak hanya memperhatikan divergensi ini, mereka juga mengambil tindakan nyata.
Level Harga XRP yang Menentukan Apakah Pembalikan Tren Bertahan
Agar divergensi bullish ini tetap valid, harga XRP butuh kelanjutan reli. Level pertama yang penting adalah US$2,11. Penutupan harian di atas level ini akan menandai kenaikan 3,72% dari level saat ini dan mengonfirmasi bahwa pembeli mulai menguasai pasar jangka pendek. XRP belum pernah bertahan di atas US$2,11 sejak awal Desember.
Jika level itu berhasil ditembus, resistance berikutnya berada di US$2,21. Hanya pergerakan berkelanjutan di atas US$2,21 yang akan mengubah struktur jadi bullish dan membuka peluang ke US$2,58 atau lebih tinggi.
Dari sisi bawah, risiko terdefinisi dengan jelas. Jika harga XRP jatuh di bawah US$1,96 sementara RSI melemah, divergensi bullish-nya akan gugur. Skenario ini akan membawa harga ke US$1,88 lebih dulu, lalu ke US$1,81 jika tekanan jual meningkat.
Untuk saat ini, setup-nya memang konstruktif tapi belum selesai. Indikator momentum menunjukkan perbaikan dan whale sudah satu kali merespons situasi ini. Supaya reversal benar-benar terjadi, holder besar perlu terus memberi dukungan, bukan hanya bereaksi sejenak.
Sebuah perselisihan mengenai pembagian pendapatan telah terjadi antara komunitas pengelola Aave, platform DeFi lender, dengan perusahaan pengembangan utamanya, Aave Labs.
Konflik ini berpusat pada keputusan terbaru Aave Labs yang mengintegrasikan CoW Swap sebagai infrastruktur utama untuk trading di situs web utama protokol tersebut. Perubahan ini menggantikan ParaSwap, integrasi sebelumnya yang menghasilkan referral fee untuk kas Aave DAO.
Anggota DAO pertanyakan dampak ekonomi akibat update antarmuka
Para delegasi governance menyatakan, perubahan ini telah memutus satu arus pendapatan sekitar US$200.000 per minggu. Jika dihitung secara tahunan, mereka memperkirakan dampaknya sekitar US$10.000.000, sehingga nilai bergeser dari para holder token.
The stealth privatization of approximately 10% of Aave DAO's potential revenue, leveraging brand and IPs paid for by the DAO, represents a clear attack on the best interests of the $AAVE Token holders.
Zeller berpendapat bahwa Aave Labs secara sepihak mengubah perjanjian ekonomi tanpa meminta persetujuan dari DAO, yang berwenang atas smart contract utama.
“Aave Labs, demi monetisasi mereka sendiri, mengarahkan volume pengguna Aave ke kompetitor. Ini tidak bisa diterima. Lewat integrasi ini, protokol Aave kehilangan dua arus pendapatan yang sulit untuk diganti,” tulisnya.
Zeller memperingatkan bahwa kurangnya komunikasi ini menimbulkan kekhawatiran tentang bagaimana update di masa depan akan dijalankan.
Ia juga menyoroti upgrade V4 yang akan segera hadir, dan mempertanyakan apakah fitur “aksesori” lain juga akan dikeluarkan dari wewenang DAO.
“Penting untuk melihat gambaran besarnya guna menentukan apakah Aave Labs telah melanggar kewajiban fidusia mereka terhadap Aave DAO dan para holder token AAVE, serta apa yang seharusnya bisa kita harapkan dari V4 secara umum,” pungkas Zeller
Kulechov berpendapat bahwa fee dari ParaSwap sebelumnya hanyalah “surplus diskresi” dan bukan fee protokol yang diwajibkan.
“Itu tidak pernah menjadi switch fee, itu surplus yang kami donasikan ke DAO,” tuturnya.
Ia juga menegaskan ada perbedaan jelas antara protokol Aave, smart contract decentralized yang diatur DAO, dan tampilan antarmuka depan. Ia menggambarkan antarmuka tersebut sebagai produk privat yang dibiayai dan dipelihara oleh Aave Labs.
Kulechov mengungkapkan Aave Labs yang menanggung biaya engineering dan keamanan untuk situs web. Ia menambahkan, DAO tidak mensubsidi biaya pengembangan produk yang berjalan.
Oleh karena itu, perusahaan menegaskan hak untuk melakukan monetisasi pada antarmuka demi menjaga keberlanjutannya.
“Sangat wajar jika Aave Labs melakukan monetisasi atas produknya, apalagi karena mereka tidak menyentuh protokol itu sendiri,” terang dia.
Perusahaan pengembang itu juga menegaskan kembali posisi Kulechov dan mengakui adanya kekurangan dalam komunikasi soal perubahan ini.
Perusahaan mengatakan mereka beralih ke CoW Swap untuk memberikan harga eksekusi yang lebih baik dan perlindungan yang lebih kuat terhadap MEV (maximum extractable value), bukan untuk memperoleh pendapatan tambahan.
With the rapid adoption of true wireless earbuds across the continent, compact audio devices became a big part of everyday life in Europe, but at the same time, this increased the chances of losing them even more. Xiaomi’s Redmi Buds, Xiaomi Buds, and their POCO-branded equivalents-sold as Xiaomi T series globally-are among the widely used ones within the European Economic Area, where its small size and cable-free design can become a practical disadvantage.
Understanding what can and cannot be done in case of a loss will help manage expectations and take the right technical steps.
Understanding how to locate Xiaomi earbuds
Before recovery attempts, it is critical to acknowledge the technical limitations of wireless earbuds. Unlike smartphones, Xiaomi earbuds do not include any GPS modules or cellular connectivity. Location detection must therefore be indirect and depends entirely on Bluetooth signals and software ecosystems.
Modern Xiaomi earbuds employ Bluetooth Low Energy, usually based on Bluetooth 5.2 or 5.3, or newer standards. When an earbud is outside its charging case and has some battery power, it periodically broadcasts a signal. Smartphones can estimate proximity using the signal strength values, commonly referred to as RSSI. This method will only work for short distances, typically less than ten meters, and thick walls, commonly found in European buildings, will weaken signals considerably.
This normally means that when the earbuds are inside the charging case and the lid is closed, Bluetooth transmission is usually disabled at the hardware level. In this state, digital tracking isn’t possible. Of course, once the battery is completely dead, all signal transmission stops, making the recovery a purely physical search.
Using Effective Xiaomi & Google Software Tools
Xiami, on their part, offers simple recovery capabilities via the official earbuds management application. Thus, the “Find your earphones” feature can only be helpful in quiet indoor environments like homes or offices because it allows users to initiate a loud ringing from the earbuds provided they are currently connected to the phone.
The application also logs the last known location where the Bluetooth connection was active. This is static information and does not update if, at some point afterward, the earbuds have moved. It is rather to be used as a reference point than as live data from tracking.
Newer Xiaomi earbuds that support Google Fast Pair are able to integrate with Google’s “Find My Device” network. If an Android device is nearby an, in a sense, misplaced earbud, it may anonymously detect the Bluetooth signal and report an approximate location back to the owner. This can be very helpful if your earbuds go missing in a busy urban area, though the earbuds do need to have some juice left in them. A completely dead earbud cannot be found via this network.
Practical steps toward recovery in Europe
Timing is most crucial when the earbuds are lost. When the device still has power, taking action as soon as possible improves the possibility of recovering these devices.
Check the last known location of the Xiaomi Earbuds in the app or using Google Find My Device. Return to that area with Bluetooth turned on. In indoor environments, lowering background noise and activating the sound alert narrows down their location. Third-party Bluetooth scanner apps may help advanced users by showing how the signal strength changes as a person walks through a space.
If the loss took place in a public transport or shared area, contact the local lost-and-found services. European transport operators often list small electronic items only descriptively without serial number, but having the purchase documentation may help.
Replacement options and cost considerations
If recovery is unsuccessful, replacement becomes the next decision point. With the exception of very few cases, officially individual earbuds or charging cases are hardly sold as stock items in official Xiaomi channels in Europe. Some replacements may be offered for a fee by authorized service centers, with prices often approaching that of a new set, especially in the case of budget models.
IndividualIssues with Third-Party Sellers
Some third-party sellers sell single earbuds, mostly sourced from outside the EU. Although this offers cost savings for premium models, shipping times and possible warranty limitations should be carefully weighted. For more affordable Redmi Buds variants, buying a new pair is often the most convenient and pragmatic approach.
After having replaced a single earbud, users need to make a full reset and re-pair it so that the new and existing parts will be able to synchronize appropriately. Firmware updates via the official app are highly recommended for stable performance.
Future preventive measures
Sometimes, prevention is better than recovery. It’s highly recommended to enable Google Find My Device at setup. Protective cases with keyrings attached or an external Bluetooth tracker attached inside the charging case can greatly reduce most risks. Doing periodic system app updates through trusted sources such as HyperOSUpdates.com or using tools like the MemeOS Enhancer application will let one have the bleeding-edge features added into the ecosystem and all stability enhancements.
Losing European Xiaomi earbuds is a manageable situation when one understands the real technical and logistic facts. Recovery tools based on Bluetooth can work within conditions, and there are no guarantees provided. For premium segment models, the replacement of a single module might be economically reasonable; in entry-level ones, it is often more advisable to replace them completely. As in most cases, the best strategy remains one of proactive prevention, which combines software activation with physical accessories and informed habits of use.
Xiaomi has also stepped up the pace of its plans for home appliances globally by investing in a brand new massive production line in China, which is set to increase efficiency exponentially. Now that Xiaomi/Mijia refrigerators, air conditioners, and washing machines are rolling out from China into even more countries worldwide, Xiaomi has introduced a new generation factory that is optimized for speed, efficiency, and scalability.
The establishment of a new production base for Xiaomi home appliances
In order to cope with the increasing global demand, Xiaomi has launched a factory that is specifically used for making home appliances – Wuhan Xiaomi Smart Home Appliance Factory. This is the very first factory Xiaomi has set up that specifically focuses on producing large home appliances, as most of Xiaomi’s previous products are smartphones, televisions, etc.
In the words of Lu Weibing, Partner, and President of Xiaomi Group, as well as the CEO of the Xiaomi brand, “Phase one of our factory has been completed, and we are already operating at full capacity.” This means that the factory is currently operating at full capacity with optimized production lines for efficiency. This is a demonstration of the commitment by Xiaomi to vertical integration and intelligent manufacturing practices.
The Wuhan factory is significant because of the rate at which it produces its goods. It takes only 6.5 seconds to produce a unit of the Mi Home Central Air Conditioner Pro Dual Fan Wheel.
The factory now has a total of six professional production lines, which include the entire assembly process of air conditioners for residential and central air-conditioning systems. This helps Xiaomi increase production speed with minimum human labor inputs, ensuring high standards of quality control. The initial production of air conditioners from this factory is now readied for commercial launch.
Xiaomi’s Third Mega Factory & Strategic Milestone
The Wuhan Smart Home Appliance Factory is the third giant smart factory established by Xiaomi, after its state-of-the-art smartphone factory and the automotive super factory. But this particular factory holds a special strategic place because it is Xiaomi’s maiden giant factory only for home appliances.
Xiaomi is making a bold statement with a significant investment in appliance manufacturing, which means that the brand no longer considers smart home devices a secondary product line to the smartphones. This is because Xiaomi is now making smart home devices a fundamental component of the overall expansion strategy, which is linked to Xiaomi HyperConnect and the AIoT ecosystem.
Fast construction: a paradigm of efficiency established
Other than the rate of production, the construction schedule of the Wuhan plant has been of some interest. The plant is situated in the East Lake Technology Development Zone, with the foundation stone being laid on November 26 of last year. The construction started within three months of the signed contract, with the main structure completed on January 20, 2025.
The completion of a huge such industrial project within such a short period has set a certain benchmark within Xiaomi, as far as project completion is concerned. It clearly shows that Xiaomi is applying a certain efficiency technique from product development to infrastructure development.
Xiaomi may make another daring naming move by bypassing the Xiaomi 19 series and going straight for the Xiaomi 20 lineup this time, as reported lately. It would echo Apple’s supposedly bypassing the iPhone 19 model to commemorate the 20th-anniversary release of iPhone with the iPhone 20 series in 2027. Xiaomi had already done a comparable naming revision with the Xiaomi 17 Pro Max with a move for apple’s “Pro Max” pattern and skipping 16 series. Xiaomi 17 Pro Max launch already indicated that Xiaomi will not hesitate to make a revision.
Why Xiaomi might bypass “19”
Skipping the naming convention of Xiaomi 19 is no cult decision. In the Chinese context, 19 has no unique cultural meaning, but skipping it may find marketing synchronism with Apple. As Apple’s 2027 series will commemorate two decades of iPhone life, Xiaomi might find a mirage of linking its flagship naming with Apple’s to validate its high-end standing in the international market.
This was also a repetition of what was seen in 2017 after Apple bypassed the iPhone 9 release and came out with the iPhone X during its 10th-anniversary celebrations. In a similar way, Xiaomi may utilize the name Xiaomi 20 to release innovative technologies like camera systems integrated with AI, HyperOS 5, or Snapdragon 8 Elite 7th-generation processors.
It was a symbolic move for Xiaomi’s second decade.
If this rumor holds water, Xiaomi’s Xiaomi 20 series will come out somewhere around 2027, which will open a new page for the smartphone. Aligning itself numerically with its counterpart Apple, Xiaomi strengthens its identity as a world-class smartphone brand that sets trends, not emulates.
This naming convergence also benefits marketing for Xiaomi, allowing users to compare the iPhone 20 side by side with Xiaomi 20 more easily — a subtle but potent positional stroke in smartphone marketbrand rivalry.